
Light-Induced Charge Separation in Photosystem I from Different Biological Species Characterized by Multifrequency Electron Paramagnetic Resonance Spectroscopy
 and
and
Abstract
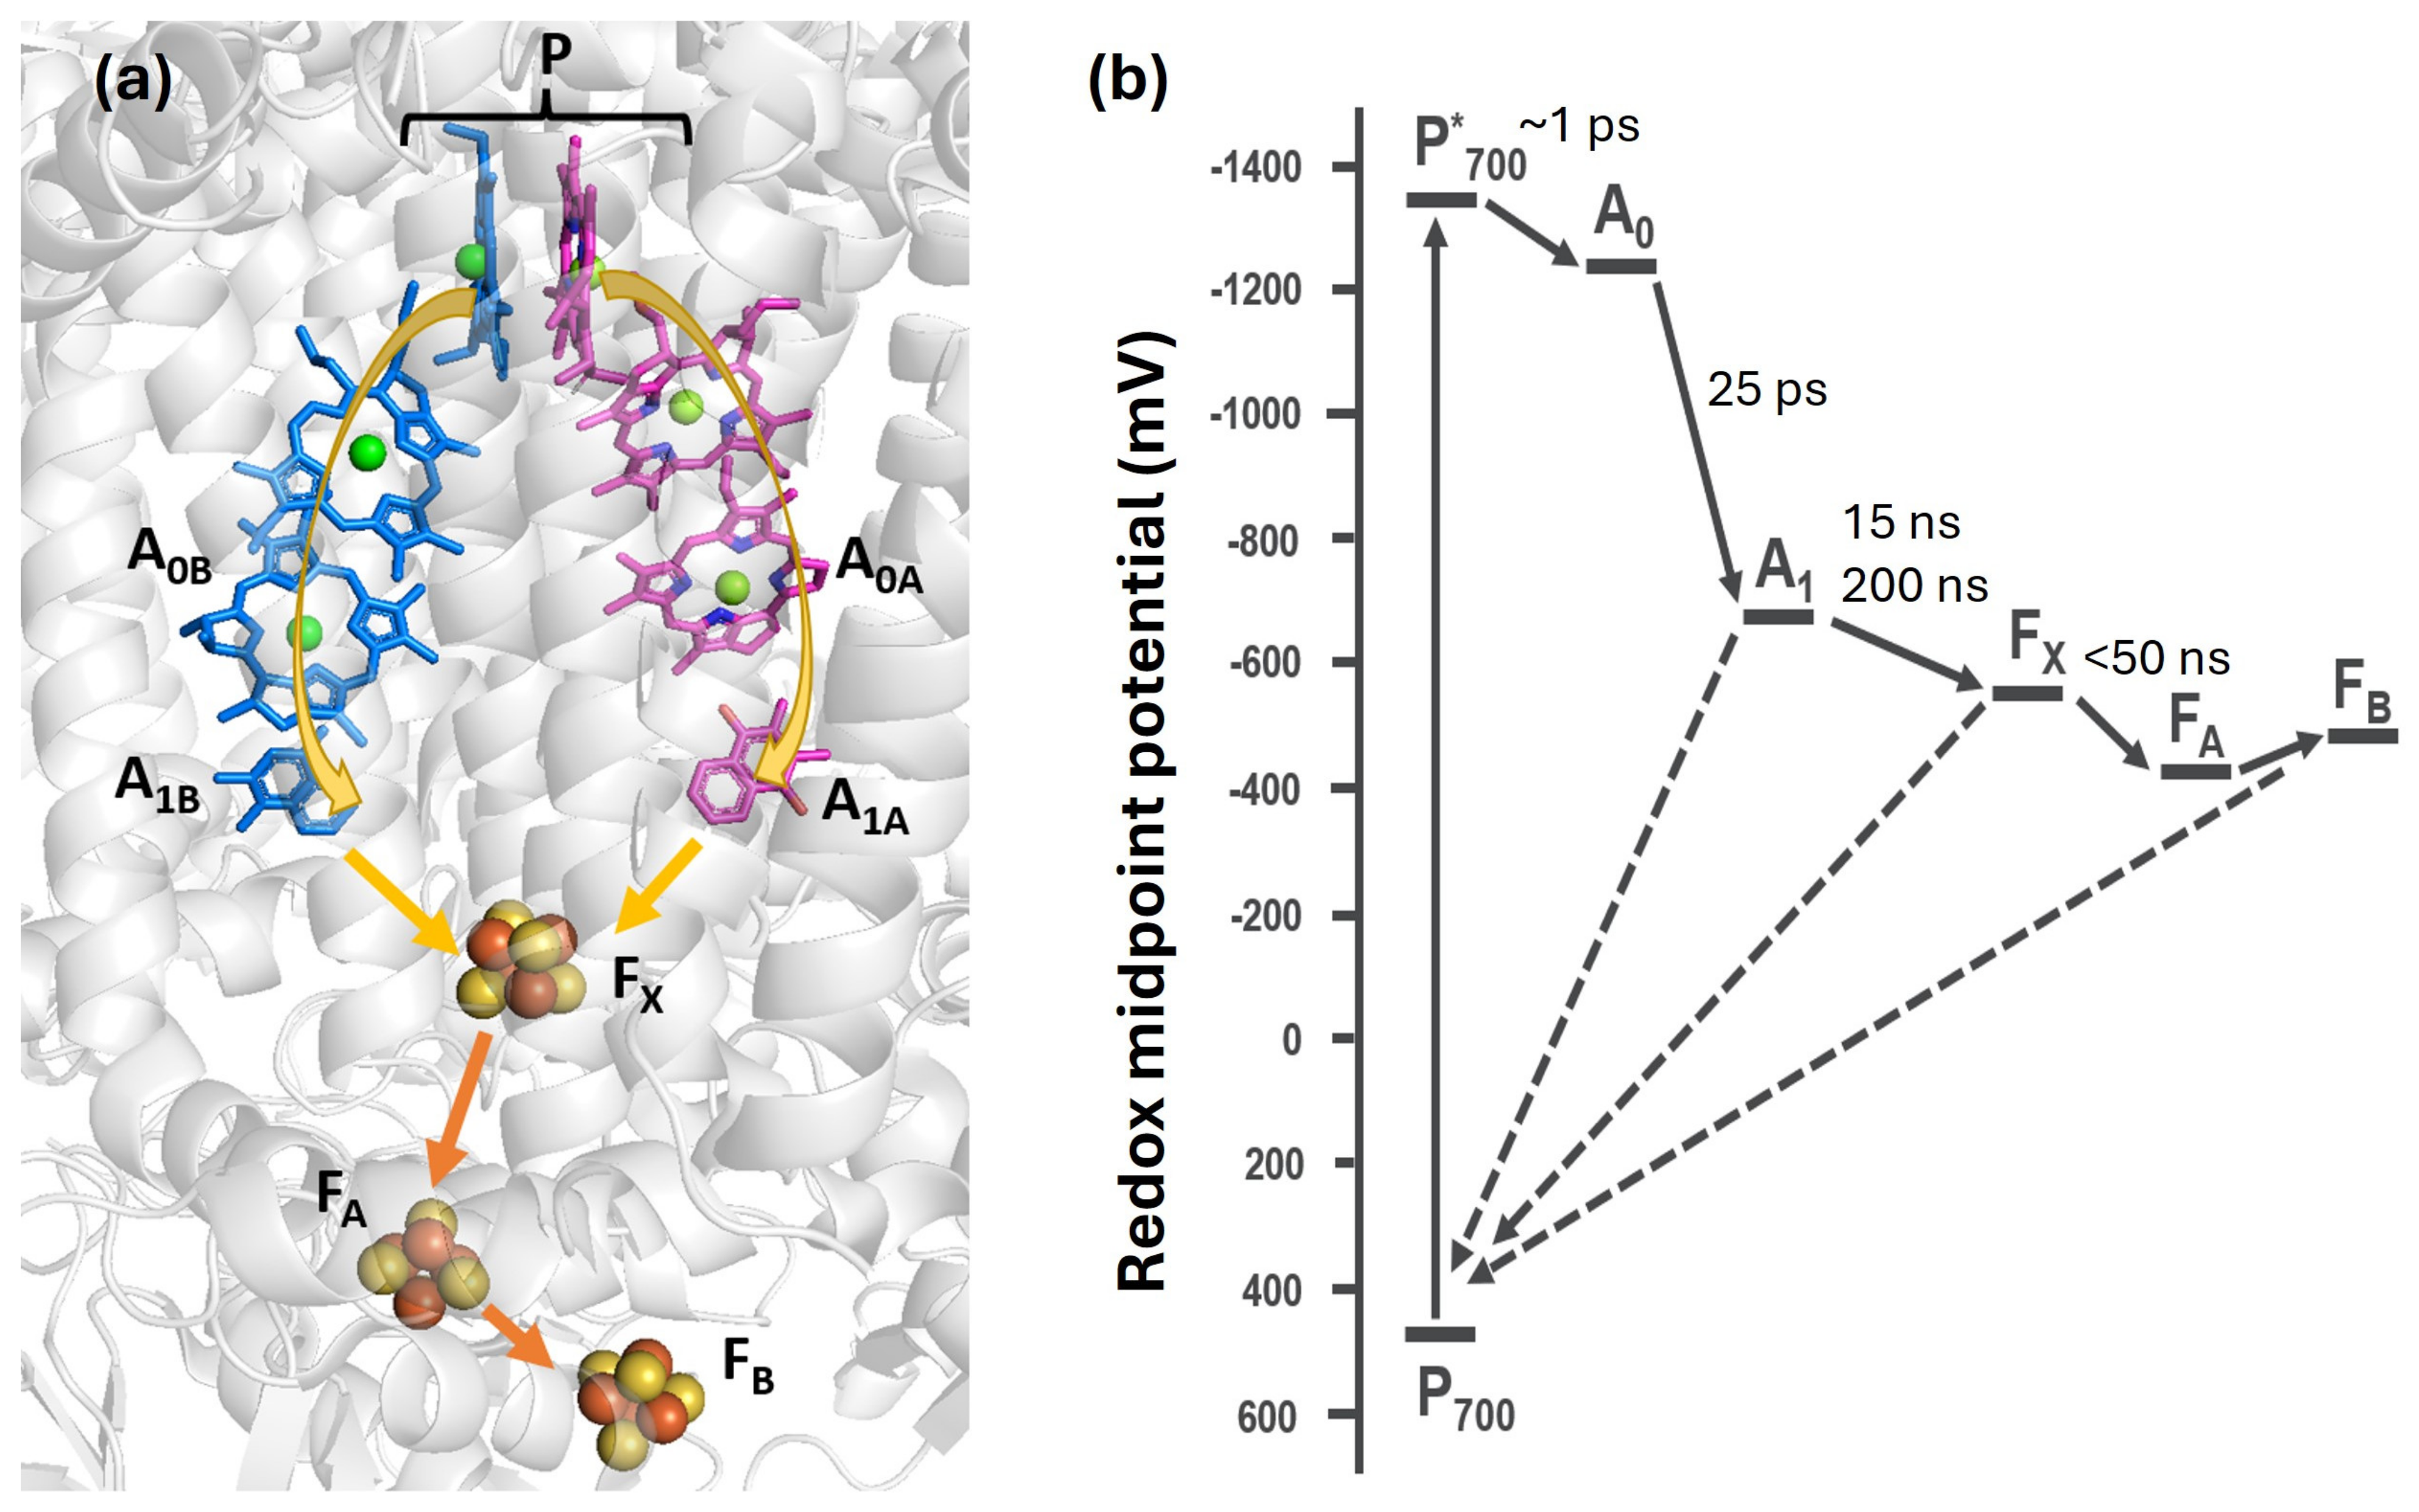
:1. Introduction
2. Results and Discussion
2.1. Spin Correlated Radical Pair (SCRP)
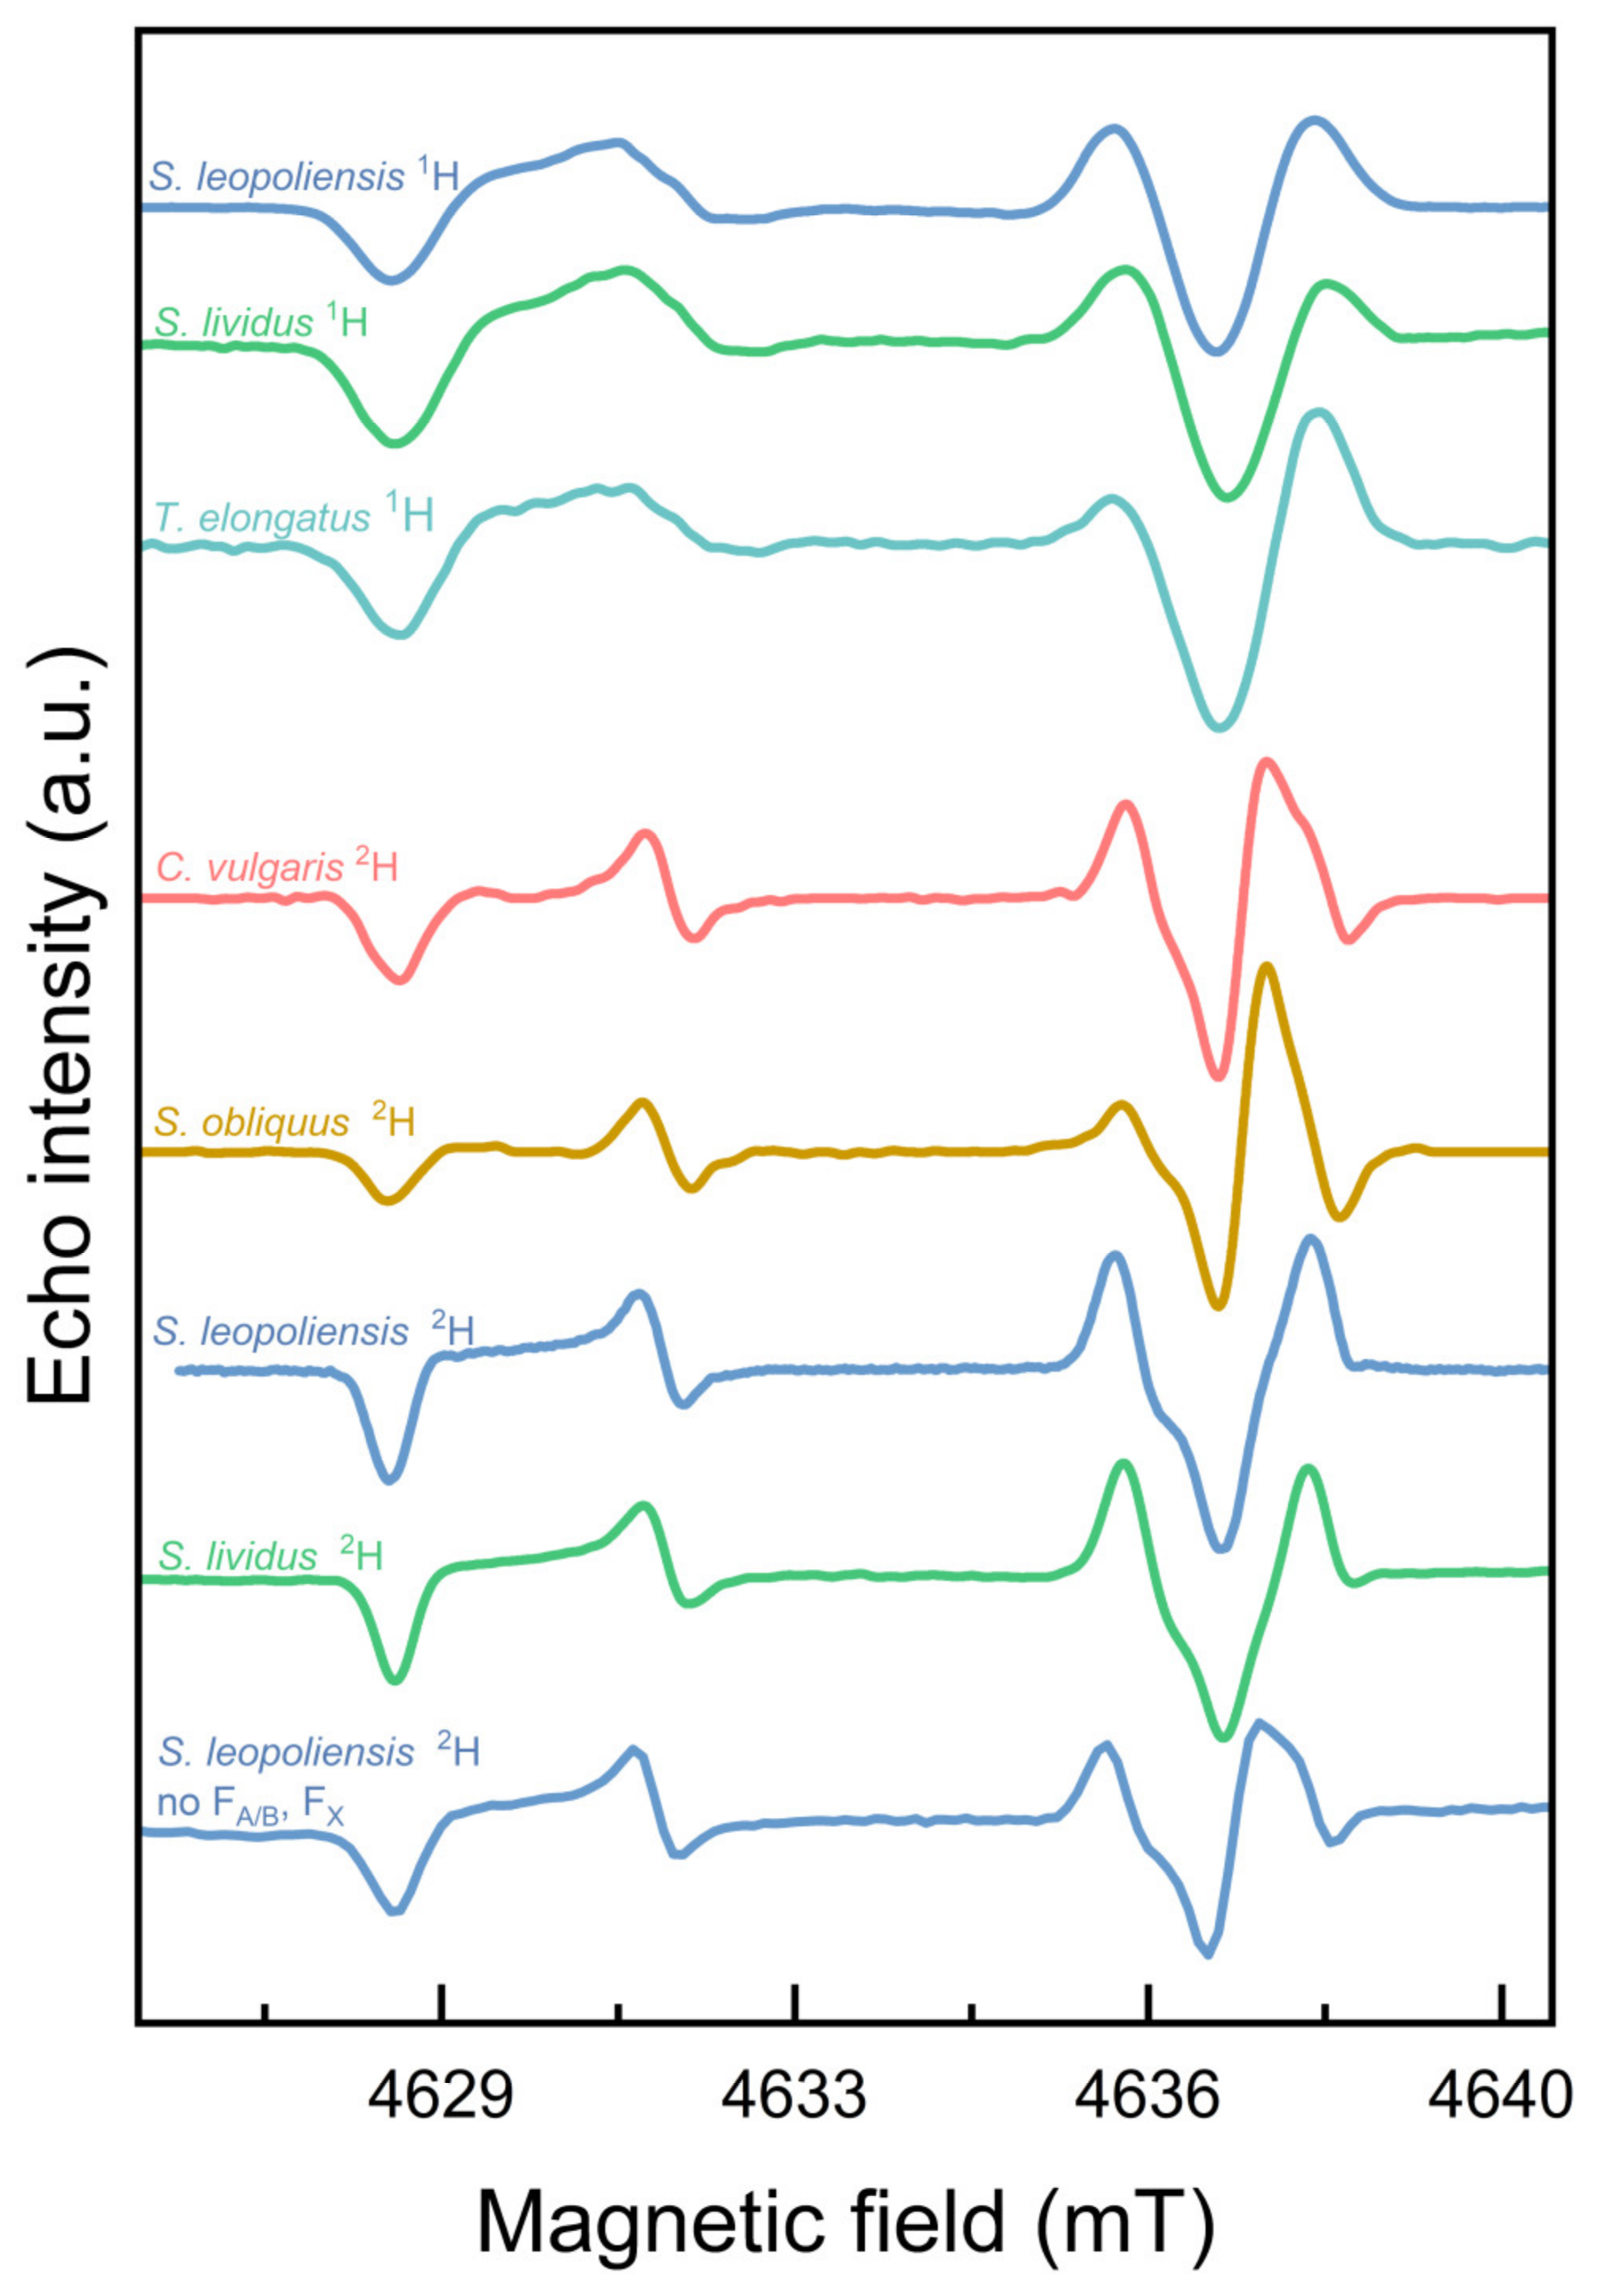
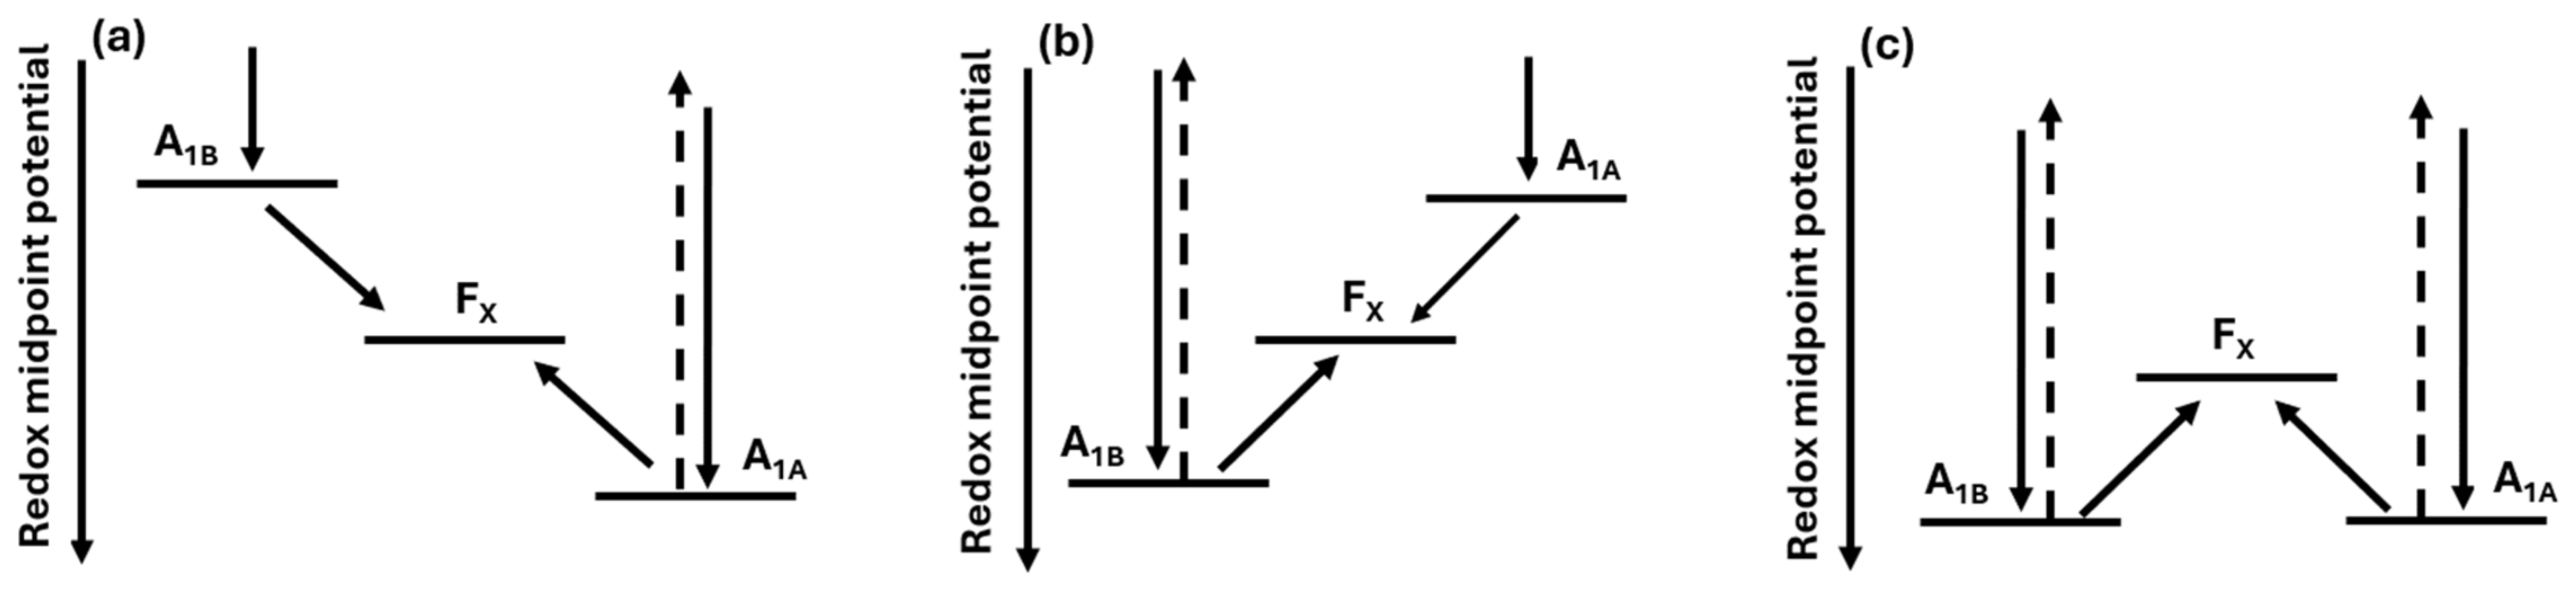
2.2. Iron Sulfur Clusters
3. Materials and Methods
3.1. Sample Preparation
3.2. EPR Spectroscopy
4. Conclusions
Supplementary Materials
Author Contributions
Funding
Institutional Review Board Statement
Informed Consent Statement
Data Availability Statement
Acknowledgments
Conflicts of Interest
Abbreviations
References
- Blankenship, R.E. Molecular Mechanisms of Photosynthesis; Blackwell Science Limited: Oxford, UK, 2002. [Google Scholar]
- Lawlor, D.W. Photosynthesis; BIOS Scientific Publishers Limited: New York, NY, USA, 2001. [Google Scholar]
- Golbeck, J.H. Photosystem I: The Light-Driven Plastocyanin: Ferredoxin Oxidoreductase; Springer: Dordrecht, The Netherlands, 2006. [Google Scholar]
- Shevela, D.; Kern, J.F.; Govindjee, G.; Messinger, J. Solar Energy Conversion by Photosystem II: Principles and Structures. Photosynth. Res. 2023, 156, 279–307. [Google Scholar] [CrossRef] [PubMed]
- Wydrzynski, T.J.S.; Satoh, K.; Freeman, J.A. The Light-Driven Water:Plastoquinone Oxidoreductase; Springer: Dordrecht, The Netherlands, 2005. [Google Scholar]
- Chitnis, P.R. Photosystem I: Function and Physiology. Annu. Rev. Plant Biol. 2001, 52, 593–626. [Google Scholar] [CrossRef] [PubMed]
- Jordan, P.; Fromme, P.; Witt, H.T.; Klukas, O.; Saenger, W.; Krauss, N. Three-Dimensional Structure of Cyanobacterial Photosystem I at 2.5 Å resolution. Nature 2001, 411, 909–917. [Google Scholar] [CrossRef] [PubMed]
- Fromme, P.; Jordan, P.; Krauß, N. Structure of Photosystem I. Biochem. Biophys. Acta 2001, 1507, 5–31. [Google Scholar] [CrossRef]
- Grotjohann, I.; Fromme, P. Structure of Cyanobacterial Photosystem I. Photosynth. Res. 2005, 85, 51–72. [Google Scholar] [CrossRef] [PubMed]
- Vassiliev, I.R.; Antonkine, M.L.; Golbeck, J.H. Iron-Sulfur Clusters in Type I Reaction Centers. Biochem. Biophys. Acta 2001, 1507, 139–160. [Google Scholar] [CrossRef]
- Brettel, K. Electron Transfer and Arrangement of the Redox Cofactors in Photosystem I. Biochem. Biophys. Acta 1997, 1318, 322–373. [Google Scholar] [CrossRef]
- Brettel, K.; Leibl, W. Electron Transfer in Photosystem I. Biochem. Biophys. Acta 2001, 1507, 100–114. [Google Scholar] [CrossRef] [PubMed]
- Mamedov, M.; Govindjee; Nadtochenko, V.; Semenov, A. Primary Electron Transfer Processes in Photosynthetic Reaction Centers from Oxygenic Organisms. Photosynth. Res. 2015, 125, 51–63. [Google Scholar] [CrossRef]
- Cherepanov, D.A.; Shelaev, I.V.; Gostev, F.E.; Nadtochenko, V.A.; Xu, W.; Golbeck, J.H.; Semenov, A.Y. Symmetry Breaking in Photosystem I: Ultrafast Optical Studies of Variants Near the Accessory Chlorophylls in the A and B Branches of Electron Transfer Cofactors. Photochem. Photobiol. Sci. 2021, 20, 1209–1227. [Google Scholar] [CrossRef]
- Müller, M.G.; Niklas, J.; Lubitz, W.; Holzwarth, A.R. Ultrafast Transient Absorption Studies on Photosystem I Reaction Centers from Chlamydomonas reinhardtii. 1. A New Interpretation of the Energy Trapping and Early Electron Transfer Steps in Photosystem I. Biophys. J. 2003, 85, 3899–3922. [Google Scholar] [CrossRef] [PubMed]
- Müller, M.G.; Slavov, C.; Luthra, R.; Redding, K.E.; Holzwarth, A.R. Independent initiation of primary electron transfer in the two branches of the photosystem I reaction center. Proc. Natl. Acad. Sci. USA 2010, 107, 4123–4128. [Google Scholar] [CrossRef] [PubMed]
- Gorka, M.; Baldansuren, A.; Malnati, A.; Gruszecki, E.; Golbeck, J.H.; Lakshmi, K.V. Shedding Light on Primary Donors in Photosynthetic Reaction Centers. Front. Microbiol. 2021, 12, 31. [Google Scholar] [CrossRef] [PubMed]
- Mazor, Y.; Borovikova, A.; Caspy, I.; Nelson, N. Structure of the Plant Photosystem I Supercomplex at 2.6 Å Resolution. Nat. Plants 2017, 3, 17014. [Google Scholar] [CrossRef] [PubMed]
- Bai, T.; Guo, L.; Xu, M.; Tian, L. Structural Diversity of Photosystem I and Its Light-Harvesting System in Eukaryotic Algae and Plants. Front. Plant Sci. 2021, 12, 781035. [Google Scholar] [CrossRef] [PubMed]
- Qin, X.C.; Pi, X.; Wang, W.D.; Hang, G.Y.; Zhu, L.X.; Liu, M.M.; Cheng, L.P.; Shen, J.R.; Kuang, T.Y.; Sui, S.F. Structure of a Green Algal Photosystem I in Complex with a Large Number of Light-Harvesting Complex I Subunits. Nat. Plants 2019, 5, 263–272. [Google Scholar] [CrossRef] [PubMed]
- Su, X.D.; Ma, J.; Pan, X.W.; Zhao, X.L.; Chang, W.R.; Liu, Z.F.; Zhang, X.Z.; Li, M. Antenna Arrangement and Energy Transfer Pathways of a Green Algal Photosystem-I-LHCI Supercomplex. Nat. Plants 2019, 5, 273–281. [Google Scholar] [CrossRef] [PubMed]
- Malavath, T.; Caspy, I.; Netzer-El, S.Y.; Klaiman, D.; Nelson, N. Structure and Function of Wild-Type and Subunit-Depleted Photosystem I. Biochem. Biophys. Acta 2018, 1859, 645–654. [Google Scholar] [CrossRef] [PubMed]
- Poluektov, O.G.; Paschenko, S.V.; Utschig, L.M.; Lakshmi, K.V.; Thurnauer, M.C. Bidirectional Electron Transfer in Photosystem I: Direct Evidence from High-Frequency Time-Resolved EPR Spectroscopy. J. Am. Chem. Soc. 2005, 127, 11910–11911. [Google Scholar] [CrossRef] [PubMed]
- Poluektov, O.G.; Utschig, L.M. Directionality of Electron Transfer in Type I Reaction Center Proteins: High-Frequency EPR Study of PS I with Removed Iron-Sulfur Centers. J. Phys. Chem. B 2015, 119, 13771–13776. [Google Scholar] [CrossRef] [PubMed]
- Van der Est, A.; Prisner, T.; Bittl, R.; Fromme, P.; Lubitz, W.; Mobius, K.; Stehlik, D. Time-Resolved X-, K-, and W-band EPR of the Radical Pair State P•+700A•−1 of Photosystem I in Comparison with P•+865Q•−A in Bacterial Reaction Centers. J. Phys. Chem. B 1997, 101, 1437–1443. [Google Scholar] [CrossRef]
- Zech, S.G.; Hofbauer, W.; Kamlowski, A.; Fromme, P.; Stehlik, D.; Lubitz, W.; Bittl, R. A Structural Model for the Charge Separated State P•+700A•−1 in Photosystem I from the Orientation of the Magnetic Interaction Tensors. J. Phys. Chem. B 2000, 104, 9728–9739. [Google Scholar] [CrossRef]
- Poluektov, O.G.; Utschig, L.M.; Schlesselman, S.L.; Lakshmi, K.V.; Brudvig, G.W.; Kothe, G.; Thurnauer, M.C. Electronic Structure of the P−700 Special pair from High-Frequency Electron Paramagnetic Resonance Spectroscopy. J. Phys. Chem. B 2002, 106, 8911–8916. [Google Scholar] [CrossRef]
- Savitsky, A.; Niklas, J.; Golbeck, J.H.; Mobius, K.; Lubitz, W. Orientation Resolving Dipolar High-Field EPR Spectroscopy on Disordered Solids: II. Structure of Spin-Correlated Radical Pairs in Photosystem I. J. Phys Chem. B 2013, 117, 11184–11199. [Google Scholar] [CrossRef] [PubMed]
- Schlodder, E.; Falkenberg, K.; Gergeleit, M.; Brettel, K. Temperature Dependence of Forward and Reverse Electron Transfer from A, the Reduced Secondary Electron Acceptor in Photosystem I. Biochemistry 1998, 37, 9466–9476. [Google Scholar] [CrossRef] [PubMed]
- Srinivasan, N.; Golbeck, J.H. Protein–cofactor Interactions in Bioenergetic Complexes: The Role of the A1A and A1B Phylloquinones in Photosystem I. Biochem. Biophys. Acta 2009, 1787, 1057–1088. [Google Scholar] [CrossRef] [PubMed]
- Chorney, W.; Scully, N.J.; Crespi, H.L.; Katz, J.J. The Growth of Algae in Deuterium Oxide. Biochem. Biophys. Acta 1960, 37, 280–287. [Google Scholar] [CrossRef] [PubMed]
- Crespi, H.L.; Archer, S.M.; Katz, J.J. Culture of Algae and Other Micro-Organisms in Deuterium Oxide. Nature 1959, 184, 729–730. [Google Scholar] [CrossRef] [PubMed]
- Crespi, H.L.; Conrad, S.M.; Uphaus, R.A.; Katz, J.J. Cultivation of Microorganisms in Heavy Water. Ann. N. Y. Acad. Sci 1960, 84, 648–666. [Google Scholar] [CrossRef] [PubMed]
- Poluektov, O.G.; Niklas, J.; Utschig, L.M. Spin-Correlated Radical Pairs as Quantum Sensors of Bidirectional ET Mechanisms in Photosystem I. J. Phys. Chem. B 2019, 123, 7536–7544. [Google Scholar] [CrossRef] [PubMed]
- Bittl, R.; Weber, S. Transient Radical Pairs Studied by Time-Resolved EPR. Biochem. Biophys. Acta 2005, 1707, 117–126. [Google Scholar] [CrossRef] [PubMed]
- Bittl, R.; Zech, S.G. Pulsed EPR Spectroscopy on Short-Lived Intermediates in photosystem I. Biochem. Biophys. Acta 2001, 1507, 194–211. [Google Scholar] [CrossRef] [PubMed]
- Santabarbara, S.; Kuprov, I.; Fairclough, W.V.; Purton, S.; Hore, P.J.; Heathcote, P.; Evans, M.C.W. Bidirectional Electron Transfer in Photosystem I: Determination of Two Distances between P+700 and A−1 in Spin-Correlated Radical Pairs. Biochemistry 2005, 44, 2119–2128. [Google Scholar] [CrossRef]
- Santabarbara, S.; Reifschneider, K.; Jasaitis, A.; Gu, F.F.; Agostini, G.; Carbonera, D.; Rappaport, F.; Redding, K.E. Interquinone Electron Transfer in Photosystem I as Evidenced by Altering the Hydrogen Bond Strength to the Phylloquinone(s). J. Phys. Chem. B 2010, 114, 9300–9312. [Google Scholar] [CrossRef] [PubMed]
- Santabarbara, S.; Kuprov, I.; Hore, P.J.; Casal, A.; Heathcote, P.; Evans, M.C.W. Analysis of the Spin-Polarized Electron Spin Echo of the [P+700A−1] Radical Pair of Photosystem I Indicates that Both Reaction Center Subunits are Competent in Electron Transfer in Cyanobacteria, Green Algae, and Higher Plants. Biochemistry 2006, 45, 7389–7403. [Google Scholar] [CrossRef] [PubMed]
- Santabarbara, S.; Kuprov, I.; Poluektov, O.; Casal, A.; Russell, C.A.; Purton, S.; Evans, M.C.W. Directionality of Electron-Transfer Reactions in Photosystem I of Prokaryotes: Universality of the Bidirectional Electron-Transfer Model. J. Phys. Chem. B 2010, 114, 15158–15171. [Google Scholar] [CrossRef] [PubMed]
- Santabarbara, S.; Galuppini, L.; Casazza, A.P. Bidirectional Electron Transfer in the Reaction Centre of Photosystem I. J. Integr. Plant. Biol. 2010, 52, 735–749. [Google Scholar] [CrossRef]
- Santabarbara, S.; Heathcote, P.; Evans, M.C.W. Modelling of the Electron Transfer Reactions in Photosystem I by Electron Tunnelling Theory: The Phylloquinones Bound to the PsaA and the PsaB Reaction Centre Subunits of PSI are Almost Isoenergetic to the Iron-Sulfur Cluster Fx. Biochem. Biophys. Acta 2005, 1708, 283–310. [Google Scholar] [CrossRef]
- Muhiuddin, I.P.; Heathcote, P.; Carter, S.; Purton, S.; Rigby, S.E.J.; Evans, M.C.W. Evidence from Time Resolved Studies of the P700/A1− Radical Pair for Photosynthetic Electron Transfer on Both the PsaA and PsaB Branches of the Photosystem I Reaction Centre. Febs. Lett. 2001, 503, 56–60. [Google Scholar] [CrossRef] [PubMed]
- Poluektov, O.G.; Utschig, L.M.; Dubinskij, A.A.; Thurnauer, M.C. Electron Transfer Pathways and Protein Response to Charge Separation in Photosynthetic Reaction Centers: Time-Resolved High-Field ENDOR of the Spin-Correlated Radical Pair P865+QA−. J. Am. Chem. Soc. 2005, 127, 4049–4059. [Google Scholar] [CrossRef] [PubMed]
- Möbius, K. Primary Processes in Photosynthesis: What do we Learn from High-Field EPR Spectroscopy? Chem. Soc. Rev. 2000, 29, 129–139. [Google Scholar] [CrossRef]
- Möbius, K.; Savitsky, A. High-Field EPR Spectroscopy on Proteins and their Model Systems: Characterization of Transient Paramagnetic States; The Royal Society of Chemistry: Cambridge, UK, 2008. [Google Scholar] [CrossRef]
- Harvey, S.M.; Wasielewski, M.R. Photogenerated spin-correlated radical pairs: From photosynthetic energy transduction to quantum information science. J. Am. Chem. Soc. 2021, 143, 15508–15529. [Google Scholar] [CrossRef] [PubMed]
- Hore, P.J.; Hunter, D.A.; Mckie, C.D.; Hoff, A.J. Electron-paramagnetic resonance of spin-correlated radical pairs in photosynthetic reactions. Chem. Phys. Lett. 1987, 137, 495–500. [Google Scholar] [CrossRef]
- Hore, P.J. Analysis of Polarized EPR Spectra. In Advanced EPR; Hoff, A.J., Ed.; Elsevier: Amsterdam, The Netherlands, 1989; pp. 405–440. [Google Scholar]
- Closs, G.L.; Forbes, M.D.E.; Norris, J.R. Spin-Polarized Electron-Paramagnetic Resonance-Spectra of Radical Pairs in Micelles—Observation of Electron-Spin Spin Interactions. J. Phys. Chem. 1987, 91, 3592–3599. [Google Scholar] [CrossRef]
- Poluektov, O.G.; Utschig, L.M. Quantum Sensing of Electron Transfer Pathways in Natural Photosynthesis Using Time-Resolved High-Field Electron Paramagnetic Resonance/Electron-Nuclear Double Resonance Spectroscopy. J. Phys. Chem. B 2021, 125, 4025–4030. [Google Scholar] [CrossRef] [PubMed]
- Hore, P.J.; Mouritsen, H. The Radical-Pair Mechanism of Magnetoreception. Annu. Rev. Biophys. 2016, 45, 299–344. [Google Scholar] [CrossRef] [PubMed]
- Wiltschko, R.; Wiltschko, W. Magnetoreception in birds. J. R. Soc. Interface 2019, 16, 20190295. [Google Scholar] [CrossRef] [PubMed]
- Bindra, J.K.; Niklas, J.; Jeong, Y.; Jasper, A.W.; Kretzschmar, M.; Kern, J.; Utschig, L.M.; Poluektov, O.G. Coherences of Photoinduced Electron Spin Qubit Pair States in Photosystem I. J. Phys. Chem. B 2023, 127, 10108–10117. [Google Scholar] [CrossRef] [PubMed]
- Bonnerjea, J.; Evans, M.C.W. Identification of Multiple Components in the Intermediary Electron Carrier Complex of Photosystem-I. FEBS Lett. 1982, 148, 313–316. [Google Scholar] [CrossRef]
- Gast, P.; Swarthoff, T.; Ebskamp, F.C.R.; Hoff, A.J. Evidence for a New Early Acceptor in Photosystem-I of Plants—An Electron-Spin-Resonance Investigation of Reaction Center Triplet Yield and of the Reduced Intermediary Acceptors. Biochem. Biophys. Acta 1983, 722, 163–175. [Google Scholar] [CrossRef]
- Redding, K.; van der Est, A. The Directionality of Electron Transport in Photosystem I. In Photosystem I: The Light-Driven Plastocyanin:Ferredoxin Oxidoreductase; Golbeck, J.H., Ed.; Springer: Dordrecht, The Netherlands, 2006; Volume 24, pp. 413–437. [Google Scholar]
- Joliot, P.; Joliot, A. In Vivo Analysis of the Electron Transfer within Photosystem I: Are the Two Phylloquinones Involved? Biochemistry 1999, 38, 11130–11136. [Google Scholar] [CrossRef] [PubMed]
- Fromme, P.; Melkozernov, A.; Jordan, P.; Krauss, N. Structure and Function of Photosystem I: Interaction with its Souble Electron Carriers and External Antenna Systems. FEBS Lett. 2003, 555, 40–44. [Google Scholar] [CrossRef] [PubMed]
- Sétif, P. Electron Transfer from the Bound Iron–Sulfur Clusters to Ferredoxin/Flavodoxin: Kinetic and Structural Properties of Ferredoxin/Flavodoxin Reduction by Photosystem I. In Photosystem I: The Light-Driven Plastocyanin:Ferredoxin Oxidoreductase; Golbeck, J.H., Ed.; Springer: Dordrecht, The Netherlands, 2006; pp. 439–454. [Google Scholar]
- Sétif, P. Ferredoxin and Flavodoxin Reduction by Photosystem I. Biochem. Biophys. Acta 2001, 1507, 161–179. [Google Scholar] [CrossRef] [PubMed]
- Ohnishi, T. Iron–Sulfur Clusters/Semiquinones in Complex I. BBA-Bioenergetics 1998, 1364, 186–206. [Google Scholar] [CrossRef] [PubMed]
- Hagen, W.R. EPR Spectroscopy of Complex Biological Iron–Sulfur Systems. J. Biol. Inorg. Chem. 2018, 23, 623–634. [Google Scholar] [CrossRef] [PubMed]
- Hagen, W.R. EPR Spectroscopy of Iron—Sulfur Proteins. In Advances in Inorganic Chemistry; Cammack, R., Ed.; Academic Press: Cambridge, MA, USA, 1992; Volume 38, pp. 165–222. [Google Scholar]
- Guigliarelli, B.; Bertrand, P. Application of EPR Spectroscopy to the Structural and Functional Study of Iron-Sulfur Proteins. In Advances in Inorganic Chemistry; Sykes, A.G., Ed.; Academic Press: Cambridge, MA, USA, 1999; Volume 47, pp. 421–497. [Google Scholar]
- Cutsail, G.E.; Telser, J.; Hoffman, B.M. Advanced Paramagnetic Resonance Spectroscopies of Iron–Sulfur Proteins: Electron Nuclear Double Resonance (ENDOR) and Electron Spin Echo Envelope Modulation (ESEEM). BBA-Mol. Cell Res. 2015, 1853, 1370–1394. [Google Scholar] [CrossRef] [PubMed]
- Utschig, L.M.; Chen, L.X.; Poluektov, O.G. Discovery of native metal ion sites located on the ferredoxin docking side of photosystem I. Biochemistry 2008, 47, 3671–3676. [Google Scholar] [CrossRef] [PubMed]
- Parrett, K.G.; Mehari, T.; Warren, P.G.; Golbeck, J.H. Purification and Properties of the Intact P-700 and Fx-Containing Photosystem-I Core Protein. Biochem. Biophys. Acta 1989, 973, 324–332. [Google Scholar] [CrossRef]
- Warren, P.V.; Parrett, K.G.; Warden, J.T.; Golbeck, J.H. Characterization of a Photosystem-I Core Containing P700 and Intermediate Electron Acceptor-A1. Biochemistry 1990, 29, 6545–6550. [Google Scholar] [CrossRef] [PubMed]
- Hellmich, J.; Bommer, M.; Burkhardt, A.; Ibrahim, M.; Kern, J.; Meents, A.; Muh, F.; Dobbek, H.; Zouni, A. Native-like Photosystem II Superstructure at 2.44 Å Resolution through Detergent Extraction from the Protein Crystal. Structure 2014, 22, 1607–1615. [Google Scholar] [CrossRef] [PubMed]
- Daboll, H.F.; Crespi, H.L.; Katz, J.J. Mass Cultivation of Algae in Pure Heavy Water. Biotechnol. Bioeng. 1962, 4, 281–297. [Google Scholar] [CrossRef]
- Bresgunov, A.Y.; Dubinskii, A.A.; Krimov, V.N.; Petrov, Y.G.; Poluektov, O.G.; Lebedev, Y.S. Pulsed EPR in 2-mm Band. Appl. Magn. Reson. 1991, 2, 715–728. [Google Scholar] [CrossRef]
- Stoll, S.; Schweiger, A. EasySpin, a comprehensive software package for spectral simulation and analysis in EPR. J. Magn. Reson. 2006, 178, 42–55. [Google Scholar] [CrossRef] [PubMed]


| FA | FB | FA/FB | |||||
|---|---|---|---|---|---|---|---|
| gx | gy | gz | gx | gy | gz | ||
| T. elongatus 1H | 2.048 | 1.945 | 1.863 | 2.069 | 1.930 | 1.881 | 2.7 |
| S. lividus 1H | 2.050 | 1.946 | 1.865 | 2.068 | 1.933 | 1.879 | 2.0 |
| S. lividus 2H | 2.050 | 1.947 | 1.867 | 2.069 | 1.933 | 1.879 | 2.7 |
| S. leopoliensis 1H | 2.044 | 1.942 | 1.854 | 2.070 | 1.921 | 1.880 | 3.6 |
| S. leopoliensis 2H | 2.044 | 1.942 | 1.854 | 2.070 | 1.921 | 1.880 | 3.6 |
| C. vulgaris 1H | 2.052 | 1.948 | 1.869 | 2.067 | 1.933 | 1.886 | 1.0 |
| C. vulgaris 2H | 2.054 | 1.949 | 1.868 | 2.068 | 1.934 | 1.886 | 0.9 |
| S. obliquus 2H | 2.046 | 1.945 | 1.853 | 2.067 | 1.932 | 1.880 | 1.3 |
Disclaimer/Publisher’s Note: The statements, opinions and data contained in all publications are solely those of the individual author(s) and contributor(s) and not of MDPI and/or the editor(s). MDPI and/or the editor(s) disclaim responsibility for any injury to people or property resulting from any ideas, methods, instructions or products referred to in the content. |
© 2024 by the authors. Licensee MDPI, Basel, Switzerland. This article is an open access article distributed under the terms and conditions of the Creative Commons Attribution (CC BY) license (https://creativecommons.org/licenses/by/4.0/).
Share and Cite
Bindra, J.K.; Malavath, T.; Teferi, M.Y.; Kretzschmar, M.; Kern, J.; Niklas, J.; Utschig, L.M.; Poluektov, O.G. Light-Induced Charge Separation in Photosystem I from Different Biological Species Characterized by Multifrequency Electron Paramagnetic Resonance Spectroscopy. Int. J. Mol. Sci. 2024, 25, 8188. https://doi.org/10.3390/ijms25158188
Bindra JK, Malavath T, Teferi MY, Kretzschmar M, Kern J, Niklas J, Utschig LM, Poluektov OG. Light-Induced Charge Separation in Photosystem I from Different Biological Species Characterized by Multifrequency Electron Paramagnetic Resonance Spectroscopy. International Journal of Molecular Sciences. 2024; 25(15):8188. https://doi.org/10.3390/ijms25158188
Chicago/Turabian StyleBindra, Jasleen K., Tirupathi Malavath, Mandefro Y. Teferi, Moritz Kretzschmar, Jan Kern, Jens Niklas, Lisa M. Utschig, and Oleg G. Poluektov. 2024. "Light-Induced Charge Separation in Photosystem I from Different Biological Species Characterized by Multifrequency Electron Paramagnetic Resonance Spectroscopy" International Journal of Molecular Sciences 25, no. 15: 8188. https://doi.org/10.3390/ijms25158188