
Insulin-like Growth Factor-Binding Protein 2 in Severe Aortic Valve Stenosis and Pulmonary Hypertension: A Gender-Based Perspective
 , , , ,
Abstract
:1. Introduction
2. Results
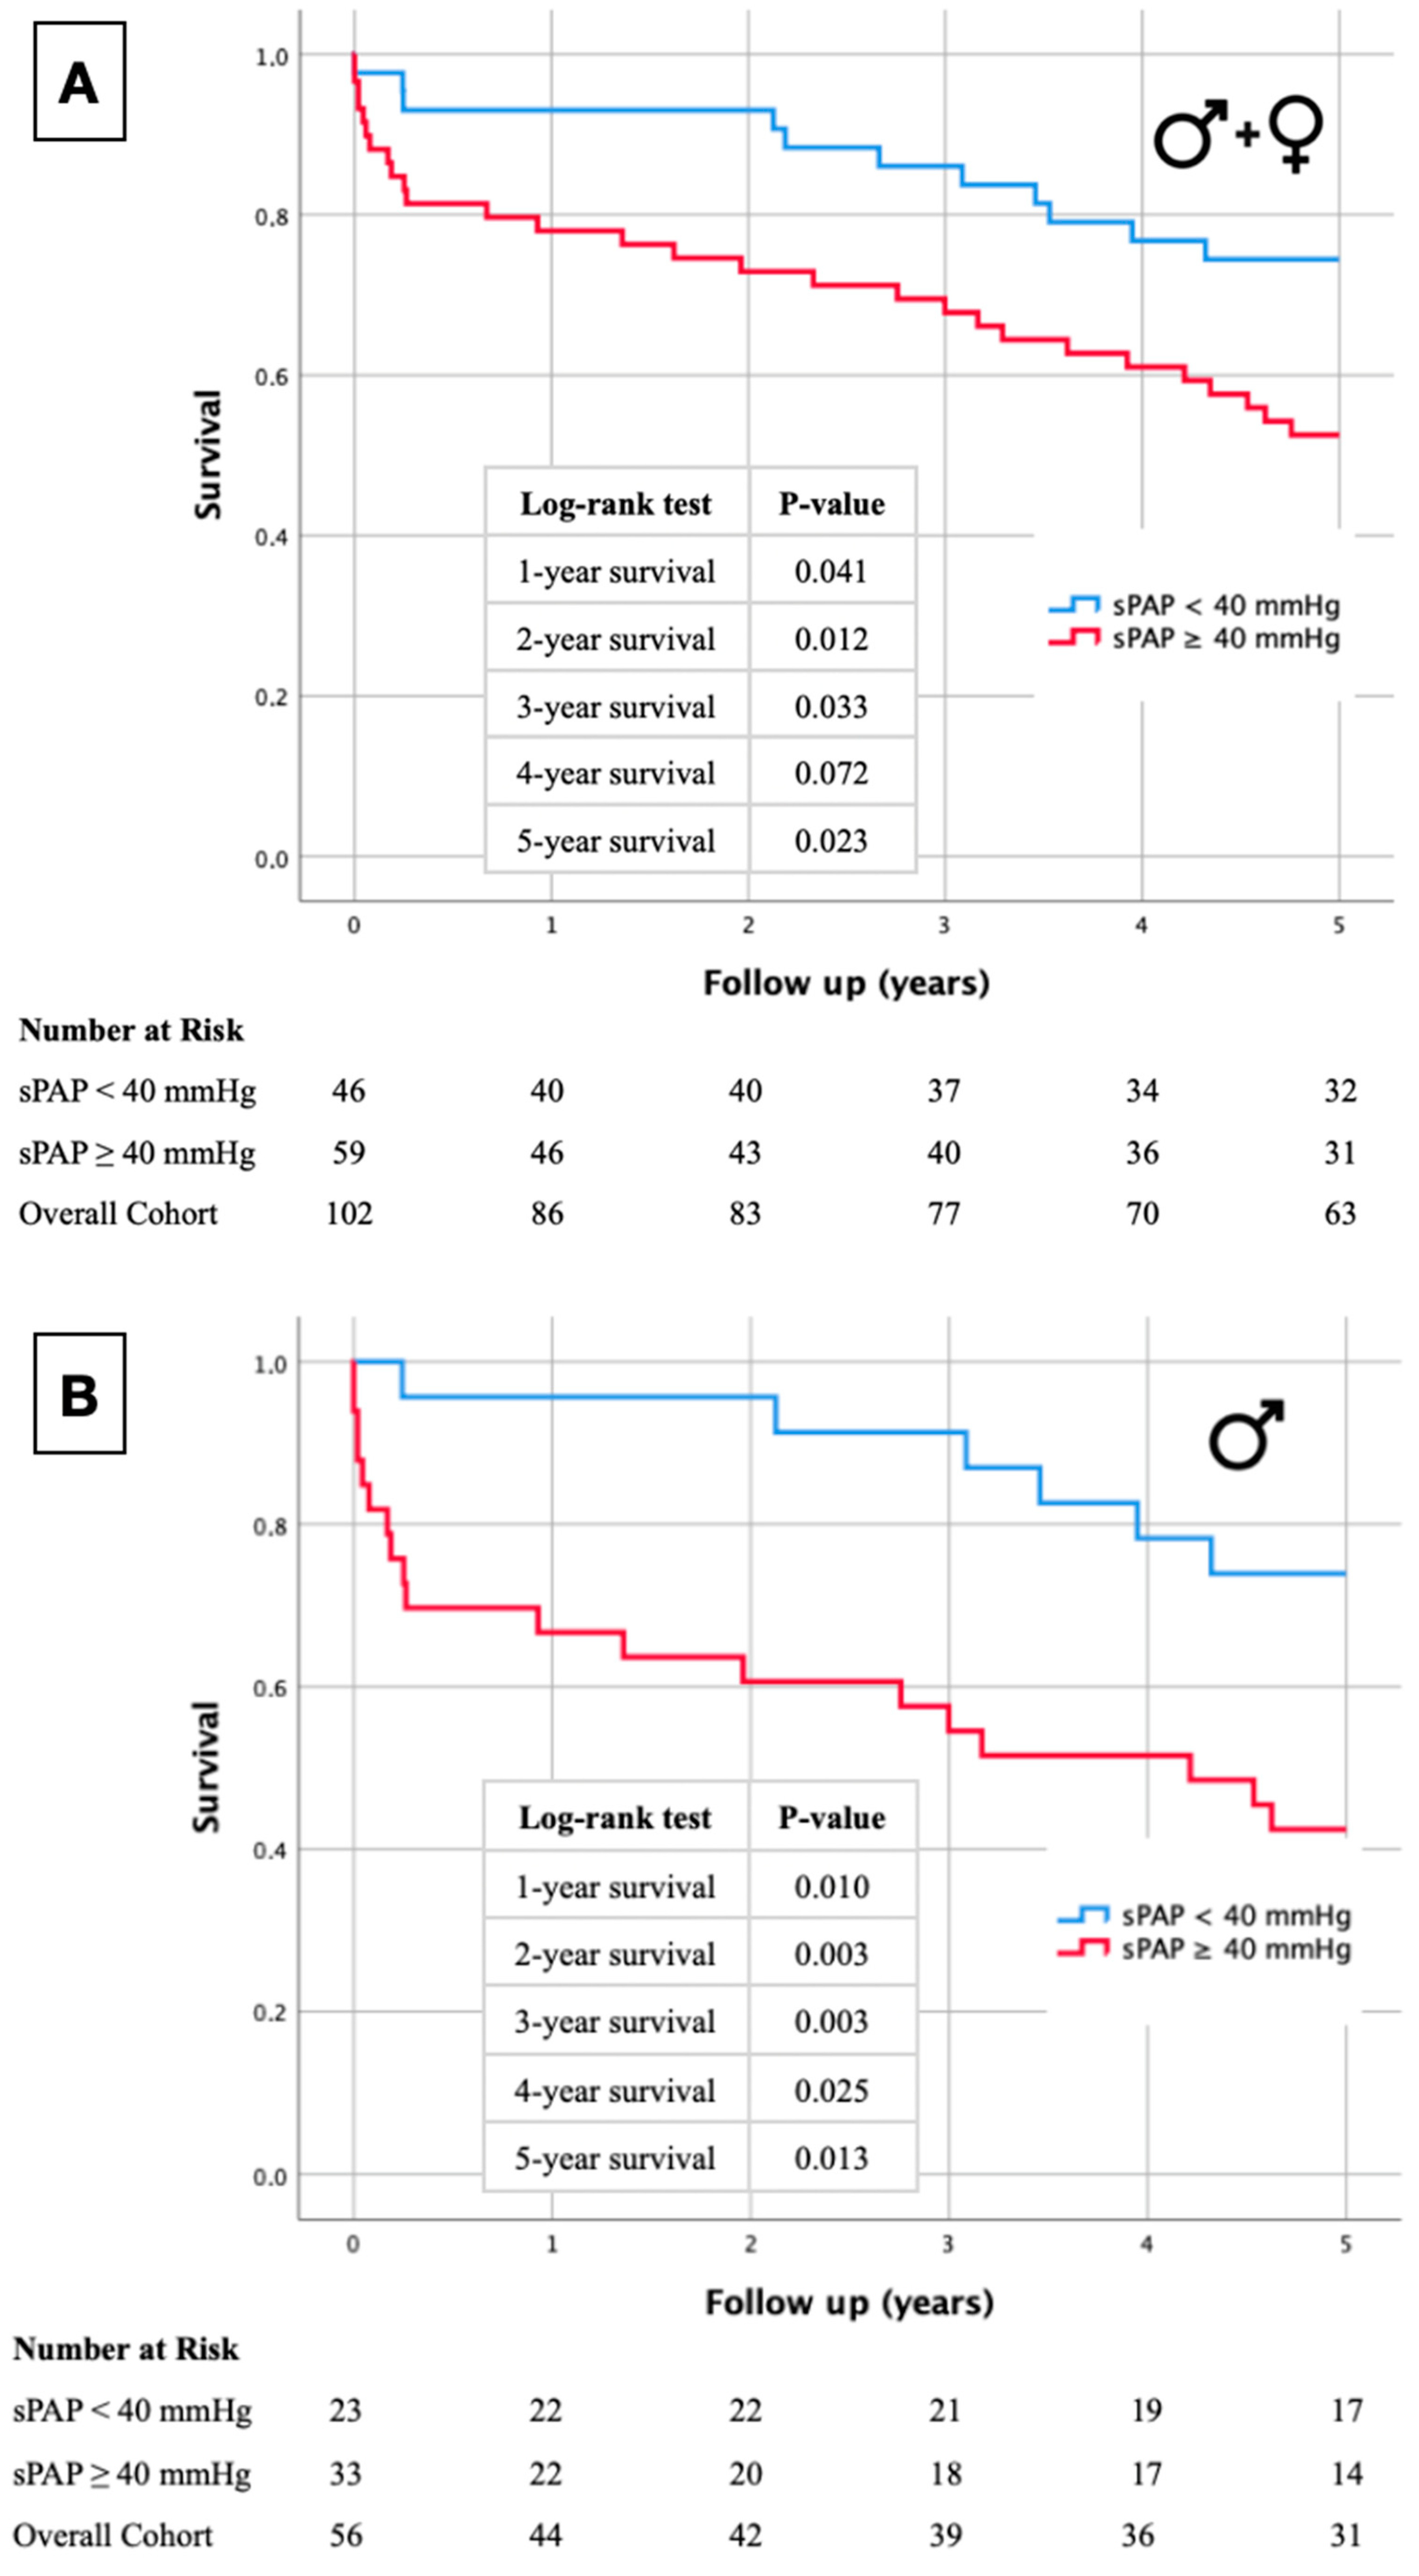
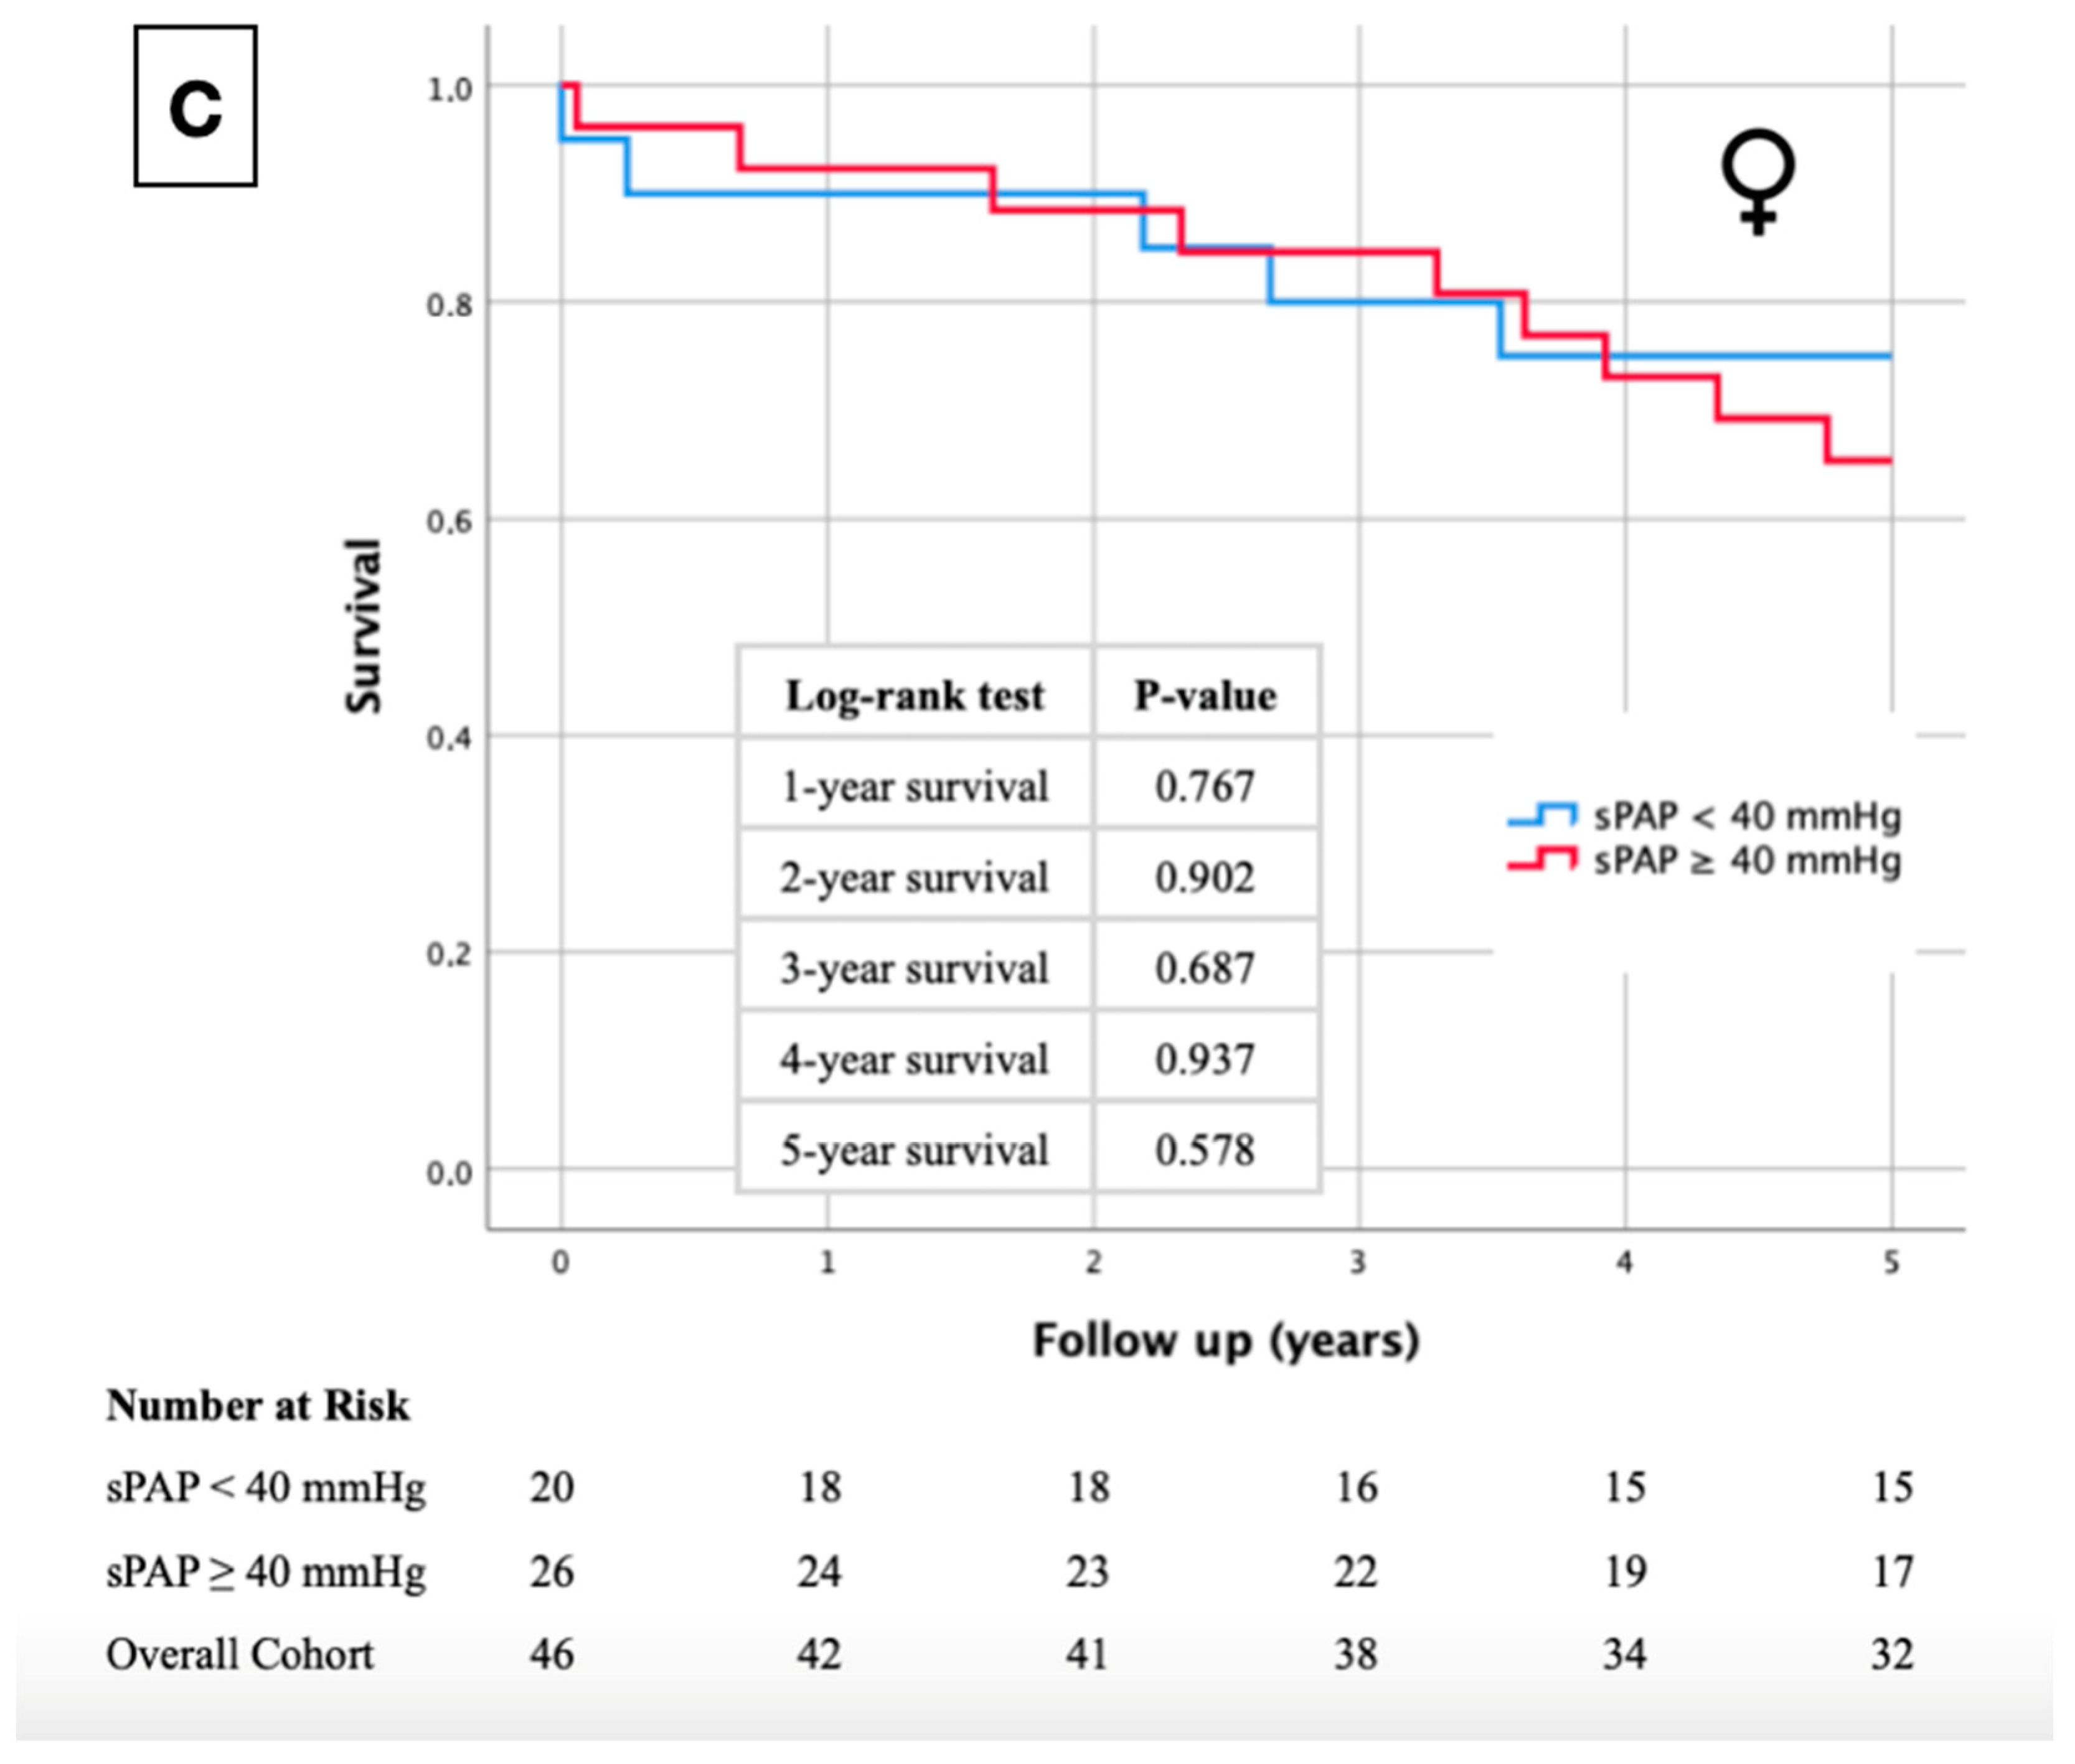
2.1. Kaplan–Meier Curves
2.2. Study Cohort and Baseline Characteristics
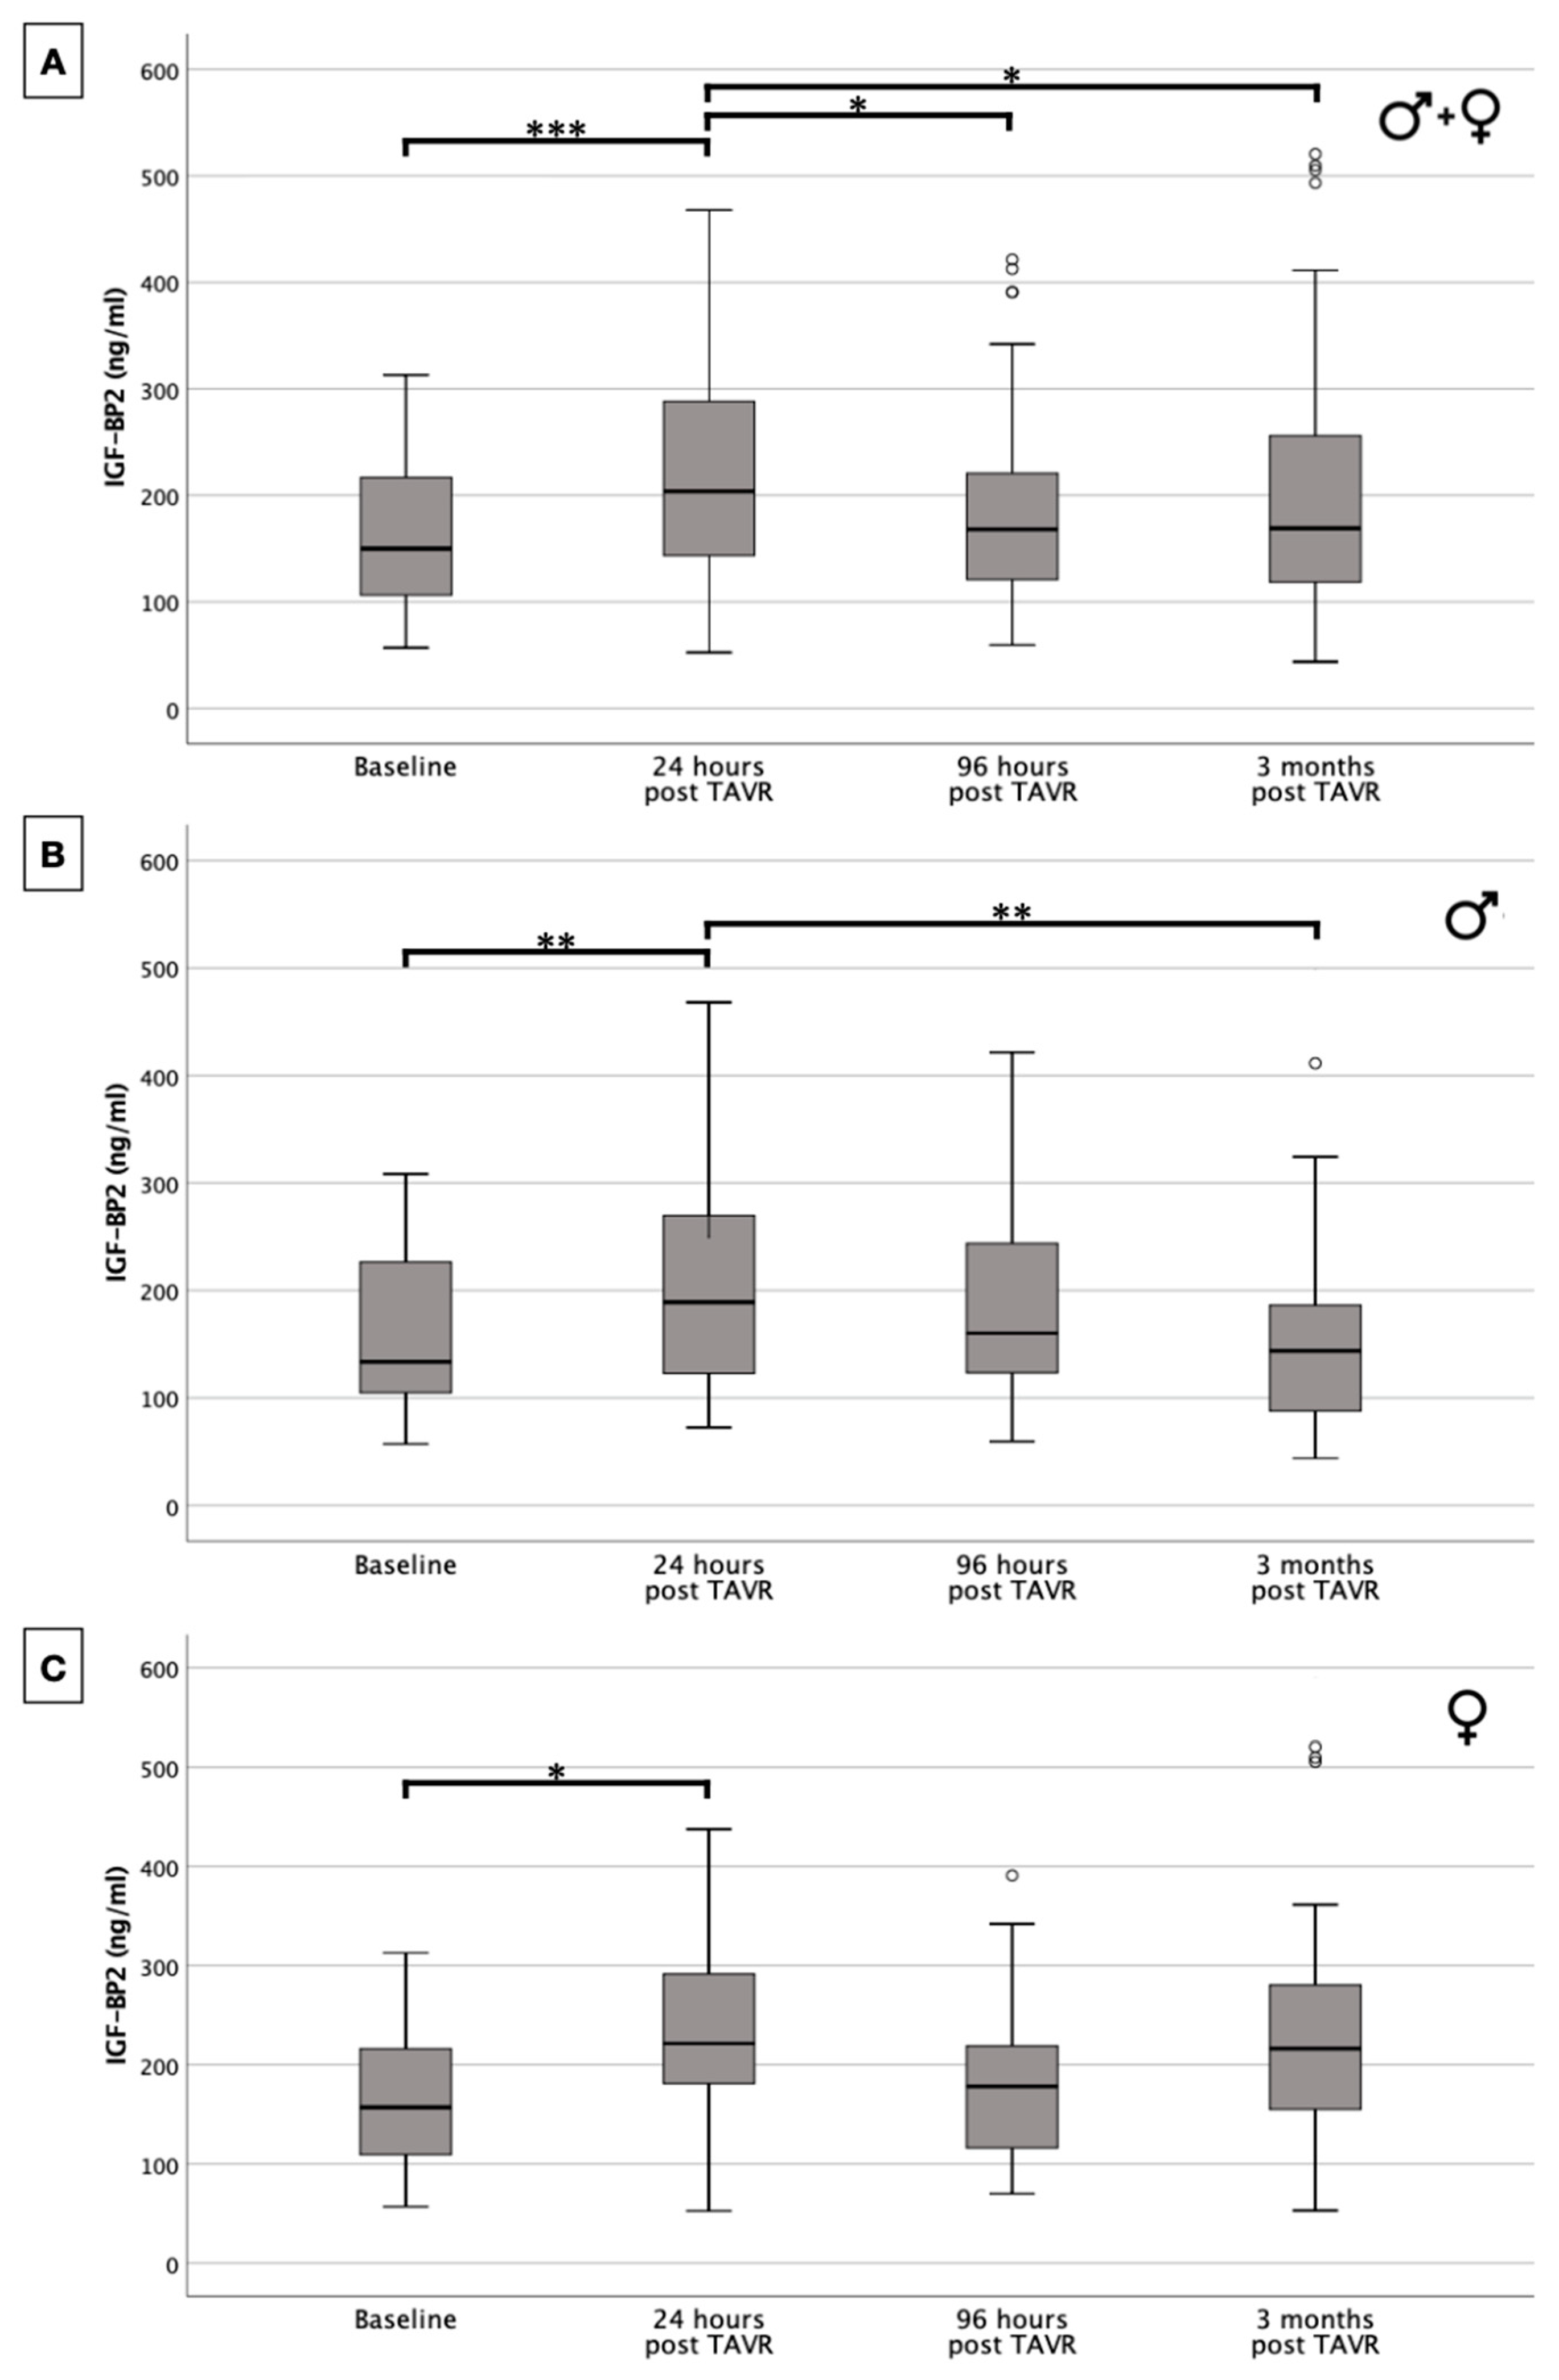
2.3. IGF-BP2 Concentration in Overall Cohort and in Gender-Specific Cohort
2.4. Correlation Analysis of sPAP and IGF-BP2 in Overall Cohort and in Gender-Specific Subdivision
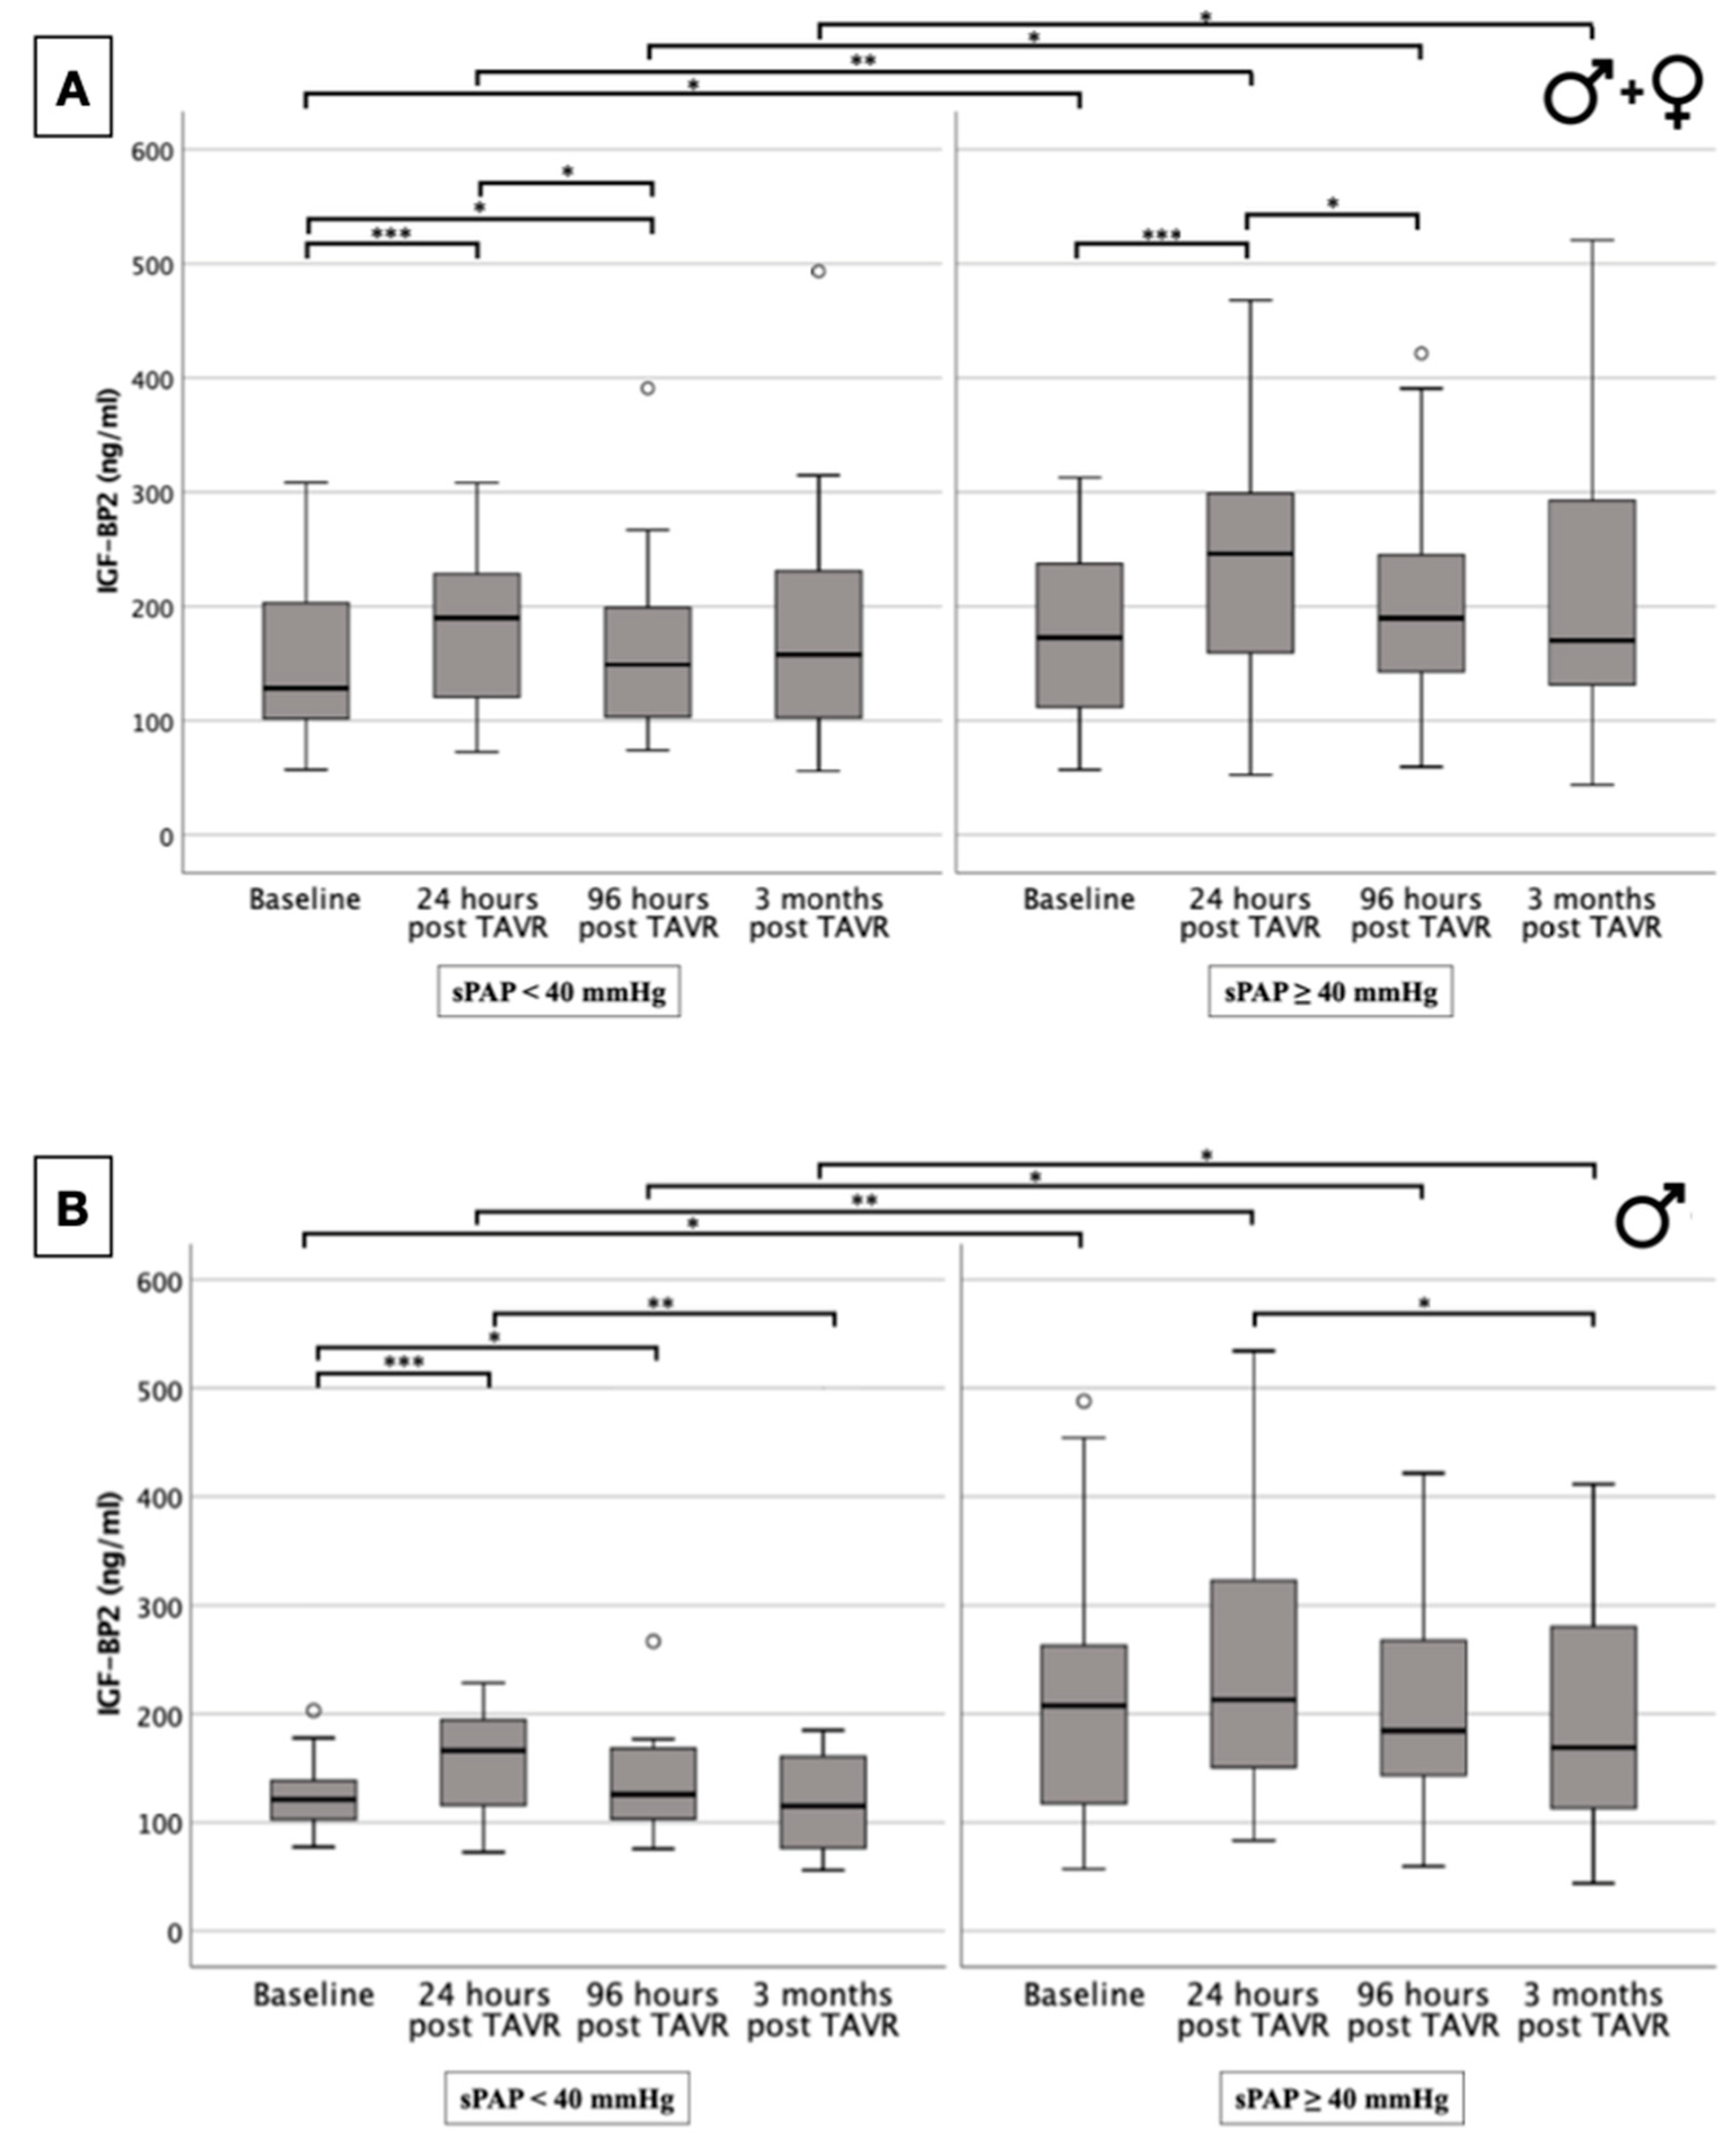
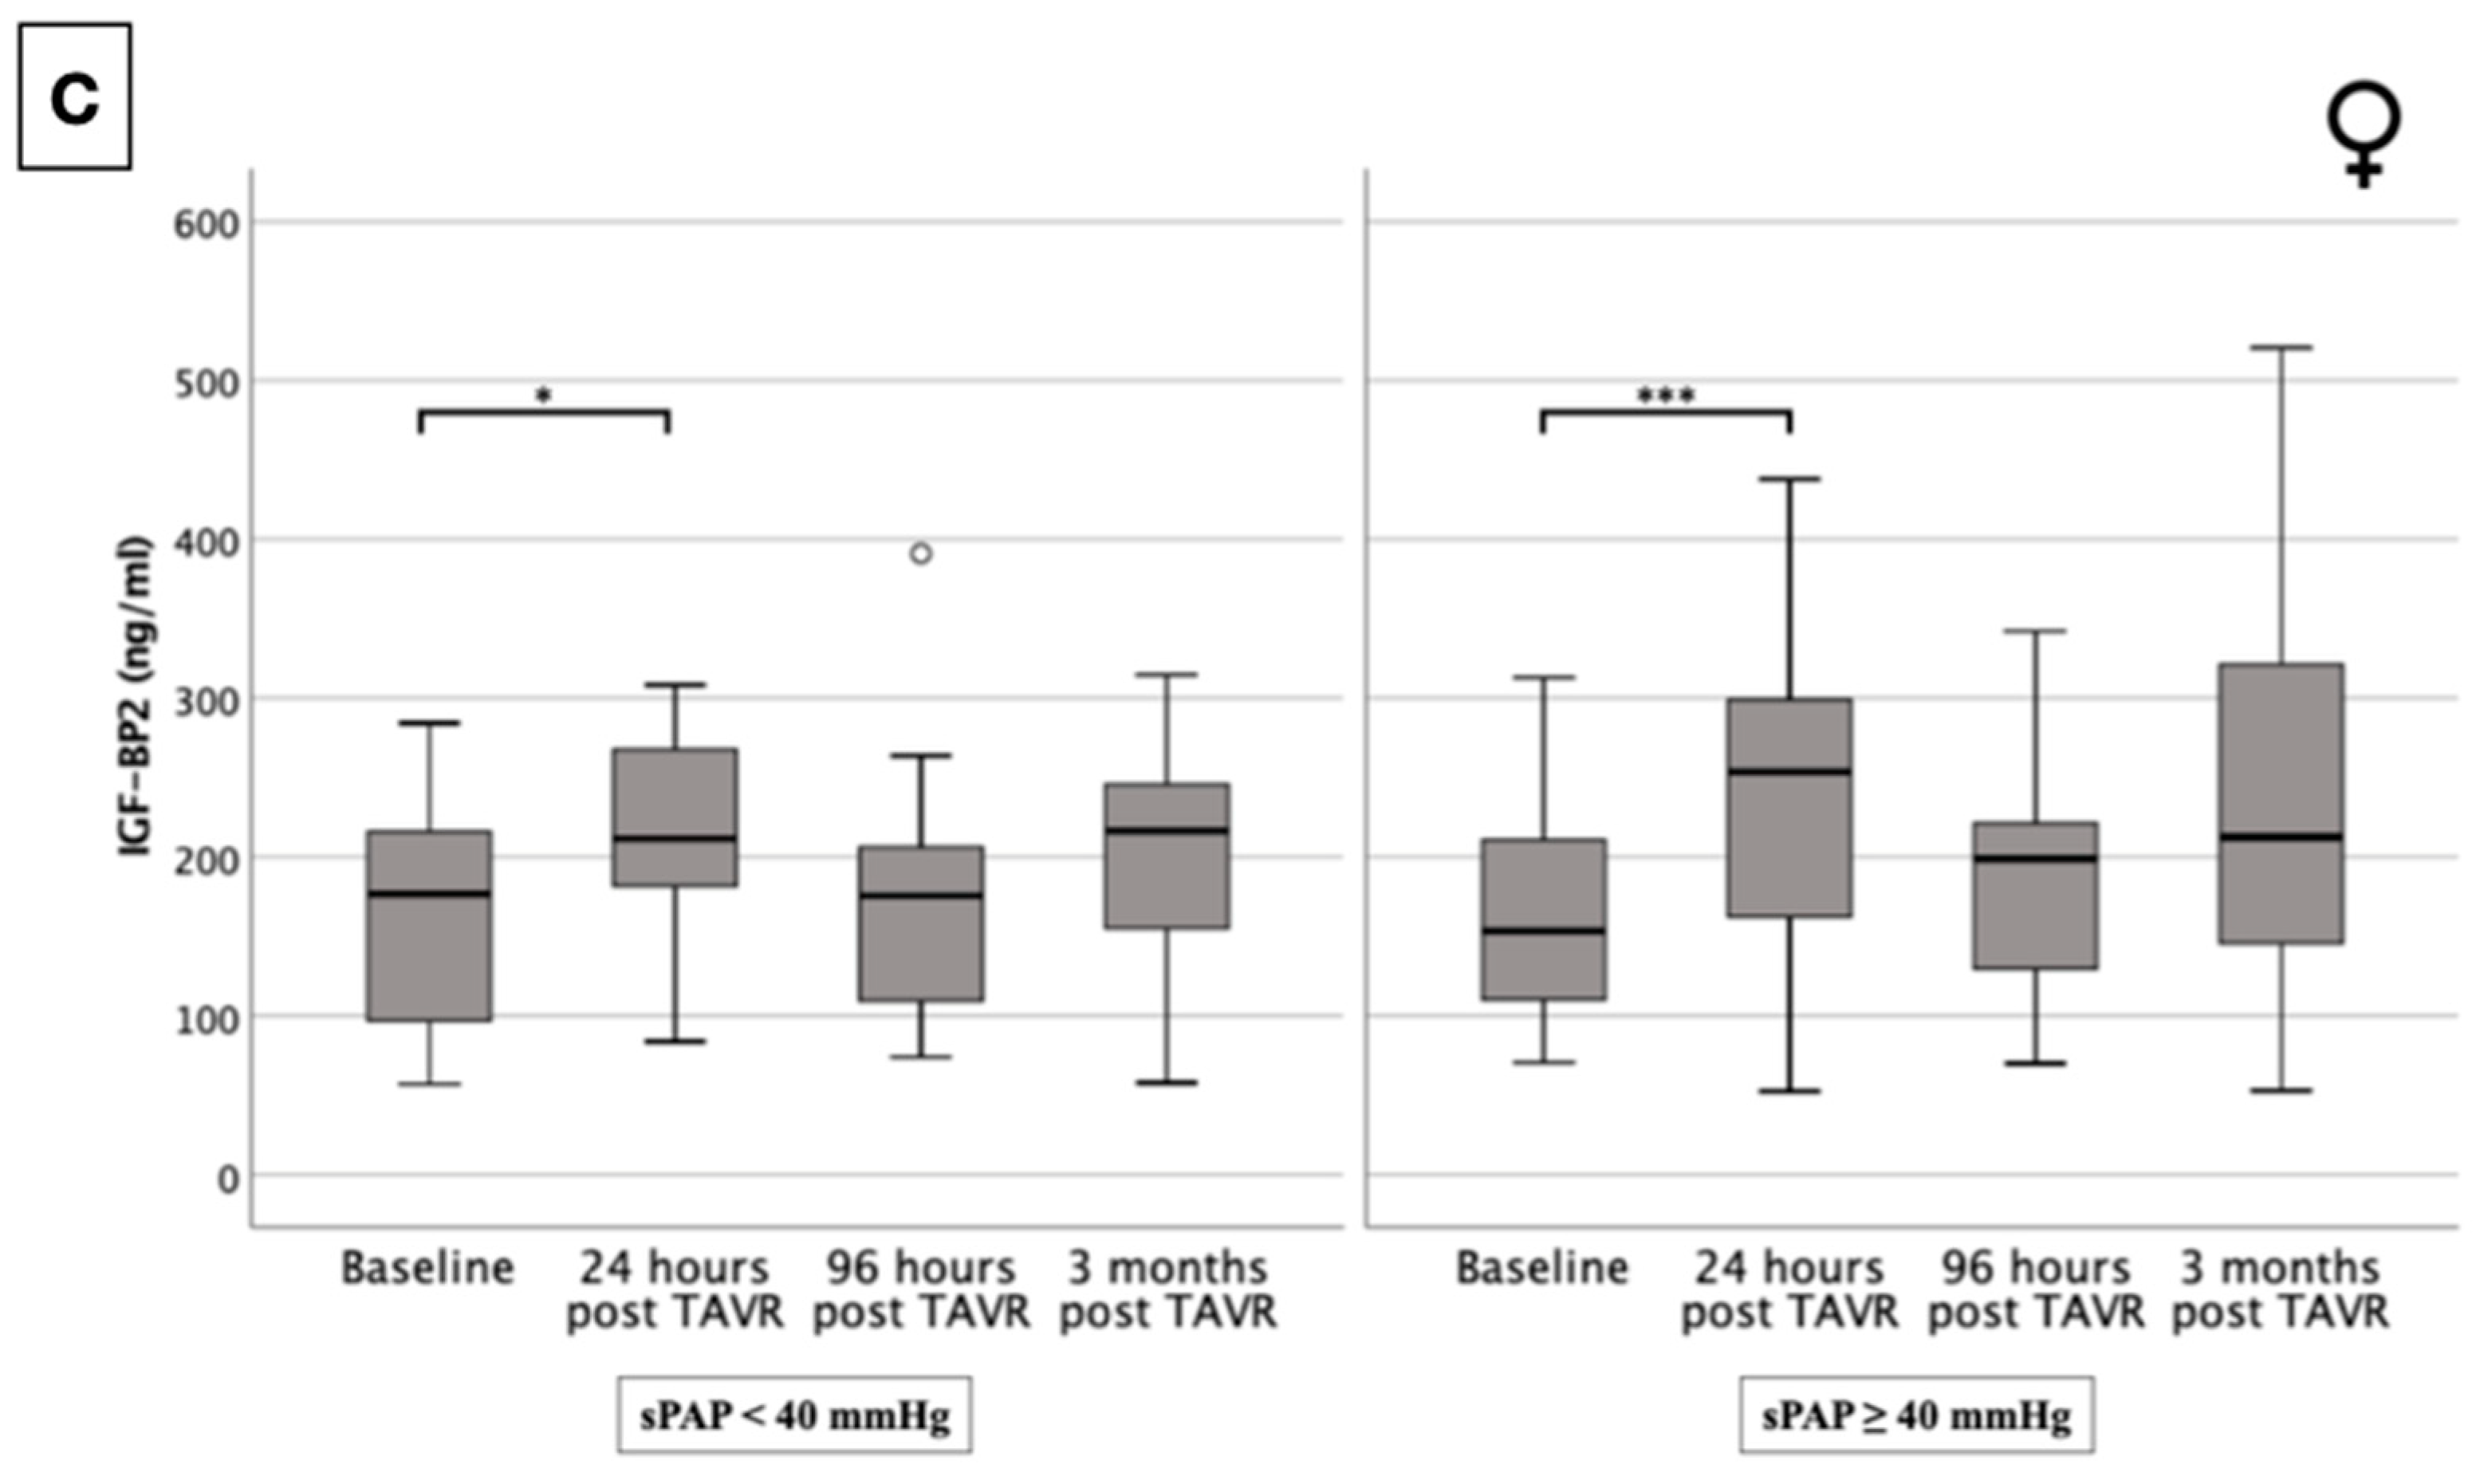
2.5. IGF-BP2 Concentration in Overall Cohort and in Gender-Specific Cohort Regarding Presence or Absence of PH
2.6. Classification of Aortic Stenosis According to Généreux et al. [16] and IGF-BP2 Severity
2.7. Cox Hazard Regression Analysis: Males
2.8. Cox Hazard Regression Analysis: Male + sPAP ≥ 40 mmHg
2.9. Cox Hazard Regression Analysis: IGF-BP2 Baseline in Male Gender ± sPAP ≥ 40 mmHg
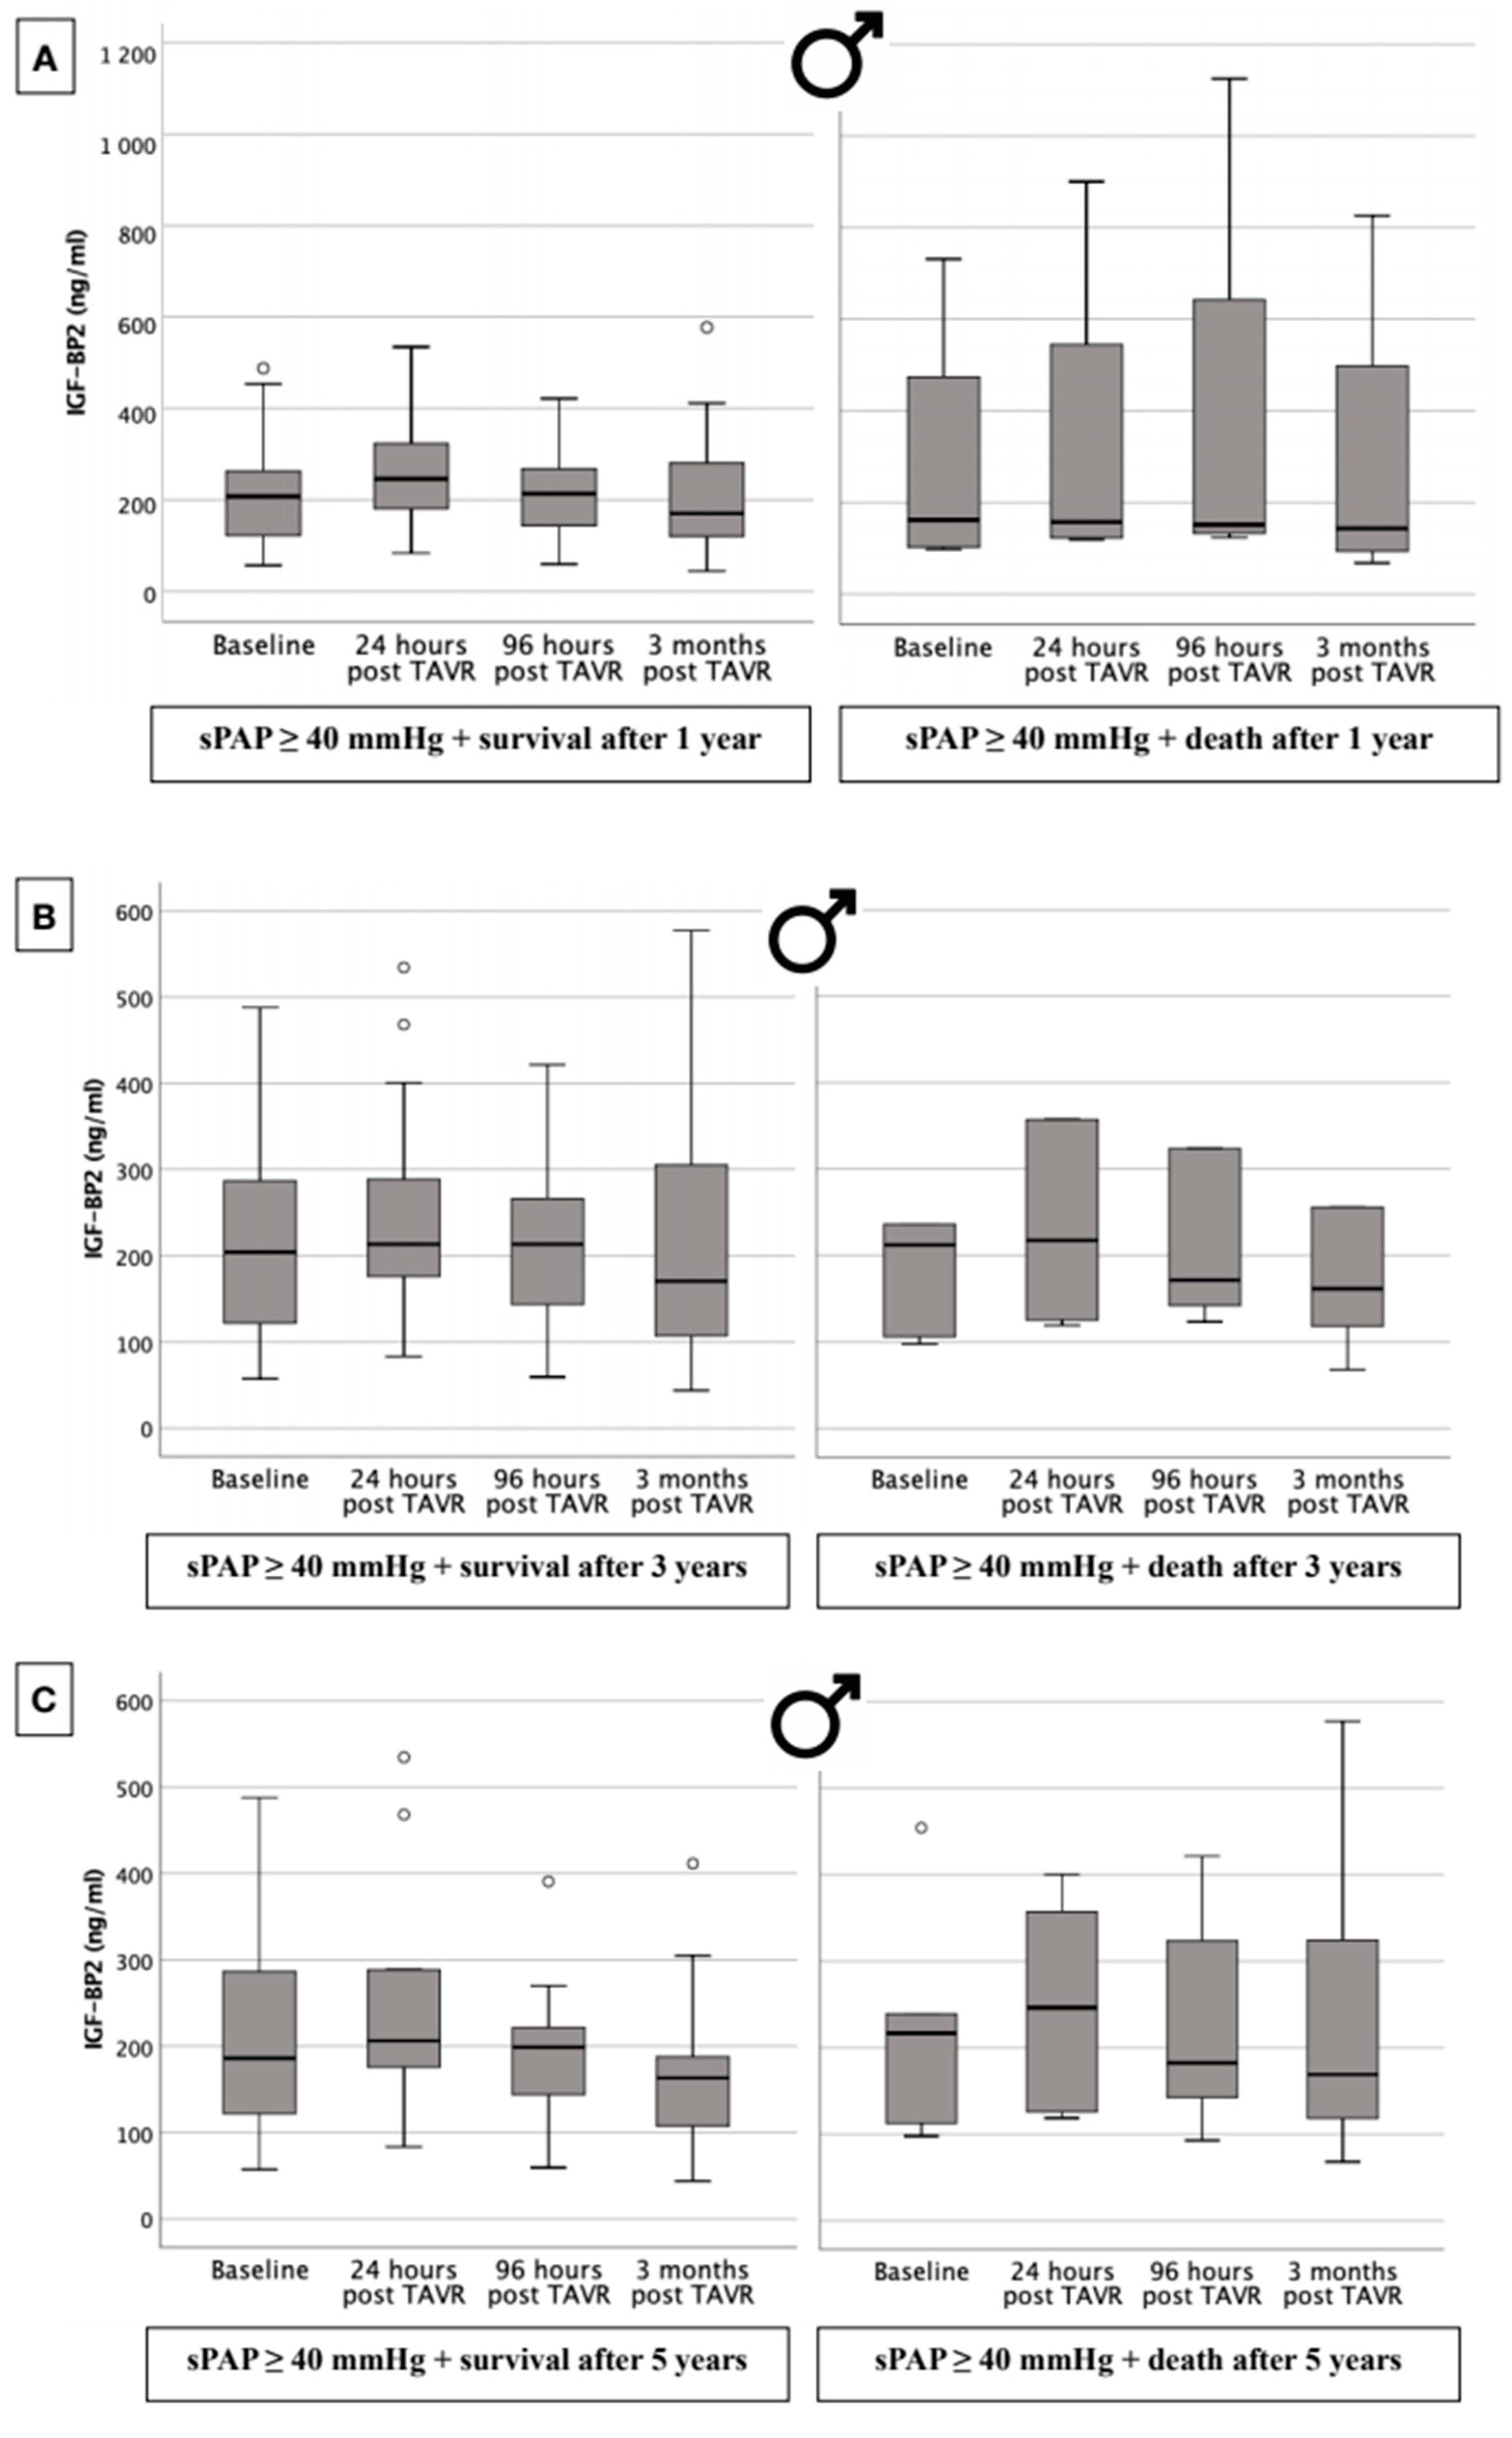
2.10. IGF-BP2 Concentration in Males with Respect to 1-, 3-, and 5-Year Survival Dependent upon Presence or Absence of PH
3. Material and Methods
3.1. Patient Population
3.2. Transthoracic Echocardiography
3.3. Classification of Aortic Stenosis Based on the Extent of Cardiac Damage
3.4. Chronic Obstructive Pulmonary Disease (COPD) Definition
- GOLD 1 (mild): FEV1 ≥ 80% predicted;
- GOLD 2 (moderate): 50% ≤ FEV1 < 80% predicted;
- GOLD 3 (severe): 30% ≤ FEV1 < 50% predicted;
- GOLD 4 (very severe): FEV1 < 30% predicted.
3.5. TAVR
3.6. IGF-BP2 Analysis
3.7. Statistical Analysis
4. Discussion
4.1. Role of IGF-BP2 in PH
4.2. Role of IGF-BP2 in Severe AS
4.3. Role of IGF-BP2 in Severe AS and PH
5. Limitation
6. Conclusions
Supplementary Materials
Author Contributions
Funding
Institutional Review Board Statement
Informed Consent Statement
Data Availability Statement
Acknowledgments
Conflicts of Interest
Abbreviations
| AS | Aortic Valve Stenosis |
| AUROC | Area Under the Receiver Operating Characteristic |
| ELISA | Enzyme Linked Immunosorbent Assay |
| ESC | European Society for Cardiology |
| IGF | Insulin-like Growth Factor |
| IGF-BP2 | Insulin-like Growth Factor-Binding Protein 2 |
| IPF | Idiopathic Pulmonary Fibrosis |
| IQR | Interquartile Range |
| LVEF | Left Ventricular Ejection Fraction |
| PAH | Pulmonary Arterial Hypertension |
| PH | Pulmonary Hypertension |
| SAVR | Surgical Aortic Valve Replacement |
| SD | Standard Deviation |
| sPAP | Systolic Pulmonary Artery Pressure |
| TAVR | Transcatheter Aortic Valve Replacement |
| TRV | Tricuspid Regurgitant Jet Velocity |
| VSMC | Vascular Smooth Muscle Cell |
| YI | Youden Index |
References
- Joseph, J.; Naqvi, S.Y.; Giri, J.; Goldberg, S. Aortic Stenosis: Pathophysiology, Diagnosis, and Therapy. Am. J. Med. 2017, 130, 253–263. [Google Scholar] [CrossRef]
- Grimard, B.H.; Safford, R.E.; Burns, E.L. Aortic Stenosis: Diagnosis and Treatment. Am. Fam. Physician 2016, 93, 371–378. [Google Scholar]
- Kanwar, A.; Thaden, J.J.; Nkomo, V.T. Management of Patients with Aortic Valve Stenosis. Mayo Clin. Proc. 2018, 93, 488–508. [Google Scholar] [CrossRef] [PubMed]
- Swift, S.L.; Puehler, T.; Misso, K.; Lang, S.H.; Forbes, C.; Kleijnen, J.; Danner, M.; Kuhn, C.; Haneya, A.; Seoudy, H.; et al. Transcatheter aortic valve implantation versus surgical aortic valve replacement in patients with severe aortic stenosis: A systematic review and meta-analysis. BMJ Open 2021, 11, e054222. [Google Scholar] [CrossRef]
- Jørgensen, T.H.; Thyregod, H.G.H.; Ihlemann, N.; Nissen, H.; Petursson, P.; Kjeldsen, B.J.; Steinbrüchel, D.A.; Olsen, P.S.; Søndergaard, L. Eight-year outcomes for patients with aortic valve stenosis at low surgical risk randomized to transcatheter vs. surgical aortic valve replacement. Eur. Heart J. 2021, 42, 2912–2919. [Google Scholar] [CrossRef] [PubMed]
- Lee, G.; Chikwe, J.; Milojevic, M.; Wijeysundera, H.C.; Biondi-Zoccai, G.; Flather, M.; Gaudino, M.F.L.; Fremes, S.E.; Tam, D.Y. ESC/EACTS vs. ACC/AHA guidelines for the management of severe aortic stenosis. Eur. Heart J. 2023, 44, 796–812. [Google Scholar] [CrossRef]
- Yurek, L.A.; Jakub, K.E.; Menacho, M.M. Severe Symptomatic Aortic Stenosis in Older Adults: Pathophysiology, Clinical Manifestations, Treatment Guidelines, and Transcatheter Aortic Valve Replacement (TAVR). J. Gerontol. Nurs. 2015, 41, 8–13. [Google Scholar] [CrossRef]
- Maeder, M.T.; Weber, L.; Rickli, H. Pulmonary hypertension in aortic valve stenosis. Trends Cardiovasc. Med. 2022, 32, 73–81. [Google Scholar] [CrossRef] [PubMed]
- Pardo Sanz, A.; Santoro, C.; Hinojar, R.; Salido, L.; Rajjoub, E.A.; Monteagudo, J.M.; García, A.; González, A.; Hernández-Antolín, R.; Sánchez Recalde, Á.; et al. Right ventricle assessment in patients with severe aortic stenosis undergoing transcatheter aortic valve implantation. Echocardiography 2020, 37, 586–591. [Google Scholar] [CrossRef]
- Ratwatte, S.; Stewart, S.; Strange, G.; Playford, D.; Celermajer, D.S. Prevalence of pulmonary hypertension in aortic stenosis and its influence on outcomes. Heart (Br. Card. Soc.) 2023, 109, 1319–1326. [Google Scholar] [CrossRef]
- Miyamoto, J.; Ohno, Y.; Kamioka, N.; Ikari, Y.; Otsuka, T.; Tada, N.; Naganuma, T.; Yamawaki, M.; Yamanaka, F.; Shirai, S.; et al. Impact of Periprocedural Pulmonary Hypertension on Outcomes after Transcatheter Aortic Valve Replacement. J. Am. Coll. Cardiol. 2022, 80, 1601–1613. [Google Scholar] [CrossRef]
- Alushi, B.; Beckhoff, F.; Leistner, D.; Franz, M.; Reinthaler, M.; Stähli, B.E.; Morguet, A.; Figulla, H.R.; Doenst, T.; Maisano, F.; et al. Pulmonary Hypertension in Patients with Severe Aortic Stenosis: Prognostic Impact after Transcatheter Aortic Valve Replacement: Pulmonary Hypertension in Patients Undergoing TAVR. JACC Cardiovasc. Imaging 2019, 12, 591–601. [Google Scholar] [CrossRef]
- Wang, W.; Yu, K.; Zhao, S.Y.; Mo, D.G.; Liu, J.H.; Han, L.J.; Li, T.; Yao, H.C. The impact of circulating IGF-1 and IGFBP-2 on cardiovascular prognosis in patients with acute coronary syndrome. Front. Cardiovasc. Med. 2023, 10, 1126093. [Google Scholar] [CrossRef]
- Hoeflich, A.; David, R.; Hjortebjerg, R. Current IGFBP-Related Biomarker Research in Cardiovascular Disease-We Need More Structural and Functional Information in Clinical Studies. Front. Endocrinol. 2018, 9, 388. [Google Scholar] [CrossRef]
- Muessig, J.M.; Lichtenauer, M.; Wernly, B.; Kelm, M.; Franz, M.; Bäz, L.; Schulze, P.C.; Racher, V.; Zimmermann, G.; Figulla, H.R.; et al. Insulin like growth factor binding protein 2 (IGFBP-2) for risk prediction in patients with severe aortic stenosis undergoing Transcatheter Aortic Valve Implantation (TAVI). Int. J. Cardiol. 2019, 277, 54–59. [Google Scholar] [CrossRef]
- Généreux, P.; Pibarot, P.; Redfors, B.; Mack, M.J.; Makkar, R.R.; Jaber, W.A.; Svensson, L.G.; Kapadia, S.; Tuzcu, E.M.; Thourani, V.H.; et al. Staging classification of aortic stenosis based on the extent of cardiac damage. Eur. Heart J. 2017, 38, 3351–3358. [Google Scholar] [CrossRef]
- Ahn, H.S.; Chang, S.A.; Kim, H.K.; Kim, S.J.; Lee, S.P.; Park, S.J.; Kim, Y.J.; Cho, G.Y.; Sohn, D.W.; Oh, J.K. Determinants of pulmonary hypertension development in moderate or severe aortic stenosis. Int. J. Cardiovasc. Imaging 2014, 30, 1519–1528. [Google Scholar] [CrossRef]
- Vahanian, A.; Beyersdorf, F.; Praz, F.; Milojevic, M.; Baldus, S.; Bauersachs, J.; Capodanno, D.; Conradi, L.; De Bonis, M.; De Paulis, R.; et al. 2021 ESC/EACTS Guidelines for the management of valvular heart disease. Eur. Heart J. 2022, 43, 561–632. [Google Scholar] [CrossRef]
- D’Ascenzo, F.; Conrotto, F.; Salizzoni, S.; Rossi, M.L.; Nijhoff, F.; Gasparetto, V.; Barbanti, M.; Mennuni, M.; Omedè, P.; Grosso Marra, W.; et al. Incidence, predictors, and impact on prognosis of systolic pulmonary artery pressure and its improvement after transcatheter aortic valve implantation: A multicenter registry. J. Invasive Cardiol. 2015, 27, 114–119. [Google Scholar]
- Schewel, J.; Schlüter, M.; Schmidt, T.; Kuck, K.H.; Frerker, C.; Schewel, D. Correlation between Doppler echocardiography and right heart catheterization assessment of systolic pulmonary artery pressure in patients with severe aortic stenosis. Echocardiography 2020, 37, 380–387. [Google Scholar] [CrossRef]
- Vogelmeier, C.F.; Criner, G.J.; Martinez, F.J.; Anzueto, A.; Barnes, P.J.; Bourbeau, J.; Celli, B.R.; Chen, R.; Decramer, M.; Fabbri, L.M.; et al. Global Strategy for the Diagnosis, Management, and Prevention of Chronic Obstructive Lung Disease 2017 Report. GOLD Executive Summary. Am. J. Respir. Crit. Care Med. 2017, 195, 557–582. [Google Scholar] [CrossRef] [PubMed]
- Yang, J.; Griffiths, M.; Nies, M.K.; Brandal, S.; Damico, R.; Vaidya, D.; Tao, X.; Simpson, C.E.; Kolb, T.M.; Mathai, S.C.; et al. Insulin-like growth factor binding protein-2: A new circulating indicator of pulmonary arterial hypertension severity and survival. BMC Med. 2020, 18, 268. [Google Scholar] [CrossRef]
- Griffiths, M.; Yang, J.; Nies, M.; Vaidya, D.; Brandal, S.; Williams, M.; Matsui, E.C.; Grant, T.; Damico, R.; Ivy, D.; et al. Pediatric pulmonary hypertension: Insulin-like growth factor-binding protein 2 is a novel marker associated with disease severity and survival. Pediatr. Res. 2020, 88, 850–856. [Google Scholar] [CrossRef] [PubMed]
- Guiot, J.; Bondue, B.; Henket, M.; Corhay, J.L.; Louis, R. Raised serum levels of IGFBP-1 and IGFBP-2 in idiopathic pulmonary fibrosis. BMC Pulm. Med. 2016, 16, 86. [Google Scholar] [CrossRef]
- Slater, T.; Haywood, N.J.; Matthews, C.; Cheema, H.; Wheatcroft, S.B. Insulin-like growth factor binding proteins and angiogenesis: From cancer to cardiovascular disease. Cytokine Growth Factor Rev. 2019, 46, 28–35. [Google Scholar] [CrossRef] [PubMed]
- Bauer, Y.; de Bernard, S.; Hickey, P.; Ballard, K.; Cruz, J.; Cornelisse, P.; Chadha-Boreham, H.; Distler, O.; Rosenberg, D.; Doelberg, M.; et al. Identifying early pulmonary arterial hypertension biomarkers in systemic sclerosis: Machine learning on proteomics from the DETECT cohort. Eur. Respir. J. 2021, 57, 2002591. [Google Scholar] [CrossRef]
- Jacquerie, P.; Henket, M.; André, B.; Moermans, C.; de Seny, D.; Gester, F.; Louis, R.; Malaise, M.; Guiot, J. Inflammatory profile of induced sputum composition in systemic sclerosis and comparison with healthy volunteers. Sci. Rep. 2021, 11, 10679. [Google Scholar] [CrossRef] [PubMed]
- Street, M.E.; Ziveri, M.A.; Spaggiari, C.; Viani, I.; Volta, C.; Grzincich, G.L.; Virdis, R.; Bernasconi, S. Inflammation is a modulator of the insulin-like growth factor (IGF)/IGF-binding protein system inducing reduced bioactivity of IGFs in cystic fibrosis. Eur. J. Endocrinol. 2006, 154, 47–52. [Google Scholar] [CrossRef]
- Guiot, J.; Njock, M.S.; André, B.; Gester, F.; Henket, M.; de Seny, D.; Moermans, C.; Malaise, M.G.; Louis, R. Serum IGFBP-2 in systemic sclerosis as a prognostic factor of lung dysfunction. Sci. Rep. 2021, 11, 10882. [Google Scholar] [CrossRef]
- Habeb, M.; Embarak, S.; Fathy, A.; Zalat, M. Non-invasive IGFBP1, IGFBP2 biomarkers as predictors and outcomes of usual interstitial pneumonia (UIP) therapeutic response. Egypt. J. Bronchol. 2021, 15, 6. [Google Scholar] [CrossRef]
- Kletzer, J.; Hecht, S.; Ramsauer, S.; Scharinger, B.; Kaufmann, R.; Kammler, J.; Kellermair, J.; Akbari, K.; Blessberger, H.; Steinwender, C.; et al. A Story of PA/BSA and Biomarkers to Diagnose Pulmonary Hypertension in Patients with Severe Aortic Valve Stenosis-The Rise of IGF-BP2 and GDF-15. J. Cardiovasc. Dev. Dis. 2023, 10, 22. [Google Scholar] [CrossRef] [PubMed]
- Rodriguez-Arias, J.J.; García-Álvarez, A. Sex Differences in Pulmonary Hypertension. Front. Aging 2021, 2, 727558. [Google Scholar] [CrossRef] [PubMed]
- Mair, K.M.; Johansen, A.K.; Wright, A.F.; Wallace, E.; MacLean, M.R. Pulmonary arterial hypertension: Basis of sex differences in incidence and treatment response. Br. J. Pharmacol. 2014, 171, 567–579. [Google Scholar] [CrossRef] [PubMed]
- Cardona-Gómez, G.P.; Chowen, J.A.; Garcia-Segura, L.M. Estradiol and progesterone regulate the expression of insulin-like growth factor-I receptor and insulin-like growth factor binding protein-2 in the hypothalamus of adult female rats. J. Neurobiol. 2000, 43, 269–281. [Google Scholar] [CrossRef]
- Rauzier, C.; Chartrand, D.J.; Alméras, N.; Lemieux, I.; Larose, E.; Mathieu, P.; Pibarot, P.; Lamarche, B.; Rhéaume, C.; Poirier, P.; et al. Associations of insulin-like growth factor binding protein-2 with metabolic profile and hepatic fat deposition in asymptomatic men and women. American journal of physiology. Endocrinol. Metab. 2023, 325, E99–E105. [Google Scholar] [CrossRef] [PubMed]
- van den Beld, A.W.; Carlson, O.D.; Doyle, M.E.; Rizopoulos, D.; Ferrucci, L.; van der Lely, A.J.; Egan, J.M. IGFBP-2 and aging: A 20-year longitudinal study on IGFBP-2, IGF-I, BMI, insulin sensitivity and mortality in an aging population. Eur. J. Endocrinol. 2019, 180, 109–116. [Google Scholar] [CrossRef] [PubMed]
- Feng, N.; Zhang, Z.; Wang, Z.; Zheng, H.; Qu, F.; He, X.; Wang, C. Insulin-like Growth Factor Binding Protein-2 Promotes Adhesion of Endothelial Progenitor Cells to Endothelial Cells via Integrin α5β1. J. Mol. Neurosci. 2015, 57, 426–434. [Google Scholar] [CrossRef]
- Bach, L.A. Endothelial cells and the IGF system. J. Mol. Endocrinol. 2015, 54, R1–R13. [Google Scholar] [CrossRef]
- Boxhammer, E.; Dienhart, C.; Kletzer, J.; Ramsauer, S.; Kopp, K.; Prinz, E.; Wintersteller, W.; Blessberger, H.; Hammerer, M.; Steinwender, C.; et al. Elevated systolic pulmonary artery pressure is a substantial predictor of increased mortality after transcatheter aortic valve replacement in males, not in females. Clin. Res. Cardiol. Off. J. Ger. Card. Soc. 2024, 113, 138–155. [Google Scholar] [CrossRef]


| Total | Men | Women | p-Value | |
|---|---|---|---|---|
| No. (%) | ||||
| Total | 102 (100.0) | 56 (54.9) | 46 (45.1) | 0.215 |
| Age | ||||
| 60–69 | 4 (3.9) | 3 (5.4) | 1 (2.2) | 0.410 |
| 70–79 | 22 (21.6) | 15 (26.8) | 7 (15.2) | 0.158 |
| 80–89 | 68 (66.7) | 35 (62.5) | 33 (71.7) | 0.325 |
| ≥90 | 8 (7.8) | 3 (5.4) | 5 (10.9) | 0.303 |
| BMI | ||||
| <18.5 | 1 (1.0) | 0 (0.0) | 1 (2.2) | 0.879 |
| 18.5–24.9 | 46 (45.1) | 25 (44.6) | 21 (45.7) | 0.794 |
| 25.0–29.9 | 37 (36.3) | 23 (41.1) | 14 (30.4) | 0.719 |
| 30.0–34.9 | 13 (12.7) | 5 (8.9) | 8 (17.4) | 0.038 |
| 35.0–39.9 | 5 (4.9) | 3 (5.4) | 2 (4.3) | 0.072 |
| ≥40.0 | 0 (0.0) | 0 (0.0) | 0 (0.0) | 1.000 |
| NYHA ≥ III | 77 (75.5) | 41 (73.2) | 36 (78.3) | 0.520 |
| Diabetes mellitus | 28 (27.5) | 13 (23.2) | 15 (32.6) | 0.290 |
| Arterial hypertension | 85 (83.3) | 47 (83.9) | 38 (82.6) | 0.859 |
| CVD | 62 (60.8) | 36 (64.3) | 26 (56.5) | 0.424 |
| Previous myocardial infarction | 4 (3.9) | 2 (3.6) | 2 (4.3) | 0.841 |
| Atrial fibrillation | 29 (28.4) | 13 (23.2) | 16 (34.8) | 0.197 |
| Previous cardiac surgery | 3 (2.9) | 3 (5.4) | 0 (0.0) | 0.111 |
| Pacemaker (before TAVR) | 5 (4.9) | 3 (5.4) | 2 (4.3) | 0.814 |
| Malignancy | 24 (23.5) | 15 (26.8) | 9 (19.6) | 0.392 |
| Stroke (before TAVR) | 9 (8.8) | 5 (8.9) | 4 (8.7) | 0.967 |
| PAOD | 10 (9.8) | 4 (7.1) | 6 (13.0) | 0.319 |
| COPD | 8 (7.8) | 5 (8.9) | 3 (8.7) | 0.653 |
| COPD Gold 1 | 2 (2.0) | 1 (1.8) | 1 (2.2) | 0.888 |
| COPD Gold 2 | 3 (2.9) | 1 (1.8) | 2 (4.3) | 0.446 |
| COPD Gold 3 | 3 (2.9) | 3 (5.4) | 0 (0.0) | 0.111 |
| COPD Gold 4 | 0 (0.0) | 0 (0.0) | 0 (0.0) | 1.000 |
| Pacemaker (after TAVR) | 14 (13.7) | 6 (10.7) | 8 (17.4) | 0.771 |
| Vascular complications | 11 (10.8) | 6 (10.7) | 5 (10.9) | 0.980 |
| Stroke (after TAVR) | 0 (0.0) | 0 (0.0) | 0 (0.0) | 1.000 |
| Classification of aortic stenosis | ||||
| (Généreux et al. [16]) | ||||
| Stage 0 | 7 (6.9) | 5 (8.9) | 2 (4.3) | 0.363 |
| Stage 1 | 12 (11.8) | 5 (8.9) | 7 (15.2) | 0.327 |
| Stage 2 | 44 (43.1) | 24 (42.9) | 20 (43.5) | 0.950 |
| Stage 3 | 33 (32.4) | 17 (30.4) | 16 (34.8) | 0.635 |
| Stage 4 | 6 (5.9) | 5 (8.9) | 1 (2.2) | 0.149 |
| Mean ± SD | ||||
| Age (years) | 82.3 ± 5.4 | 81.5 ± 5.7 | 83.3 ± 4.9 | 0.100 |
| Height (cm) | 167.9 ± 8.7 | 173.6 ± 5.4 | 160.4 ± 6.0 | <0.001 |
| Weight (kg) | 73.9 ± 13.1 | 78.9 ± 13.7 | 67.4 ± 9.0 | <0.001 |
| BMI (kg/m2) | 26.2 ± 4.0 | 26.1 ± 4.4 | 26.3 ± 3.5 | 0.812 |
| Median ± IQR | ||||
| STS score | 2.6 ± 1.9 | 2.0 ± 1.2 | 3.5 ± 2.3 | <0.001 |
| Creatinine (mg/dL) | 1.0 ± 0.5 | 1.1 ± 0.5 | 1.0 ± 0.4 | 0.327 |
| BNP (pg/mL) | 1591.0 ± 3041.3 | 1459.5 ± 3482.2 | 1591.0 ± 2324.1 | 0.543 |
| HK (%) | 38.9 ± 7.0 | 40.3 ± 8.0 | 37.8 ± 5.4 | 0.137 |
| HB (g/dL) | 13.0 ± 2.4 | 13.5 ± 2.9 | 12.7 ± 1.8 | 0.041 |
| CK (U/L) | 78.0 ± 79.0 | 79.5 ± 94.5 | 74.0 ± 57.0 | 0.289 |
| Total | Men | Women | p-Value | |
|---|---|---|---|---|
| Echocardiography pre-TAVR | ||||
| No. (%) | ||||
| LVEF | ||||
| ≤30 | 6 (5.9) | 4 (7.2) | 2 (4.3) | 0.164 |
| 31–54 | 30 (29.4) | 14 (25.0) | 16 (34.8) | 0.150 |
| ≥55 | 66 (64.7) | 38 (67.8) | 28 (60.9) | 0.499 |
| sPAP | ||||
| ≥40 | 59 (57.8) | 33 (58.9) | 26 (56.5) | 0.807 |
| ≥45 | 47 (46.1) | 25 (44.6) | 22 (47.8) | 0.748 |
| ≥50 | 32 (31.4) | 16 (28.6) | 16 (34.8) | 0.501 |
| ≥60 | 20 (19.6) | 13 (23.2) | 7 (15.2) | 0.311 |
| AVI ≥ II° | 27 (26.4) | 16 (28.6) | 11 (23.9) | 0.036 |
| MVI ≥ II° | 39 (38.2) | 17 (30.4) | 22 (47.8) | 0.026 |
| TVI ≥ II° | 27 (26.5) | 12 (21.4) | 15 (34.9) | 0.109 |
| Mean ± SD | ||||
| LVEF (%) | 53.4 ± 10.1 | 53.1 ± 11.6 | 53.7 ± 7.7 | 0.768 |
| LVEDD (mm) | 47.0 ± 6.1 | 47.9 ± 5.8 | 45.7 ± 6.2 | 0.101 |
| AV Vmax (m/s) | 4.4 ± 0.6 | 4.4 ± 0.4 | 4.4 ± 0.7 | 0.803 |
| AV dpmax (mmHg) | 81.2 ± 20.1 | 82.4 ± 14.7 | 79.8 ± 24.9 | 0.565 |
| AV dpmean (mmHg) | 49.3 ± 11.5 | 49.2 ± 8.5 | 49.50 ± 14.3 | 0.896 |
| TAPSE (mm) | 22.1 ± 3.7 | 22.5 ± 4.2 | 21.7 ± 3.2 | 0.348 |
| sPAP (mmHg) | 43.2 ± 19.6 | 44.0 ± 20.3 | 42.2 ± 18.9 | 0.654 |
| Echocardiography post-TAVR (before admission) | ||||
| No. (%) | ||||
| PVL ≥ II° | 17 (16.7) | 10 (17.8) | 7 (15.2) | 0.374 |
| MVI ≥ II° | 37 (36.3) | 16 (28.6) | 21 (45.7) | 0.076 |
| TVI ≥ II° | 28 (27.5) | 13 (23.2) | 15 (32.6) | 0.290 |
| Mean ± SD | ||||
| LVEF (%) | 54.1 ± 7.5 | 53.7 ± 8.3 | 54.5 ± 6.5 | 0.642 |
| LVEDD (mm) | 46.3 ± 6.1 | 46.2 ± 6.4 | 46.4 ± 6.5 | 0.855 |
| AV Vmax (m/s) | 1.9 ± 0.4 | 1.9 ± 0.5 | 1.9 ± 0.4 | 0.682 |
| AV dpmax (mmHg) | 16.4 ± 7.5 | 17.0 ± 8.6 | 15.4 ± 5.4 | 0.363 |
| AV dpmean (mmHg) | 8.3 ± 3.6 | 8.6 ± 4.0 | 7.9 ± 3.0 | 0.398 |
| TAPSE (mm) | 21.4 ± 4.3 | 21.8 ± 4.4 | 20.9 ± 4.2 | 0.343 |
| sPAP (mmHg) | 40.8 ± 16.5 | 42.6 ± 14.7 | 39.2 ± 18.1 | 0.388 |
| Total | Men | Women | p-Value | |
|---|---|---|---|---|
| Median ± IQR No. | ||||
| IGF-BP2 baseline (ng/mL) | 149.8 ± 112.6 102/102 | 133.4 ± 127.2 56/56 | 157.0 ± 111.5 46/46 | 0.775 |
| IGF-BP2 post 24 h (ng/mL) | 203.8 ± 145.7 99/102 | 189.0 + 148.9 54/56 | 221.4 ± 132.9 45/46 | 0.249 |
| IGF-BP2 post 96 h (ng/mL) | 168.1 ± 102.5 99/102 | 160.2 ± 131.5 54/56 | 178.1 ± 107.0 45/46 | 0.977 |
| IGF-BP2 post 3 months (ng/mL) | 169.0 ± 148.2 91/102 | 143.7 ± 101.1 47/56 | 216.4 ± 148.4 44/46 | 0.010 |
| sPAP | IGF-BP2 Baseline | IGF-BP2 Post 24 h | IGF-BP2 Post 96 h | IGF-BP2 Post 3 Months | ||||||
|---|---|---|---|---|---|---|---|---|---|---|
| r | p | r | p | r | p | r | p | r | p | |
| Age | 0.039 | 0.773 | 0.166 | 0.222 | 0.272 | 0.056 | 0.256 | 0.116 | 0.413 ** | 0.005 |
| Height | −0.100 | 0.478 | −0.036 | 0.798 | −0.062 | 0.679 | −0.058 | 0.737 | −0.048 | 0.760 |
| Weight | −0.197 | 0.152 | −0.376 ** | 0.005 | −0.407 ** | 0.004 | −0.365 * | 0.026 | −0.358 * | 0.017 |
| BMI | −0.165 | 0.237 | −0.369 ** | 0.007 | −0.397 ** | 0.006 | −0.333 * | 0.047 | −0.356 * | 0.019 |
| NYHA | 0.357 | 0.112 | 0.178 | 0.441 | 0.231 | 0.326 | 0.351 | 0.153 | 0.430 | 0.110 |
| STS score | 0.209 | 0.123 | 0.209 | 0.122 | 0.361 * | 0.010 | 0.173 | 0.291 | 0.395 ** | 0.007 |
| Diabetes mellitus | −0.240 | 0.075 | −0.110 | 0.420 | −0.114 | 0.432 | −0.088 | 0.593 | −0.050 | 0.743 |
| Arterial hypertension | 0.121 | 0.376 | 0.143 | 0.293 | 0.174 | 0.228 | 0.139 | 0.399 | −0.060 | 0.693 |
| CVD | −0.206 | 0.128 | 0.032 | 0.813 | 0.027 | 0.852 | −0.180 | 0.272 | −0.185 | 0.224 |
| Previous myocardial infarction | 0.084 | 0.541 | 0.292 * | 0.029 | 0.297 * | 0.036 | 0.289 | 0.074 | 0.244 | 0.107 |
| Atrial fibrillation | 0.243 | 0.072 | 0.207 | 0.126 | 0.230 | 0.107 | 0.225 | 0.168 | 0.191 | 0.209 |
| Previous cardiac surgery | 0.123 | 0.367 | −0.120 | 0.378 | −0.054 | 0.707 | 0.072 | 0.663 | 0.075 | 0.626 |
| Pacemaker (before TAVR) | −0.002 | 0.986 | 0.292 * | 0.029 | 0.255 | 0.074 | 0.186 | 0.257 | 0.268 | 0.078 |
| Malignancy | −0.326 * | 0.014 | 0.111 | 0.415 | −0.065 | 0.654 | −0.083 | 0.613 | 0.235 | 0.120 |
| Stroke (before TAVR) | −0.101 | 0.459 | −0.019 | 0.887 | −0.012 | 0.937 | −0.058 | 0.726 | −0.151 | 0.322 |
| PAOD | −0.024 | 0.836 | 0.047 | 0.730 | −0.166 | 0.248 | −0.077 | 0.641 | 0.024 | 0.875 |
| COPD | 0.146 | 0.284 | −0.141 | 0.299 | −0.095 | 0.513 | −0.207 | 0.207 | −0.185 | 0.223 |
| LVEF | −0.193 | 0.153 | −0.092 | 0.500 | −0.138 | 0.339 | −0.036 | 0.829 | −0.011 | 0.941 |
| LVEDD | 0.012 | 0.934 | −0.026 | 0.857 | 0.114 | 0.455 | 0.049 | 0.785 | 0.242 | 0.128 |
| AV Vmax | −0.150 | 0.330 | −0.055 | 0.725 | −0.084 | 0.606 | −0.098 | 0.600 | −0.100 | 0.563 |
| AV dpmax | −0.130 | 0.388 | 0.053 | 0.725 | −0.119 | 0.446 | −0.196 | 0.282 | −0.190 | 0.253 |
| AV dpmean | −0.102 | 0.490 | −0.058 | 0.695 | −0.198 | 0.198 | −0.269 | 0.136 | −0.225 | 0.162 |
| TAPSE | −0.189 | 0.214 | −0.114 | 0.455 | −0.064 | 0.697 | 0.028 | 0.885 | −0.309 | 0.075 |
| sPAP | 1.000 | - | 0.345 ** | 0.009 | 0.436 ** | 0.002 | 0.429 ** | 0.006 | 0.313 * | 0.036 |
| AVI ≥ II° | −0.165 | 0.329 | 0.089 | 0.599 | 0.200 | 0.271 | 0.218 | 0.255 | 0.080 | 0.659 |
| MVI ≥ II° | 0.147 | 0.286 | 0.185 | 0.175 | 0.211 | 0.146 | 0.202 | 0.218 | 0.080 | 0.604 |
| TVI ≥ II° | 0.417 ** | 0.002 | 0.183 | 0.186 | 0.213 | 0.146 | 0.265 | 0.108 | 0.082 | 0.602 |
| Creatinine | 0.171 | 0.208 | 0.536 *** | <0.001 | 0.442 ** | 0.001 | 0.289 | 0.074 | 0.465 ** | 0.001 |
| BNP | 0.458 ** | 0.002 | 0.451 ** | 0.002 | 0.343 * | 0.026 | 0.248 | 0.158 | 0.154 | 0.370 |
| HK | −0.413 ** | 0.002 | −0.307 * | 0.021 | −0.430 ** | 0.002 | −0.428 ** | 0.007 | −0.356 * | 0.016 |
| HB | −0.433 ** | 0.001 | −0.445 ** | 0.001 | −0.507 *** | <0.001 | −0.468 ** | 0.003 | −0.384 ** | 0.009 |
| CK | −0.073 | 0.616 | −0.006 | 0.966 | 0.025 | 0.871 | −0.066 | 0.710 | 0.197 | 0.230 |
| IGF-BP2 baseline | 0.345 ** | 0.009 | 1.000 | - | 0.870 *** | <0.001 | 0.738 *** | <0.001 | 0.842 *** | <0.001 |
| IGF-BP2 post 24 h | 0.436 ** | 0.002 | 0.870 *** | <0.001 | 1.000 | - | 0.876 *** | <0.001 | 0.833 *** | <0.001 |
| IGF-BP2 post 96 h | 0.429 ** | 0.006 | 0.738 *** | <0.001 | 0.876 *** | <0.001 | 1.000 | - | 0.837 *** | <0.001 |
| IGF-BP2 post 3 months | 0.313 * | 0.036 | 0.842 *** | <0.001 | 0.833 *** | <0.001 | 0.837 *** | <0.001 | 1.000 | - |
| sPAP | IGF-BP2 Baseline | IGF-BP2 Post 24 h | IGF-BP2 Post 96 h | IGF-BP2 Post 3 Months | ||||||
|---|---|---|---|---|---|---|---|---|---|---|
| r | p | r | p | r | p | r | p | r | p | |
| Age | 0.093 | 0.354 | 0.140 | 0.161 | 0.133 | 0.205 | 0.236 * | 0.046 | 0.394 *** | <0.001 |
| Gender | −0.001 | 0.989 | −0.028 | 0.777 | 0.121 | 0.251 | −0.003 | 0.978 | 0.284 ** | 0.009 |
| Height | 0.133 | 0.201 | 0.112 | 0.283 | −0.006 | 0.956 | 0.043 | 0.743 | −0.120 | 0.301 |
| Weight | −0.054 | 0.598 | −0.228 * | 0.025 | −0.291 ** | 0.006 | −0.278 * | 0.023 | −0.325 ** | 0.003 |
| BMI | −0.161 | 0.121 | −0.311 ** | 0.002 | −0.327 ** | 0.002 | −0.309 * | 0.012 | −0.277 * | 0.015 |
| NYHA | 0.186 | 0.196 | 0.091 | 0.531 | 0.199 | 0.176 | 0.143 | 0.360 | 0.369 * | 0.023 |
| STS score | 0.192 | 0.053 | 0.107 | 0.282 | 0.133 | 0.205 | 0.171 | 0.152 | 0.436 *** | <0.001 |
| Diabetes mellitus | 0.053 | 0.599 | −0.035 | 0.729 | −0.002 | 0.983 | 0.049 | 0.680 | −0.098 | 0.377 |
| Arterial hypertension | 0.054 | 0.592 | −0.025 | 0.806 | 0.060 | 0.567 | −0.006 | 0.958 | −0.073 | 0.514 |
| CVD | −0.125 | 0.211 | 0.031 | 0.754 | 0.072 | 0.493 | −0.111 | 0.353 | −0.211 | 0.055 |
| Previous myocardial infarction | −0.003 | 0.979 | 0.285 ** | 0.004 | 0.157 | 0.136 | 0.274 * | 0.020 | 0.145 | 0.189 |
| Atrial fibrillation | 0.316 ** | 0.001 | 0.064 | 0.521 | 0.064 | 0.544 | 0.055 | 0.649 | 0.151 | 0.173 |
| Previous cardiac surgery | 0.102 | 0.309 | −0.096 | 0.339 | −0.061 | 0.562 | 0.060 | 0.617 | 0.016 | 0.883 |
| Pacemaker (before TAVR) | −0.033 | 0.740 | 0.160 | 0.109 | 0.153 | 0.147 | 0.006 | 0.961 | 0.195 | 0.077 |
| Malignancy | −0.160 | 0.107 | 0.032 | 0.748 | −0.062 | 0.558 | −0.066 | 0.581 | 0.118 | 0.288 |
| Stroke (before TAVR) | −0.102 | 0.306 | −0.039 | 0.699 | −0.016 | 0.881 | −0.027 | 0.820 | −0.004 | 0.974 |
| PAOD | −0.028 | 0.780 | 0.041 | 0.679 | −0.061 | 0.562 | 0.019 | 0.873 | 0.108 | 0.333 |
| COPD | −0.015 | 0.882 | −0.022 | 0.824 | −0.084 | 0.425 | −0.108 | 0.368 | −0.145 | 0.192 |
| LVEF | −0.125 | 0.214 | −0.117 | 0.247 | −0.163 | 0.124 | −0.019 | 0.876 | −0.002 | 0.986 |
| LVEDD | −0.070 | 0.510 | −0.007 | 0.949 | 0.046 | 0.683 | −0.034 | 0.797 | 0.047 | 0.693 |
| AV Vmax | −0.084 | 0.453 | −0.052 | 0.644 | −0.080 | 0.498 | 0.009 | 0.945 | 0.033 | 0.791 |
| AV dpmax | −0.089 | 0.410 | 0.025 | 0.820 | −0.114 | 0.312 | −0.033 | 0.800 | 0.043 | 0.720 |
| AV dpmean | −0.044 | 0.683 | −0.036 | 0.738 | −0.045 | 0.688 | −0.047 | 0.716 | 0.021 | 0.855 |
| TAPSE | −0.270 * | 0.015 | 0.041 | 0.720 | −0.062 | 0.607 | 0.053 | 0.705 | −0.144 | 0.256 |
| sPAP | 1.000 | - | 0.287 ** | 0.003 | 0.345 ** | 0.001 | 0.379 ** | 0.001 | 0.275 * | 0.012 |
| AVI ≥ II° | −0.006 | 0.965 | 0.071 | 0.575 | 0.253 | 0.055 | 0.161 | 0.279 | 0.200 | 0.144 |
| MVI ≥ II° | 0.173 | 0.089 | 0.147 | 0.149 | 0.132 | 0.220 | 0.216 | 0.075 | 0.213 | 0.060 |
| TVI ≥ II° | 0.418 *** | <0.001 | 0.127 | 0.216 | 0.150 | 0.166 | 0.239 * | 0.049 | 0.119 | 0.301 |
| Creatinine | 0.233 * | 0.018 | 0.464 *** | <0.001 | 0.351 ** | 0.001 | 0.291 * | 0.013 | 0.395 *** | <0.001 |
| BNP | 0.366 ** | 0.001 | 0.431 *** | <0.001 | 0.333 ** | 0.004 | 0.272 * | 0.034 | 0.185 | 0.131 |
| HK | −0.344 *** | < 0.001 | −0.242 * | 0.014 | −0.378 *** | <0.001 | −0.352 ** | 0.002 | −0.328 ** | 0.002 |
| HB | −0.332 ** | 0.001 | −0.330 ** | 0.001 | −0.384 *** | <0.001 | −0.377 ** | 0.001 | −0.360 ** | 0.001 |
| CK | −0.046 | 0.662 | 0.009 | 0.933 | 0.017 | 0.882 | −0.062 | 0.622 | 0.085 | 0.468 |
| IGF-BP2 baseline | 0.287 ** | 0.003 | 1.000 | - | 0.776 *** | <0.001 | 0.735 *** | <0.001 | 0.691 *** | <0.001 |
| IGF-BP2 24 h post-TAVR | 0.345 *** | 0.001 | 0.776 *** | <0.001 | 1.000 | - | 0.799 *** | <0.001 | 0.657 *** | <0.001 |
| IGF-BP2 96 h post-TAVR | 0.379 *** | 0.001 | 0.735 *** | <0.001 | 0.799 *** | <0.001 | 1.000 | - | 0.734 *** | <0.001 |
| IGF-BP2 3 months post-TAVR | 0.275 * | 0.012 | 0.691 *** | <0.001 | 0.657 *** | <0.001 | 0.734 *** | <0.001 | 1.000 | - |
| sPAP | IGF-BP2 Baseline | IGF-BP2 Post 24 h | IGF-BP2 Post 96 h | IGF-BP2 Post 3 Months | ||||||
|---|---|---|---|---|---|---|---|---|---|---|
| r | p | r | p | r | p | r | p | r | p | |
| Age | 0.196 | 0.192 | 0.170 | 0.259 | 0.171 | 0.280 | 0.317 | 0.073 | 0.241 | 0.145 |
| Height | 0.364 * | 0.019 | 0.249 | 0.095 | −0.125 | 0.428 | 0.338 | 0.054 | 0.317 | 0.053 |
| Weight | 0.074 | 0.642 | −0.036 | 0.824 | −0.050 | 0.770 | −0.124 | 0.514 | 0.006 | 0.973 |
| BMI | −0.153 | 0.340 | −0.143 | 0.404 | −0.162 | 0.337 | −0.261 | 0.164 | −0.174 | 0.325 |
| NYHA | −0.015 | 0.937 | 0.010 | 0.958 | 0.172 | 0.380 | −0.083 | 0.693 | 0.398 | 0.060 |
| STS score | 0.264 | 0.077 | 0.259 | 0.083 | −0.045 | 0.775 | 0.517 ** | 0.001 | 0.454 ** | 0.004 |
| Diabetes mellitus | 0.418 ** | 0.004 | 0.033 | 0.827 | 0.055 | 0.728 | 0.179 | 0.320 | −0.320 * | 0.050 |
| Arterial hypertension | −0.037 | 0.808 | −0.264 | 0.077 | −0.65 | 0.682 | −0.198 | 0.269 | −0.071 | 0.671 |
| CVD | −0.008 | 0.956 | 0.050 | 0.744 | 0.140 | 0.376 | −0.064 | 0.724 | −0.277 | 0.092 |
| Previous myocardial infarction | −0.109 | 0.472 | 0.289 | 0.051 | −0.018 | 0.908 | 0.223 | 0.213 | −0.064 | 0.701 |
| Atrial fibrillation | 0.413 ** | 0.004 | −0.124 | 0.412 | −0.085 | 0.593 | −0.0176 | 0.328 | 0.099 | 0.556 |
| Pacemaker (before TAVR) | −0.084 | 0.577 | −0.088 | 0.559 | −0.028 | 0.862 | −0.240 | 0.178 | 0.142 | 0.394 |
| Malignancy | 0.070 | 0.642 | −0.134 | 0.374 | −0.093 | 0.557 | −0.016 | 0.931 | −0.035 | 0.833 |
| Stroke (before TAVR) | −0.099 | 0.513 | −0.058 | 0.701 | 0.040 | 0.801 | 0.000 | 1.000 | 0.133 | 0.426 |
| PAOD | −0.010 | 0.949 | 0.063 | 0.676 | 0.022 | 0.888 | 0.091 | 0.615 | 0.245 | 0.139 |
| COPD | −0.239 | 0.109 | 0.149 | 0.322 | −0.057 | 0.719 | 0.000 | 1.000 | −0.011 | 0.949 |
| LVEF | 0.010 | 0.947 | −0.265 | 0.082 | −0.234 | 0.147 | 0.145 | 0.438 | 0.036 | 0.835 |
| LVEDD | −0.186 | 0.258 | −0.085 | 0.608 | −0.074 | 0.673 | −0.222 | 0.265 | −0.180 | 0.333 |
| AV Vmax | −0.037 | 0.823 | −0.071 | 0.672 | −0.089 | 0.618 | 0.224 | 0.282 | 0.197 | 0.297 |
| AV dpmax | −0.073 | 0.648 | −0.056 | 0.726 | −0.149 | 0.373 | 0.203 | 0.282 | 0.251 | 0.146 |
| AV dpmean | −0.003 | 0.984 | −0.015 | 0.923 | 0.115 | 0.490 | 0.237 | 0.207 | 0.231 | 0.182 |
| TAPSE | −0.461 ** | 0.004 | −0.090 | 0.592 | −0.343 * | 0.047 | −0.127 | 0.536 | −0.139 | 0.457 |
| sPAP | 1.000 | - | 0.170 | 0.259 | 0.171 | 0.280 | 0.317 | 0.073 | 0.241 | 0.145 |
| AVI ≥ II° | 0.217 | 0.266 | 0.113 | 0.566 | 0.368 | 0.064 | 0.161 | 0.524 | 0.255 | 0.252 |
| MVI ≥ II° | 0.225 | 0.146 | 0.135 | 0.388 | −0.014 | 0.934 | 0.278 | 0.137 | 0.198 | 0.254 |
| TVI ≥ II° | 0.471 ** | 0.001 | 0.079 | 0.616 | 0.131 | 0.426 | 0.221 | 0.241 | 0.140 | 0.422 |
| Creatinine | 0.342 * | 0.020 | 0.151 | 0.315 | 0.113 | 0.475 | 0.345 * | 0.049 | 0.348 * | 0.032 |
| BNP | 0.199 | 0.245 | 0.171 | 0.319 | 0.270 | 0.135 | 0.347 | 0.077 | 0.329 | 0.066 |
| HK | −0.264 | 0.076 | −0.213 | 0.156 | −0.306 * | 0.049 | −0.352 * | 0.045 | −0.259 | 0.117 |
| HB | −0.213 | 0156 | −0.163 | 0.279 | −0.142 | 0.370 | −0.336 | 0.056 | −0.274 | 0.096 |
| CK | 0.025 | 0.873 | −0.114 | 0.467 | −0.043 | 0.795 | −0.262 | 0.155 | −0.187 | 0.275 |
| IGF-BP2 baseline | 0.170 | 0.259 | 1.000 | - | 0.422 ** | 0.005 | 0.791 *** | <0.001 | 0.416 ** | 0.009 |
| IGF-BP2 24 h post-TAVR | 0.171 | 0.280 | 0.422 ** | 0.005 | 1.000 | - | 0.430 * | 0.012 | 0.335 * | 0.049 |
| IGF-BP2 96 h post-TAVR | 0.317 | 0.073 | 0.791 *** | <0.001 | 0.430 * | 0.012 | 1.000 | - | 0.586 ** | 0.001 |
| IGF-BP2 3 months post-TAVR | 0.241 | 0.145 | 0.416 ** | 0.009 | 0.335 * | 0.049 | 0.586 ** | 0.001 | 1.000 | - |
| Cox Regression Analysis Male | Univariate | Multivariable | ||
|---|---|---|---|---|
| Hazard Ratio (95% CI) | p-Value | Hazard Ratio (95% CI) | p-Value | |
| 1-year mortality | ||||
| sPAP | 2.228 (1.345–3.691) | 0.002 | 1.717 (0.979–3.012) | 0.059 |
| Creatinine | 738.274 (4.079–13,363.957) | 0.013 | 4.362 (0.004–4686.232) | 0.679 |
| IGF-BP2 (baseline) | 1.665 (1.185–2.340) | 0.003 | 1.400 (1.037–1.891) | 0.028 |
| IGF-BP2 (24 h post-TAVR) | 1.585 (1.136–2.211) | 0.007 | 0.720 (0.350–1.481) | 0.372 |
| 3-year mortality | ||||
| CVD | 0.416 (0.160–1.080) | 0.071 | 0.633 (0.227–1.764) | 0.381 |
| sPAP | 1.835 (1.206–2.792) | 0.005 | 1.450 (0.912–2.305) | 0.117 |
| Creatinine | 141.341 (0.558–35,785.880) | 0.080 | 1.142 (0.001–922.085) | 0.969 |
| IGF-BP2 (baseline) | 1.593 (1.125–2.256) | 0.009 | 1.531 (1.180–1.986) | 0.001 |
| IGF-BP2 (24 h post-TAVR) | 1.529 (1.104–2.117) | 0.011 | 0.812 (0.411–1.603) | 0.548 |
| 5-year mortality | ||||
| STS score | 1.473 (0.991–2.190) | 0.055 | 0.758 (0.327–1.758) | 0.519 |
| sPAP | 1.480 (1.041–2.105) | 0.029 | 1.261 (0.795–2.000) | 0.325 |
| Creatinine | 491.644 (4.622–52,298.685) | 0.009 | 1.286 (0.000–570.455) | 0.970 |
| IGF-BP2 (baseline) | 1.659 (1.201–2.291) | 0.002 | 1.462 (1.075–1.988) | 0.016 |
| IGF-BP2 (24 h post-TAVR) | 1.490 (1.092–2.035) | 0.012 | 0.858 (0.354–2.077) | 0.734 |
| IGF-BP2 (96 h post-TAVR) | 1.340 (0.998–1.800) | 0.052 | 1.125 (0.504–2.512) | 0.774 |
| Cox Regression Analysis Male + sPAP ≥ 40 mmHg | Univariate | Multivariable | ||
|---|---|---|---|---|
| Hazard Ratio (95% CI) | p-Value | Hazard Ratio (95% CI) | p-Value | |
| 1-year mortality | ||||
| Age | 0.686 (0.444–1.061) | 0.090 | 0.622 (0.385–1.005) | 0.052 |
| Creatinine | 112.859 (0.458–27,780.164) | 0.092 | 1.005 (0.001–726.721) | 0.999 |
| IGF-BP2 (baseline) | 1.356 (1.027–1.791) | 0.032 | 1.458 (1.097–1.938) | 0.009 |
| IGF-BP2 (24 h post-TAVR) | 1.402 (0.980–2.007) | 0.065 | 1.186 (0.501–2.805) | 0.698 |
| 3-year mortality | ||||
| IGF-BP2 (baseline) | 1.317 (0.991–1.750) | 0.058 | 1.387 (1.053–1.827) | 0.020 |
| IGF-BP2 (24 h post-TAVR) | 1.348 (0.945–1.922) | 0.099 | 0.835 (0.381–1.833) | 0.653 |
| 5-year mortality | ||||
| BMI | 1.513 (0.943–2.429) | 0.086 | 1.702 (0.966–2.999) | 0.066 |
| TVI ≥ II° | 0.189 (0.043–0.823) | 0.027 | 0.201 (0.043–0.926) | 0.040 |
| IGF-BP2 (baseline) | 1.346 (1.024–1.768) | 0.033 | 1.649 (1.162–2.339) | 0.005 |
| Univariate Cox Regression Analysis | Male | Male + sPAP ≥ 40 mmHg | ||
|---|---|---|---|---|
| Hazard Ratio (95% CI) | p-Value | Hazard Ratio (95% CI) | p-Value | |
| 1-year mortality | ||||
| IGF-BP2 (baseline) > 100 ng/mL | 0.734 (0.161–3.353) | 0.690 | 0.437 (0.094–2.033) | 0.291 |
| IGF-BP2 (baseline) > 200 ng/mL | 1.416 (0.457–4.393) | 0.547 | 1.030 (0.314–3.376) | 0.962 |
| IGF-BP2 (baseline) > 300 ng/mL | 2.532 (0.761–8.422) | 0.130 | 2.381 (0.694–8.167) | 0.168 |
| IGF-BP2 (baseline) > 400 ng/mL | 3.502 (1.051–11.671) | 0.041 | 3.071 (0.893–10.567) | 0.075 |
| IGF-BP2 (baseline) > 500 ng/mL | 7.320 (2.166–24.735) | 0.001 | 6.491 (1.828–23.044) | 0.004 |
| IGF-BP2 (baseline) > 600 ng/mL | 11.258 (3.249–39.010) | <0.001 | 6.491 (1.828–23.044) | 0.004 |
| 3-year mortality | ||||
| IGF-BP2 (baseline) > 100 ng/mL | 0.703 (0.202–2.449) | 0.580 | 0.383 (0.107–1.363) | 0.138 |
| IGF-BP2 (baseline) > 200 ng/mL | 1.258 (0.485–3.262) | 0.637 | 0.956 (0.346–2.639) | 0.931 |
| IGF-BP2 (baseline) > 300 ng/mL | 1.633 (0.532–5.017) | 0.392 | 1.645 (0.521–5.191) | 0.396 |
| IGF-BP2 (baseline) > 400 ng/mL | 2.341 (0.760–7.207) | 0.138 | 2.220 (0.700–7.045) | 0.176 |
| IGF-BP2 (baseline) > 500 ng/mL | 5.720 (1.812–18.058) | 0.003 | 6.491 (1.828–23.044) | 0.004 |
| IGF-BP2 (baseline) > 600 ng/mL | 11.258 (3.249–39.010) | <0.001 | 6.491 (1.828–23.044) | 0.004 |
| 5-year mortality | ||||
| IGF-BP2 (baseline) > 100 ng/mL | 1.138 (0.340–3.805) | 0.834 | 0.475 (0.138–1.638) | 0.238 |
| IGF-BP2 (baseline) > 200 ng/mL | 1.623 (0.740–3.561) | 0.227 | 1.182 (0.475–2.943) | 0.719 |
| IGF-BP2 (baseline) > 300 ng/mL | 2.224 (0.927–5.340) | 0.074 | 2.255 (0.850–5.985) | 0.102 |
| IGF-BP2 (baseline) > 400 ng/mL | 2.678 (1.064–6.739) | 0.036 | 2.333 (0.832–6.545) | 0.108 |
| IGF-BP2 (baseline) > 500 ng/mL | 4.147 (1.392–12.360) | 0.011 | 6.491 (1.828–23.044) | 0.004 |
| IGF-BP2 (baseline) > 600 ng/mL | 11.258 (3.249–39.010) | <0.001 | 6.491 (1.828–23.044) | 0.004 |
Disclaimer/Publisher’s Note: The statements, opinions and data contained in all publications are solely those of the individual author(s) and contributor(s) and not of MDPI and/or the editor(s). MDPI and/or the editor(s) disclaim responsibility for any injury to people or property resulting from any ideas, methods, instructions or products referred to in the content. |
© 2024 by the authors. Licensee MDPI, Basel, Switzerland. This article is an open access article distributed under the terms and conditions of the Creative Commons Attribution (CC BY) license (https://creativecommons.org/licenses/by/4.0/).
Share and Cite
Boxhammer, E.; Paar, V.; Kopp, K.; Gharibeh, S.X.; Bovenkamp-Aberger, E.; Rezar, R.; Lichtenauer, M.; Hoppe, U.C.; Mirna, M. Insulin-like Growth Factor-Binding Protein 2 in Severe Aortic Valve Stenosis and Pulmonary Hypertension: A Gender-Based Perspective. Int. J. Mol. Sci. 2024, 25, 8220. https://doi.org/10.3390/ijms25158220
Boxhammer E, Paar V, Kopp K, Gharibeh SX, Bovenkamp-Aberger E, Rezar R, Lichtenauer M, Hoppe UC, Mirna M. Insulin-like Growth Factor-Binding Protein 2 in Severe Aortic Valve Stenosis and Pulmonary Hypertension: A Gender-Based Perspective. International Journal of Molecular Sciences. 2024; 25(15):8220. https://doi.org/10.3390/ijms25158220
Chicago/Turabian StyleBoxhammer, Elke, Vera Paar, Kristen Kopp, Sarah X. Gharibeh, Evelyn Bovenkamp-Aberger, Richard Rezar, Michael Lichtenauer, Uta C. Hoppe, and Moritz Mirna. 2024. "Insulin-like Growth Factor-Binding Protein 2 in Severe Aortic Valve Stenosis and Pulmonary Hypertension: A Gender-Based Perspective" International Journal of Molecular Sciences 25, no. 15: 8220. https://doi.org/10.3390/ijms25158220