
Interactions between Inhibitors and 5-Lipoxygenase: Insights from Gaussian Accelerated Molecular Dynamics and Markov State Models


Abstract
1. Introduction
2. Results and Discussion
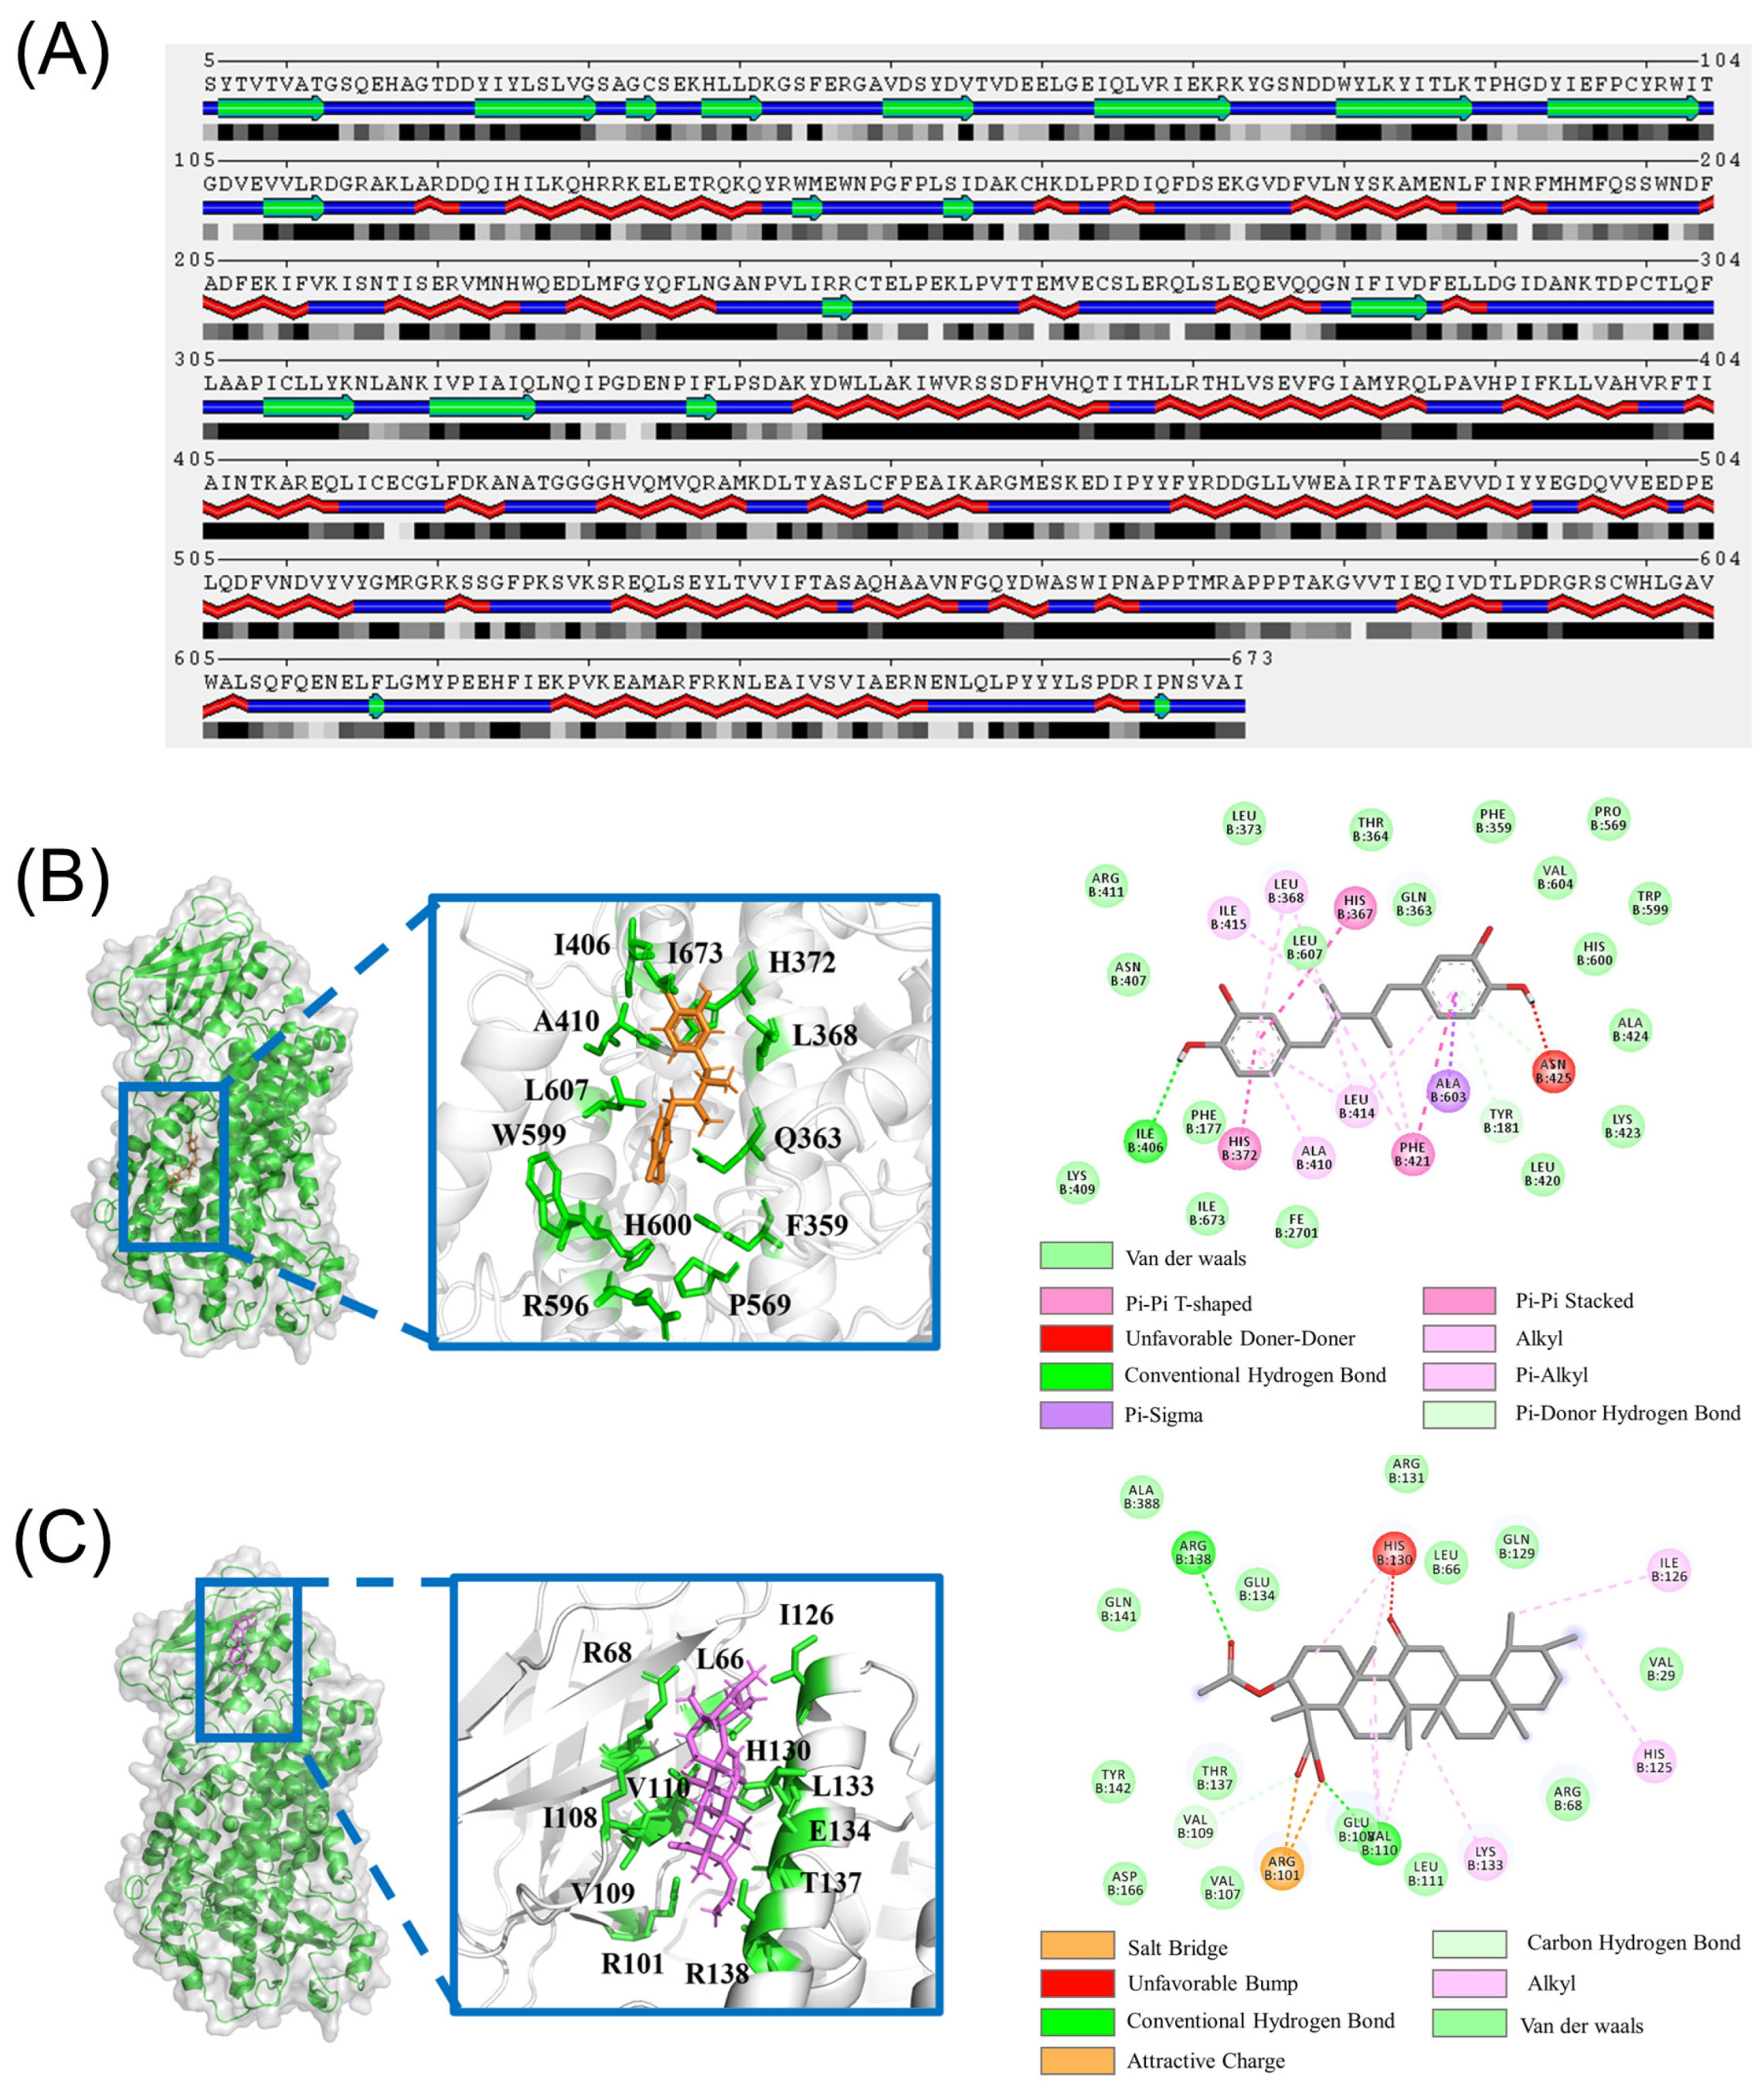
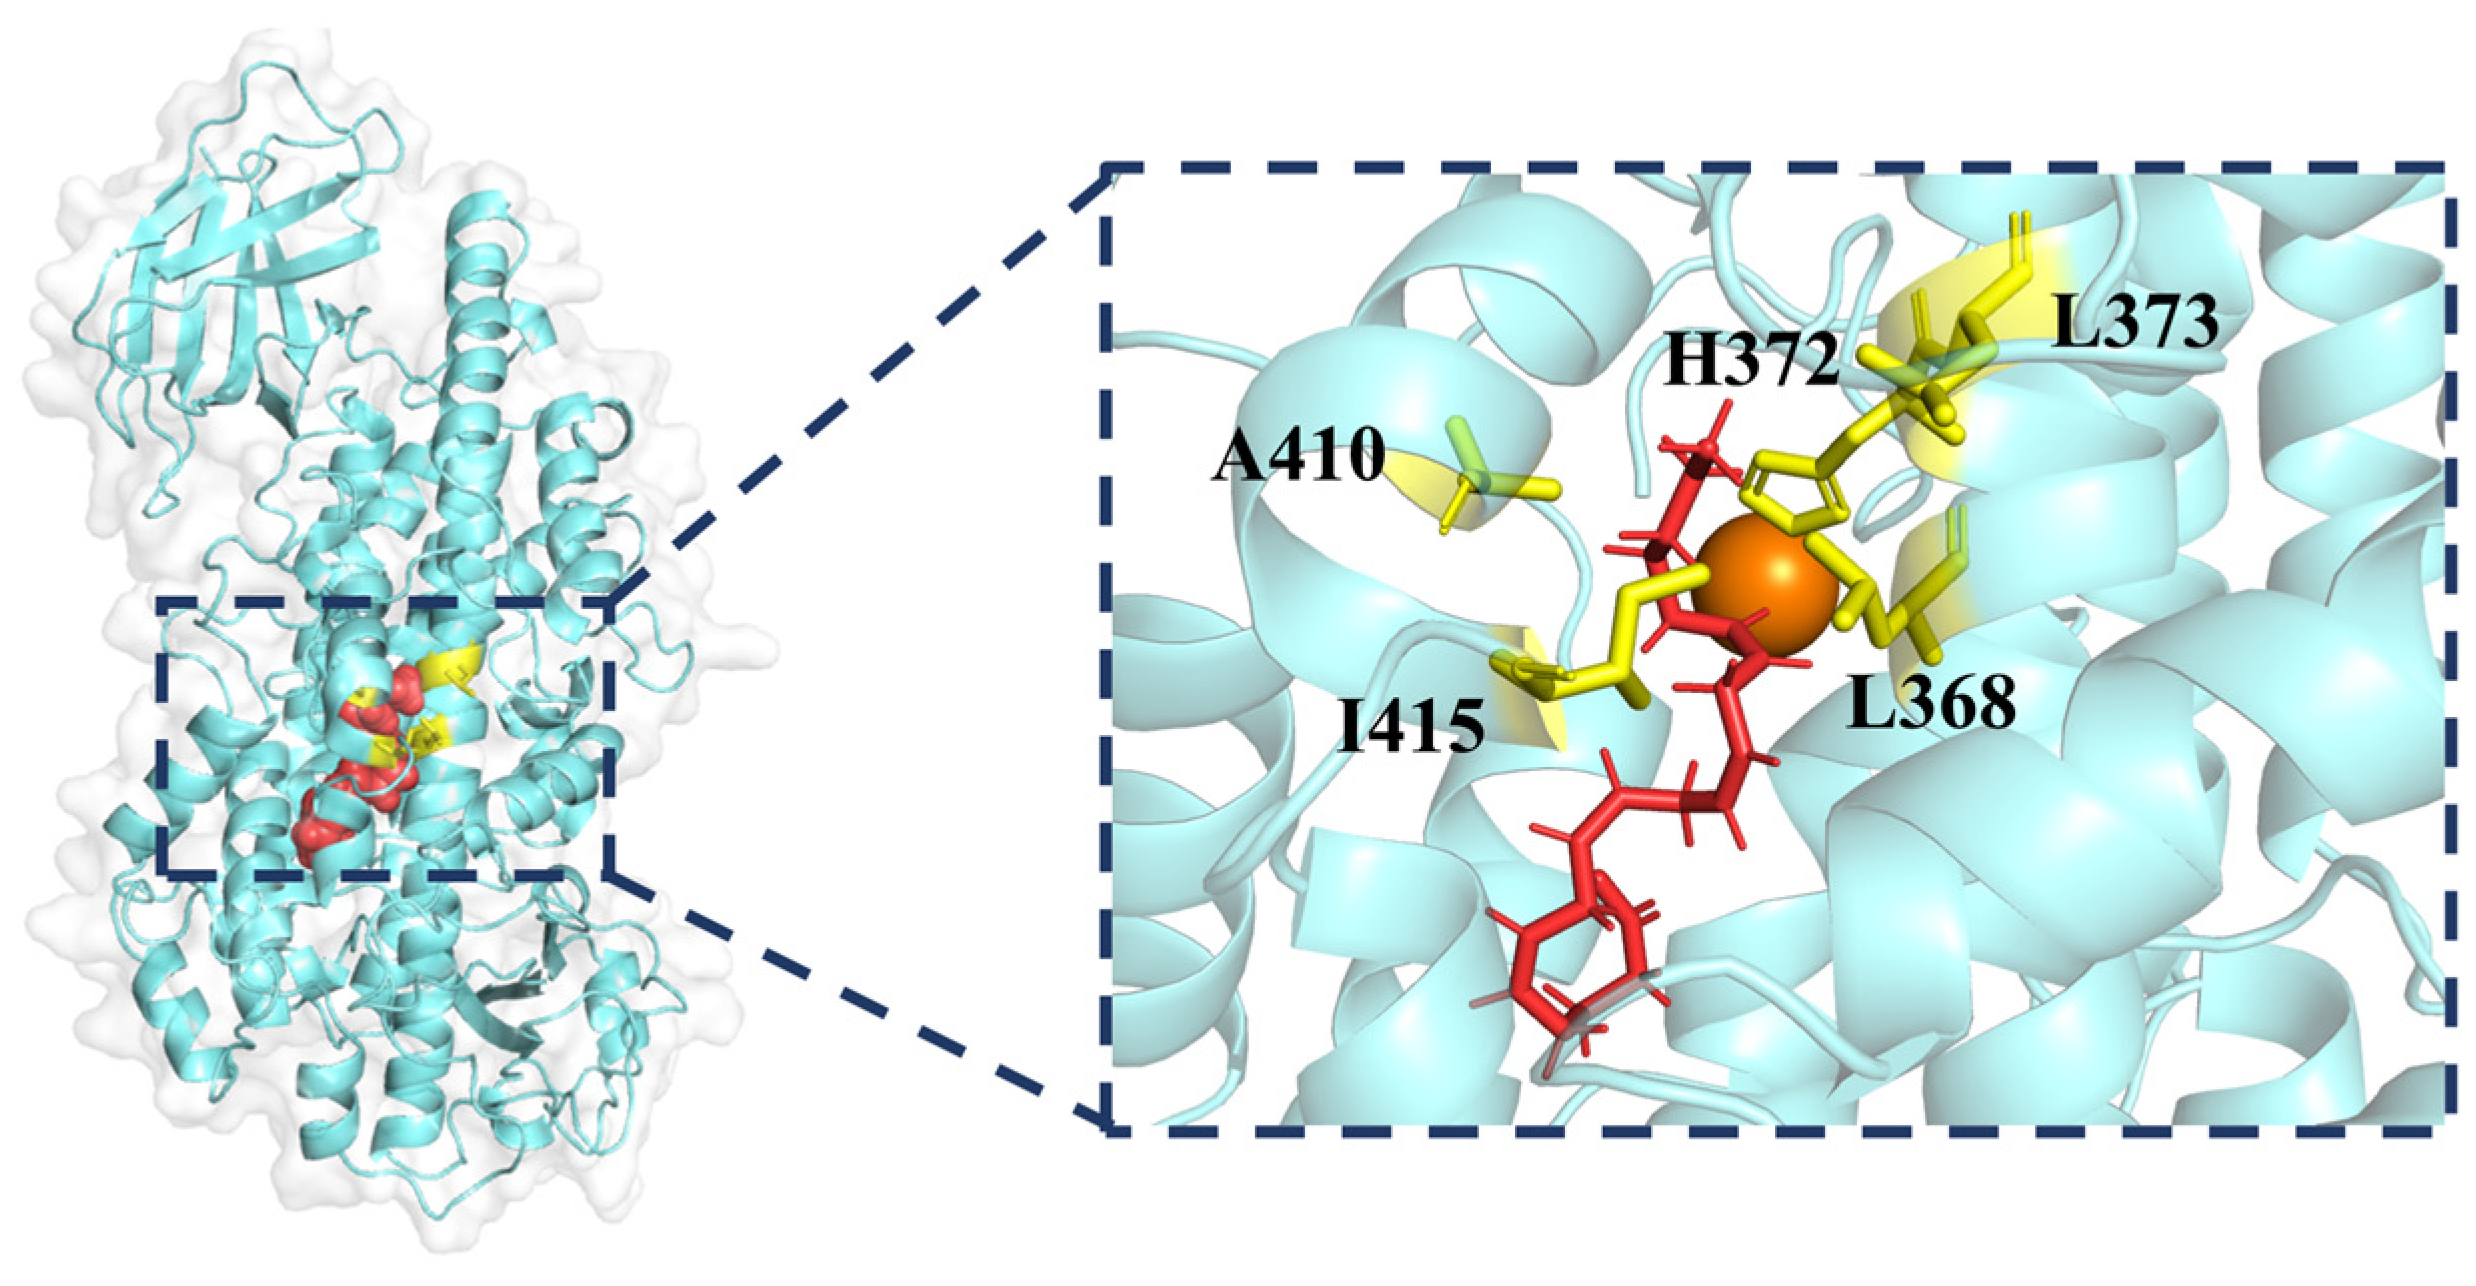
2.1. Molecular Docking
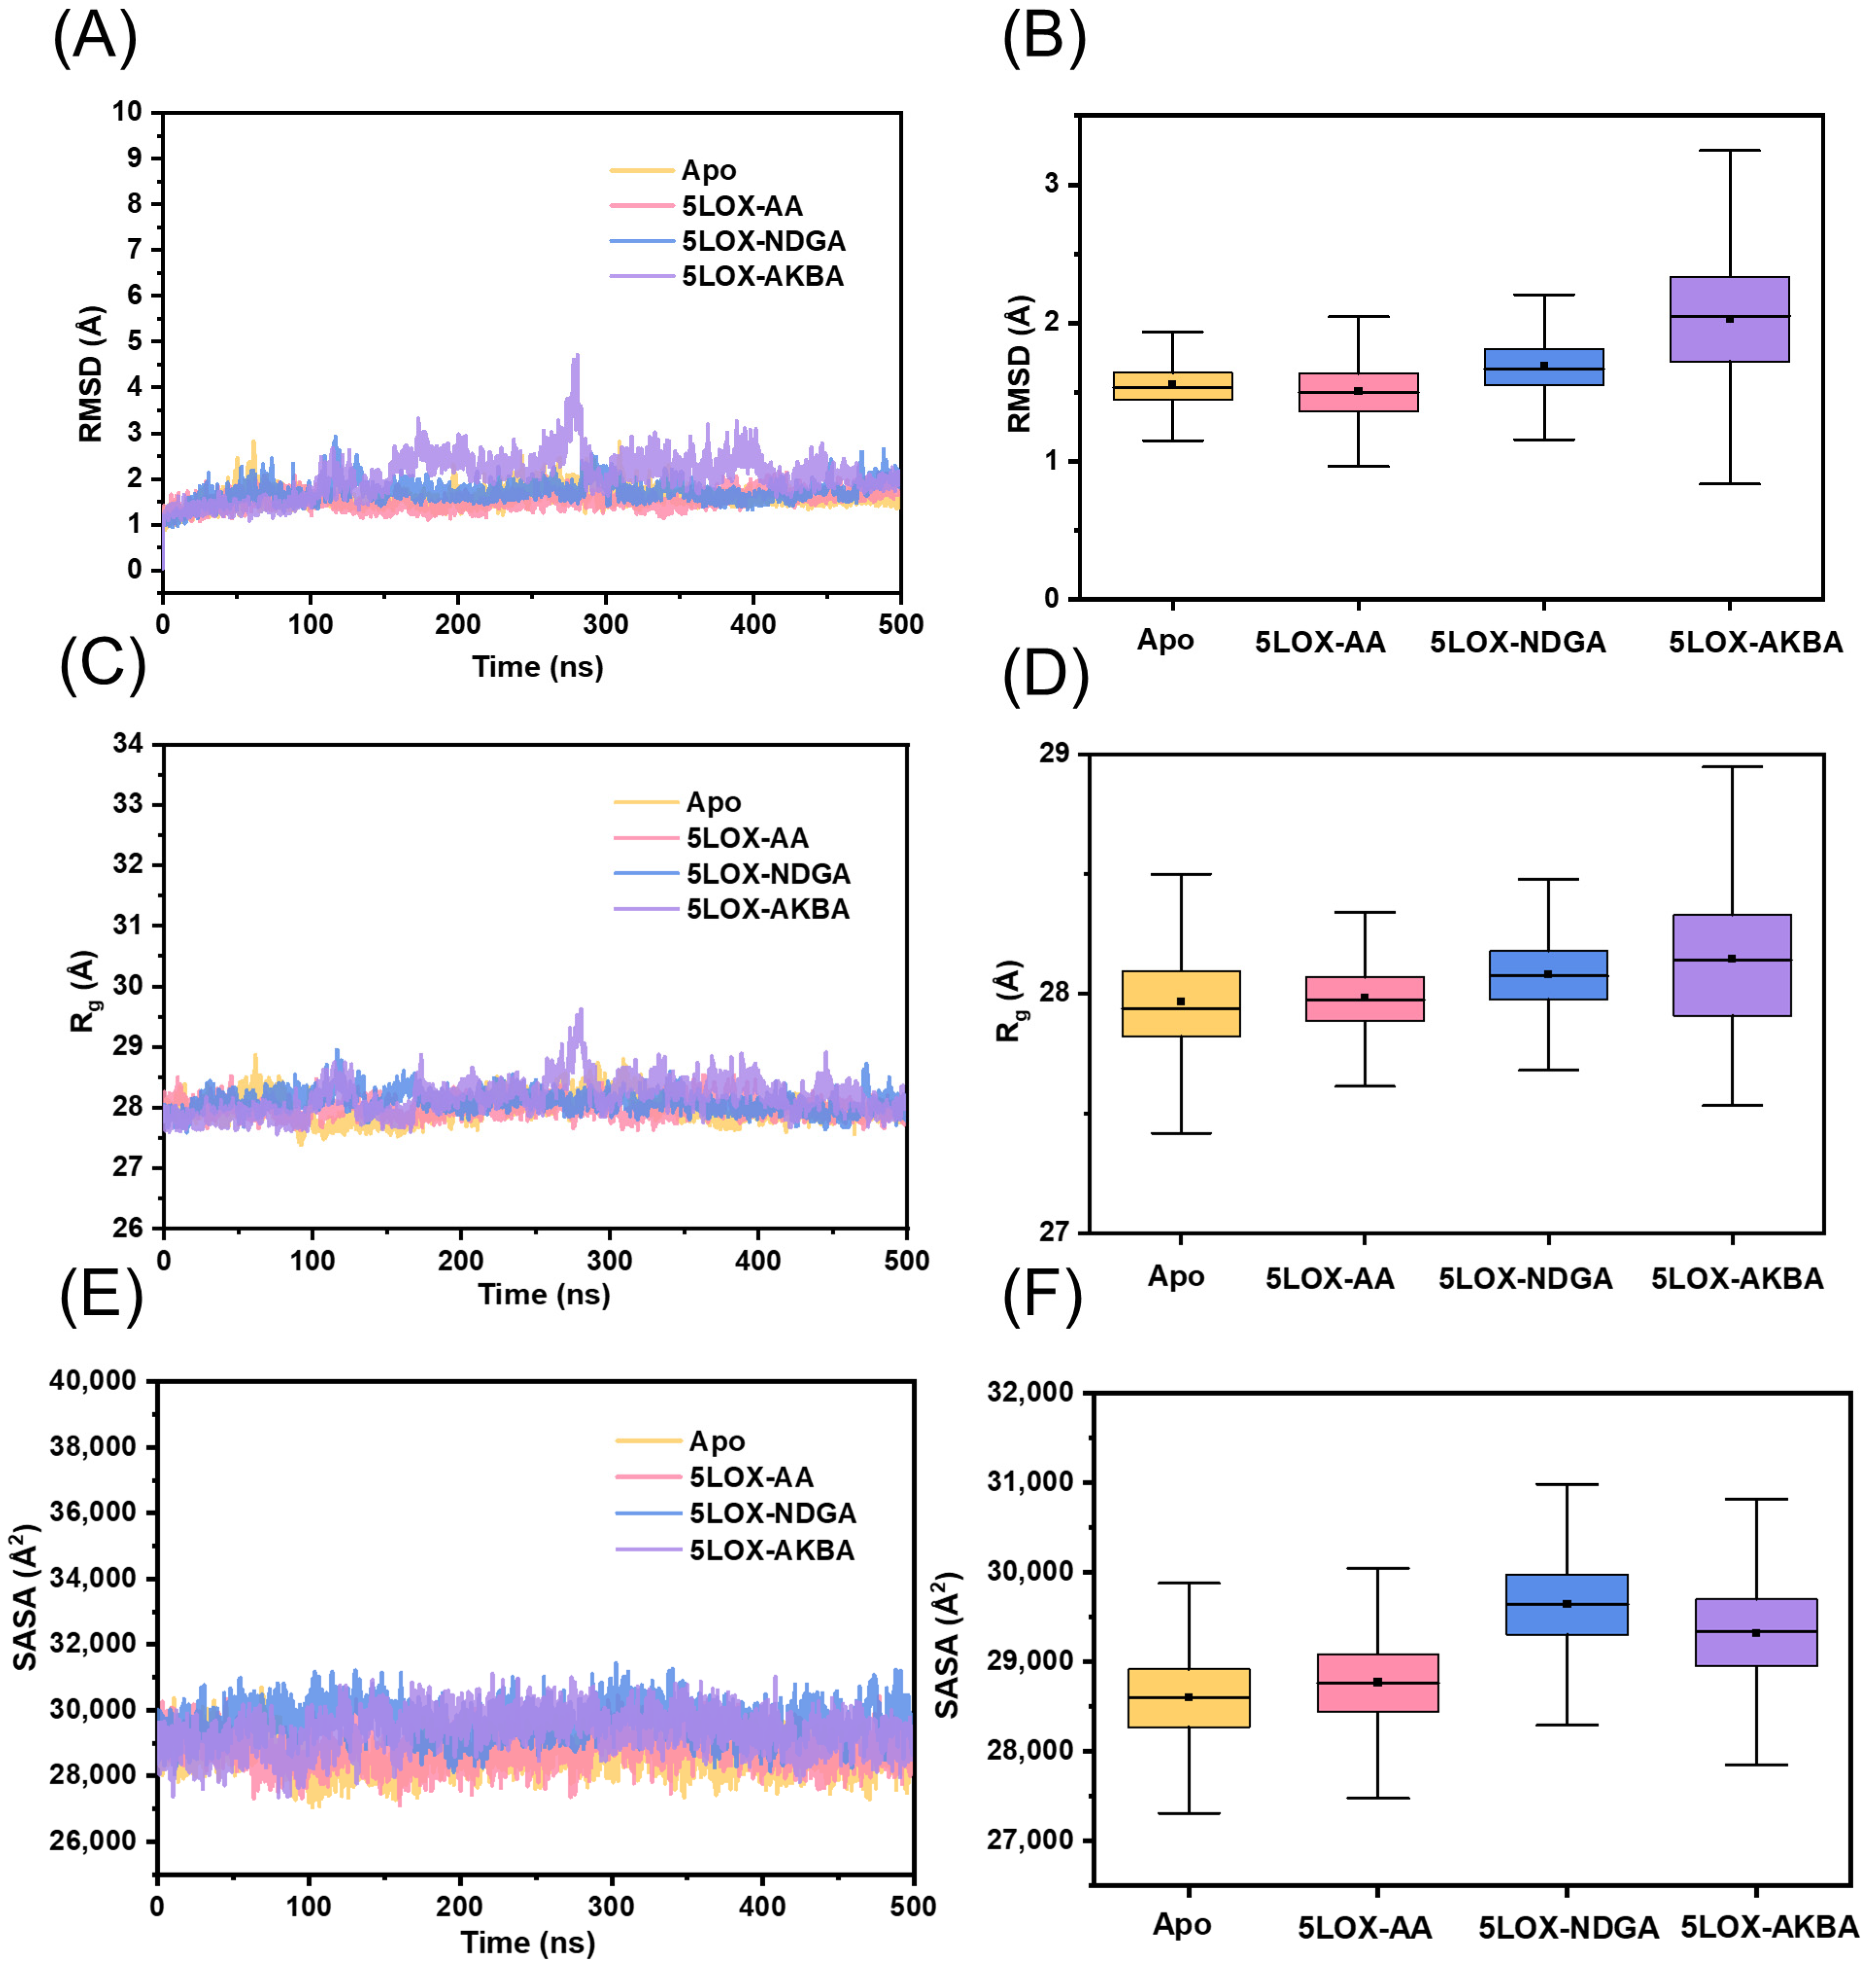
2.2. Structural Stability of the Four Systems
2.3. Alanine Scanning and the Molecular Mechanics/Poisson–Boltzmann Surface Area (MM–PBSA)
2.4. Flexibility Analysis of the 5LOX
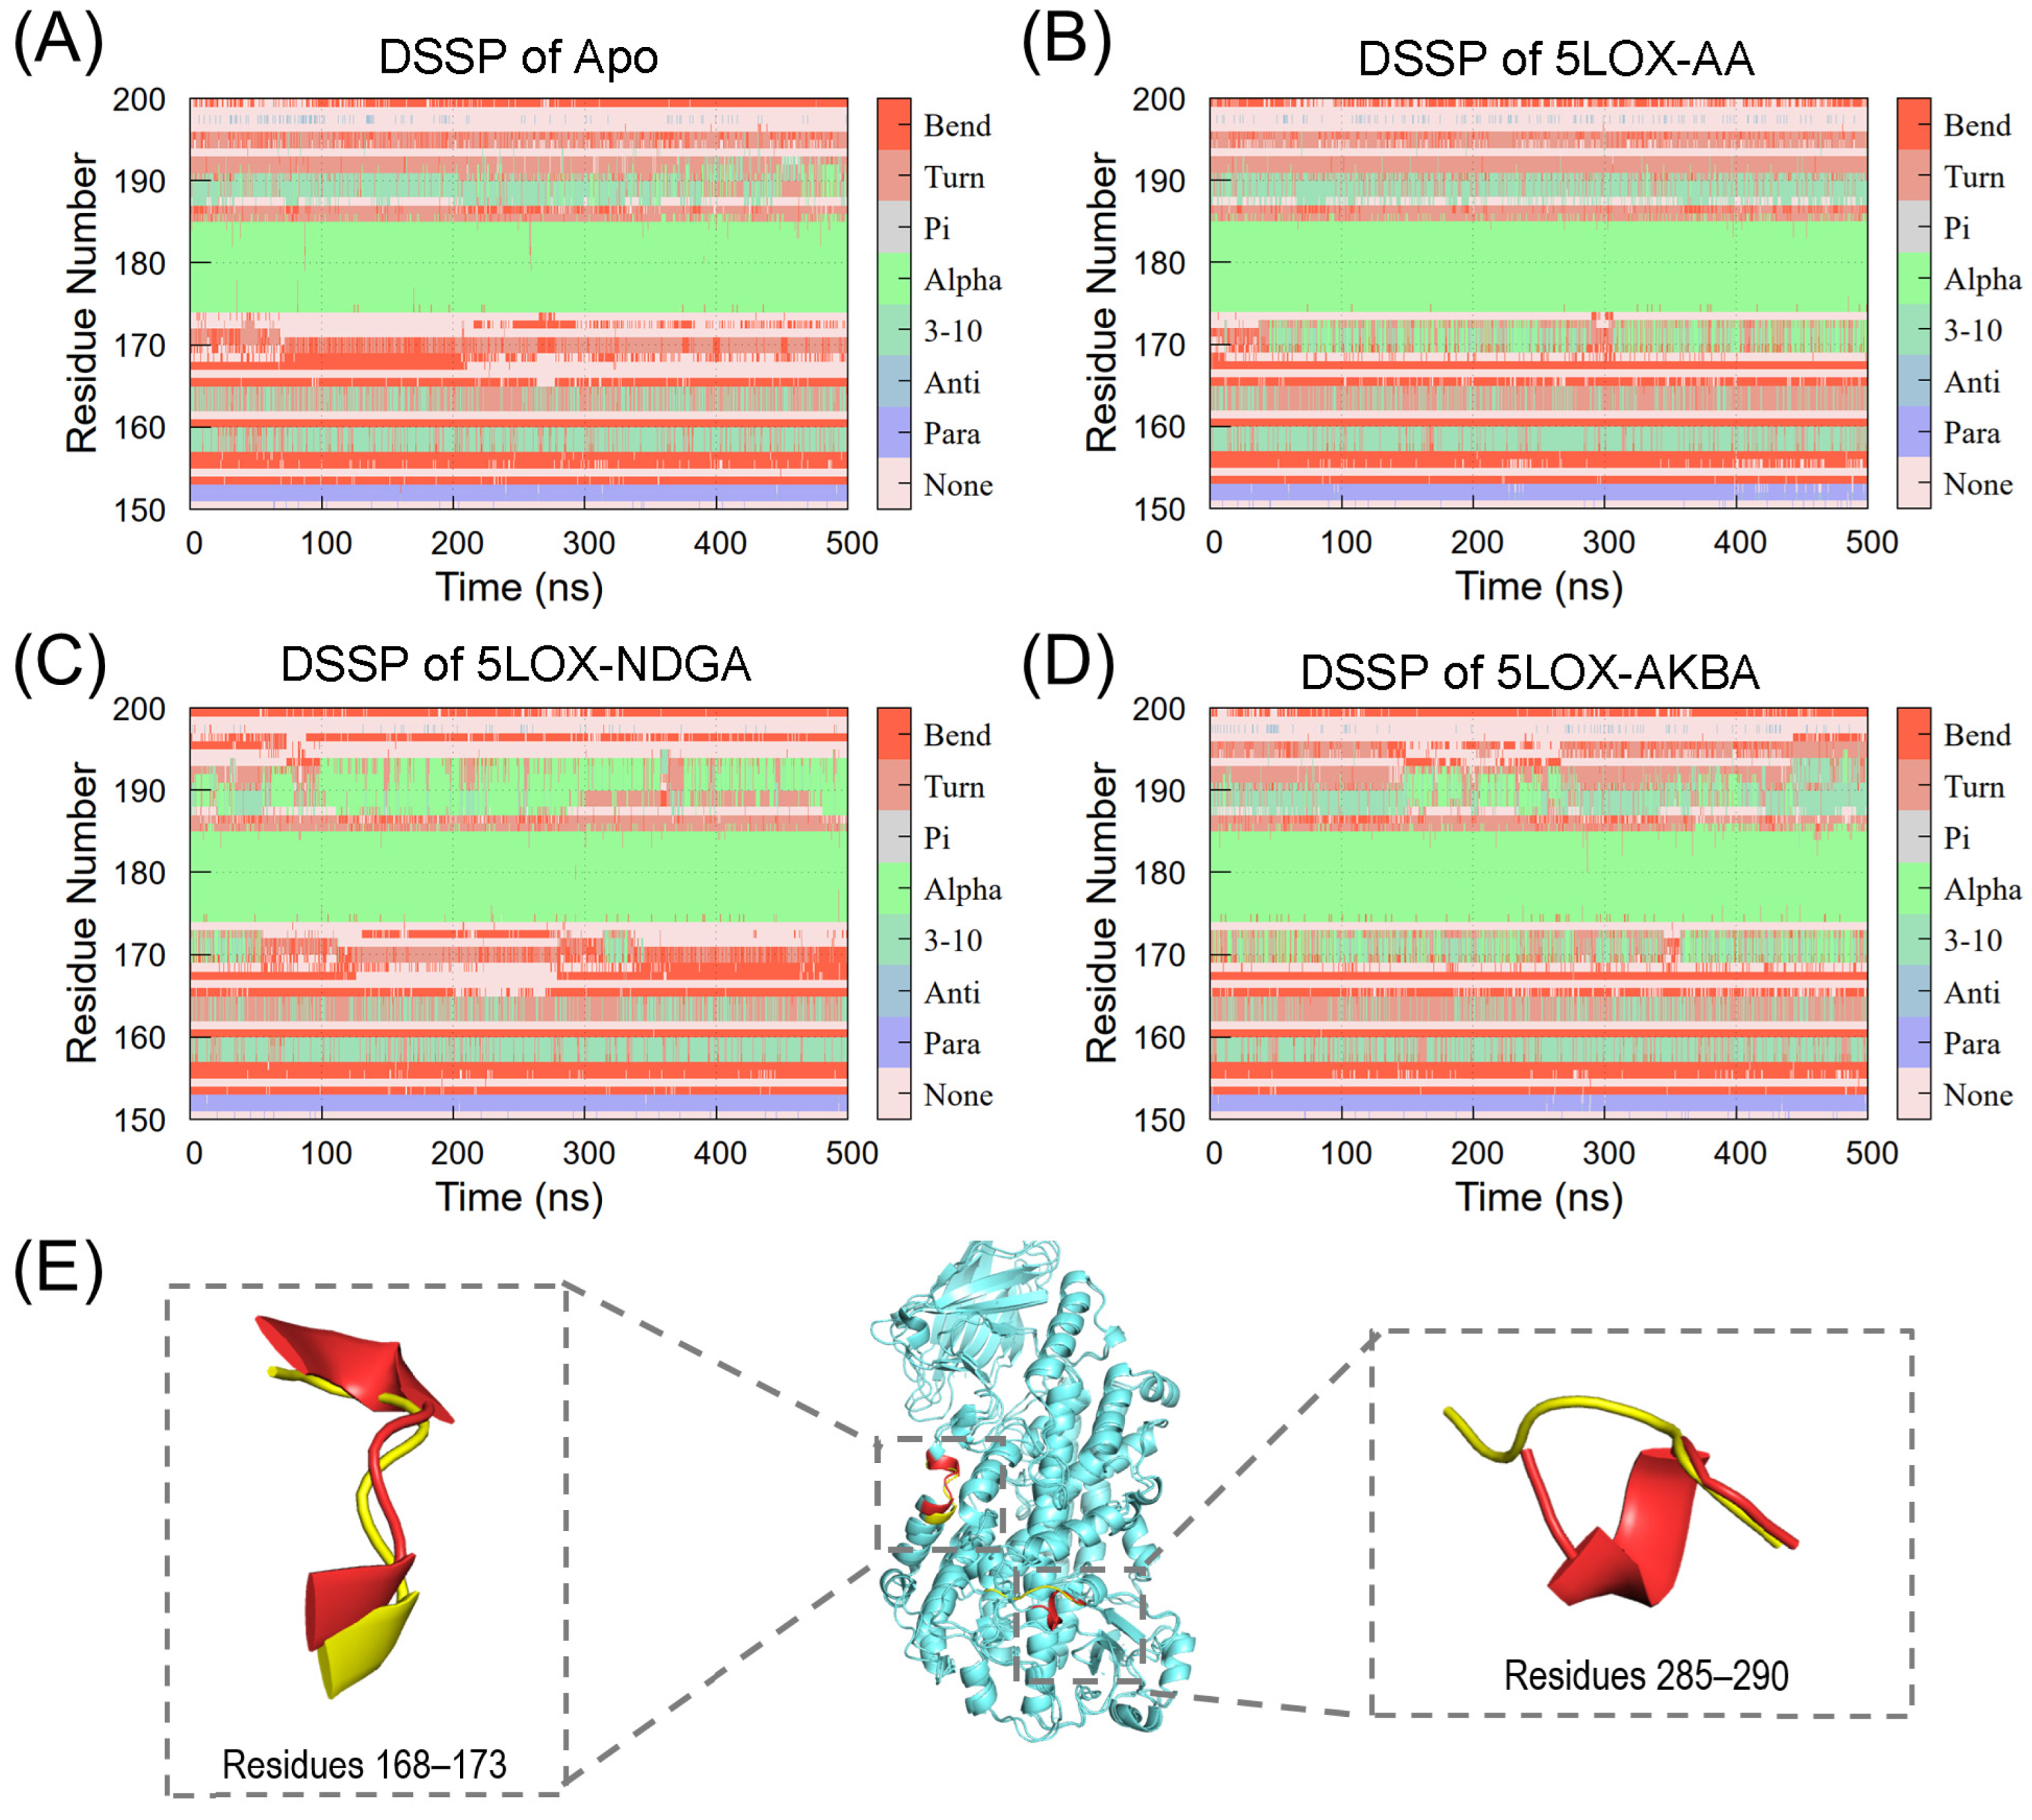
2.5. Conformational Changes during MD Simulations
2.6. Dynamical Cross-Correlation Matrix Analysis
2.7. PCA Analysis
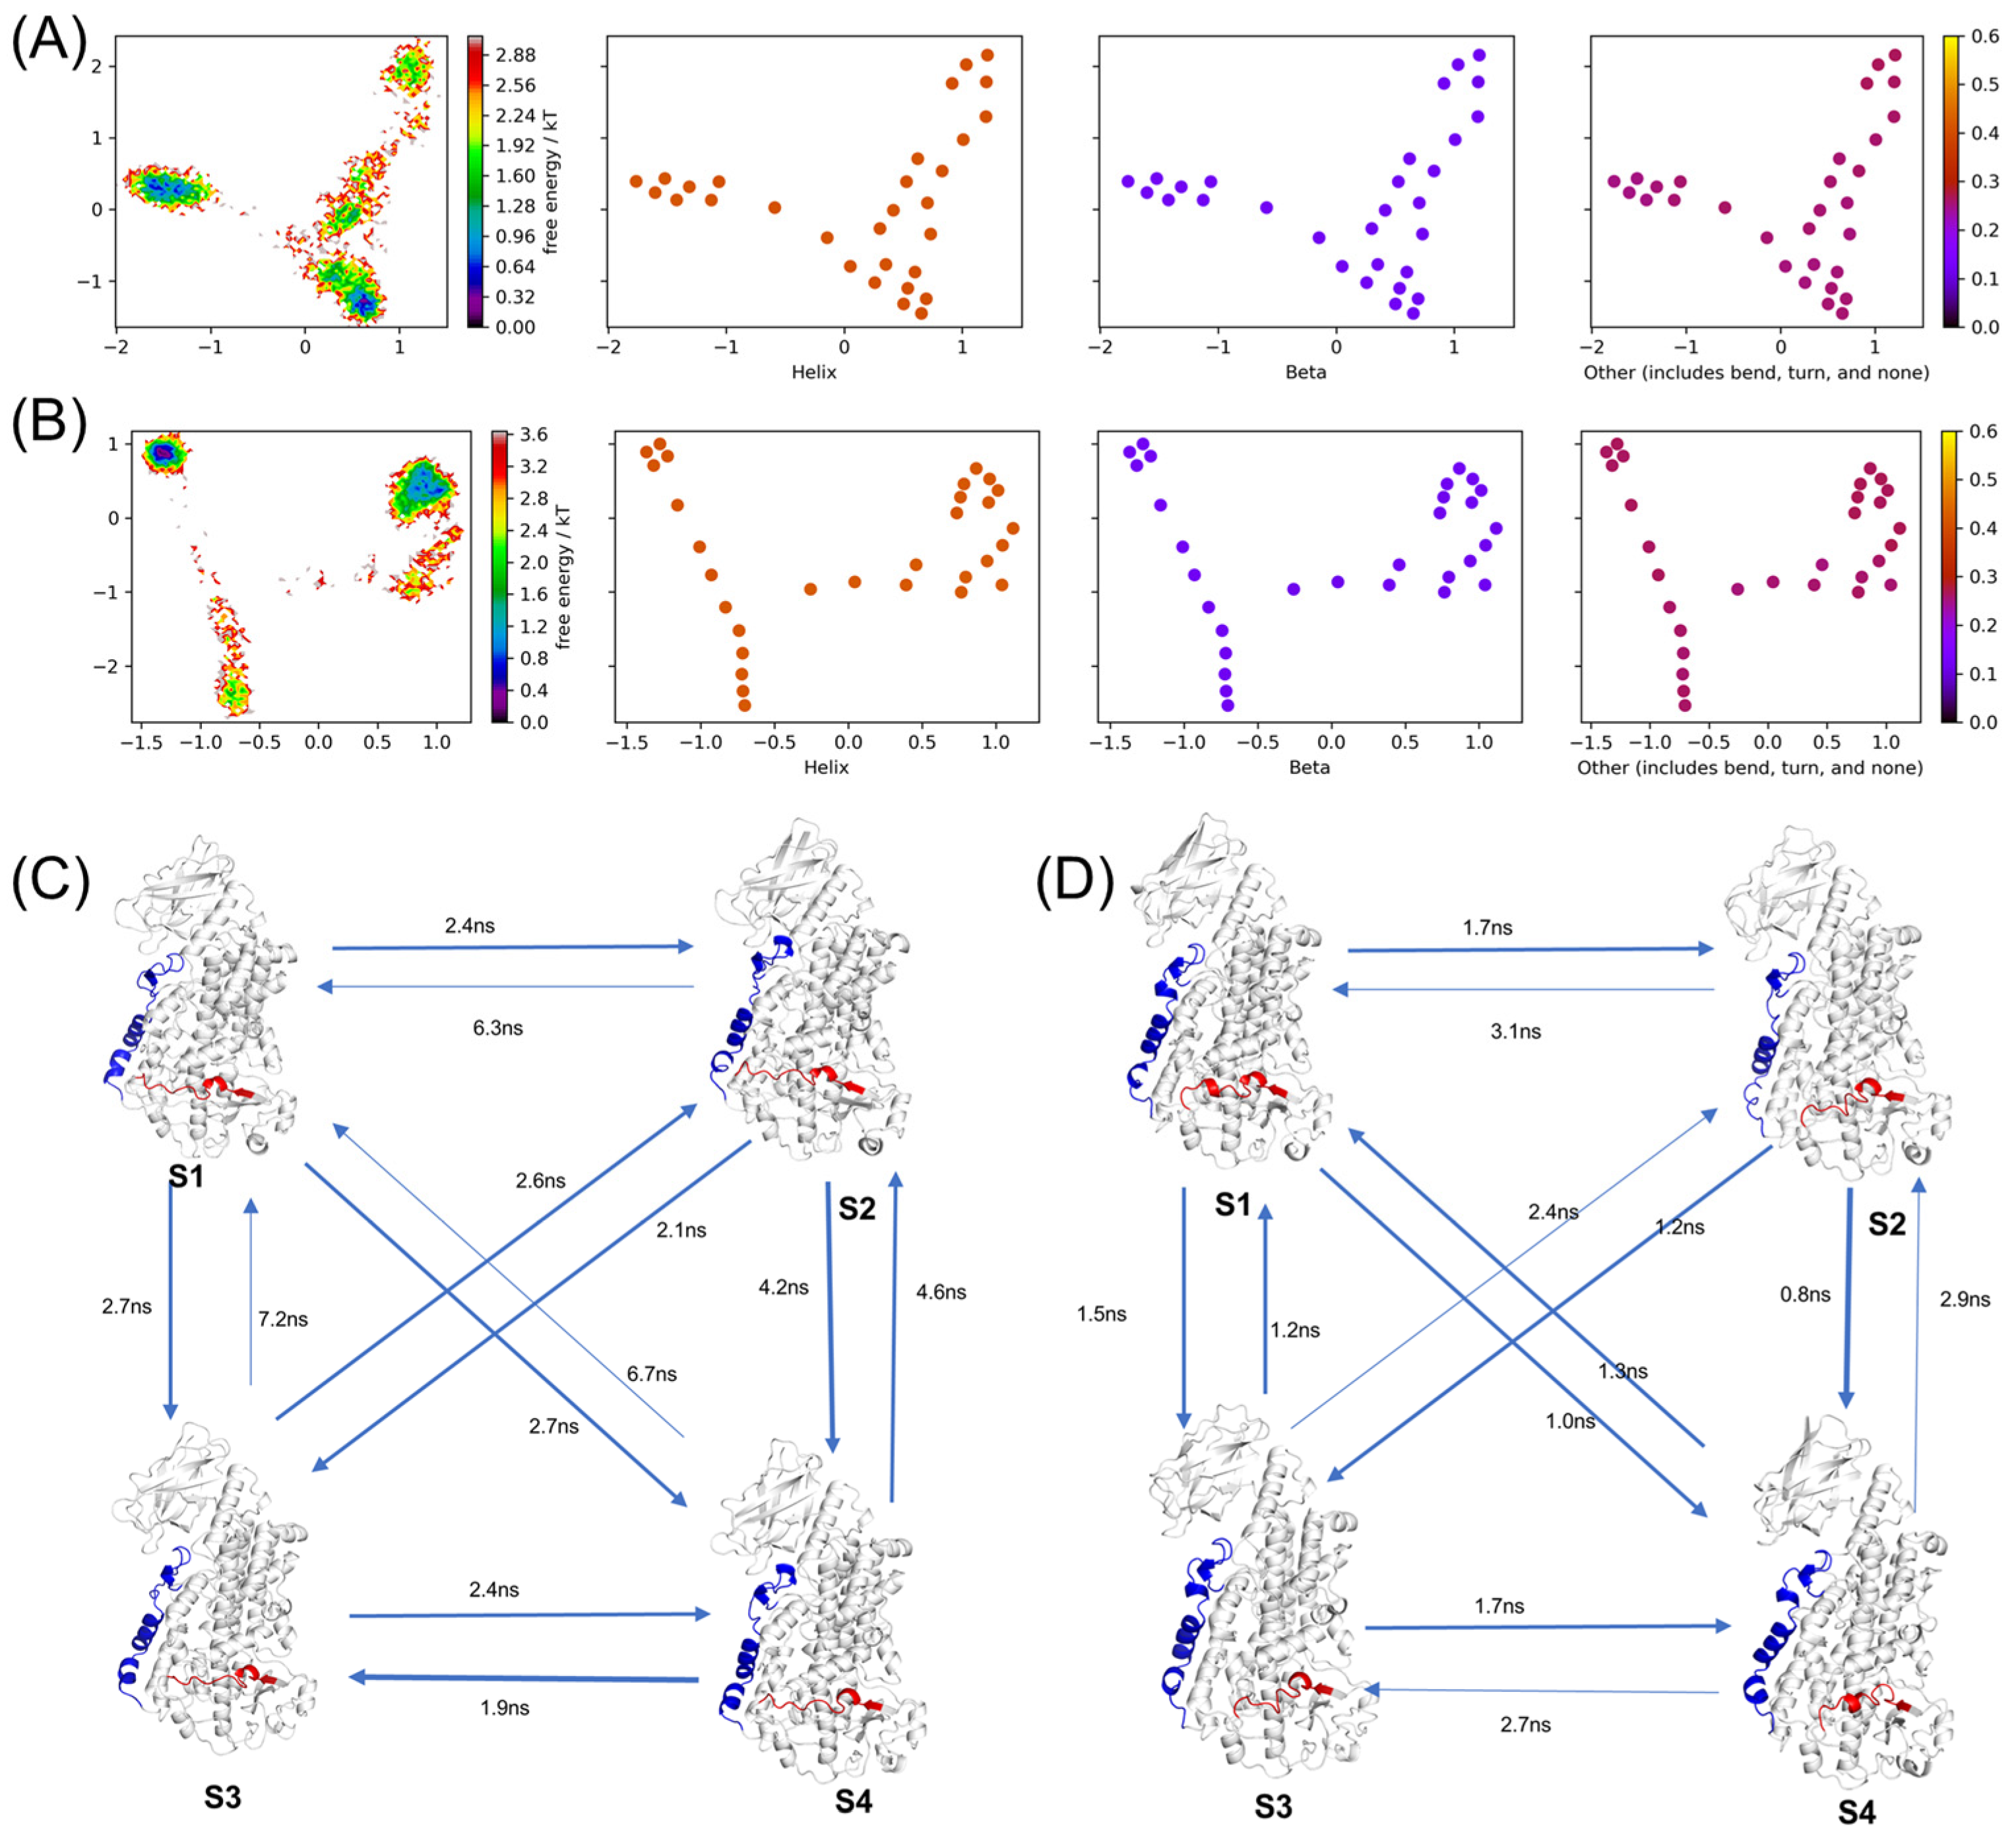
2.8. Markov Model
3. Materials and Methods
3.1. Preparation of Four Systems
3.2. Molecular Dynamics Simulations
3.3. Gaussian Accelerated Molecular Dynamics (GaMD) Simulation
3.4. MM–PBSA
3.5. Trajectory Analysis
3.6. PCA and Free-Energy Landscape
3.7. Markov Model
3.7.1. TICA Dimensionality Reduction Method
3.7.2. K-Means Clustering Algorithm
3.7.3. Determination of Lag Time
4. Conclusions
Supplementary Materials
Author Contributions
Funding
Institutional Review Board Statement
Informed Consent Statement
Data Availability Statement
Conflicts of Interest
References
- Medzhitov, R. Origin and physiological roles of inflammation. Nature 2008, 454, 428–435. [Google Scholar] [CrossRef] [PubMed]
- Hanauer, S.B. Inflammatory bowel disease: Epidemiology, pathogenesis, and therapeutic opportunities. Inflamm. Bowel Dis. 2006, 12 (Suppl. S1), S3–S9. [Google Scholar] [CrossRef] [PubMed]
- Spiteri, A.G.; Wishart, C.L.; Pamphlett, R.; Locatelli, G.; King, N.J.C. Microglia and Monocytes in Inflammatory Cns Disease: Integrating Phenotype and Function. Acta Neuropathol. 2022, 143, 179–224. [Google Scholar] [CrossRef] [PubMed]
- Harizi, H.; Corcuff, J.B.; Gualde, N. Arachidonic-acid-derived eicosanoids: Roles in biology and immunopathology. Trends Mol. Med. 2008, 14, 461–469. [Google Scholar] [CrossRef] [PubMed]
- Rådmark, O.; Werz, O.; Steinhilber, D.; Samuelsson, B. 5-Lipoxygenase, a key enzyme for leukotriene biosynthesis in health and disease. Biochim. Biophys. Acta 2015, 1851, 331–339. [Google Scholar] [CrossRef] [PubMed]
- Kowal-Bielecka, O.; Kowal, K.; Distler, O.; Gay, S. Mechanisms of Disease: Leukotrienes and lipoxins in scleroderma lung disease--insights and potential therapeutic implications. Nat. Clin. Pract. Rheumatol. 2007, 3, 43–51. [Google Scholar] [CrossRef] [PubMed]
- Montuschi, P. Role of Leukotrienes and Leukotriene Modifiers in Asthma. Pharmaceuticals 2010, 3, 1792–1811. [Google Scholar] [CrossRef]
- Sasaki, F.; Yokomizo, T. The leukotriene receptors as therapeutic targets of inflammatory diseases. Int. Immunol. 2019, 31, 607–615. [Google Scholar] [CrossRef]
- Russo, C.; Polosa, R. TNF-alpha as a promising therapeutic target in chronic asthma: A lesson from rheumatoid arthritis. Clin. Sci. 2005, 109, 135–142. [Google Scholar] [CrossRef]
- Melstrom, L.G.; Bentrem, D.J.; Salabat, M.R.; Kennedy, T.J.; Ding, X.Z.; Strouch, M.; Rao, S.M.; Witt, R.C.; Ternent, C.A.; Talamonti, M.S.; et al. Overexpression of 5-lipoxygenase in colon polyps and cancer and the effect of 5-LOX inhibitors in vitro and in a murine model. Clin. Cancer Res. 2008, 14, 6525–6530. [Google Scholar] [CrossRef]
- Bäck, M. Inhibitors of the 5-lipoxygenase pathway in atherosclerosis. Curr. Pharm. Des. 2009, 15, 3116–3132. [Google Scholar] [CrossRef] [PubMed]
- Gilbert, N.C.; Bartlett, S.G.; Waight, M.T.; Neau, D.B.; Boeglin, W.E.; Brash, A.R.; Newcomer, M.E. The structure of human 5-lipoxygenase. Science 2011, 331, 217–219. [Google Scholar] [CrossRef]
- Poeckel, D.; Werz, O. Boswellic acids: Biological actions and molecular targets. Curr. Med. Chem. 2006, 13, 3359–3369. [Google Scholar] [CrossRef] [PubMed]
- Liao, J.M.; Wang, Y.T. In silico studies of conformational dynamics of Mu opioid receptor performed using gaussian accelerated molecular dynamics. J. Biomol. Struct. Dyn. 2019, 37, 166–177. [Google Scholar] [CrossRef] [PubMed]
- Gilbert, N.C.; Gerstmeier, J.; Schexnaydre, E.E.; Börner, F.; Garscha, U.; Neau, D.B.; Werz, O.; Newcomer, M.E. Structural and mechanistic insights into 5-lipoxygenase inhibition by natural products. Nat. Chem. Biol. 2020, 16, 783–790. [Google Scholar] [CrossRef]
- Hamelberg, D.; de Oliveira, C.A.; McCammon, J.A. Sampling of slow diffusive conformational transitions with accelerated molecular dynamics. J. Chem. Phys. 2007, 127, 155102. [Google Scholar] [CrossRef] [PubMed]
- Lazim, R.; Suh, D.; Choi, S. Advances in Molecular Dynamics Simulations and Enhanced Sampling Methods for the Study of Protein Systems. Int. J. Mol. Sci. 2020, 21, 6339. [Google Scholar] [CrossRef] [PubMed]
- Miao, Y.; Feher, V.A.; McCammon, J.A. Gaussian Accelerated Molecular Dynamics: Unconstrained Enhanced Sampling and Free Energy Calculation. J. Chem. Theory Comput. 2015, 11, 3584–3595. [Google Scholar] [CrossRef]
- Wang, J.; Arantes, P.R.; Bhattarai, A.; Hsu, R.V.; Pawnikar, S.; Huang, Y.M.; Palermo, G.; Miao, Y. Gaussian accelerated molecular dynamics (GaMD): Principles and applications. Wiley Interdiscip. Rev. Comput. Mol. Sci. 2021, 11, e1521. [Google Scholar] [CrossRef]
- Miao, Y.; McCammon, J.A. Graded activation and free energy landscapes of a muscarinic G-protein-coupled receptor. Proc. Natl. Acad. Sci. USA 2016, 113, 12162–12167. [Google Scholar] [CrossRef]
- Wang, Y.T.; Chan, Y.H. Understanding the molecular basis of agonist/antagonist mechanism of human mu opioid receptor through gaussian accelerated molecular dynamics method. Sci. Rep. 2017, 7, 7828. [Google Scholar] [CrossRef] [PubMed]
- Miao, Y.; Bhattarai, A.; Nguyen, A.T.N.; Christopoulos, A.; May, L.T. Structural Basis for Binding of Allosteric Drug Leads in the Adenosine A(1) Receptor. Sci. Rep. 2018, 8, 16836. [Google Scholar] [CrossRef] [PubMed]
- Pawnikar, S.; Miao, Y. Pathway and mechanism of drug binding to chemokine receptors revealed by accelerated molecular simulations. Future Med. Chem. 2020, 12, 1213–1225. [Google Scholar] [CrossRef] [PubMed]
- Moffett, A.S.; Shukla, D. Structural Consequences of Multisite Phosphorylation in the BAK1 Kinase Domain. Biophys. J. 2020, 118, 698–707. [Google Scholar] [CrossRef] [PubMed]
- Koh, A.; Gibbon, M.J.; Van der Kamp, M.W.; Pudney, C.R.; Gebhard, S. Conformation control of the histidine kinase BceS of Bacillus subtilis by its cognate ABC-transporter facilitates need-based activation of antibiotic resistance. Mol. Microbiol. 2021, 115, 157–174. [Google Scholar] [CrossRef] [PubMed]
- Pang, Y.T.; Miao, Y.; Wang, Y.; McCammon, J.A. Gaussian Accelerated Molecular Dynamics in NAMD. J. Chem. Theory Comput. 2017, 13, 9–19. [Google Scholar] [CrossRef] [PubMed]
- East, K.W.; Newton, J.C.; Morzan, U.N.; Narkhede, Y.B.; Acharya, A.; Skeens, E.; Jogl, G.; Batista, V.S.; Palermo, G.; Lisi, G.P. Allosteric Motions of the CRISPR-Cas9 HNH Nuclease Probed by NMR and Molecular Dynamics. J. Am. Chem. Soc. 2020, 142, 1348–1358. [Google Scholar] [CrossRef] [PubMed]
- Ricci, C.G.; Chen, J.S.; Miao, Y.; Jinek, M.; Doudna, J.A.; McCammon, J.A.; Palermo, G. Deciphering Off-Target Effects in CRISPR-Cas9 through Accelerated Molecular Dynamics. ACS Cent. Sci. 2019, 5, 651–662. [Google Scholar] [CrossRef]
- Sibener, L.V.; Fernandes, R.A.; Kolawole, E.M.; Carbone, C.B.; Liu, F.; McAffee, D.; Birnbaum, M.E.; Yang, X.; Su, L.F.; Yu, W.; et al. Isolation of a Structural Mechanism for Uncoupling T Cell Receptor Signaling from Peptide-MHC Binding. Cell 2018, 174, 672–687.e27. [Google Scholar] [CrossRef]
- Park, J.B.; Kim, Y.H.; Yoo, Y.; Kim, J.; Jun, S.H.; Cho, J.W.; El Qaidi, S.; Walpole, S.; Monaco, S.; García-García, A.A.; et al. Structural basis for arginine glycosylation of host substrates by bacterial effector proteins. Nat. Commun. 2018, 9, 4283. [Google Scholar] [CrossRef]
- Miao, Y.; McCammon, J.A. Mechanism of the G-protein mimetic nanobody binding to a muscarinic G-protein-coupled receptor. Proc. Natl. Acad. Sci. USA 2018, 115, 3036–3041. [Google Scholar] [CrossRef] [PubMed]
- Noé, F.; Wu, H.; Prinz, J.H.; Plattner, N. Projected and hidden Markov models for calculating kinetics and metastable states of complex molecules. J. Chem. Phys. 2013, 139, 184114. [Google Scholar] [CrossRef] [PubMed]
- Husic, B.E.; Pande, V.S. Markov State Models: From an Art to a Science. J. Am. Chem. Soc. 2018, 140, 2386–2396. [Google Scholar] [CrossRef] [PubMed]
- Olsson, S.; Noé, F. Mechanistic Models of Chemical Exchange Induced Relaxation in Protein NMR. J. Am. Chem. Soc. 2017, 139, 200–210. [Google Scholar] [CrossRef] [PubMed]
- Prinz, J.H.; Keller, B.; Noé, F. Probing molecular kinetics with Markov models: Metastable states, transition pathways and spectroscopic observables. Phys. Chem. Chem. Phys. 2011, 13, 16912–16927. [Google Scholar] [CrossRef] [PubMed]
- Olsson, S.; Wu, H.; Paul, F.; Clementi, C.; Noé, F. Combining experimental and simulation data of molecular processes via augmented Markov models. Proc. Natl. Acad. Sci. USA 2017, 114, 8265–8270. [Google Scholar] [CrossRef]
- Juárez-Jiménez, J.; Gupta, A.A.; Karunanithy, G.; Mey, A.; Georgiou, C.; Ioannidis, H.; De Simone, A.; Barlow, P.N.; Hulme, A.N.; Walkinshaw, M.D.; et al. Dynamic design: Manipulation of millisecond timescale motions on the energy landscape of cyclophilin A. Chem. Sci. 2020, 11, 2670–2680. [Google Scholar] [CrossRef] [PubMed]
- Golla, V.K.; Prajapati, J.D.; Joshi, M.; Kleinekathöfer, U. Exploration of Free Energy Surfaces Across a Membrane Channel Using Metadynamics and Umbrella Sampling. J. Chem. Theory Comput. 2020, 16, 2751–2765. [Google Scholar] [CrossRef] [PubMed]
- Delgado, J.; Radusky, L.G.; Cianferoni, D.; Serrano, L. FoldX 5.0: Working with RNA, small molecules and a new graphical interface. Bioinformatics 2019, 35, 4168–4169. [Google Scholar] [CrossRef]
- Bowman, G.R. An overview and practical guide to building Markov state models. Adv. Exp. Med. Biol. 2014, 797, 7–22. [Google Scholar] [CrossRef]
- Deuflhard, P.; Huisinga, W.; Fischer, A.; Schütte, C. Identification of almost invariant aggregates in reversible nearly uncoupled Markov chains. Linear Algebra Its Appl. 2000, 315, 39–59. [Google Scholar] [CrossRef]
- Berman, H.M.; Westbrook, J.; Feng, Z.; Gilliland, G.; Bhat, T.N.; Weissig, H.; Shindyalov, I.N.; Bourne, P.E. The Protein Data Bank. Nucleic Acids Res. 2000, 28, 235–242. [Google Scholar] [CrossRef] [PubMed]
- Schrödinger, L.L.C.; DeLano, W. Pymol. 2021. Available online: http://www.pymol.org/pymol (accessed on 2 March 2024).
- Waterhouse, A.; Bertoni, M.; Bienert, S.; Studer, G.; Tauriello, G.; Gumienny, R.; Heer, F.T.; de Beer, T.A.P.; Rempfer, C.; Bordoli, L.; et al. SWISS-MODEL: Homology modelling of protein structures and complexes. Nucleic Acids Res. 2018, 46, W296–W303. [Google Scholar] [CrossRef] [PubMed]
- Accelrys Software, Inc. Discovery Studio Visualizer v21.1.0. 2021. Available online: https://www.3ds.com/products/biovia/discovery-studio/visualization (accessed on 3 March 2024).
- Frisch, M.J.; Trucks, G.W.; Schlegel, H.B.; Scuseria, G.E.; Robb, M.A.; Cheeseman, J.R.; Scalmani, G.; Barone, V.; Petersson, G.A.; Nakatsuji, H.; et al. Gaussian 16 Rev. C.01; Wallingford, CT, USA, 2016. [Google Scholar]
- Pinzi, L.; Rastelli, G. Molecular Docking: Shifting Paradigms in Drug Discovery. Int. J. Mol. Sci. 2019, 20, 4331. [Google Scholar] [CrossRef] [PubMed]
- Eberhardt, J.; Santos-Martins, D.; Tillack, A.F.; Forli, S. AutoDock Vina 1.2.0: New Docking Methods, Expanded Force Field, and Python Bindings. J. Chem. Inf. Model. 2021, 61, 3891–3898. [Google Scholar] [CrossRef] [PubMed]
- Case, D.A.; Cerutti, D.S.; Cheatham, T.E., III; Darden, T.A.; Duke, R.E.; Gohlke, H.; Goetz, A.W.; Homeyer, N.; Izadi, S.; Janowski, P.; et al. AMBER. 2022. Available online: https://ambermd.org/AmberMD.php (accessed on 10 March 2024).
- Tian, C.; Kasavajhala, K.; Belfon, K.A.A.; Raguette, L.; Huang, H.; Migues, A.N.; Bickel, J.; Wang, Y.; Pincay, J.; Wu, Q.; et al. ff19SB: Amino-Acid-Specific Protein Backbone Parameters Trained against Quantum Mechanics Energy Surfaces in Solution. J. Chem. Theory Comput. 2020, 16, 528–552. [Google Scholar] [CrossRef]
- Wang, J.; Wang, W.; Kollman, P.A.; Case, D.A. Automatic atom type and bond type perception in molecular mechanical calculations. J. Mol. Graph. Model. 2006, 25, 247–260. [Google Scholar] [CrossRef] [PubMed]
- Li, P.; Merz, K.M., Jr. MCPB.py: A Python Based Metal Center Parameter Builder. J. Chem. Inf. Model. 2016, 56, 599–604. [Google Scholar] [CrossRef]
- Essmann, U.; Perera, L.; Berkowitz, M.L.; Darden, T.; Lee, H.; Pedersen, L.G. A smooth particle mesh Ewald method. J. Chem. Phys. 1995, 103, 8577–8593. [Google Scholar] [CrossRef]
- Izadi, S.; Anandakrishnan, R.; Onufriev, A.V. Building Water Models: A Different Approach. J. Phys. Chem. Lett. 2014, 5, 3863–3871. [Google Scholar] [CrossRef]
- Bosko, J.T.; Todd, B.D.; Sadus, R.J. Molecular simulation of dendrimers and their mixtures under shear: Comparison of isothermal-isobaric (NpT) and isothermal-isochoric (NVT) ensemble systems. J. Chem. Phys. 2005, 123, 34905. [Google Scholar] [CrossRef] [PubMed]
- Bussi, G.; Parrinello, M. Stochastic thermostats: Comparison of local and global schemes. Comput. Phys. Commun. 2008, 179, 26–29. [Google Scholar] [CrossRef]
- Grønbech-Jensen, N.; Farago, O. Constant pressure and temperature discrete-time Langevin molecular dynamics. J. Chem. Phys. 2014, 141, 194108. [Google Scholar] [CrossRef] [PubMed]
- Miao, Y.; Sinko, W.; Pierce, L.; Bucher, D.; Walker, R.C.; McCammon, J.A. Improved Reweighting of Accelerated Molecular Dynamics Simulations for Free Energy Calculation. J. Chem. Theory Comput. 2014, 10, 2677–2689. [Google Scholar] [CrossRef]
- Roe, D.R.; Cheatham, T.E., 3rd. PTRAJ and CPPTRAJ: Software for Processing and Analysis of Molecular Dynamics Trajectory Data. J. Chem. Theory Comput. 2013, 9, 3084–3095. [Google Scholar] [CrossRef] [PubMed]
- Hünenberger, P.H.; Mark, A.E.; van Gunsteren, W.F. Fluctuation and cross-correlation analysis of protein motions observed in nanosecond molecular dynamics simulations. J. Mol. Biol. 1995, 252, 492–503. [Google Scholar] [CrossRef] [PubMed]
- Fischer, S.; Crow, M.; Harris, B.D.; Gillis, J. Scaling up reproducible research for single-cell transcriptomics using MetaNeighbor. Nat. Protoc. 2021, 16, 4031–4067. [Google Scholar] [CrossRef]
- David, C.C.; Jacobs, D.J. Principal component analysis: A method for determining the essential dynamics of proteins. Methods Mol. Biol. 2014, 1084, 193–226. [Google Scholar] [CrossRef] [PubMed]
- Chang, S.; Hu, J.P.; Lin, P.Y.; Jiao, X.; Tian, X.H. Substrate recognition and transport behavior analyses of amino acid antiporter with coarse-grained models. Mol. Biosyst. 2010, 6, 2430–2438. [Google Scholar] [CrossRef]
- Lu, T. ddtdp Program. Available online: http://sobereva.com/usr/uploads/file/20151115/20151115220021_45515.rar (accessed on 10 March 2024).
- Prinz, J.H.; Wu, H.; Sarich, M.; Keller, B.; Senne, M.; Held, M.; Chodera, J.D.; Schütte, C.; Noé, F. Markov models of molecular kinetics: Generation and validation. J. Chem. Phys. 2011, 134, 174105. [Google Scholar] [CrossRef]
- Chodera, J.D.; Noé, F. Markov state models of biomolecular conformational dynamics. Curr. Opin. Struct. Biol. 2014, 25, 135–144. [Google Scholar] [CrossRef] [PubMed]
- Rosta, E.; Hummer, G. Free energies from dynamic weighted histogram analysis using unbiased Markov state model. J. Chem. Theory Comput. 2015, 11, 276–285. [Google Scholar] [CrossRef] [PubMed]
- Pérez-Hernández, G.; Paul, F.; Giorgino, T.; De Fabritiis, G.; Noé, F. Identification of slow molecular order parameters for Markov model construction. J. Chem. Phys. 2013, 139, 015102. [Google Scholar] [CrossRef] [PubMed]


| Systems | Average Value | Standard Deviation | ||||
|---|---|---|---|---|---|---|
| RMSD (Å) | Rg (Å) | SASA (Å2) | RMSD (Å) | Rg (Å) | SASA (Å2) | |
| Apo | 1.56 | 27.97 | 28,597.82 | 0.20 | 0.21 | 490.91 |
| 5LOX–AA | 1.50 | 27.98 | 28,768.14 | 0.19 | 0.14 | 476.64 |
| 5LOX–NDGA | 1.69 | 28.08 | 29,643.07 | 0.24 | 0.16 | 499.00 |
| 5LOX–AKBA | 2.03 | 28.15 | 29,317.11 | 0.49 | 0.29 | 550.78 |
| Mutation | Mutation Energy (kcal/mol) | Effect |
|---|---|---|
| PHE177ALA | −0.44 | NEUTRAL |
| TYR181ALA | 0.16 | NEUTRAL |
| PHE359ALA | −0.32 | NEUTRAL |
| GLN363ALA | −0.16 | NEUTRAL |
| THR364ALA | −0.08 | NEUTRAL |
| HIS367ALA | 0.29 | NEUTRAL |
| LEU368ALA | 0.4 | NEUTRAL |
| HIS372ALA | −0.37 | NEUTRAL |
| LEU373ALA | −0.16 | NEUTRAL |
| ILE406ALA | −0.34 | NEUTRAL |
| ASN407ALA | −0.05 | NEUTRAL |
| LYS409ALA | −0.1 | NEUTRAL |
| ALA410ALA | −0.01 | NEUTRAL |
| LEU414ALA | 0.83 | DESTABILIZING |
| ILE415ALA | 0.25 | NEUTRAL |
| LEU420ALA | −0.04 | NEUTRAL |
| PHE421ALA | −0.2 | NEUTRAL |
| ALA424ALA | 0.04 | NEUTRAL |
| ASN425ALA | 0.08 | NEUTRAL |
| GLN557ALA | −0.3 | NEUTRAL |
| TRP599ALA | −0.09 | NEUTRAL |
| HIS600ALA | −0.14 | NEUTRAL |
| ALA603ALA | 0.04 | NEUTRAL |
| VAL604ALA | −0.11 | NEUTRAL |
| LEU607ALA | 0.46 | NEUTRAL |
| ILE673ALA | −0.36 | NEUTRAL |
| Mutation | Mutation Energy (kcal/mol) | Effect |
|---|---|---|
| VAL29ALA | 0.39 | NEUTRAL |
| LEU66ALA | 0.77 | DESTABILIZING |
| ARG68ALA | 1.27 | DESTABILIZING |
| ARG101ALA | 1.04 | DESTABILIZING |
| VAL107ALA | −0.27 | NEUTRAL |
| GLU108ALA | −0.42 | NEUTRAL |
| VAL109ALA | −0.09 | NEUTRAL |
| VAL110ALA | 0.05 | NEUTRAL |
| LEU111ALA | 0.07 | NEUTRAL |
| HIS125ALA | 0.72 | DESTABILIZING |
| ILE126ALA | 0.39 | NEUTRAL |
| GLN129ALA | 0.74 | DESTABILIZING |
| ARG131ALA | 0.28 | NEUTRAL |
| LYS133ALA | 0.51 | DESTABILIZING |
| GLU134ALA | −1.06 | STABILIZING |
| THR137ALA | −0.25 | NEUTRAL |
| ARG138ALA | 1.02 | DESTABILIZING |
| ASP166ALA | −0.62 | STABILIZING |
| System | 5LOX–AA | 5LOX–NDGA |
|---|---|---|
| ΔEvdw | −52.08 ± 3.35 | −37.33 ± 0.98 |
| ΔEele | −5.68 ± 4.30 | −37.95 ± 5.64 |
| ΔGsolv | 29.26 ± 4.90 | 59.09 ± 4.08 |
| ΔGgas | −57.76 ± 4.54 | −75.27 ± 5.18 |
| ΔGtotal | −28.50 ± 4.11 | −16.18 ± 2.04 |
| Protein | Principle Component (PC) | Probability (%) |
|---|---|---|
| Apo | PC1 | 20.65 |
| PC2 | 14.71 | |
| 5LOX–AA | PC1 | 13.65 |
| PC2 | 10.62 | |
| 5LOX–NDGA | PC1 | 13.76 |
| PC2 | 12.14 | |
| 5LOX–AKBA | PC1 | 27.68 |
| PC2 | 13.48 |
| System | Time (ns) | Volume (Å3) | Depth (Å) |
|---|---|---|---|
| Apo | 352.9 | 200.70 | 13.46 |
| 398.9 | 215.04 | 11.84 | |
| 5LOX–AA | 116.6 | 559.1 | 20.25 |
| 446.3 | 416.77 | 19.03 | |
| 5LOX–NDGA | 46.4 | 354.82 | 13.31 |
| 179.1 | 601.6 | 22.47 | |
| 5LOX–AKBA | 63.1 | 272.90 | 11.70 |
| 429.2 | 188.42 | 12.65 |
| System | Protein | Ligand | SOL |
|---|---|---|---|
| Apo | 5LOX | None | 10,761 |
| 5LOX–AA | 5LOX | AA | 10,815 |
| 5LOX–NGDA | 5LOX | NDGA | 10,802 |
| 5LOX–AKBA | 5LOX | AKBA | 10,845 |
Disclaimer/Publisher’s Note: The statements, opinions and data contained in all publications are solely those of the individual author(s) and contributor(s) and not of MDPI and/or the editor(s). MDPI and/or the editor(s) disclaim responsibility for any injury to people or property resulting from any ideas, methods, instructions or products referred to in the content. |
© 2024 by the authors. Licensee MDPI, Basel, Switzerland. This article is an open access article distributed under the terms and conditions of the Creative Commons Attribution (CC BY) license (https://creativecommons.org/licenses/by/4.0/).
Share and Cite
Liu, Y.; Wang, K.; Cao, F.; Gao, N.; Li, W. Interactions between Inhibitors and 5-Lipoxygenase: Insights from Gaussian Accelerated Molecular Dynamics and Markov State Models. Int. J. Mol. Sci. 2024, 25, 8295. https://doi.org/10.3390/ijms25158295
Liu Y, Wang K, Cao F, Gao N, Li W. Interactions between Inhibitors and 5-Lipoxygenase: Insights from Gaussian Accelerated Molecular Dynamics and Markov State Models. International Journal of Molecular Sciences. 2024; 25(15):8295. https://doi.org/10.3390/ijms25158295
Chicago/Turabian StyleLiu, Yuyang, Kaiyu Wang, Fuyan Cao, Nan Gao, and Wannan Li. 2024. "Interactions between Inhibitors and 5-Lipoxygenase: Insights from Gaussian Accelerated Molecular Dynamics and Markov State Models" International Journal of Molecular Sciences 25, no. 15: 8295. https://doi.org/10.3390/ijms25158295
APA StyleLiu, Y., Wang, K., Cao, F., Gao, N., & Li, W. (2024). Interactions between Inhibitors and 5-Lipoxygenase: Insights from Gaussian Accelerated Molecular Dynamics and Markov State Models. International Journal of Molecular Sciences, 25(15), 8295. https://doi.org/10.3390/ijms25158295