Abstract
α-glucosidase, a pharmacological target for type 2 diabetes mellitus (T2DM), is present in the intestinal brush border membrane and catalyzes the hydrolysis of sugar linkages during carbohydrate digestion. Since α-glucosidase inhibitors (AGIs) modulate intestinal metabolism, they may influence oxidative stress and glycolysis inhibition, potentially addressing intestinal dysfunction associated with T2DM. Herein, we report on a study of an ortho-carbonyl substituted hydroquinone series, whose members differ only in the number and position of methyl groups on a common scaffold, on radical-scavenging activities (ORAC assay) and correlate them with some parameters obtained by density functional theory (DFT) analysis. These compounds’ effect on enzymatic activity, their molecular modeling on α-glucosidase, and their impact on the mitochondrial respiration and glycolysis of the intestinal Caco-2 cell line were evaluated. Three groups of compounds, according their effects on the Caco-2 cells metabolism, were characterized: group A (compounds 2, 3, 5, 8, 9, and 10) reduces the glycolysis, group B (compounds 1 and 6) reduces the basal mitochondrial oxygen consumption rate (OCR) and increases the extracellular acidification rate (ECAR), suggesting that it induces a metabolic remodeling toward glycolysis, and group C (compounds 4 and 7) increases the glycolysis lacking effect on OCR. Compounds 5 and 10 were more potent as α-glucosidase inhibitors (AGIs) than acarbose, a well-known AGI with clinical use. Moreover, compound 5 was an OCR/ECAR inhibitor, and compound 10 was a dual agent, increasing the proton leak-driven OCR and inhibiting the maximal electron transport flux. Additionally, menadione-induced ROS production was prevented by compound 5 in Caco-2 cells. These results reveal that slight structural variations in a hydroquinone scaffold led to diverse antioxidant capability, α-glucosidase inhibition, and the regulation of mitochondrial bioenergetics in Caco-2 cells, which may be useful in the design of new drugs for T2DM and metabolic syndrome.
1. Introduction
Diabetes mellitus (DM) is a metabolic chronic disease, highly prevalent in both the developing and developed world [1]. It is characterized by inadequate glycemic control, caused by either reduced insulin secretion (type 1 diabetes mellitus, T1DM) or by a reduced cellular response to insulin (type 2 diabetes mellitus, T2DM) [2,3,4], which is the main type of diabetes, with a prevalence of the 90–95% of the total incidence [5]. In T2DM, enhanced ROS production via reduced intracellular antioxidant levels is observed [6,7], which, at the same time, accelerates the dysregulation of glucose metabolism and tissue damage through signal transductions.
Molecular crosstalk between microRNAs and oxidative stress in the pathogenesis of T2DM and its related health problems has been pointed out [6]. Also, recently, it has been suggested that miRNAs and oxidative stress influence each other. Oxidative stress seems to regulate the function and biogenesis of several miRNAs and vice versa. An imbalance in miRNA expression can lead to oxidative stress by promoting free radical generation and (or) reducing the endogenous antioxidant capacity [8,9,10].
On the other hand, α-glucosidase is an emerging target in developing novel T2DM agents such as PTP1B and aldose reductase, among others [11,12,13]. α-glucosidase is present in the brush border membrane of intestinal cells [14]. It catalyzes the hydrolysis of the α-(1,4)-glycosidic linkage of sugar (disaccharides and starch), releasing free monosaccharides (α-D-glucose) during the final step of carbohydrate digestion. The α-glucosidase inhibitors (AGIs) can suppress postprandial hyperglycemia and decrease carbohydrate digestion rate, therefore reducing the glucose level in the bloodstream [15,16,17,18,19,20,21].
It is known that dietary polyphenols modulate post-prandial increases in glucose levels, intestinal integrity, and oxidative damage [22,23,24]. Consequently, a growing interest in this type of compound has been observed in the last few years. It has been suggested that oxidative energy metabolism plays a crucial role in mitochondrial ATP production and in maintaining a gut barrier with high integrity [25]. The disruption of this intestinal barrier function is related to inflammation [26] and dysmetabolic conditions, including T2DM [27]. In this context, the human intestinal epithelial Caco-2 cell line has been used to assess the relationship between mitochondrial ATP production and intestinal permeability [28].
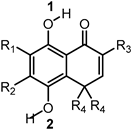
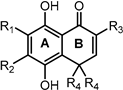
Previously, we have reported an ortho-carbonyl hydroquinone series that disrupts mitochondrial bioenergetics in cancer cells by Complex I inhibition and oxidative phosphorylation uncoupling without affecting non-cancer cells [29,30,31]. On the other hand, it has been described that certain hydroquinones and quinones can induce redox cycling [32,33,34,35]; however, this is not the case with these hydroquinones [30]. Since they exhibit a high antioxidant capability in cell-free analysis [36] and, as has been discussed above, oxidative stress is involved in the intestinal dysfunction associated with T2DM, this work aims to study the antioxidant capacity of the methyl derivatives of a bicyclic ortho-carbonyl hydroquinone (Table 1), which differs only in the number and position of methyl groups, and its effects as an AGI, and in modulating the energetic metabolism of Caco-2 cells.

Table 1.
Compounds studied in this work.
2. Results
2.1. Synthesis of the Compounds
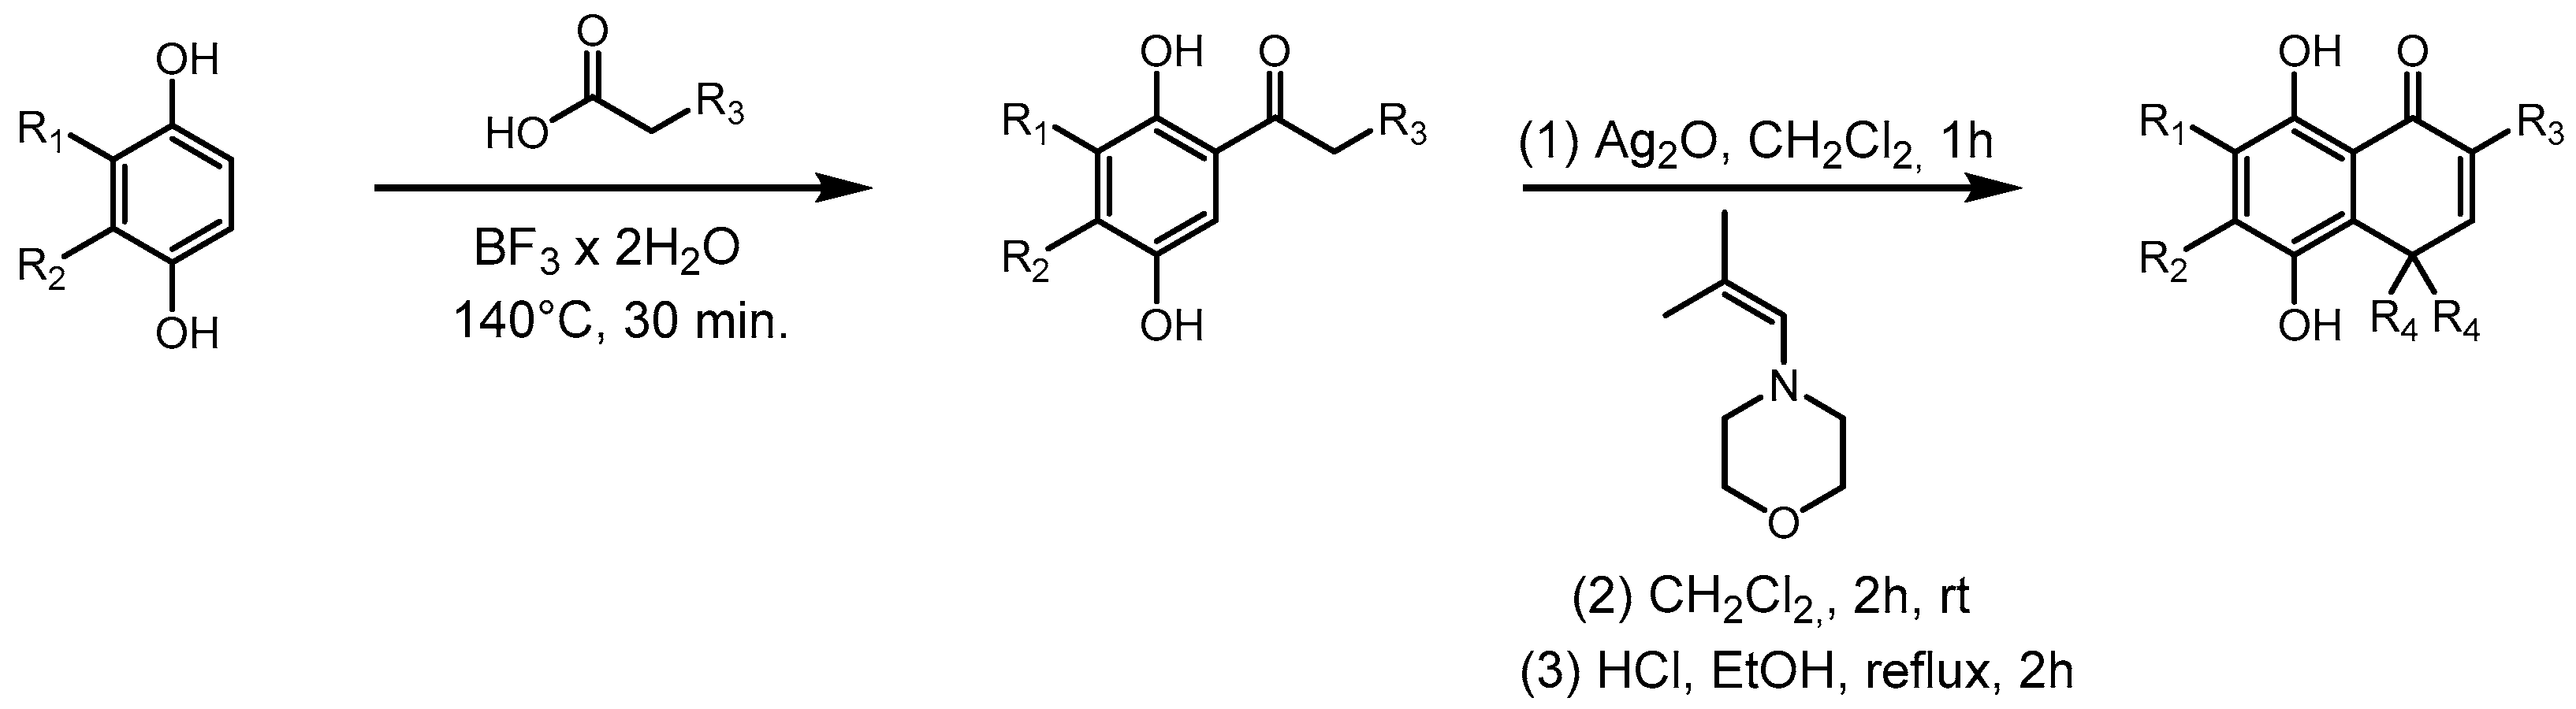
The new hydroquinones (Scheme 1) were obtained in two steps. The first consists of obtaining acylhydroquinones following the reported method [37,38] with a slight modification. To a Reaction Vial G10 (Anton-Paar, Graz, Austria) equipped with a stir bar, the following were added: 500 mg of corresponding hydroquinone, a 1.5 equivalent of the corresponding carboxylic acid, and 3 mL of Boron trifluoride dihydrate. The mixture was heated at 160 °C for 30 min in a Monowave 50 reactor (Anton-Paar). The mixture was allowed to cool to room temperature, neutralized with saturated sodium bicarbonate solution, and extracted with ethyl acetate. The extract was washed with distilled water, dried with anhydrous sodium sulfate, and then filtered and concentrated in a rotavapor. Afterward, the corresponding acylhydroquinone was purified by flash chromatography with hexane/ethyl acetate 8:1 v/v as an eluent. The second step was performed following reference [39], although this was also done with slight variations. A mixture of corresponding acylhydroquinone (1 equiv) and Ag2O (2.5 equiv) in 30 mL of dichloromethane was vigorously stirred for 1–2 h at r.t., yielding the corresponding quinone. This mixture was filtered through celite and added dropwise to a solution of the 4- (2-methyl-2-propenyl)morpholine or 4-(2-ethylbut-1-en-1-yl)morpholine at r.t. for 2 h, being monitored by thin-layer chromatography. Then, the solvent was evaporated under reduced pressure, and the residue was dissolved in a mixture of ethanol and hydrochloric acid and refluxed by 1 h. Next, it was poured on an ice/water mixture, and the product was extracted with 3 portions of 20 mL of ethyl acetate, which were dried with anhydrous sodium sulfate and then filtered; the solvent was evaporated under reduced pressure and purified by flash chromatography using hexane/ethyl acetate 4:1 v/v as an eluent.

Scheme 1.
Synthesis of methyl derivatives of ortho-carbonyl hydroquinones. R corresponds to those shown in Table 1.
2.2. In Vitro Antioxidant Capacity
The radical-scavenging activities of the hydroquinone series against peroxyl radicals were assessed (ORAC assays). The results are presented in Table 2. For the series with the gem-dimethyl on ring B (compounds 1–5), compound 1 showed the highest antioxidant capacity (8.8 + 0.2 mol TE/mol comp). Similarly, for the series with the gem-diethyl group on ring B (compounds 6–10), compound 6 presents the highest antioxidant capacity (7.0 + 0.3 mol TE/mol compound). These results indicate that introducing methyl substituents such as R1, R2, and R3 decreases the antioxidant capacity of the compounds. The replacement of the gem-dimethyl with the gem-diethyl group also decreases the antioxidant capacity.
2.3. Calculation of Main Thermodynamic Parameters
To obtain insight into the mechanism responsible for the antioxidant capacity of the compounds, we carried out DFT calculations. We considered the three mechanisms commonly associated with radical scavenging [40]: Hydrogen atom transfer (HAT), sequential electron transfer-proton transfer (SET-PT), and sequential proton loss-electron transfer (SPLET). These mechanisms can occur in parallel but at different rates. The thermodynamic parameters associated with each mechanism can help to assess their feasibility. The HAT mechanism is associated with the bond dissociation enthalpy (BDE) [40]. The SET-PT mechanism is associated with ionization potential (IP) and proton dissociation enthalpy (PDE) [40]. The SPLET mechanism is associated with proton affinity (PA) and electron transfer enthalpy (ETE) [40]. We evaluated the BDE for both OH groups (1 and 2 in Table 2) present in all compounds (BDE 1 and BDE 2 in Table 2). The highest values correspond to BDE 1, suggesting that the intramolecular hydrogen bond (IAHB) C-H∙∙∙O impedes O-H dissociation. The BDEs of the O-H not involved in an IAHB presented values around 70 kcal/mol. Based on the above, the SET-PT and SPLET mechanisms only were evaluated for the estimation of PDE and PA for OH2.
Table 2.
In vitro radical-scavenging activities (ORAC), calculated BDEs, IP, PDE, PA, and ETE (values in kcal/mol), and inhibitory effect of ortho-carbonyl hydroquinones on α-glucosidase activity. Data are shown as means ± SD of three independent experiments. * Calculated BDE of the O-H 1 for anions deprotonated at O-H 2. n.d.: not determined. n: not significant, a: p < 0.001 versus acarbose.
 | |||||||||
|---|---|---|---|---|---|---|---|---|---|
| Compound | ORAC | HAT | SET-PT | SPLET | Inhibition of α-Glucosidase Activity | ||||
| (mol TE/mol Compound) | BDE 1 | BDE 2 | IP | PDE 2 | PA 2 | ETE 2 | BDE OH1 * | IC50 (µM) | |
| 1 | 8.8 + 0.2 | 90.07 | 71.96 | 178.08 | 207.21 | 329.02 | 56.28 | 65.09 | 190 + 2.2 n |
| 2 | 5.5 + 0.2 | 89.31 | 69.32 | 175.33 | 207.32 | 326.62 | 56.03 | 65.43 | 140 + 2.0 a |
| 3 | 3.9 + 0.1 | 87.62 | 70.92 | 173.67 | 210.58 | 329.52 | 54.73 | 63.93 | >500 |
| 4 | 1.05 + 0.03 | 87.32 | 68.35 | 169.98 | 211.71 | 327.81 | 53.87 | 63.66 | 245 + 10.1 a |
| 5 | 0.37 + 0.01 | 86.78 | 67.95 | 168.50 | 212.78 | 328.83 | 52.45 | 63.72 | 103 + 2.9 a |
| 6 | 7.0 + 0.3 | 89.16 | 70.61 | 176.68 | 207.26 | 327.51 | 56.43 | 64.93 | 195 + 2.3 n |
| 7 | 7.2 + 0.4 | 89.58 | 69.26 | 173.95 | 208.64 | 326.81 | 55.77 | 65.75 | 110 + 1.6 a |
| 8 | 5.9 + 0.3 | 87.49 | 70.75 | 172.72 | 211.36 | 328.95 | 55.13 | 64.03 | 60 + 1.5 a |
| 9 | 0.83 + 0.03 | 86.89 | 68.70 | 169.18 | 212.85 | 327.25 | 54.78 | 64.08 | >500 |
| 10 | 0.10 + 0.01 | 86.78 | 67.95 | 168.50 | 212.78 | 328.83 | 52.46 | 63.73 | 78 + 1.1 a |
| Acarbose | n.d. | n.d. | n.d. | n.d. | n.d. | n.d. | n.d. | n.d. | 194 + 1.7 |
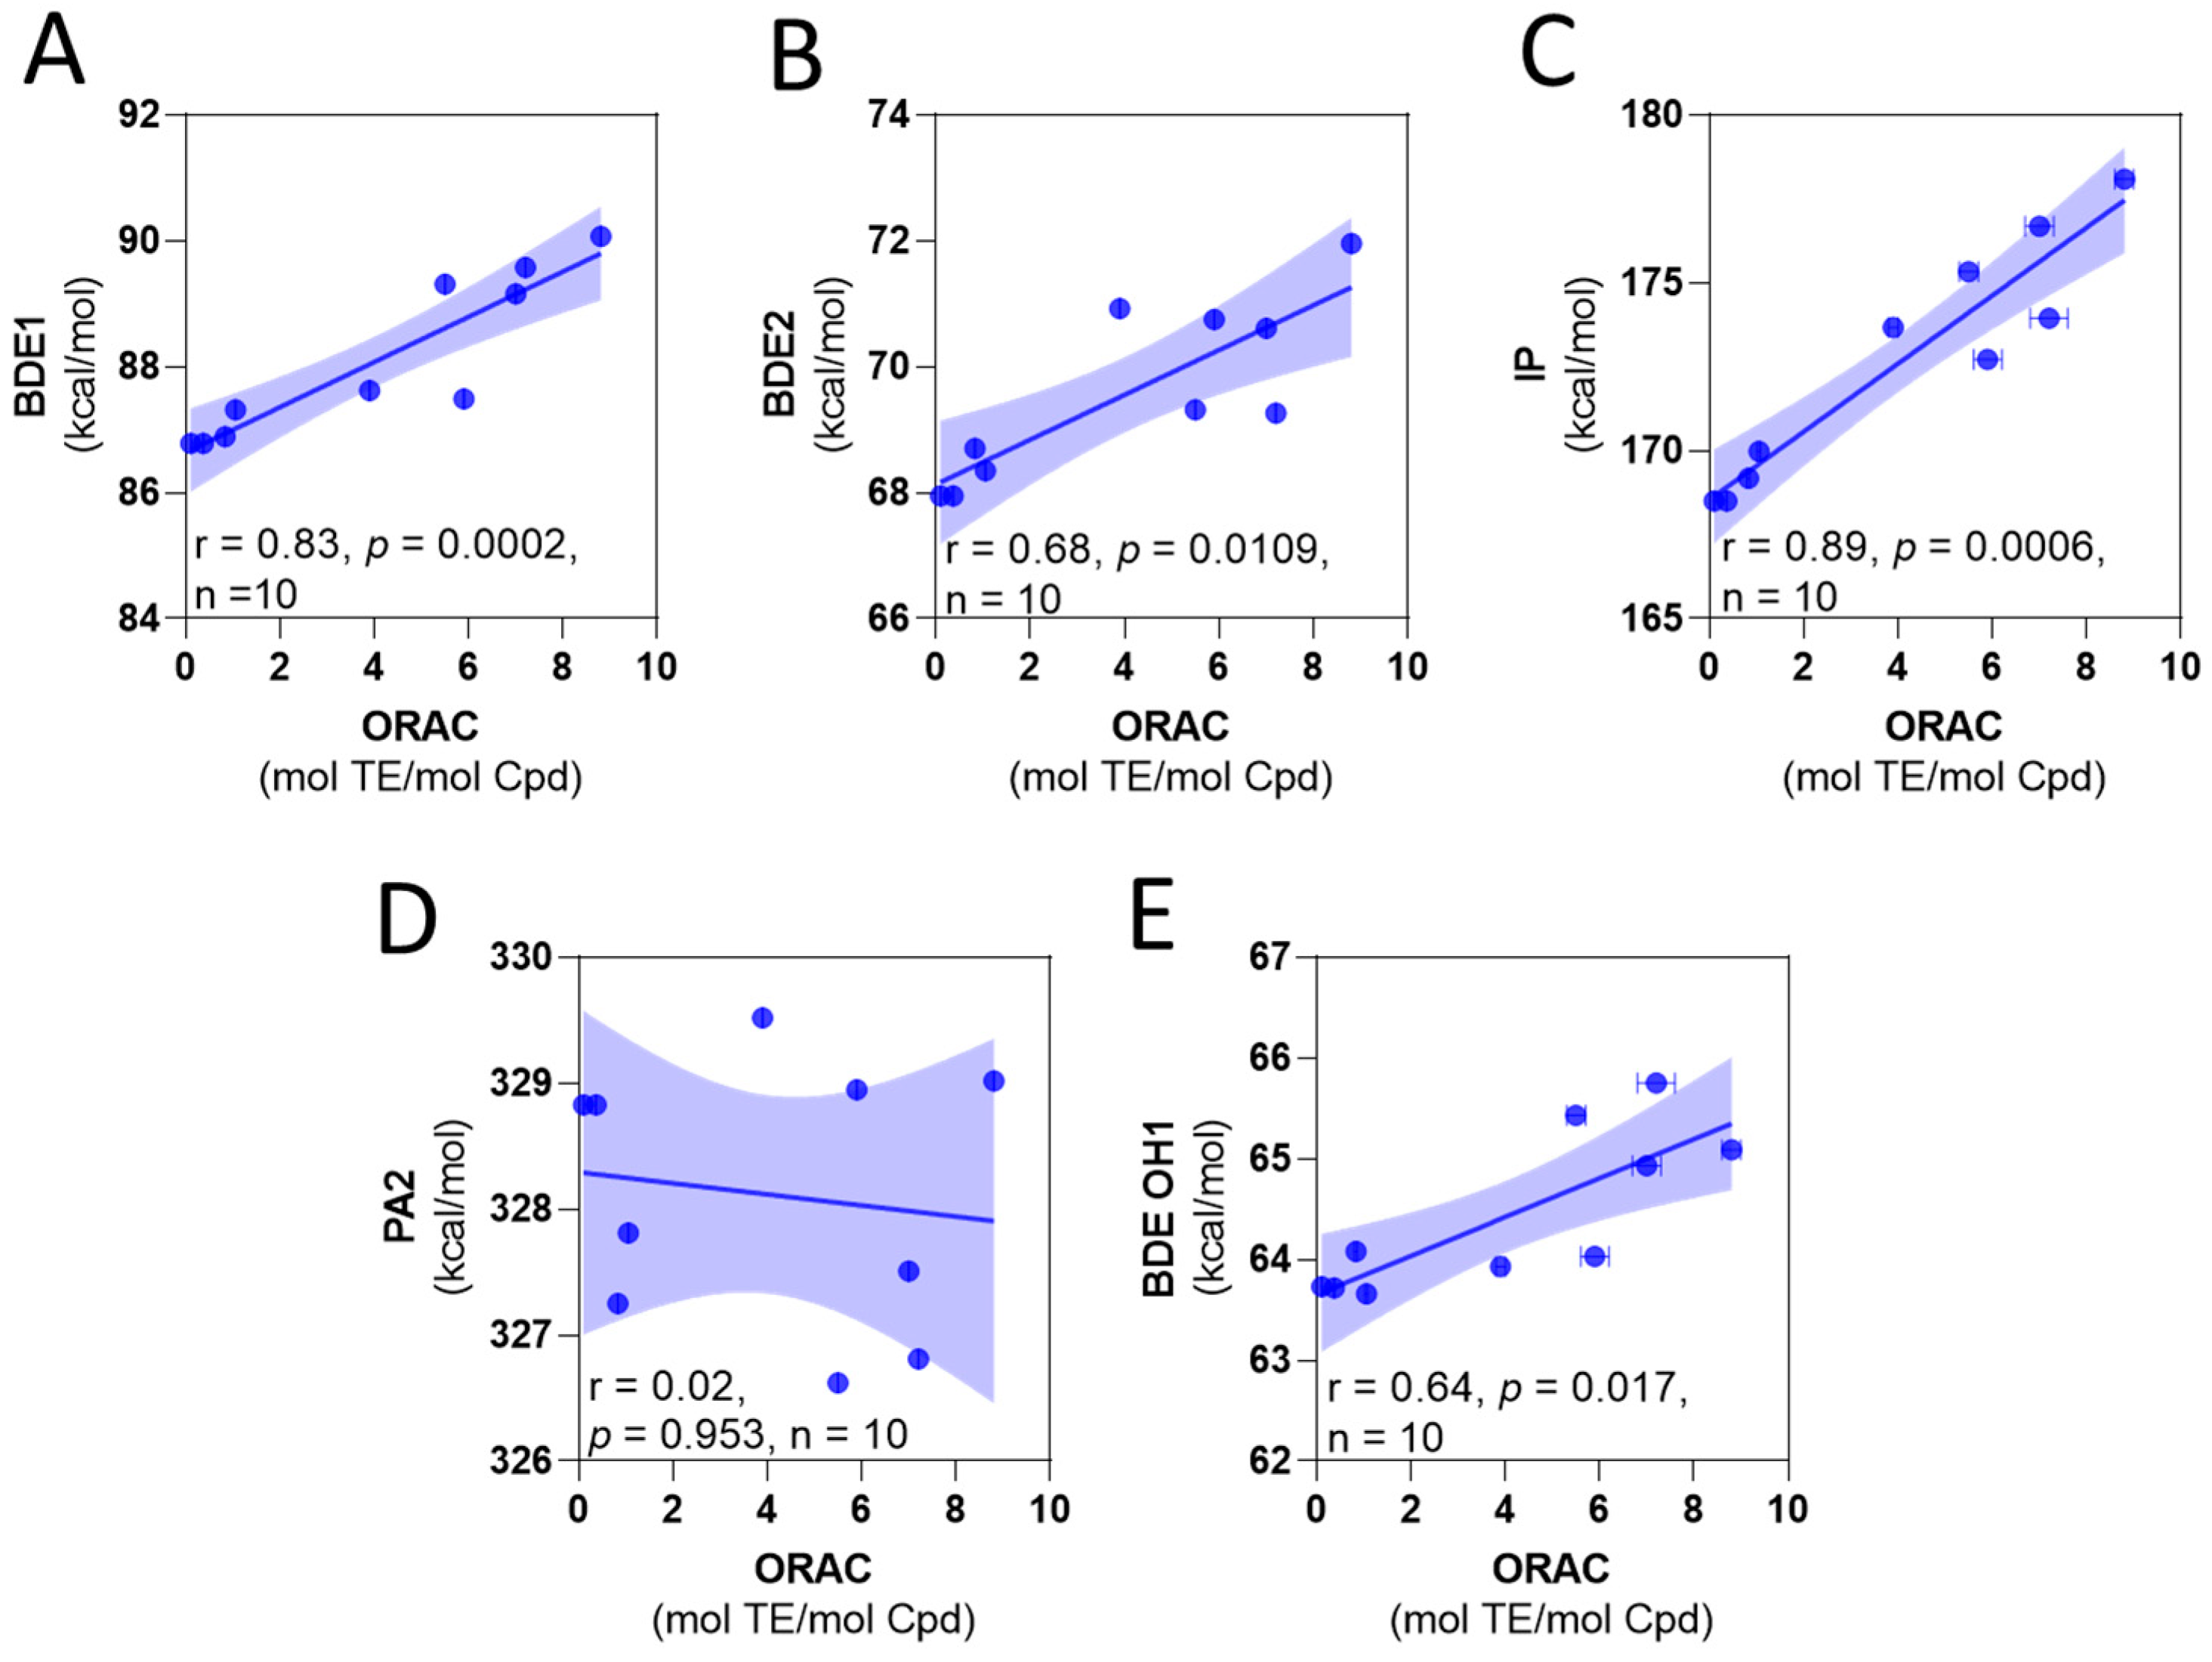
To correlate to the experimental antioxidant capacity mechanism in relation to thermodynamic parameters, two approaches can be employed [41,42,43]. Some reports consider the value of the parameter as the key factor associated with a mechanism [41,42]; namely, the lower value, the higher their contribution of the mechanism. However, an alternative method is to consider the correlation between the experimental values of assays and thermodynamic parameters [43]. Following the first approach, the most favorable mechanism corresponds to the HAT, with the H-atom abstraction corresponding to the hydroxyl 2. Looking into the correlation between ORAC and the thermodynamic parameters (Figure 1), we found that the best correlation corresponds to the IP. However, the BDEs and IP slopes are positive (Figure 1A–C), indicating that high values of the thermodynamic parameter (theoretically a less potent antioxidant) correspond to the high values of ORAC (experimentally stronger antioxidants).
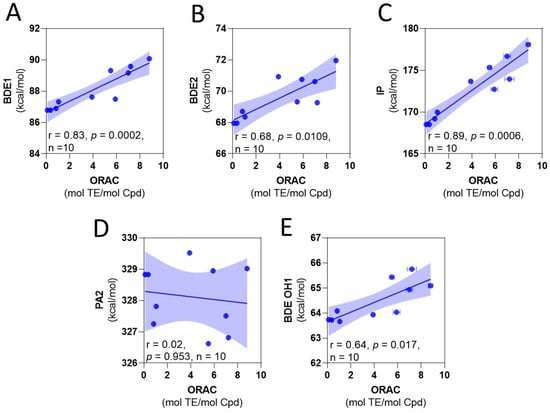
Figure 1.
Correlation among calculated thermodynamic parameters and experimental ORAC values. (A) BDE of OH1 versus ORAC. (B) BDE of OH2 versus ORAC. (C) IP versus ORAC. (D) PA of OH2 versus ORAC. (E) BDE of OH1 for the anions deprotonated at OH2 versus ORAC.
We also consider the hydroquinone anions, with the compounds deprotonated at hydroxyl 2, as contributing antioxidant species. The BDE for the O-H 1, obtained in this form, is presented in Table 2. These values were lower than those of neutral species. However, the correlation exhibited the same tendency regarding the experimental ORAC values (Figure 1D,E). These results suggest that the variation of the antioxidant capacity of the compounds is influenced by a factor not considered in the calculations. These variables (BDE, IP, and PA) do not consider the kinetic factors that can influence the experimental antioxidant capacity, and the steric hindrance in particular can lead to a reduction in the antioxidant capacity [44,45,46]. In this case, the increase in the number of the methyl groups leads to a variation in the electronic density that should favor the antioxidant capacity; however, it also increases the steric hindrance to access the –OH group, which can explain the tendency observed in the ORAC results.
2.4. In Vitro and In Silico α-Glucosidase Inhibitory Activity
The effect of synthesized hydroquinones against α-glucosidase activity was evaluated (Table 2). Most of the evaluated compounds showed high inhibitory activity, with six of the ten compounds showing IC50 values lower than the well-known AGI acarbose (IC50 = 194.0 + 1.7 µM). Compounds 8 and 10 presented the highest inhibitory potency, with IC50 values of 60.0 + 1.5 µM and 78.0 + 1.1 µM, respectively, and compound 9 was the worst. These results suggest that the gem-diethyl group in ring B is a key structural factor in the inhibitory potency of the compounds, but the presence of methyl substituents in the rest of the structure needs detailed examination due to their variable effect.
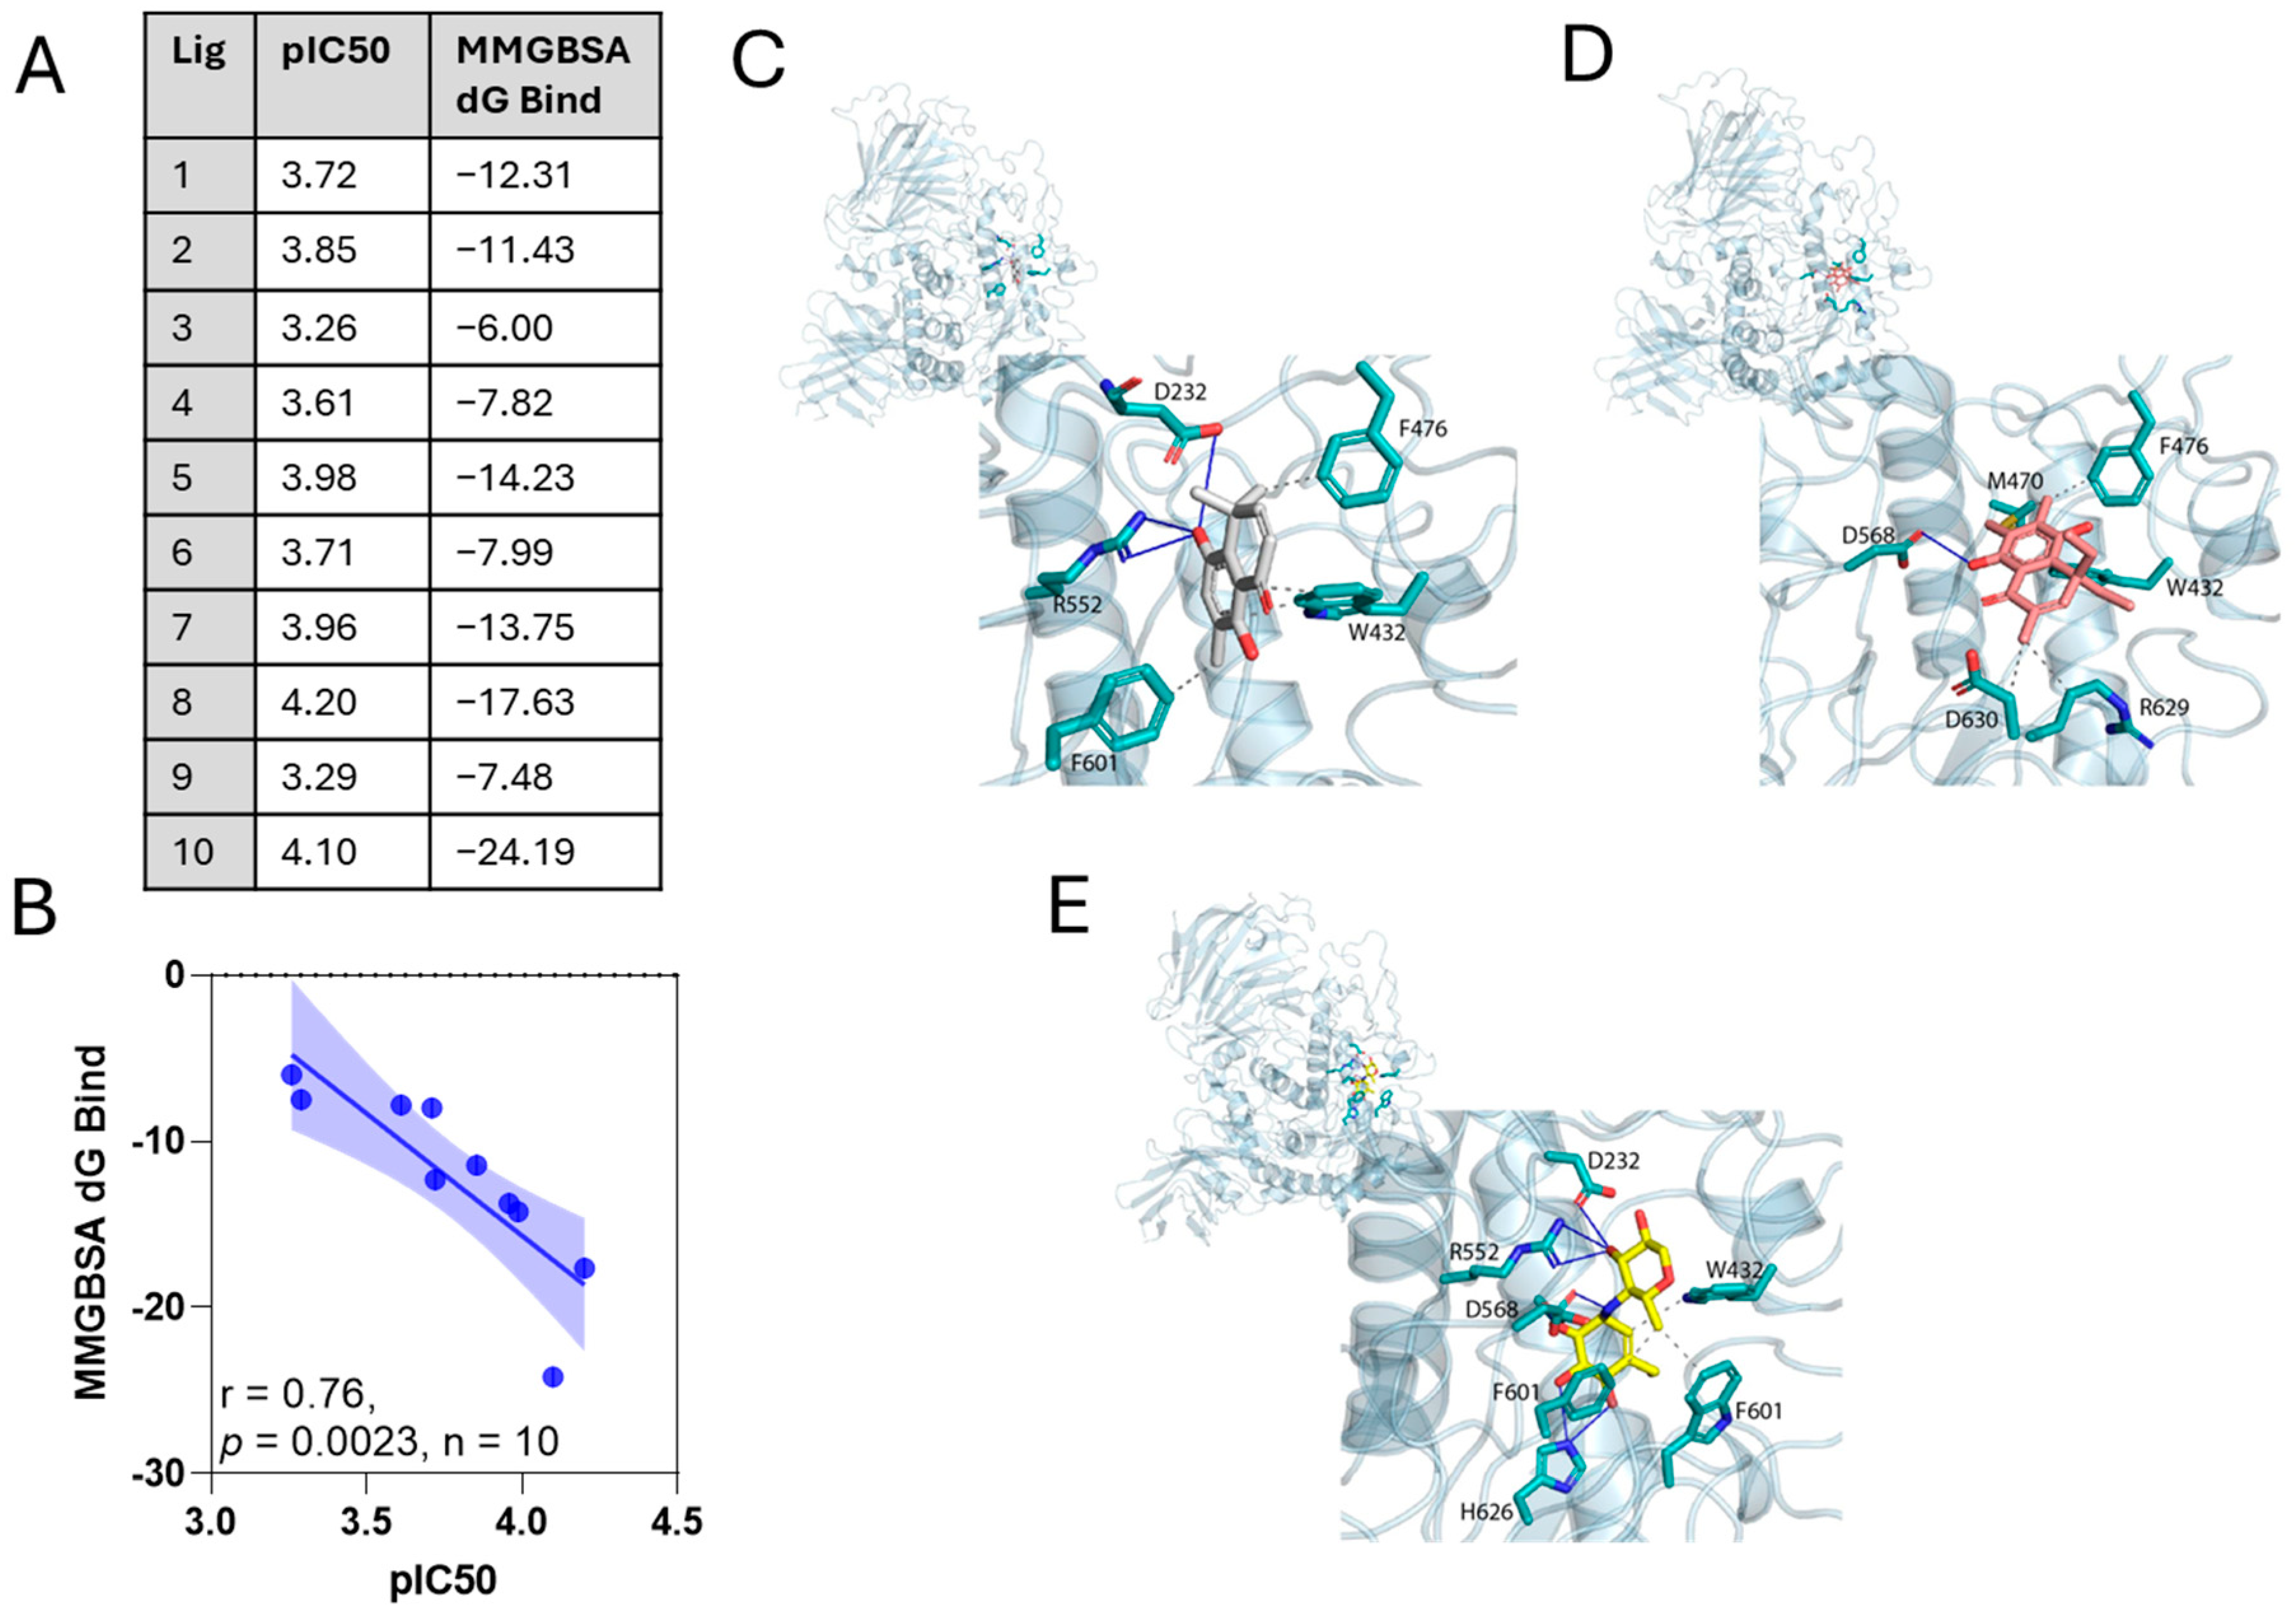
To obtain a detailed explanation of the structure–activity relationship observed in the experimental inhibitory results, we carried out molecular docking. Several conformers and poses for each molecule were analyzed. The binding site was defined by the crystallographic structure obtained for α-glucosidase in complex with acarbose (PDB code: 3W37). The results were used as an input for an MMGBSA free energy calculation study. Figure 2A shows the values of MMGBSA ΔGbind and the IC50 presented as pIC50 = –log[IC50], and the correlation between them is shown in Figure 2B. The correlation between experimental pIC50 values and calculated MMGBSA ΔGbind gives a R2 = 0.71.
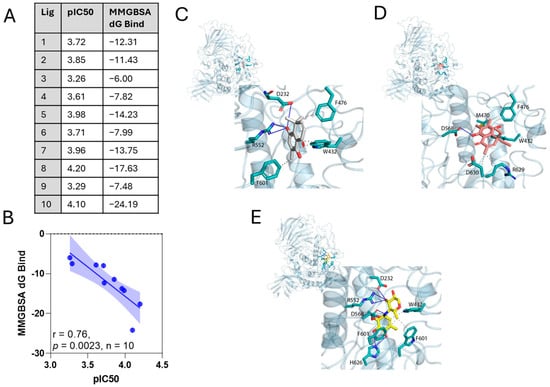
Figure 2.
In silico molecular docking for ortho-carbonyl hydroquinone series against the α-glucosidase enzyme. (A) Binding free energy components for the α-glucosidase–hydroquinone (3 and 10) complexes calculated by MM-GBSA analysis; all energies are in kcal/mol and pIC50 for ortho-carbonyl hydroquinones. (B) Correlations of calculated MMGBSAΔG values with experimental IC50 inhibitory values, expressed as pIC50 = −log [IC50]. The r square value from linear regression and p-value for Spearman’s correlation (n = 10) are shown. (C–E) 3D maps binding interactions of compound 3 and 10 against the α-glucosidase enzyme. Ligand compound 3 (A,C) and compound 10 (B,D) exposure points are indicated with gray coloring, while the binding interactions of ligands with α-glucosidase are indicated with red lines. (C) Binding free energy components for the α-glucosidase–hydroquinone (3 and 10) complexes calculated by MM-GBSA analysis; all energies are in kcal/mol.
Figure 2 shows 3D maps of the binding interactions of compound 3 (Figure 2C), compound 10 (Figure 2D), and acarbose (Figure 2E) with the α-glucosidase enzyme. Acarbose, which corresponds to the model ligand to α-glucosidase, shows a three-center hydrogen bond interaction between one of their hydroxyl groups with aspartic acid 232 and arginine 552, a hydrogen bond interaction between another of their hydroxyls and aspartic acid 568, and a hydrogen bond interaction between two other hydroxyls and histidine 626. Additional hydrophobic interactions of acarbose with tryptophan 432 and phenylalanine 601 are also identified. Compound 3, which presented the highest MMGBSA ΔGbind values (lowest affinity), presents a three-center hydrogen bond interaction between one of their hydroxyls with aspartic acid 232 and arginine 552, like acarbose, hydrophobic interactions with phenylalanine 601 and phenylalanine 476, and π-π stacking interactions with tryptophan 432. Compound 10, instead, with the lowest MMGBSA ΔGbind value (highest affinity), shows a hydrogen bond between one of their hydroxyls and aspartic acid 568. In addition, it presents hydrophobic interactions with aspartic acid 630, arginine 629, phenylalanine 476, and methionine 470, and additionally a π-π stacking interaction with tryptophan 432.
MMGBSA binding free energies were estimated for the complex of the enzyme with compounds 3 and 10 (Table 3). Compound 10 shows a stronger net binding energy (ΔGbind) compared with compound 3 (−24.19 vs. 6.00 kcal/mol). For both compounds, the Van der Waals energy dominated over all other energies. The favorable contribution of lipophilic and electrostatic binding energy (ΔGbind LP and ΔGbind CB) is similar for both compounds. The most remarkable difference is the unfavorable contribution of the generalized Born electrostatic solvation energy (ΔGbind GB) for compound 3 compared with compound 10.
Table 3.
Calculated binding energies of molecules 3 and 10 in the complex.
2.5. Effect of Ortho-Carbonyl Hydroquinones on Proliferation and Metabolism of Caco-2 Cells
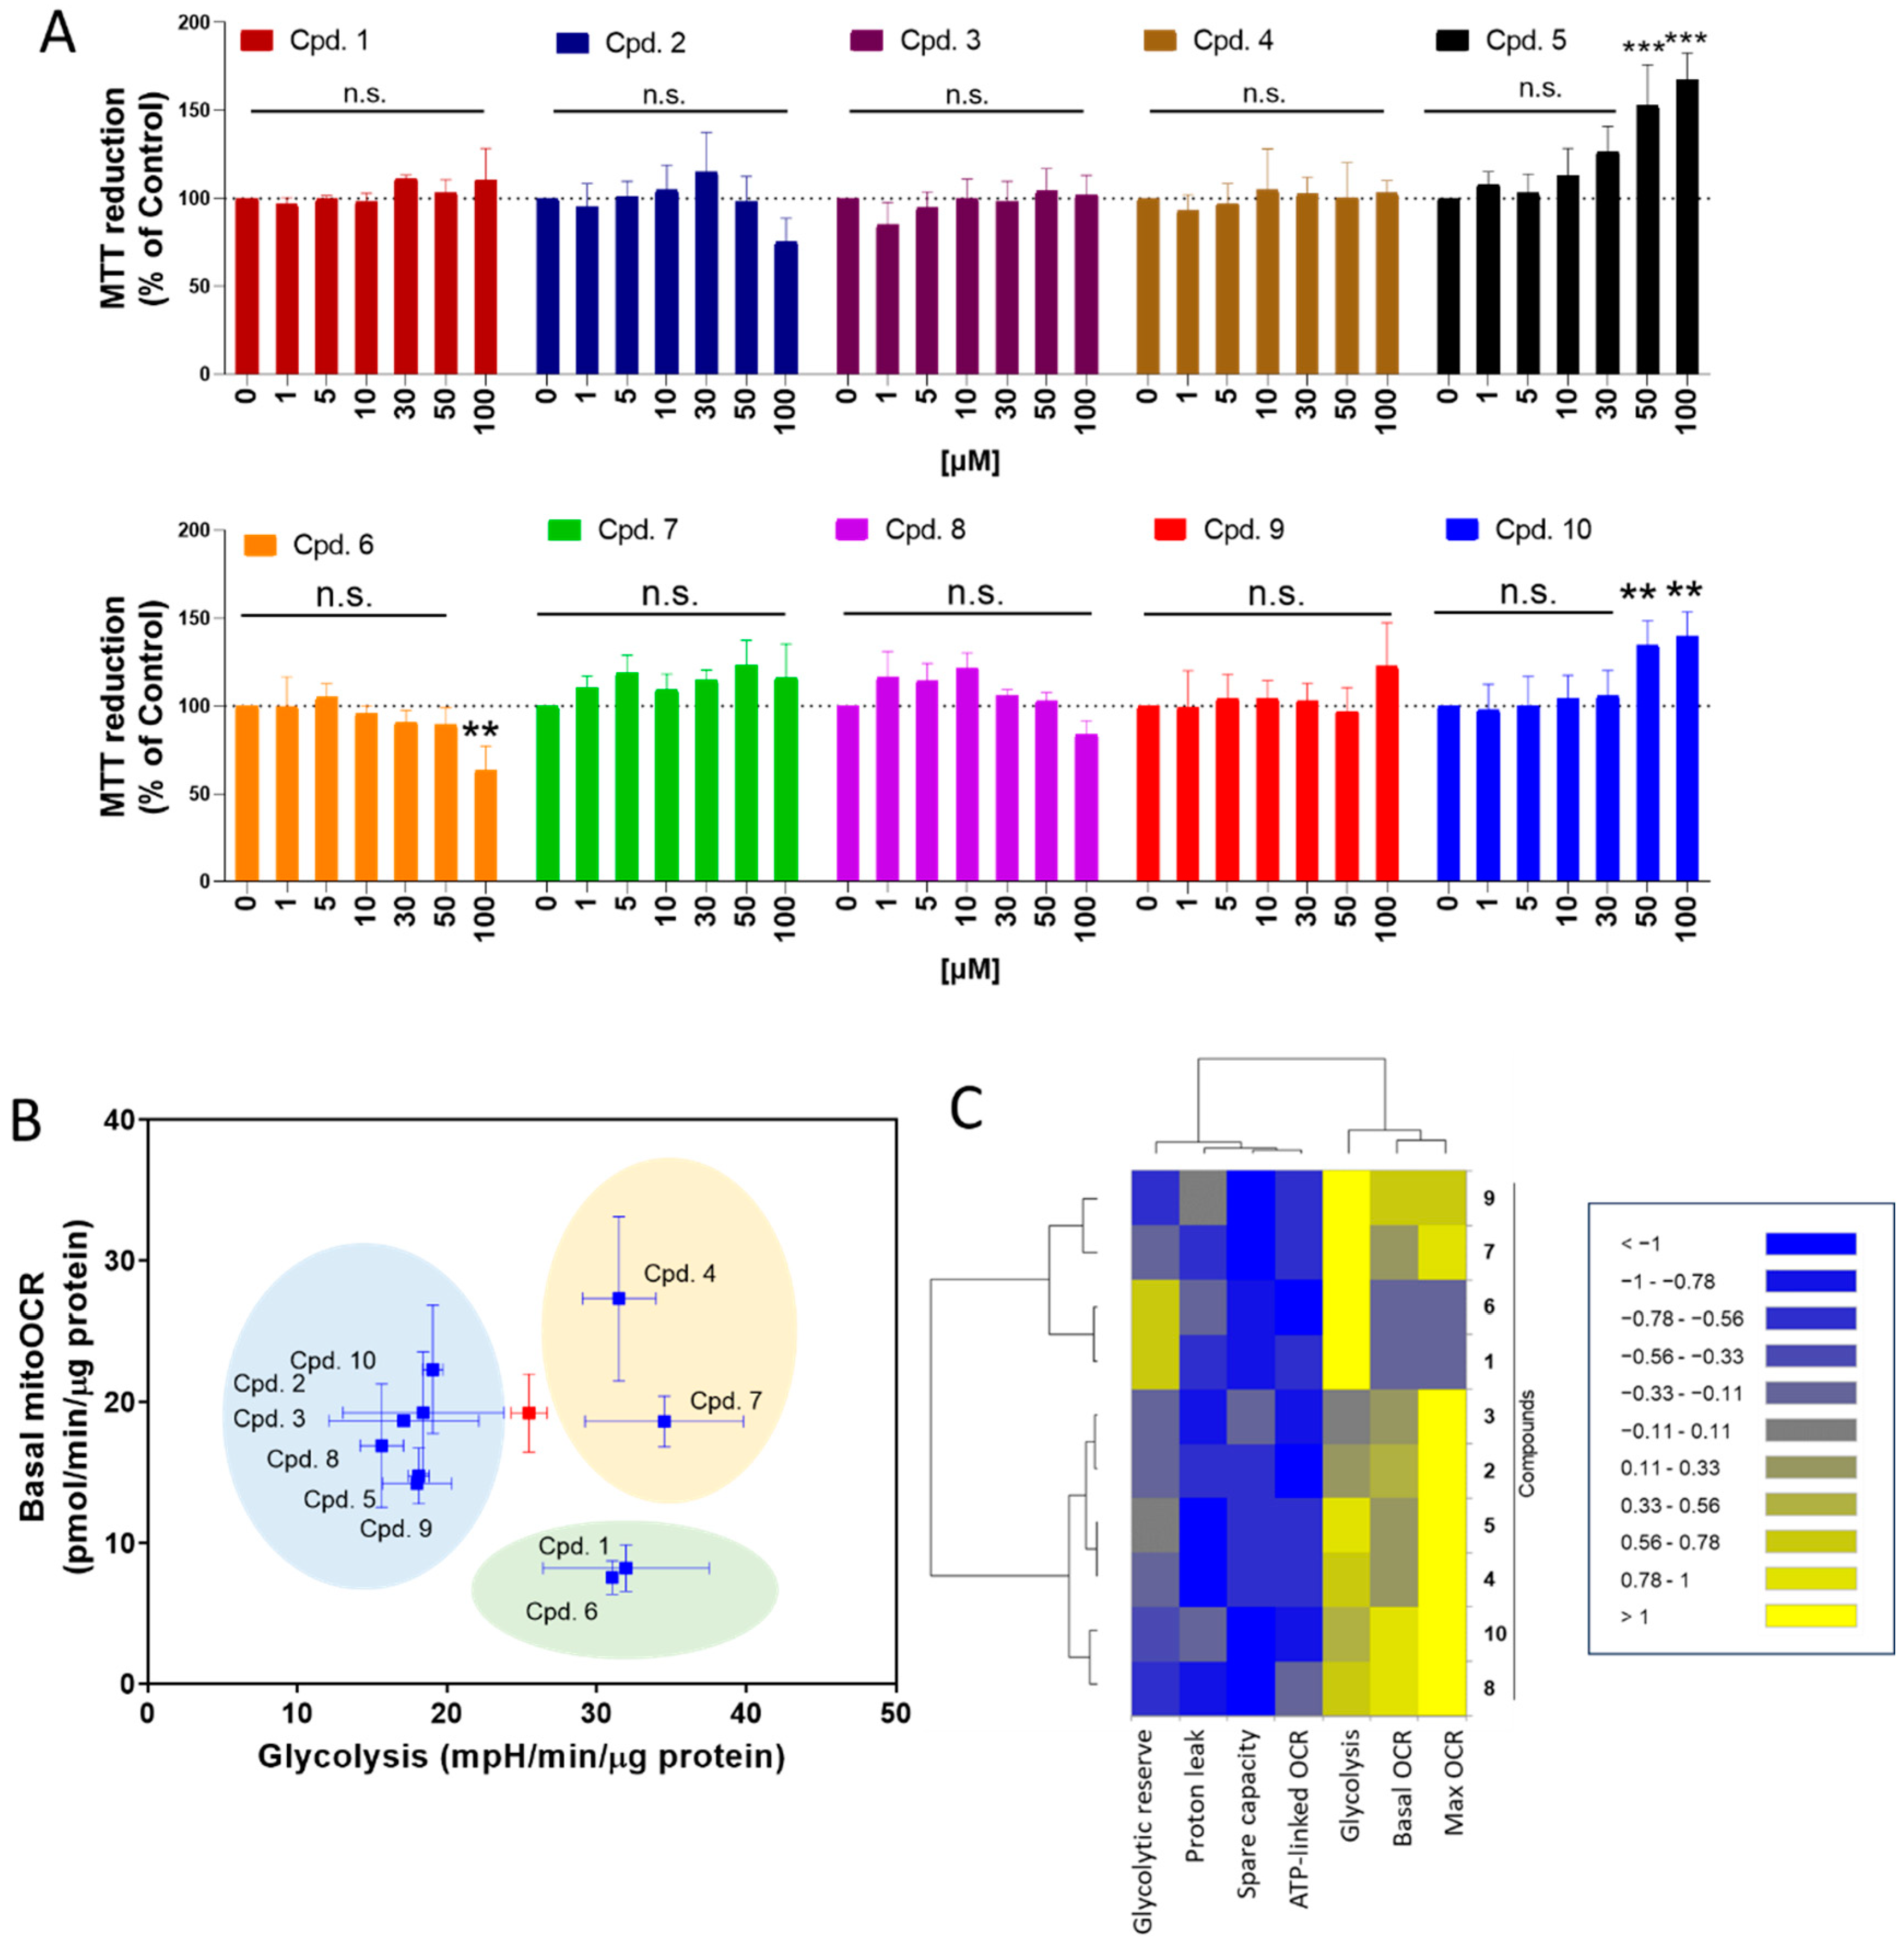
We evaluate the effect of ortho-carbonyl hydroquinones 1–10 on the intestinal Caco-2 cell line at 24 h of treatment. As Figure 3A shows, compounds 5 and 10 significantly increased the MTT reduction, suggesting that these compounds increase the cell number. Consistent with the antiproliferative effect previously described by us [30], compound 6, instead, decreased the MTT reduction. The other compounds of this series did not show significant changes in Caco-2 cell experiments.

Figure 3.
Effect of ortho-carbonyl methyl-substituted hydroquinones on proliferation, mitochondrial respiration, and glycolysis in Caco-2 cells. (A) Effect of compounds on the MTT reduction in Caco-2. Cells were treated with compounds (1, 5, 10, 30, 50, and 100 µM) for 24 h. (B) Dot-plot for basal mitochondrial OCR (basal mitoOCR) vs. glycolysis. The red square represents to control condition. Three groups of compounds are highlighted in blue, yellow, and green. (C) Dendrogram with five and two parameters of mitochondrial respiration and glycolysis, respectively, affected by compounds (100 µM) for 24 h of treatment. Data are shown as means ± SD of three independent experiments. ** p < 0.01, *** p < 0.001 control, and n.s.: not significant.
We previously described how ortho-carbonyl hydroquinone scaffolds inhibit oxidative phosphorylation in breast cancer cells [29,30,31,37]. Since the reduction in glucose utilization and metabolism in intestinal cells is a promising target for T2DM treatment, the effect of these compounds on mitochondrial respiration and glycolysis in Caco-2 cells was determined. As Figure 3B shows, three groups of compounds were identified in a dot-plot from basal mitochondrial OCR and glycolysis (ECAR). Compared to the control (red dot), group A (compounds 2, 3, 5, 8, 9, and 10) reduces the glycolysis. Group B (compounds 1 and 6) reduces the basal mitoOCR and increases ECAR, suggesting that it induces a metabolic remodeling toward glycolysis, and group C (compounds 4 and 7) increases the glycolysis lacking effect on OCR. The effect of ortho-carbonyl hydroquinone series (100 µM) on five parameters of mitochondrial respiration (basal OCR, max OCR, spare capacity, ATP-linked OCR, and proton leak-driven OCR), and two of glycolysis (glycolytic capacity and glycolysis), is represented in a dendrogram (Figure 3C). Interestingly, two clusters of compounds are shown with differential effects on maximal OCR and glycolysis. Cluster 1 is composed of glycolysis enhancers with a strong inhibitory effect on max. OCR: compounds 1, 6, 7, and 9. Cluster 2 is composed of glycolysis inhibitors with a reduced effect on max OCR: compounds 2, 3, 4, 5, 8, and 10. No correlations between OCR and ECAR parameters, α-glucosidase activity inhibition, or ORAC were observed (Supplementary Figure S1).
2.6. Compounds 5 and 10 Differentially Act on Mitochondrial Respiration, Glycolysis, and ROS Production in Caco-2 Cells
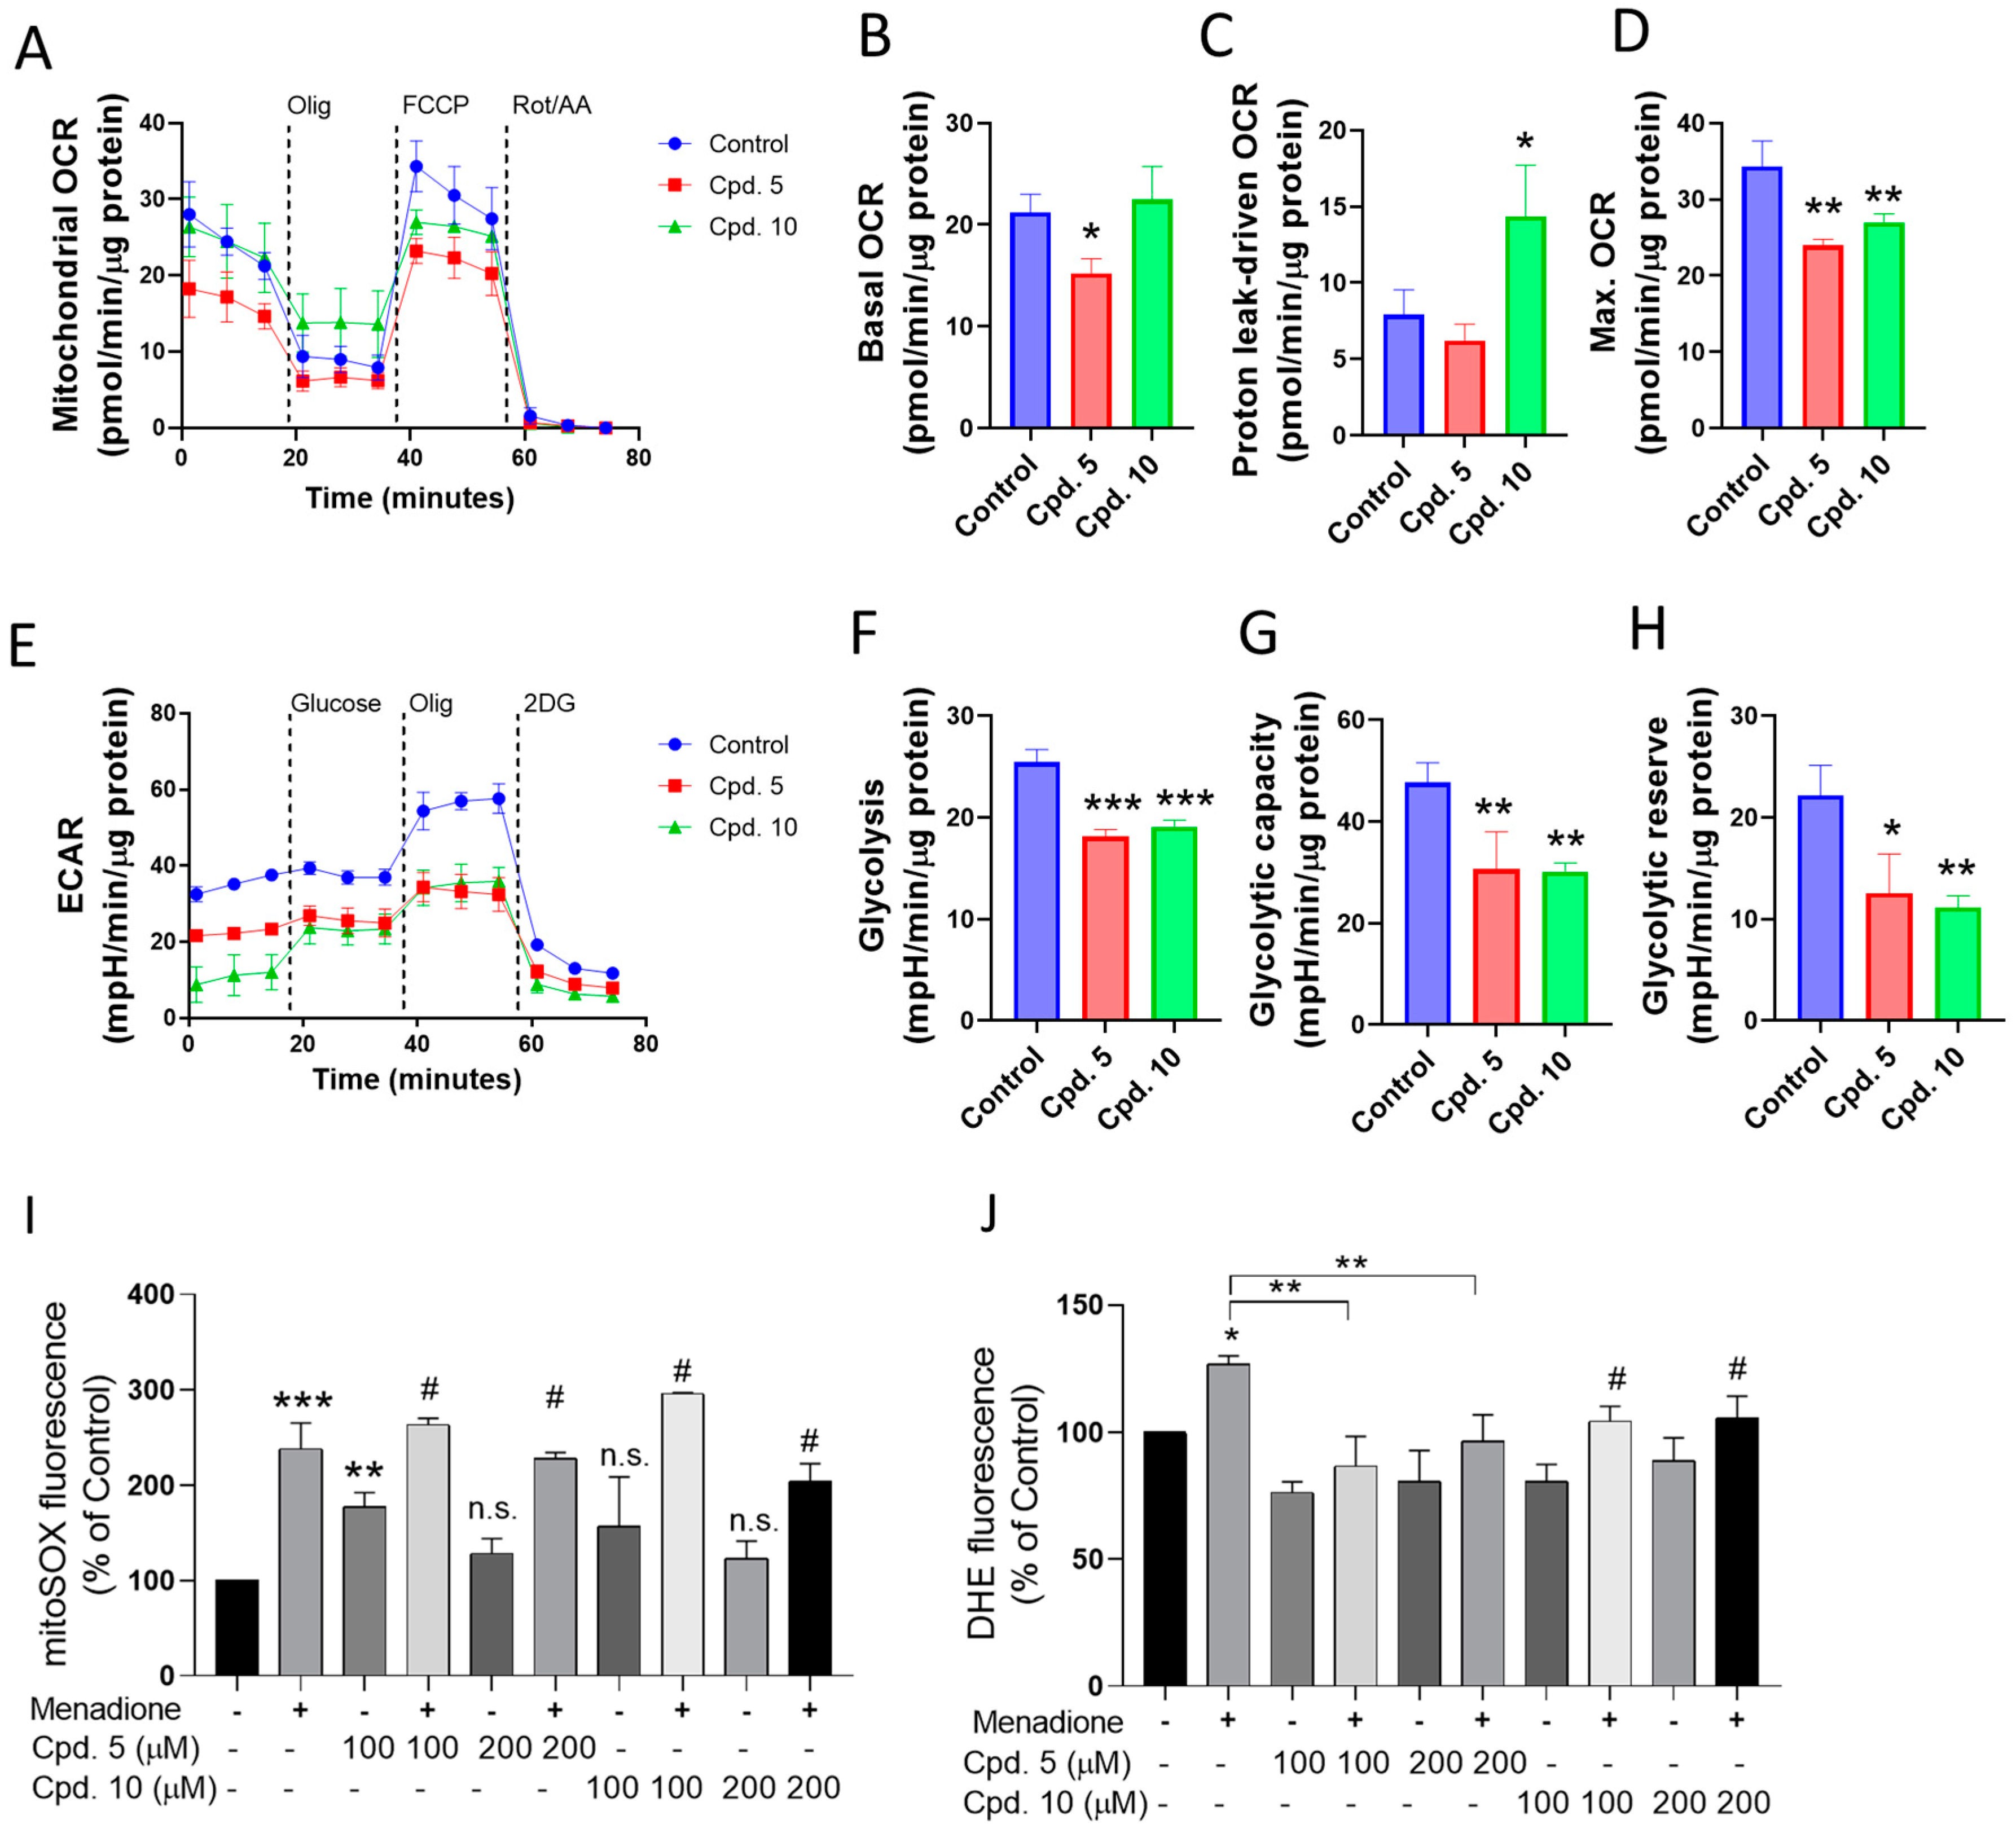
Based on the above results that identify compounds 5 and 10 as among the most active AGIs, we evaluated the effect of both compounds on mitochondrial respiration and glycolysis (Figure 4). Compound 5 reduces the basal and max OCR values without affecting the proton leak-driven OCR. In contrast, compound 10 increases the proton leak-OCR and decreases max OCR (Figure 4A–D). Both compounds significantly reduce the glycolysis (Figure 4E–H).
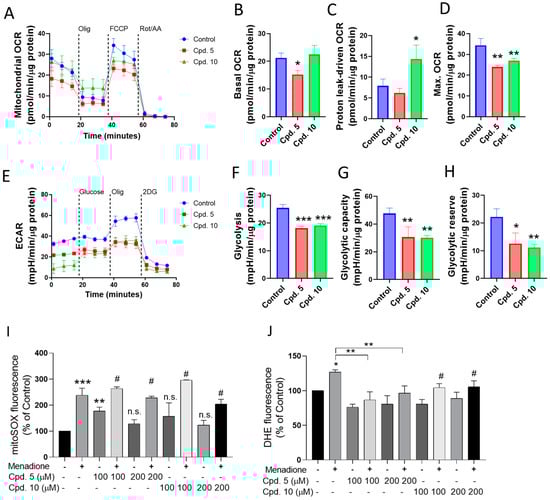
Figure 4.
(A–D) Effect of selected compounds (100 µM, compounds 5 and 10) on mitochondrial respiration and (E–H) glycolysis at 24 h of treatment. (I,J) Evaluation of antioxidant effects in the in vitro model of menadione-dependent ROS production. Effects of compounds 5 and 10 on (I) mitochondrial ROS and (J) ROS in Caco-2 cells treated with menadione. The mitoROS and cytosolic ROS were evaluated with mitoSOX red and DHE, respectively. Data are shown as means ± SD of three independent experiments. * p < 0.05, ** p < 0.01, and *** p < 0.001, control. n.s.: not significant. #: ** p < 0.01 for compound vs. compound + Menadione.
Using menadione as an ROS inducer [47,48], the preventive effect of compounds 5 and 10 on mitochondrial and cytosolic ROS production was evaluated. No changes in the mitochondrial ROS production were observed (Figure 4I). However, menadione-dependent cytosolic ROS production was significantly prevented by compound 5 (Figure 4J). Collectively, the results suggest that compounds 5 and 10 are AGIs that also reduce glycolysis and mitochondrial respiration, and compound 5 has a cytosolic antioxidant effect.
3. Discussion
The T2DM pathogenesis involves alterations in nutrient uptake and energetic metabolism, in which high oxidative stress and inflammation mediate altered cell signaling [49]. Intestinal cells participate in the nutrient uptake and the catabolism of carbohydrates by the α-glucosidase enzyme, which is a current target for T2DM treatment [50]. We evaluated the antioxidant capacity of methyl derivatives of a bicyclic ortho-carbonyl hydroquinone, which differ only in the number and position of methyl groups, and their effects as AGIs, and in modulating the energetic metabolism of Caco-2 cells. The antioxidant capacity results suggest that the increase in the methyl groups reduce antioxidant capacity due to the steric hindrance to access the –OH group, despite how the electronic effects should favor it. The docking results suggest that the gem-diethyl group in ring B is a key structural factor in the inhibitory potency of the compounds. Compounds 5 and 10 were among the most potent inhibitors of α-glucosidase and produced an increase in the cell number. These compounds correspond to those fully methylated at R1, R2, and R3, with gem dimethyl and gem diethyl at R4 and R5, respectively (Table 1). Beyond clinical AGI drugs used in T2DM, it has been reported that new naturally occurring compounds act as AGIs [51,52], also producing a reduction in glucose-transporter-encoding gene expression and glucose uptake in vitro and in pre-clinical models [53]. Our results at the cellular level allow us to identify three groups of compounds with differential actions on OXPHOS and the glycolysis of Caco-2 cells. Group A reduced the glycolysis, group B reduced the basal OCR and increased ECAR (metabolic remodeling-inducers), and group C increased the glycolysis lacking effect on OCR. Previously, we described that small structural modifications to the ortho-carbonyl hydroquinone scaffold studied produce Complex I inhibitors and OXPHOS uncouplers by a protonophoric mechanism [29,30,31] based on modification in the gem-dimethyl/ethyl substitution. Moreover, recent studies on the corresponding quinones showed that these methyl substitutions influence redox potential [54] and the ability to inhibit the mitochondrial electron transport chain [55]. In particular, FRV-1, an ortho-carbonyl substituted quinone, was identified as a new inhibitor of the deactive conformational status of Complex I [55]. Notably, our results in Caco-2 cells expand the information available on the structure–mitochondrial activity relationships of ortho-carbonyl substituted compounds.
Our results show that in Caco-2 cells, compound 5 was an OCR/ECAR inhibitor and compound 10 was a dual agent, increasing the proton leak-driven OCR and inhibiting the maximal electron transport flux. Despite this different action in OXPHOS, both compounds reduced the glycolysis, suggesting that compounds 5 and 10 could be useful for reducing intestinal glucose uptake and metabolization under a potential T2DM condition.
4. Conclusions
We found that the presence of methyl substituents leads to a reduction in the compounds’ antioxidant capacity, and concomitantly an increase in their capacity for AGIs. Fully methylated ortho-carbonyl hydroquinones 5 and 10 present lower antioxidant capacity, and potent capacity as AGIs, and they affect the energetic metabolism and reduce glycolysis, promoting the proliferation of Caco-2 cells. Compound 6 decreased the proliferation of Caco-2 cells, while the other compounds in this series did not show significant changes. Compound 5 was an OCR/ECAR inhibitor in Caco-2 cells, while compound 10 was a dual agent, increasing the proton leak-driven OCR and inhibiting the maximal electron transport flux. Our results reveal that slight structural variations in a hydroquinone scaffold led to diverse antioxidant capability, α-glucosidase inhibition, and the regulation of mitochondrial bioenergetics in Caco-2 cells. These findings may be useful for designing new drugs for T2DM and metabolic syndrome.
5. Experimental Section
5.1. Synthesis and Characterization
5.1.1. General Methods
1H and 13C NMR spectra were obtained from a spectrometer operating at 400.13 MHz (1H) and 100.61 MHz (13C) in deuterated chloroform (CDCl3) as the solvent. Chemical shifts are reported as ppm downfield from TMS for 1H-NMR and relative to the central CDCl3 resonance (77.0 ppm) for 13C-NMR. All melting points were uncorrected and were determined using an Electrothermal 9100 apparatus. High-resolution mass spectra (HRMS) were obtained on a Bruker Compact Q-TOF MS (ESI/QTOF). Silica gel 60 (230–400 mesh ASTM) and TLC sheets silica gel 60 F254 were used for flash-column chromatography and analytical TLC, respectively. All reagents were purchased from Sigma-Aldrich.
5.1.2. 5,8-Dihydroxy-4,4-dimethylnaphthalen-1(4H)-one (1)
This compound was synthesized as previously described [56,57,58,59].
5.1.3. 5,8-Dihydroxy-4,4,6-trimethylnaphthalen-1(4H)-one (2) and 5,8-Dihydroxy-4,4,7-trimethylnaphthalen-1(4H)-one (3)
Following the general method of acylation, methylhydroquinone and acetic acid react to give a mixture of 3′-Methyl and 4′-methyl 2′,5′-dihydroxyacetophenone regioisomers in a 14:86 ratio and a 32% yield, which was used in the next step without purification. Following the general method, this mixture was oxidized with Ag2O and then reacted with 4-(2-methylbut-1-en-1-yl)morpholine to yield compounds 2 and 3. Column chromatography allows for their separation, in 29% and 5% total yields, respectively. 2 (yellow solid): 1H-NMR δ: 1.62 (s, 3H), 2.30 (s, 3H), 4.51 (s, OH), 6.24 (d, J = 10.1 Hz, 1H), 6.74 (s, 1H), 6.83 (d, J = 10.1 Hz, 1H), 12.72 (s, OH). 13C-NMR δ: 16.9, 25.0, 38.2, 113.9, 117.1, 123.9, 132.7, 134.4, 144.1, 156.6, 160.9, 190.9. M.p. 204.0 °C. HRMS (ESI)m/z calcd. for C13H14O3 [M+H]+: 219.1016, found: 219.1019. 3 (yellow solid): 1H NMR δ: 1.60 (s, 3H), 2.23 (s, 3H), 4.55 (s, OH), 6.24 (d, J = 10.1 Hz, 1H), 6.80 (s, 1H), 6.84 (d, J = 10.1 Hz, 1H), 13.01 (s, OH). 13C NMR δ: 15.2, 25.0, 38.1, 114.4, 124.1 125.3, 131.7, 144.4, 155.4, 160.9, 191.5. M.p. 230.4 °C (d). HRMS (ESI)m/z calcd. for C13H14O3 [M+H]+: 219.1016, found: 219.1020.
5.1.4. 5,8-Dihydroxy-4,4,6,7-tetramethylnaphthalen-1(4H)-one (4) [30,39,60]
1H-NMR δ(ppm): 0.54 (s, 3H), 1.58 (dq, J1 = 14.0 Hz, J2 = 7.4 Hz, 2H), 2.24 (s, 3H), 2.25 (s, 3H), 2.77 (dq, J1 = 14.0 Hz, J2 = 7.5 Hz, 2H), 4.41 (s, OH), 6.46 (d, J = 10.13 Hz, 1H), 6.61 (d, J = 10.13 Hz, 1H), 13.25 (s, OH).
5.1.5. 5,8-Dihydroxy-2,4,4,6,7-pentamethylnaphthalen-1(4H)-one (5)
Column flash chromatography on silica gel allowed for the isolation of 4 (yellow solid, 67% yield). 1H-NMR δ(ppm): 1.58 (s, 3H), 1.99 (d, J = 1.25 Hz, 3H), 2.23 (s, 3H), 2.25 (s, 3H), 4.41 (s, OH), 6.61 (d, J = 1.38 Hz, 1H), 13.39 (s, OH). 13C-NMR δ: 11.60, 12.99, 15.72, 25.42, 29.69, 37.34, 112.63, 123.25, 129.76, 131.19, 131.99, 143.35, 155.11, 156.75, 191.55. M.p. 199.9–201.5 °C. HRMS (ESI)m/z calcd. for C15H18O3 [M+H]+: 247.1329, found: 247.1330.
5.1.6. 4,4-Diethyl-5,8-dihydroxynaphthalen-1(4H)-one (6)
This compound was synthesized as previously described [30,39,59,60].
5.1.7. 4,4-Diethyl-5,8-dihydroxy-6-methylnaphthalen-1(4H)-one (7) and 4,4-Diethyl-5,8-dihydroxy-7-methylnaphthalen-1(4H)-one (8)
The 3′- and 4′-methyl acetophenones mentioned above were oxidized with Ag2O and then reacted with 4-(2-ethylbut-1-en-1-yl)morpholine to yield compounds 4,4-diethyl-5,8-dihydroxy-6-methylnaphthalen-1(4H)-one (7) and 4,4-diethyl-5,8-dihydroxy-7-methylnaphthalen-1(4H)-one (8). Column chromatography allows for their separation in 27.5% and 4.5% total yields, respectively. 7 (yellow solid): 1H NMR δ: 0.47 (t, J = 7.5 Hz, 6H), 1.51 (dq, J1 = 7.5 Hz, J2 = 14.0 Hz, 2H), 2.22 (s, 3H), 2.71 (dq, J1 = 7.5 Hz, J2 = 14.0 Hz, 3H), 4.40 (s, OH), 6.39 (d, J = 10.1 Hz, 1H), 6.55 (d, J = 10.1 Hz, 1H) 6.66 (s, 1H), 12.71 (s, OH). 13C NMR δ: 9.4, 16.9, 30.6, 48.8, 116.0, 117.2, 128.4, 130.9, 132.2, 143.8, 156.7, 159.4, 191.7. M.p. 198.2 °C. HRMS (ESI)m/z calcd. for C15H18O3 [M+H]+: 247.1329, found: 247.1332. 8 (yellow solid): 1H NMR δ: 0.55 (t, J = 7.5 Hz, 6H), 1.57 (dq, J1 = 7.5 Hz, J2 = 14 Hz, 2H), 2.23 (s, 3H), 2.75 (dq, J1 = 7.5 Hz, J2 = 14 Hz, 2H), 4.50 (s, OH), 6.48 (d, J = 10,1 Hz, 1H), 6.64 (d, J = 10.1 Hz, 1H), 6.77 (s, 1H), 13.08 (s, OH). 13C NMR δ: 9.4, 15.2, 30.6, 48.5, 117.0, 124.8, 125.2, 128.1, 128.3, 144.2, 155.8, 159.6, 190.9. M.p. 125.3–129.0 °C. HRMS (ESI)m/z calcd. for C15H18O3 [M+H]+: 247.1329, found: 247.1330.
5.1.8. Synthesis of 4,4-Diethyl-5,8-dihydroxy-6,7-dimethylnaphthalen-1(4H)-one (9)
Column flash chromatography on silica gel allowed for the isolation of 8 (yellow solid, 62% yield). 1H NMR δ: 0.54 (t, J = 7.5 Hz, 6H), 1.57 (dq, J1 = 7.5 Hz, J2 = 14.0 Hz, 2H), 2.24 (s, 3H), 2.25 (s, 3H), 2.77 (dq, J1 = 7.5 Hz, J2 = 14.0 Hz, 2H), 4.40 (s, OH), 6.46 (d, J = 10.1 Hz, 1H), 6.61 (d, J = 10.1 Hz, 1H), 13.25 (s, OH). 13C NMR δ: 9.44, 11.60, 13.06, 30.77, 48.57, 115.32, 123.52, 127.95, 128.53, 131.17, 143.30, 155.32, 159.21, 191.83. M.p. 174.9–179.8 °C. HRMS (ESI)m/z calcd. for C16H20O3 [M+H]+: 261.1485, found: 261.1489.
5.1.9. Synthesis of 4,4-Diethyl-5,8-dihydroxy-2,6,7-trimethylnaphthalen-1(4H)-one (10)
Column flash chromatography on silica gel allowed for the isolation of 8 (yellow solid, 67% yield). 1H NMR δ: 0.51 (t, J = 7.44, 3H), 1.55 (dq, J1 = 7.5 Hz, J2 = 13.5 Hz, 2H), 2.04 (d, J = 1.1 Hz, 3H), 2.23 (s, 3H), 2.24 (s, 3H), 2.72 (dq, J1 = 7.5 Hz, J2 = 13.5 Hz, 2H), 4.35 (s, OH), 6.41 (d, J = 1.1, 1H), 13.45 (s, OH). 13C NMR δ: 9.48, 11.64, 13.01, 15.69, 31.00, 47.76, 115.28, 123.29, 128.36, 130.69, 134.36, 143.14, 155.13, 155.24, 192.26. M.p. 186.1–187.2 °C. HRMS (ESI)m/z calcd. for C17H22O3 [M+H]+: 275.1642, found: 275.1643.
5.2. Antioxidant and Enzymatic Inhibitory Assays
5.2.1. ORAC Assays
The antioxidant activity was determined by ORAC (oxygen radical absorbance capacity) assays [61]. Briefly, the antioxidant capacity for ORAC-FL was estimated by measuring the changes in fluorescence after 120 min of reaction with the radical. Assays were performed using a 96-well microplate in a Synergy H1 hybrid multi-mode microplate reader (Biotek, Winooski, VT, USA), and the results were expressed as µmol Trolox 100 g−1 DW. Three replicates were accomplished for each analysis.
5.2.2. α-Glucosidase Inhibitory Activity
The inhibition of α-glucosidase was determined following a previous method [62] using p-nitrophenyl α-D-glucopyranoside as a substrate. The reaction mixture contained 160 µL of 0.1 M sodium phosphate buffer (pH = 6.9), 5 µL of enzyme (5.46 U/mL), and polyphenolic extract (0.17–1.36 µg/mL). After the pre-incubation of the reaction mixture on ice for 5 min, the enzyme reaction was started by adding 5 µL of 25 mM p-nitrophenyl α-D-glucopyranoside into this mixture. The reaction was incubated for 15 min at 37 °C. Then, 80 µL of 0.2 M sodium carbonate was added. The absorbance was measured at 405 nm in a microplate reader (Biotek ELx808, Agilent, Santa Clara, CA, USA). Enzyme inhibition was calculated using the following equation: % inhibition = (A0 − As)/A0 × 100, where A0 is the absorbance of the control (blank, without extract) and As is the absorbance in presence of the extract. IC50 values denote the µg GAE/mL required to inhibit the enzyme by 50%.
5.3. Quantum Chemical Calculations
Calculations were achieved using the Gaussian 09 software [63], at density functional theory (DFT) M06-2X/6-311+G(d,p) level. No imaginary vibrational frequencies were found at the optimized geometries, indicating that they are the true minimal of the potential energy surface. The calculated thermodynamic parameters were obtained as follows:
- Bond dissociation enthalpy (BDE): H(RO•) + H(H•) − H(ROH);
- Ionization potential (IP): H(ROH•+) + H(e−) − H(ROH);
- Proton affinity (PA): H(RO−) + H(H+) − H(ROH);
- Electron transfer enthalpy (ETE): H(RO•) + H(e−) − H(RO−).
where H(RO•), H(ROH), and H(ROH•+) correspond to the enthalpies of the neutral radical and the neutral and radical cation H(RO−) of the compounds, while H(e−), H(H+) and H(H•) correspond to enthalpies of the electron, proton, and radical hydrogen.
5.4. Molecular Docking
Molecules 1 to 10 were sketched and prepared using Maestro and LigPrep (Schrödinger Release 2022-1: Maestro, LigPrep Schrödinger, LLC, New York, NY, USA, 2021), generating all molecules without adding charges. ConfGen [64] was used to generate at most 10 conformers per molecule. Protein–ligand docking was performed using Glide software (version 9.0, Schrödinger, LLC, New York, NY, USA, 2021) [65,66]. The binding site was defined by the crystallographic structure obtained for alpha-glucosidase in a complex with acarbose (PDB code: 3W37). Before docking calculations, the protein was prepared using Maestro Protein Preparation Wizard [67] by removing ligands, metals, and water molecules; adding hydrogens; and ionizing residues at pH 7.4. the minimization of the protein structure was conducted with an OPLS4 force field. The molecules were then prepared using the OPLS force field to minimize energy. The grid box was defined using the ligand cocrystallized in α-glucosidase as the center of the box. The docking was performed with the Glide standard precision (SP) function [68] and the top-10 poses per docked ligands were selected and subjected to postprocessing and rescoring with the molecular mechanics-generalized Born surface area (MM-GBSA) with Prime [69]. This computational method combines molecular mechanics energy and implicit solvation models, which enable the docking results to be rescored and correlated with the experimental activities (IC50). The predicted binding energies (ΔGbind) between the ligands and the receptor were calculated as previously reported [70].
5.5. Cell Culture Conditions
Caco-2 cells were grown in Dulbecco’s modified Eagle’s Medium/Nutrient Mixture F-12 (D-MEM/F-12), supplemented with 5% fetal bovine serum (FBS), penicillin (100 IU/mL), streptomycin (100 μg/mL), and nonessential amino acid solution 1% (GIBCO, Thermo Fisher Scientific, Grand Island). The culture media contained no exogenous pyruvate supplementation, and the cells were maintained in a humidified atmosphere at 37 °C and 5% CO2.
5.6. MTT Assay
The cell proliferation was determined using the MTT assay. The cells were incubated in 96-well plates at 7000 cells per well and incubated for 24 h. The cells were treated for 24 h with compounds (1, 5, 10, 30, 50, and 100 μM). After treatment, the culture medium was removed, and the cells were incubated with MTT for 1 h at 37 °C. Finally, 100 μL of DMSO was added and measured by spectrophotometry at 570 nm, as previously described [71].
5.7. Determination of Extracellular Acidification Rate and Oxygen Consumption Rate in Real-Time
To analyze the extracellular acidification rate (ECAR), Caco-2 cells (10,000 cells/well) were seeded on XFe96 V3-PS multi-well plates and kept for 24 h at 37 °C in 5% CO2 with a DMEM culture medium supplemented with FBS. After 24 h, the cells were stimulated by compounds at 100 μM for 24 h. Then, the culture medium was replaced with assay media (unbuffered DMEM without red phenol, with 4 mM glutamine and 10 mM glucose, pH = 7.4) 1 h before the assay. Glycolysis was evaluated by the sequential injection of 10 mM glucose, 1 µM oligomycin, and 100 mM 2-deoxy-D-glucose (2-DG), and ECAR was analyzed using specific excitation and emission wavelengths of protons (470/530 nm). To study the mitochondrial function, the sequential injection of 1 μM oligomycin, 250 nM FCCP, 1 μM rotenone, and 1 μM antimycin A was added. The oxygen consumption rate (OCR) measurements were made with the specific excitation and emission wavelengths of the fluorescent probes for oxygen (532/650 nm) using a Seahorse XFe96 Analyzer (Seahorse Agilent, USA), and OCR and ECAR data were normalized by protein content/well, which was determined using a BCA kit [55]. Each experiment was performed at least in triplicate. The OCR/ECAR data analysis and dendrograms were performed using XLSTAT software (version 2023.2.1414, Lumivero, New York, NY, USA).
5.8. Determination of Cytosolic and Mitochondrial ROS (mtROS)
The mtROS and ROS levels were measured using MitoSOX® Red Mitochondrial Superoxide (Invitrogen, Carlsbad, CA, USA) and Invitrogen™ Dihydroethidium (Hydroethidine, DHE) probes, respectively. The Caco-2 cells were incubated in 12-well plates at 50,000 cells for 24 h. The cells were treated with compounds 5 and 10 at 100 μM and 200 μM for 24 h. Next, the cells were incubated with 25 μM menadione 25 μM for 1 h, and then the cells were washed with PBS and incubated with MitoSOX Red® (5 µM) or DHE (5 μM) for 30 min. Then, they were recollected, and washed, and the fluorescence was detected by flow cytometry according to Urra et al., 2018 [31].
5.9. Statistics
The data are expressed as the mean ± standard deviation (SD) of three independent experiments. Statistical analysis was performed using one-way or two-way ANOVA with Bonferroni’s post-test for pairwise comparisons with Graph Pad Prism 4.03 (GraphPad Software, San Diego, CA, USA). To study the differences between variables, the Pearson correlation coefficient was used. The data were considered statistically significant when p < 0.05.
Supplementary Materials
The following supporting information can be downloaded at https://www.mdpi.com/article/10.3390/ijms25158334/s1.
Author Contributions
M.M.-C. (Matías Monroy-Cárdenas): Writing—review and editing, Writing—original draft, Visualization, Validation, Methodology, Investigation. P.V.-H.: Methodology, Investigation, Formal analysis. D.R.: Validation, Methodology, Investigation, Formal analysis. C.A.: Methodology, Investigation, Formal analysis. F.A.U.: Writing—original draft, Writing—review and editing, Visualization, Validation, Supervision, Project administration, Methodology, Investigation, Conceptualization, Funding acquisition. M.M.-C. (Maximiliano Martínez-Cifuentes): Writing—original draft, Writing—review and editing, Visualization, Validation, Supervision, Project administration, Methodology, Investigation, Conceptualization. R.A.-M.: Writing—original draft, Writing—review and editing, Supervision, Visualization, Validation, Project administration, Methodology, Conceptualization, Funding acquisition. All authors have read and agreed to the published version of the manuscript.
Funding
This research was funded by Fondecyt grant number 3240227, 1241547, 1221874, 1220656; ANID Anillo grant number ACT210097; FONDEQUIP grant number EQM220164; VID-UChile grant number UM-03/22 and VRID-UDEC grant number 2023000771INV.
Institutional Review Board Statement
Not applicable.
Informed Consent Statement
Not applicable.
Data Availability Statement
Data is contained within the article or Supplementary Material.
Acknowledgments
Powered@NLHPC: This research was partially supported by the supercomputing infrastructure of the NLHPC (ECM-02).
Conflicts of Interest
The authors declare that they have no known competing financial interests or personal relationships that could have appeared to influence the work reported in this paper.
References
- Webber, S. IDF Diabetes Atlas, 10th ed.; International Diabetes Federation: Brussels, Belgium, 2013; Volume 102, ISBN 9782930229980. [Google Scholar]
- Black, H.S. A Synopsis of the Associations of Oxidative Stress, ROS, and Antioxidants with Diabetes Mellitus. Antioxidants 2022, 11, 2003. [Google Scholar] [CrossRef] [PubMed]
- Wronka, M.; Krzemińska, J.; Młynarska, E.; Rysz, J.; Franczyk, B. The Influence of Lifestyle and Treatment on Oxidative Stress and Inflammation in Diabetes. Int. J. Mol. Sci. 2022, 23, 15743. [Google Scholar] [CrossRef]
- Ajjan, R.A.; Battelino, T.; Cos, X.; Del Prato, S.; Philips, J.-C.; Meyer, L.; Seufert, J.; Seidu, S. Continuous Glucose Monitoring for the Routine Care of Type 2 Diabetes Mellitus. Nat. Rev. Endocrinol. 2024, 20, 426–440. [Google Scholar] [CrossRef] [PubMed]
- Fan, W. Epidemiology in Diabetes Mellitus and Cardiovascular Disease. Cardiovasc. Endocrinol. 2017, 6, 8–16. [Google Scholar] [CrossRef]
- Vezza, T.; de Marañón, A.M.; Canet, F.; Díaz-Pozo, P.; Marti, M.; D’ocon, P.; Apostolova, N.; Rocha, M.; Víctor, V.M. Micrornas and Oxidative Stress: An Intriguing Crosstalk to Be Exploited in the Management of Type 2 Diabetes. Antioxidants 2021, 10, 802. [Google Scholar] [CrossRef] [PubMed]
- Luo, M.; Zheng, Y.; Tang, S.; Gu, L.; Zhu, Y.; Ying, R.; Liu, Y.; Ma, J.; Guo, R.; Gao, P.; et al. Radical Oxygen Species: An Important Breakthrough Point for Botanical Drugs to Regulate Oxidative Stress and Treat the Disorder of Glycolipid Metabolism. Front. Pharmacol. 2023, 14, 1166178. [Google Scholar] [CrossRef]
- Broughton, J.P.; Lovci, M.T.; Huang, J.L.; Yeo, G.W.; Pasquinelli, A.E. Pairing beyond the Seed Supports MicroRNA Targeting Specificity. Mol. Cell 2016, 64, 320–333. [Google Scholar] [CrossRef]
- Baroukh, N.; Ravier, M.A.; Loder, M.K.; Hill, E.V.; Bounacer, A.; Scharfmann, R.; Rutter, G.A.; Van Obberghen, E. MicroRNA-124a Regulates Foxa2 Expression and Intracellular Signaling in Pancreatic β-Cell Lines. J. Biol. Chem. 2007, 282, 19575–19588. [Google Scholar] [CrossRef]
- Regazzi, R. MicroRNAs as Therapeutic Targets for the Treatment of Diabetes Mellitus and Its Complications. Expert Opin. Ther. Targets 2018, 22, 153–160. [Google Scholar] [CrossRef]
- Casertano, M.; Genovese, M.; Santi, A.; Pranzini, E.; Balestri, F.; Piazza, L.; Del Corso, A.; Avunduk, S.; Imperatore, C.; Menna, M.; et al. Evidence of Insulin-Sensitizing and Mimetic Activity of the Sesquiterpene Quinone Avarone, a Protein Tyrosine Phosphatase 1B and Aldose Reductase Dual Targeting Agent from the Marine Sponge Dysidea Avara. Pharmaceutics 2023, 15, 528. [Google Scholar] [CrossRef]
- Casertano, M.; Genovese, M.; Piazza, L.; Balestri, F.; Del Corso, A.; Vito, A.; Paoli, P.; Santi, A.; Imperatore, C.; Menna, M. Identifying Human PTP1B Enzyme Inhibitors from Marine Natural Products: Perspectives for Developing of Novel Insulin-Mimetic Drugs. Pharmaceuticals 2022, 15, 325. [Google Scholar] [CrossRef]
- Casertano, M.; Vito, A.; Aiello, A.; Imperatore, C.; Menna, M. Natural Bioactive Compounds from Marine Invertebrates That Modulate Key Targets Implicated in the Onset of Type 2 Diabetes Mellitus (T2DM) and Its Complications. Pharmaceutics 2023, 15, 2321. [Google Scholar] [CrossRef]
- Yang, T.; Yang, Z.; Pan, F.; Jia, Y.; Cai, S.; Zhao, L.; Zhao, L.; Wang, O.; Wang, C. Construction of an MLR-QSAR Model Based on Dietary Flavonoids and Screening of Natural α-Glucosidase Inhibitors. Foods 2022, 11, 4046. [Google Scholar] [CrossRef]
- Chiba, S. Molecular Mechanism in α-Glucosidase and Glucoamylase. Biosci. Biotechnol. Biochem. 1997, 61, 1233–1239. [Google Scholar] [CrossRef] [PubMed]
- Al-Salahi, R.; Ahmad, R.; Anouar, E.; Iwana Nor Azman, N.I.; Marzouk, M.; Abuelizz, H.A. 3-Benzyl(Phenethyl)-2-Thioxobenzo[g]Quinazolines as a New Class of Potent α-Glucosidase Inhibitors: Synthesis and Molecular Docking Study. Future Med. Chem. 2018, 10, 1889–1905. [Google Scholar] [CrossRef]
- Abuelizz, H.A.; Iwana, N.A.N.I.; Ahmad, R.; Anouar, E.H.; Marzouk, M.; Al-Salahi, R. Synthesis, Biological Activity and Molecular Docking of New Tricyclic Series as α-Glucosidase Inhibitors. BMC Chem. 2019, 13, 52. [Google Scholar] [CrossRef] [PubMed]
- Ali, S.; Ali, M.; Khan, A.; Ullah, S.; Waqas, M.; Al-Harrasi, A.; Latif, A.; Ahmad, M.; Saadiq, M. Novel 5-(Arylideneamino)-1 H-Benzo[d]Imidazole-2-Thiols as Potent Anti-Diabetic Agents: Synthesis, in Vitro α-Glucosidase Inhibition, and Molecular Docking Studies. ACS Omega 2022, 7, 43468–43479. [Google Scholar] [CrossRef] [PubMed]
- Azizian, H.; Pedrood, K.; Moazzam, A.; Valizadeh, Y.; Khavaninzadeh, K.; Zamani, A.; Mohammadi-Khanaposhtani, M.; Mojtabavi, S.; Faramarzi, M.A.; Hosseini, S.; et al. Docking Study, Molecular Dynamic, Synthesis, Anti-α-Glucosidase Assessment, and ADMET Prediction of New Benzimidazole-Schiff Base Derivatives. Sci. Rep. 2022, 12, 14870. [Google Scholar] [CrossRef]
- Okoli, B.J.; Modise, J.S. Investigation into the Thermal Response and Pharmacological Activity of Substituted Schiff Bases on α-Amylase and α-Glucosidase. Antioxidants 2018, 7, 113. [Google Scholar] [CrossRef]
- Fallah, Z.; Tajbakhsh, M.; Alikhani, M.; Larijani, B.; Faramarzi, M.A.; Hamedifar, H.; Mohammadi-Khanaposhtani, M.; Mahdavi, M. A Review on Synthesis, Mechanism of Action, and Structure-Activity Relationships of 1,2,3-Triazole-Based α-Glucosidase Inhibitors as Promising Anti-Diabetic Agents. J. Mol. Struct. 2022, 1255, 132469. [Google Scholar] [CrossRef]
- DS, L. The Glycemic Index: Physiological Mechanisms Relating to Obesity, Diabetes, and Cardiovascular Disease. JAMA 2002, 287, 2414–2423. [Google Scholar]
- Johnston, K.; Sharp, P.; Clifford, M.; Morgan, L. Dietary Polyphenols Decrease Glucose Uptake by Human Intestinal Caco-2 Cells. FEBS Lett. 2005, 579, 1653–1657. [Google Scholar] [CrossRef] [PubMed]
- Bernardi, S.; Del Bo, C.; Marino, M.; Gargari, G.; Cherubini, A.; Andrés-Lacueva, C.; Hidalgo-Liberona, N.; Peron, G.; González-Dominguez, R.; Kroon, P.; et al. Polyphenols and Intestinal Permeability: Rationale and Future Perspectives. J. Agric. Food Chem. 2020, 68, 1816–1829. [Google Scholar] [CrossRef] [PubMed]
- JanssenDuijghuijsen, L.M.; Grefte, S.; de Boer, V.C.J.; Zeper, L.; van Dartel, D.A.M.; van der Stelt, I.; Bekkenkamp-Grovenstein, M.; van Norren, K.; Wichers, H.J.; Keijer, J. Mitochondrial ATP Depletion Disrupts Caco-2 Monolayer Integrity and Internalizes Claudin 7. Front. Physiol. 2017, 8, 794. [Google Scholar] [CrossRef] [PubMed]
- Astorga, J.; Gasaly, N.; Dubois-Camacho, K.; De la Fuente, M.; Landskron, G.; Faber, K.N.; Urra, F.A.; Hermoso, M.A. The Role of Cholesterol and Mitochondrial Bioenergetics in Activation of the Inflammasome in IBD. Front. Immunol. 2022, 13, 1028953. [Google Scholar] [CrossRef] [PubMed]
- Vancamelbeke, M.; Vermeire, S. The Intestinal Barrier: A Fundamental Role in Health and Disease. Expert Rev. Gastroenterol. Hepatol. 2017, 11, 821–834. [Google Scholar] [CrossRef] [PubMed]
- Sambuy, Y.; De Angelis, I.; Ranaldi, G.; Scarino, M.L.; Stammati, A.; Zucco, F. The Caco-2 Cell Line as a Model of the Intestinal Barrier: Influence of Cell and Culture-Related Factors on Caco-2 Cell Functional Characteristics. Cell Biol. Toxicol. 2005, 21, 1–26. [Google Scholar] [CrossRef] [PubMed]
- Urra, F.A.; Martínez-Cifuentes, M.; Pavani, M.; Lapier, M.; Jaña-Prado, F.; Parra, E.; Maya, J.D.; Pessoa-Mahana, H.; Ferreira, J.; Araya-Maturana, R. An Ortho-Carbonyl Substituted Hydroquinone Derivative Is an Anticancer Agent That Acts by Inhibiting Mitochondrial Bioenergetics and by Inducing G2/M-Phase Arrest in Mammary Adenocarcinoma TA3. Toxicol. Appl. Pharmacol. 2013, 267, 218–227. [Google Scholar] [CrossRef] [PubMed]
- Urra, F.A.; Córdova-Delgado, M.; Lapier, M.; Orellana-Manzano, A.; Acevedo-Arévalo, L.; Pessoa-Mahana, H.; González-Vivanco, J.M.; Martínez-Cifuentes, M.; Ramírez-Rodríguez, O.; Millas-Vargas, J.P.; et al. Small Structural Changes on a Hydroquinone Scaffold Determine the Complex I Inhibition or Uncoupling of Tumoral Oxidative Phosphorylation. Toxicol. Appl. Pharmacol. 2016, 291, 46–57. [Google Scholar] [CrossRef]
- Urra, F.A.; Muñoz, F.; Córdova-Delgado, M.; Ramírez, M.P.; Peña-Ahumada, B.; Rios, M.; Cruz, P.; Ahumada-Castro, U.; Bustos, G.; Silva-Pavez, E.; et al. FR58P1a; a New Uncoupler of OXPHOS That Inhibits Migration in Triple-Negative Breast Cancer Cells via Sirt1/AMPK/Β1-Integrin Pathway. Sci. Rep. 2018, 8, 13190. [Google Scholar] [CrossRef]
- Gimmelli, R.; Persico, M.; Imperatore, C.; Saccoccia, F.; Guidi, A.; Casertano, M.; Luciano, P.; Pietrantoni, A.; Bertuccini, L.; Paladino, A.; et al. Thiazinoquinones as New Promising Multistage Schistosomicidal Compounds Impacting Schistosoma Mansoni and Egg Viability. ACS Infect. Dis. 2020, 6, 124–137. [Google Scholar] [CrossRef] [PubMed]
- Jiang, C.; Garg, S.; Waite, T.D. Hydroquinone-Mediated Redox Cycling of Iron and Concomitant Oxidation of Hydroquinone in Oxic Waters under Acidic Conditions: Comparison with Iron-Natural Organic Matter Interactions. Environ. Sci. Technol. 2015, 49, 14076–14084. [Google Scholar] [CrossRef] [PubMed]
- Bakalova, R.; Lazarova, D.; Sumiyoshi, A.; Shibata, S.; Zhelev, Z.; Nikolova, B.; Semkova, S.; Vlaykova, T.; Aoki, I.; Higashi, T. Redox-Cycling “Mitocans” as Effective New Developments in Anticancer Therapy. Int. J. Mol. Sci. 2023, 24, 8435. [Google Scholar] [CrossRef] [PubMed]
- Menna, M.; Imperatore, C.; D’Aniello, F.; Aiello, A. Meroterpenes from Marine Invertebrates: Structures, Occurrence, and Ecological Implications. Mar. Drugs 2013, 11, 1602–1643. [Google Scholar] [CrossRef] [PubMed]
- Rodríguez, J.; Olea-Azar, C.; Cavieres, C.; Norambuena, E.; Delgado-Castro, T.; Soto-Delgado, J.; Araya-Maturana, R. Antioxidant Properties and Free Radical-Scavenging Reactivity of a Family of Hydroxynaphthalenones and Dihydroxyanthracenones. Bioorganic Med. Chem. 2007, 15, 7058–7065. [Google Scholar] [CrossRef] [PubMed]
- Donoso-Bustamante, V.; Borrego, E.A.; Schiaffino-Bustamante, Y.; Gutiérrez, D.A.; Millas-Vargas, J.P.; Fuentes-Retamal, S.; Correa, P.; Carrillo, I.; Aguilera, R.J.; Miranda, D.; et al. An Acylhydroquinone Derivative Produces OXPHOS Uncoupling and Sensitization to BH3 Mimetic ABT-199 (Venetoclax) in Human Promyelocytic Leukemia Cells. Bioorg. Chem. 2020, 100, 103935. [Google Scholar] [CrossRef] [PubMed]
- Méndez, D.; Donoso-Bustamante, V.; Pablo Millas-Vargas, J.; Pessoa-Mahana, H.; Araya-Maturana, R.; Fuentes, E. Synthesis and Pharmacological Evaluation of Acylhydroquinone Derivatives as Potent Antiplatelet Agents. Biochem. Pharmacol. 2021, 183, 114341. [Google Scholar] [CrossRef] [PubMed]
- Méndez, D.; Urra, F.A.; Millas-Vargas, J.P.; Alarcón, M.; Rodríguez-Lavado, J.; Palomo, I.; Trostchansky, A.; Araya-Maturana, R.; Fuentes, E. Synthesis of Antiplatelet Ortho-Carbonyl Hydroquinones with Differential Action on Platelet Aggregation Stimulated by Collagen or TRAP-6. Eur. J. Med. Chem. 2020, 192, 112187. [Google Scholar] [CrossRef]
- Galano, A.; Raúl Alvarez-Idaboy, J. Computational Strategies for Predicting Free Radical Scavengers’ Protection against Oxidative Stress: Where Are We and What Might Follow? Int. J. Quantum Chem. 2019, 119, e25665. [Google Scholar] [CrossRef]
- Zheng, Y.Z.; Deng, G.; Liang, Q.; Chen, D.F.; Guo, R.; Lai, R.C. Antioxidant Activity of Quercetin and Its Glucosides from Propolis: A Theoretical Study. Sci. Rep. 2017, 7, 7543. [Google Scholar] [CrossRef]
- Vo, Q.V.; Nam, P.C.; Thong, N.M.; Trung, N.T.; Phan, C.T.D.; Mechler, A. Antioxidant Motifs in Flavonoids: O−H versus C−H Bond Dissociation. ACS Omega 2019, 4, 8935–8942. [Google Scholar] [CrossRef] [PubMed]
- Zhang, D.; Liu, Y.; Chu, L.; Wei, Y.; Wang, D.; Cai, S.; Zhou, F.; Ji, B. Relationship between the Structures of Flavonoids and Oxygen Radical Absorbance Capacity Values: A Quantum Chemical Analysis. J. Phys. Chem. A 2013, 117, 1784–1794. [Google Scholar] [CrossRef] [PubMed]
- Peng, H.; Shahidi, F. Enzymatic Synthesis and Antioxidant Activity of Mono- and Diacylated Epigallocatechin Gallate and Related By-Products. J. Agric. Food Chem. 2022, 70, 9227–9242. [Google Scholar] [CrossRef] [PubMed]
- Platzer, M.; Kiese, S.; Tybussek, T.; Herfellner, T.; Schneider, F.; Schweiggert-Weisz, U.; Eisner, P. Radical Scavenging Mechanisms of Phenolic Compounds: A Quantitative Structure-Property Relationship (QSPR) Study. Front. Nutr. 2022, 9, 4–8. [Google Scholar] [CrossRef] [PubMed]
- Rubio-Cortés, J.E.; López, J.; Velazco-Cabral, I.; Feliciano, A.; Vázquez, M.A.; Alcaraz-Contreras, Y. In Vitro Study of the Effect of 2,6-Substituents at the New 4-Ethoxy-Phenols as Antioxidants. Polycycl. Aromat. Compd. 2023, 43, 790–800. [Google Scholar] [CrossRef]
- Goffart, S.; Tikkanen, P.; Michell, C.; Wilson, T.; Pohjoismäki, J.L.O. The Type and Source of Reactive Oxygen Species Influences the Outcome of Oxidative Stress in Cultured Cells. Cells 2021, 10, 1075. [Google Scholar] [CrossRef] [PubMed]
- Loor, G.; Kondapalli, J.; Schriewer, J.M.; Chandel, N.M.; Vander Hoek, T.L.; Schumacker, P.T. Menadione Triggers Cell Death through ROS-Dependent Mechanisms Involving PARP Activation without Requiring Apoptosis. Free Radic. Biol. Med. 2010, 49, 1925–1936. [Google Scholar] [CrossRef]
- Oguntibeju, O.O. Type 2 Diabetes Mellitus, Oxidative Stress and Inflammation: Examining the Links. Int. J. Physiol. Pathophysiol. Pharmacol. 2019, 11, 45–63. [Google Scholar]
- Padhi, S.; Nayak, A.K.; Behera, A. Type II Diabetes Mellitus: A Review on Recent Drug Based Therapeutics. Biomed. Pharmacother. 2020, 131, 110708. [Google Scholar] [CrossRef] [PubMed]
- Lam, T.P.; Tran, N.V.N.; Pham, L.H.D.; Lai, N.V.T.; Dang, B.T.N.; Truong, N.L.N.; Nguyen-Vo, S.K.; Hoang, T.L.; Mai, T.T.; Tran, T.D. Flavonoids as Dual-Target Inhibitors against α-Glucosidase and α-Amylase: A Systematic Review of in Vitro Studies. Nat. Prod. Bioprospect. 2024, 14, 4. [Google Scholar] [CrossRef]
- Dirir, A.M.; Daou, M.; Yousef, A.F.; Yousef, L.F. A Review of Alpha-Glucosidase Inhibitors from Plants as Potential Candidates for the Treatment of Type-2 Diabetes; Springer: Dordrecht, The Netherlands, 2022; Volume 21, ISBN 0123456789. [Google Scholar]
- Alzaid, F.; Cheung, H.M.; Preedy, V.R.; Sharp, P.A. Regulation of Glucose Transporter Expression in Human Intestinal Caco-2 Cells Following Exposure to an Anthocyanin-Rich Berry Extract. PLoS ONE 2013, 8, e78932. [Google Scholar] [CrossRef] [PubMed]
- Salazar, R.; Vidal, J.; Martínez-Cifuentes, M.; Araya-Maturana, R.; Ramírez-Rodríguez, O. Electrochemical Characterization of Hydroquinone Derivatives with Different Substituents in Acetonitrile. N. J. Chem. 2015, 39, 1237–1246. [Google Scholar] [CrossRef]
- Monroy-Cárdenas, M.; Andrades, V.; Almarza, C.; Vera, M.J.; Martínez, J.; Pulgar, R.; Amalraj, J.; Araya-Maturana, R.; Urra, F.A. A New Quinone-Based Inhibitor of Mitochondrial Complex I in D-Conformation, Producing Invasion Reduction and Sensitization to Venetoclax in Breast Cancer Cells. Antioxidants 2023, 12, 1597. [Google Scholar] [CrossRef] [PubMed]
- Castro, C.G.; Santos, J.G.; Valcárcel, J.C.; Valderrama, J.A. Kinetic Study of the Acid-Catalyzed Rearrangement of 4-Acetyl-3,3-Dimethyl-5-Hydroxy-2-Morpholino-2,3-Dihydrobenzo[b]Furan. J. Org. Chem. 1983, 48, 3026–3029. [Google Scholar] [CrossRef]
- Araya-Maturana, R.; Delgado-Castro, T.; Gárate, M.; Ferreira, J.; Pavani, M.; Pessoa-Mahana, H.; Cassels, B.K. Effects of 4,4-Dimethyl-5,8-Dihydroxynaphtalene-1-One and 4,4-Dimethyl-5,8-Dihydroxytetralone Derivatives on Tumor Cell Respiration. Bioorganic Med. Chem. 2002, 10, 3057–3060. [Google Scholar] [CrossRef]
- Araya-Maturana, R.; Cardona, W.; Cassels, B.K.; Delgado-Castro, T.; Ferreira, J.; Miranda, D.; Pavani, M.; Pessoa-Mahana, H.; Soto-Delgado, J.; Weiss-López, B. Effects of 9,10-Dihydroxy-4,4-Dimethyl-5,8-Dihydro-1(4H)-Anthracenone Derivatives on Tumor Cell Respiration. Bioorg. Med. Chem. 2006, 14, 4664–4669. [Google Scholar] [CrossRef] [PubMed]
- Almodõvar, I.; Ramírez-Rodríguez, O.; Barriga, A.; Rezende, M.C.; Araya-Maturana, R. Electrospray Ionization Mass Spectrometric Fragmentation of Hydroquinone Derivatives. Rapid Commun. Mass Spectrom. 2011, 25, 370–378. [Google Scholar] [CrossRef] [PubMed]
- Martínez-Cifuentes, M.; Monroy-Cárdenas, M.; Millas-Vargas, J.P.; Weiss-López, B.E.; Araya-Maturana, R. Assessing Parameter Suitability for the Strength Evaluation of Intramolecular Resonance Assisted Hydrogen Bonding in O-Carbonyl Hydroquinones. Molecules 2019, 24, 280. [Google Scholar] [CrossRef] [PubMed]
- Schaich, K.M.; Tian, X.; Xie, J. Hurdles and Pitfalls in Measuring Antioxidant Efficacy: A Critical Evaluation of ABTS, DPPH, and ORAC Assays. J. Funct. Foods 2015, 14, 111–125. [Google Scholar] [CrossRef]
- Costamagna, M.S.; Zampini, I.C.; Alberto, M.R.; Cuello, S.; Torres, S.; Pérez, J.; Quispe, C.; Schmeda-Hirschmann, G.; Isla, M.I. Polyphenols Rich Fraction from Geoffroea Decorticans Fruits Flour Affects Key Enzymes Involved in Metabolic Syndrome, Oxidative Stress and Inflammatory Process. Food Chem. 2016, 190, 392–402. [Google Scholar] [CrossRef]
- Frisch, M.J.; Trucks, G.W.; Schlegel, H.B.; Scuseria, G.E.; Robb, M.A.; Cheeseman, J.R.; Scalmani, G.; Barone, V.; Mennucci, B.; Petersson, G.A. Revision A.01, Gaussian 09; Gaussian, Inc.: Wallingford, CT, USA, 2009. [Google Scholar]
- Watts, K.S.; Dalal, P.; Murphy, R.B.; Sherman, W.; Friesner, R.A.; Shelley, J.C. ConfGen: A Conformational Search Method for Efficient Generation of Bioactive Conformers. J. Chem. Inf. Model. 2010, 50, 534–546. [Google Scholar] [CrossRef] [PubMed]
- Friesner, R.A.; Banks, J.L.; Murphy, R.B.; Halgren, T.A.; Klicic, J.J.; Mainz, D.T.; Repasky, M.P.; Knoll, E.H.; Shelley, M.; Perry, J.K.; et al. Glide: A New Approach for Rapid, Accurate Docking and Scoring. 1. Method and Assessment of Docking Accuracy. J. Med. Chem. 2004, 47, 1739–1749. [Google Scholar] [CrossRef]
- Halgren, T.A.; Murphy, R.B.; Friesner, R.A.; Beard, H.S.; Frye, L.L.; Pollard, W.T.; Banks, J.L. Glide: A New Approach for Rapid, Accurate Docking and Scoring. 2. Enrichment Factors in Database Screening. J. Med. Chem. 2004, 47, 1750–1759. [Google Scholar] [CrossRef]
- Madhavi Sastry, G.; Adzhigirey, M.; Day, T.; Annabhimoju, R.; Sherman, W. Protein and Ligand Preparation: Parameters, Protocols, and Influence on Virtual Screening Enrichments. J. Comput. Aided Mol. Des. 2013, 27, 221–234. [Google Scholar] [CrossRef] [PubMed]
- Friesner, R.A.; Murphy, R.B.; Repasky, M.P.; Frye, L.L.; Greenwood, J.R.; Halgren, T.A.; Sanschagrin, P.C.; Mainz, D.T. Extra Precision Glide: Docking and Scoring Incorporating a Model of Hydrophobic Enclosure for Protein-Ligand Complexes. J. Med. Chem. 2006, 49, 6177–6196. [Google Scholar] [CrossRef]
- Jacobson, M.P.; Pincus, D.L.; Rapp, C.S.; Day, T.J.F.; Honig, B.; Shaw, D.E.; Friesner, R.A. A Hierarchical Approach to All-Atom Protein Loop Prediction. Proteins Struct. Funct. Genet. 2004, 55, 351–367. [Google Scholar] [CrossRef] [PubMed]
- Rojas-Prats, E.; Martinez-Gonzalez, L.; Gonzalo-Consuegra, C.; Liachko, N.F.; Perez, C.; Ramírez, D.; Kraemer, B.C.; Martin-Requero, Á.; Perez, D.I.; Gil, C.; et al. Targeting Nuclear Protein TDP-43 by Cell Division Cycle Kinase 7 Inhibitors: A New Therapeutic Approach for Amyotrophic Lateral Sclerosis. Eur. J. Med. Chem. 2021, 210, 112968. [Google Scholar] [CrossRef]
- Córdova-Delgado, M.; Fuentes-Retamal, S.; Palominos, C.; López-Torres, C.; Guzmán-Rivera, D.; Ramírez-Rodríguez, O.; Araya-Maturana, R.; Urra, F.A. Fri-1 Is an Anti-Cancer Isoquinolinequinone That Inhibits the Mitochondrial Bioenergetics and Blocks Metabolic Shifts by Redox Disruption in Breast Cancer Cells. Antioxidants 2021, 10, 1618. [Google Scholar] [CrossRef]
Disclaimer/Publisher’s Note: The statements, opinions and data contained in all publications are solely those of the individual author(s) and contributor(s) and not of MDPI and/or the editor(s). MDPI and/or the editor(s) disclaim responsibility for any injury to people or property resulting from any ideas, methods, instructions or products referred to in the content. |
© 2024 by the authors. Licensee MDPI, Basel, Switzerland. This article is an open access article distributed under the terms and conditions of the Creative Commons Attribution (CC BY) license (https://creativecommons.org/licenses/by/4.0/).