Article

Transcriptome-Based Screening of Candidate Low-Temperature-Associated Genes and Analysis of the BocARR-B Transcription Factor Gene Family in Kohlrabi (Brassica oleracea L. var. caulorapa L.)

1
Academy of Agriculture and Forestry Sciences, Qinghai University, Xining 810016, China
2
Laboratory of Research and Utilization of Germplasm Resources in Qinghai-Tibet Plateau, Qinghai University, Xining 810016, China
3
Key Laboratory of Germplasm Resources Protection and Genetic Improvement of the Qinghai-Tibet Plateau in Ministry of Agriculture and Rural, Xining 810016, China
4
College of Agriculture and Animal Husbandry, Qinghai University, Xining 810016, China
*
Author to whom correspondence should be addressed.
Int. J. Mol. Sci. 2024, 25(17), 9261; https://doi.org/10.3390/ijms25179261
Submission received: 19 July 2024 / Revised: 21 August 2024 / Accepted: 22 August 2024 / Published: 27 August 2024
(This article belongs to the Special Issue Advance in Plant Abiotic Stress)

Abstract

:
Low temperature is a significant abiotic stress factor that not only impacts plant growth, development, yield, and quality but also constrains the geographical distribution of numerous wild plants. Kohlrabi (Brassica oleracea L. var. caulorapa L.) belongs to the Brassicaceae family and has a short growing period. In this study, a total of 196,642 unigenes were obtained from kohlrabi seedlings at low temperatures; of these, 52,836 unigenes were identified as differentially expressed genes. Transcription factor family members ARR-B, C3H, B3-ARF, etc. that had a high correlation with biochemical indicators related to low temperature were identified. A total of nineteen BocARR-B genes (named BocARR-B1BocARR-B19) were obtained, and these genes were distributed unevenly across seven chromosomes. Nineteen BocARR-B genes searched four conserved motifs and were divided into three groups. The relative expression level analysis of 19 BocARR-B genes of kohlrabi showed obvious specificity in different tissues. This study lays a foundation and provides new insight to explain the low-temperature resistance mechanism and response pathways of kohlrabi. It also provides a theoretical basis for the functional analysis of 19 BocARR-B transcription factor gene family members.

1. Introduction

Kohlrabi (Brassica oleracea L. var. caulorapa L.) is a member of the Brassicaceae family, and it has a short growing period [1]. Kohlrabi is mainly cultivated in Europe, the United States, and Canada [2]. The typical biological feature of kohlrabi is its fleshy, swollen stem (bulb), which provides a high nutritional value for humans. Kohlrabi contains plenty of vitamin C, glucosinolates, and mineral nutrients such as potassium [3,4,5,6]. The swollen stem of kohlrabi is commonly green, greenish-white, or purple and is mainly consumed by humans as raw, cooked, or preserved [7,8].
Low temperature is one of the important abiotic stresses that not only affect plant growth, development, yield, and quality but also limit the geographical distribution of many wild plants [9,10]. There are two types of low-temperature stress, namely cold stress (0 °C~16 °C) and freezing stress (<0 °C). Generally, the adaptability of plants to low temperatures above the freezing point is called cold resistance, and the adaptability to low temperatures below the freezing point is called freezing resistance [11]. Due to its variation among species and different low-temperature severities, physiological and gene network responses to low temperatures are complex; thus, temperate plants may be more cold-tolerant than tropical plants [12]. Therefore, studying the response mechanism to cold stress and excavating the differentially expressed genes in different plants are very important. Using the transcriptome sequencing approach, screening differentially expressed genes (DEGs) in response to adversity stress is a technical means that has been reported several times [13,14]. Li et al. [15] reported that multiple transcription factors, including the bHLH, MYB, HD-ZIP, and ERF families, were holistically elevated in tall fescue under low-temperature stress. Dai et al. [16] reported that the cold tolerance of A. thaliana transgenic plants was enhanced due to the overexpression of OsMYB4 and that OsMYB3R-2 from Oryza sativa influenced the expression of multiple genes in the cold-response pathway. Yang et al. [17] found that 33 TFs from six families of AP2/ERF, MYB, WRKY, GRAS, bHLH, and bZIP were closely associated with the response to low-temperature stress in poplar (Populus tomentosa). However, the response mechanism of kohlrabi under low-temperature stress has not been reported.
The response of plants to abiotic stress can lead to changes in the variety and number of metabolites [18,19]. The metabolic network response mechanism of plants has been widely studied under low-temperature stress. Thomashow [20] found that the encoded proteins of CBF genes can activate the expression of COR genes, resulting in the accumulation of protective substances in Arabidopsis. Zhang et al. [21] showed that the sucrose content was increased by the overexpression of SlHSP17.7 in the hexose-accumulating Moneymaker tomato. Kidokoro et al. [22] reported that the expression of CBF1 and CBF2 was regulated by CAMTA3 and CAMTA5 in response to rapidly decreasing temperatures. However, the molecular and metabolic network mechanisms of kohlrabi’s response to low-temperature stress have not been reported.
The transcription factor gene family of type-B authentic response regulators (ARR-Bs) is an important plant-specific transcription factor family involved in positive regulators of cytokinin signal transduction, and it plays important roles in abiotic stress resistance and plant development in, at least, the typical PF00072 and PF00249 domains [23,24,25]. Nguyen et al. [26] found that ARR1, ARR10, and ARR12 play key roles in cold and drought signaling in Arabidopsis. Jeon et al. [27] reported that type-B ARRs can regulate type-A ARRs that improve cold tolerance in Arabidopsis. Kang et al. [28] showed that cold stress resistance can be improved by the overexpression of ARR22. All in all, type-B ARRs play a direct or indirect key role in positively responding to environmental stress. The ARR-B family has been researched in a variety of plants, mainly soybean [25], peach [29], tomato [30], and tea plants [31]. The identification and analysis of the ARR-B transcription factor family in kohlrabi could provide a theoretical basis for distinguishing the function of the ARR-B gene.
For this study, we first analyzed the DEGs in kohlrabi under low-temperature stress. Second, the differentially expressed transcription factors related to low temperature were screened. Meanwhile, we analyzed the BocARR-B transcription factor gene family. This study laid a foundation and provided new insight into the low-temperature resistance mechanism of kohlrabi. It also provided a theoretical basis for the functional analysis of family members of the BocARR-B transcription factor gene.

2. Results

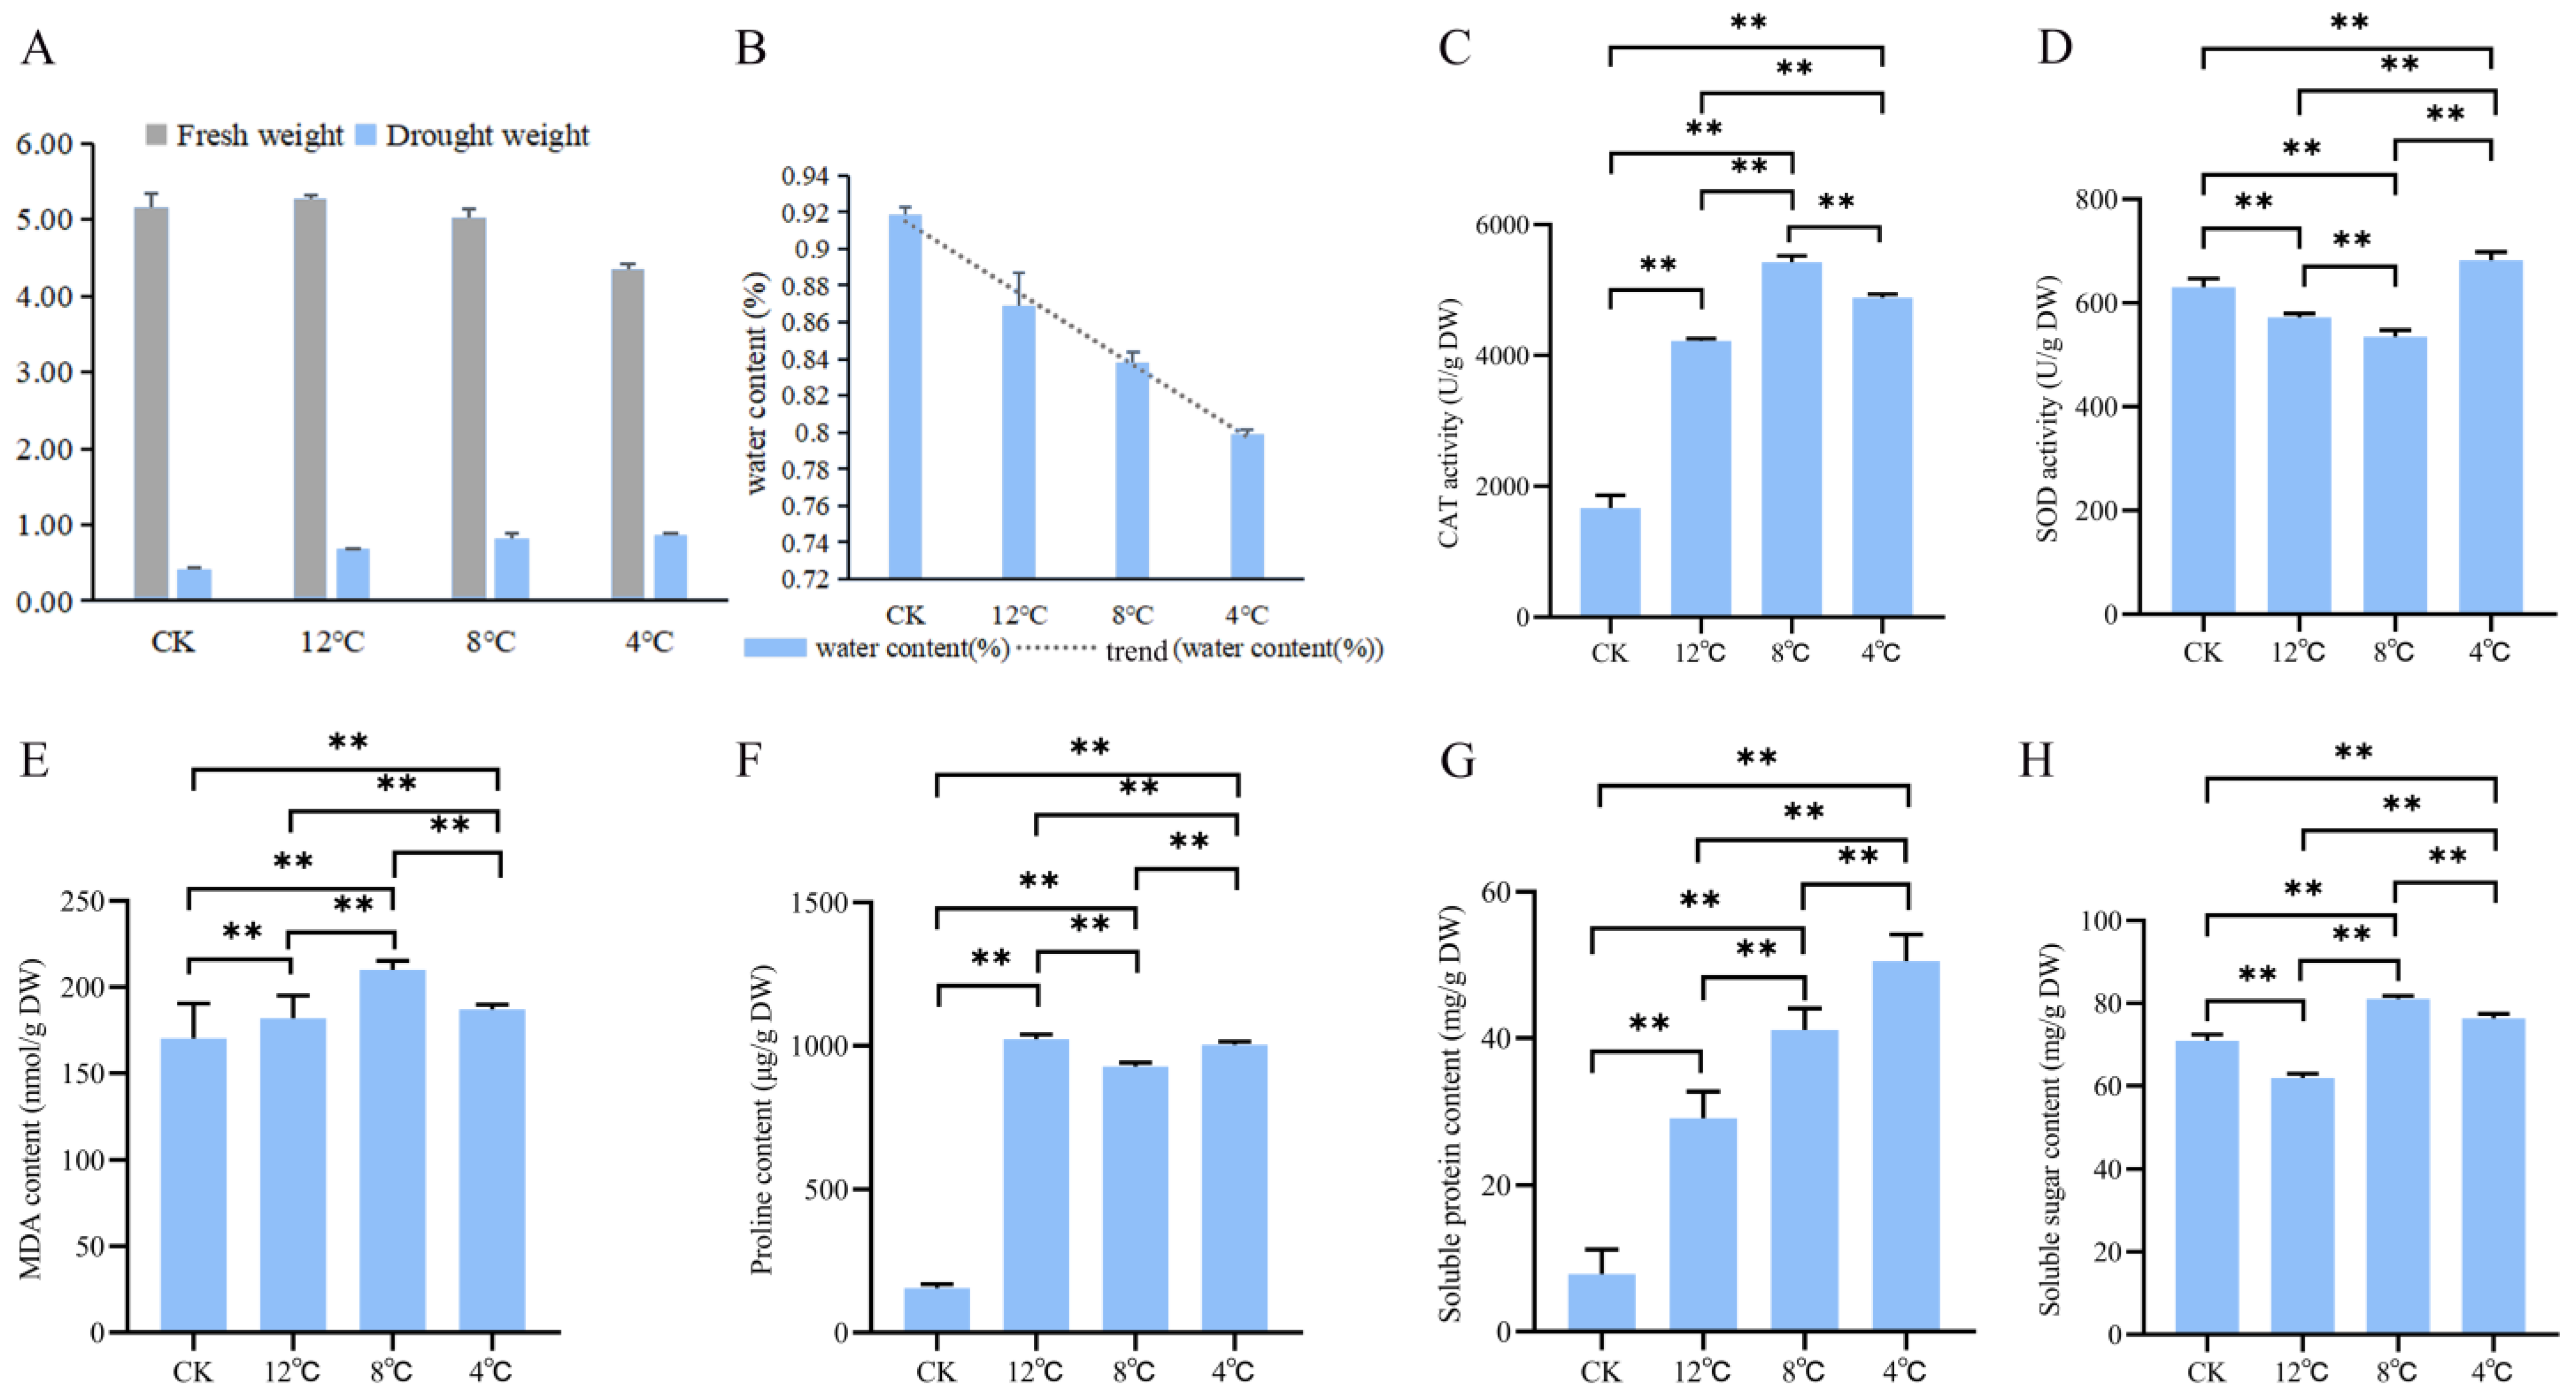
2.1. Biochemical Indicators Changes in Kohlrabi under Low-Temperature Stress

We initially conducted measurements of the changes in both the fresh and dry weights of kohlrabi seedlings under low-temperature stress using fresh kohlrabi seedlings (fresh weight (FW)) that were first weighed. Subsequently, fresh kohlrabi seedlings were dried at 90 °C for 10 h (dry weight (DW)) (Figure 1A). Then, the water content was calculated using the following formula: water content = (FW − DW)/FW*100%. The results revealed a decreasing trend in the water content of kohlrabi seedlings, with values of 91.88%, 86.93%, 83.82%, and 79.86% recorded at temperatures of CK (22 °C), 12 °C, 8 °C, and 4 °C respectively (Figure 1B). Then, six biochemical indicators of change were determined, including catalase (CAT) activity, superoxide dismutase (SOD) activity, malondialdehyde (MDA) content, proline (Pro) content, soluble protein content, and soluble sugar content. Among them, all biochemical indicators (fresh weight) were significantly higher in kohlrabi seedlings under low-temperature stress than those in untreated kohlrabi seedlings (CK) (Table S1). To determine the severity of the stress treatment, all biochemical indicators were normalized by dry weight. CAT activity was significantly stronger after treatment than that in the control and significantly weaker at 4 °C (4881.14 ± 58.09 U/g DW) than at 8 °C (5427.04 ± 94.38 U/g DW) (Figure 1C). SOD activity was significantly weaker at 12 °C (572.01 ± 7.60 U/g DW) and 8 °C (534.81 ± 12.67 U/g DW) after treatment than that in the control and significantly stronger at 4 °C (682.06 ± 16.50 U/g DW) than that in the control (Figure 1D). MDA content was significantly higher after treatment than that in the control and significantly lower at 4 °C (187.23 ± 2.66 nmol/g DW) than those at 8 °C (210.19 ± 5.09 nmol/g DW) (Figure 1E). The proline content was significantly higher after treatment than that in the control and significantly lower at 8 °C (927.00 ± 13.53 μg/g DW) than those at 12 °C (1023.18 ± 16.73 μg/g DW) and 4 °C (1003.75 ± 10.90 μg/g DW) (Figure 1F). The soluble protein content was significantly increased after treatment; the content was 7.86 ± 3.35 mg/g DW at CK and 50.53 ± 3.62 mg/g DW at 4 °C (Figure 1G). The soluble sugar content was significantly lower at 12 °C (61.93 ± 1.00 mg/g DW) after treatment than that in the control and significantly higher at 8 °C (81.05 ± 0.77 mg/g DW) and 4 °C (76.38 ± 1.10 mg/g DW) than in the control (Figure 1H).

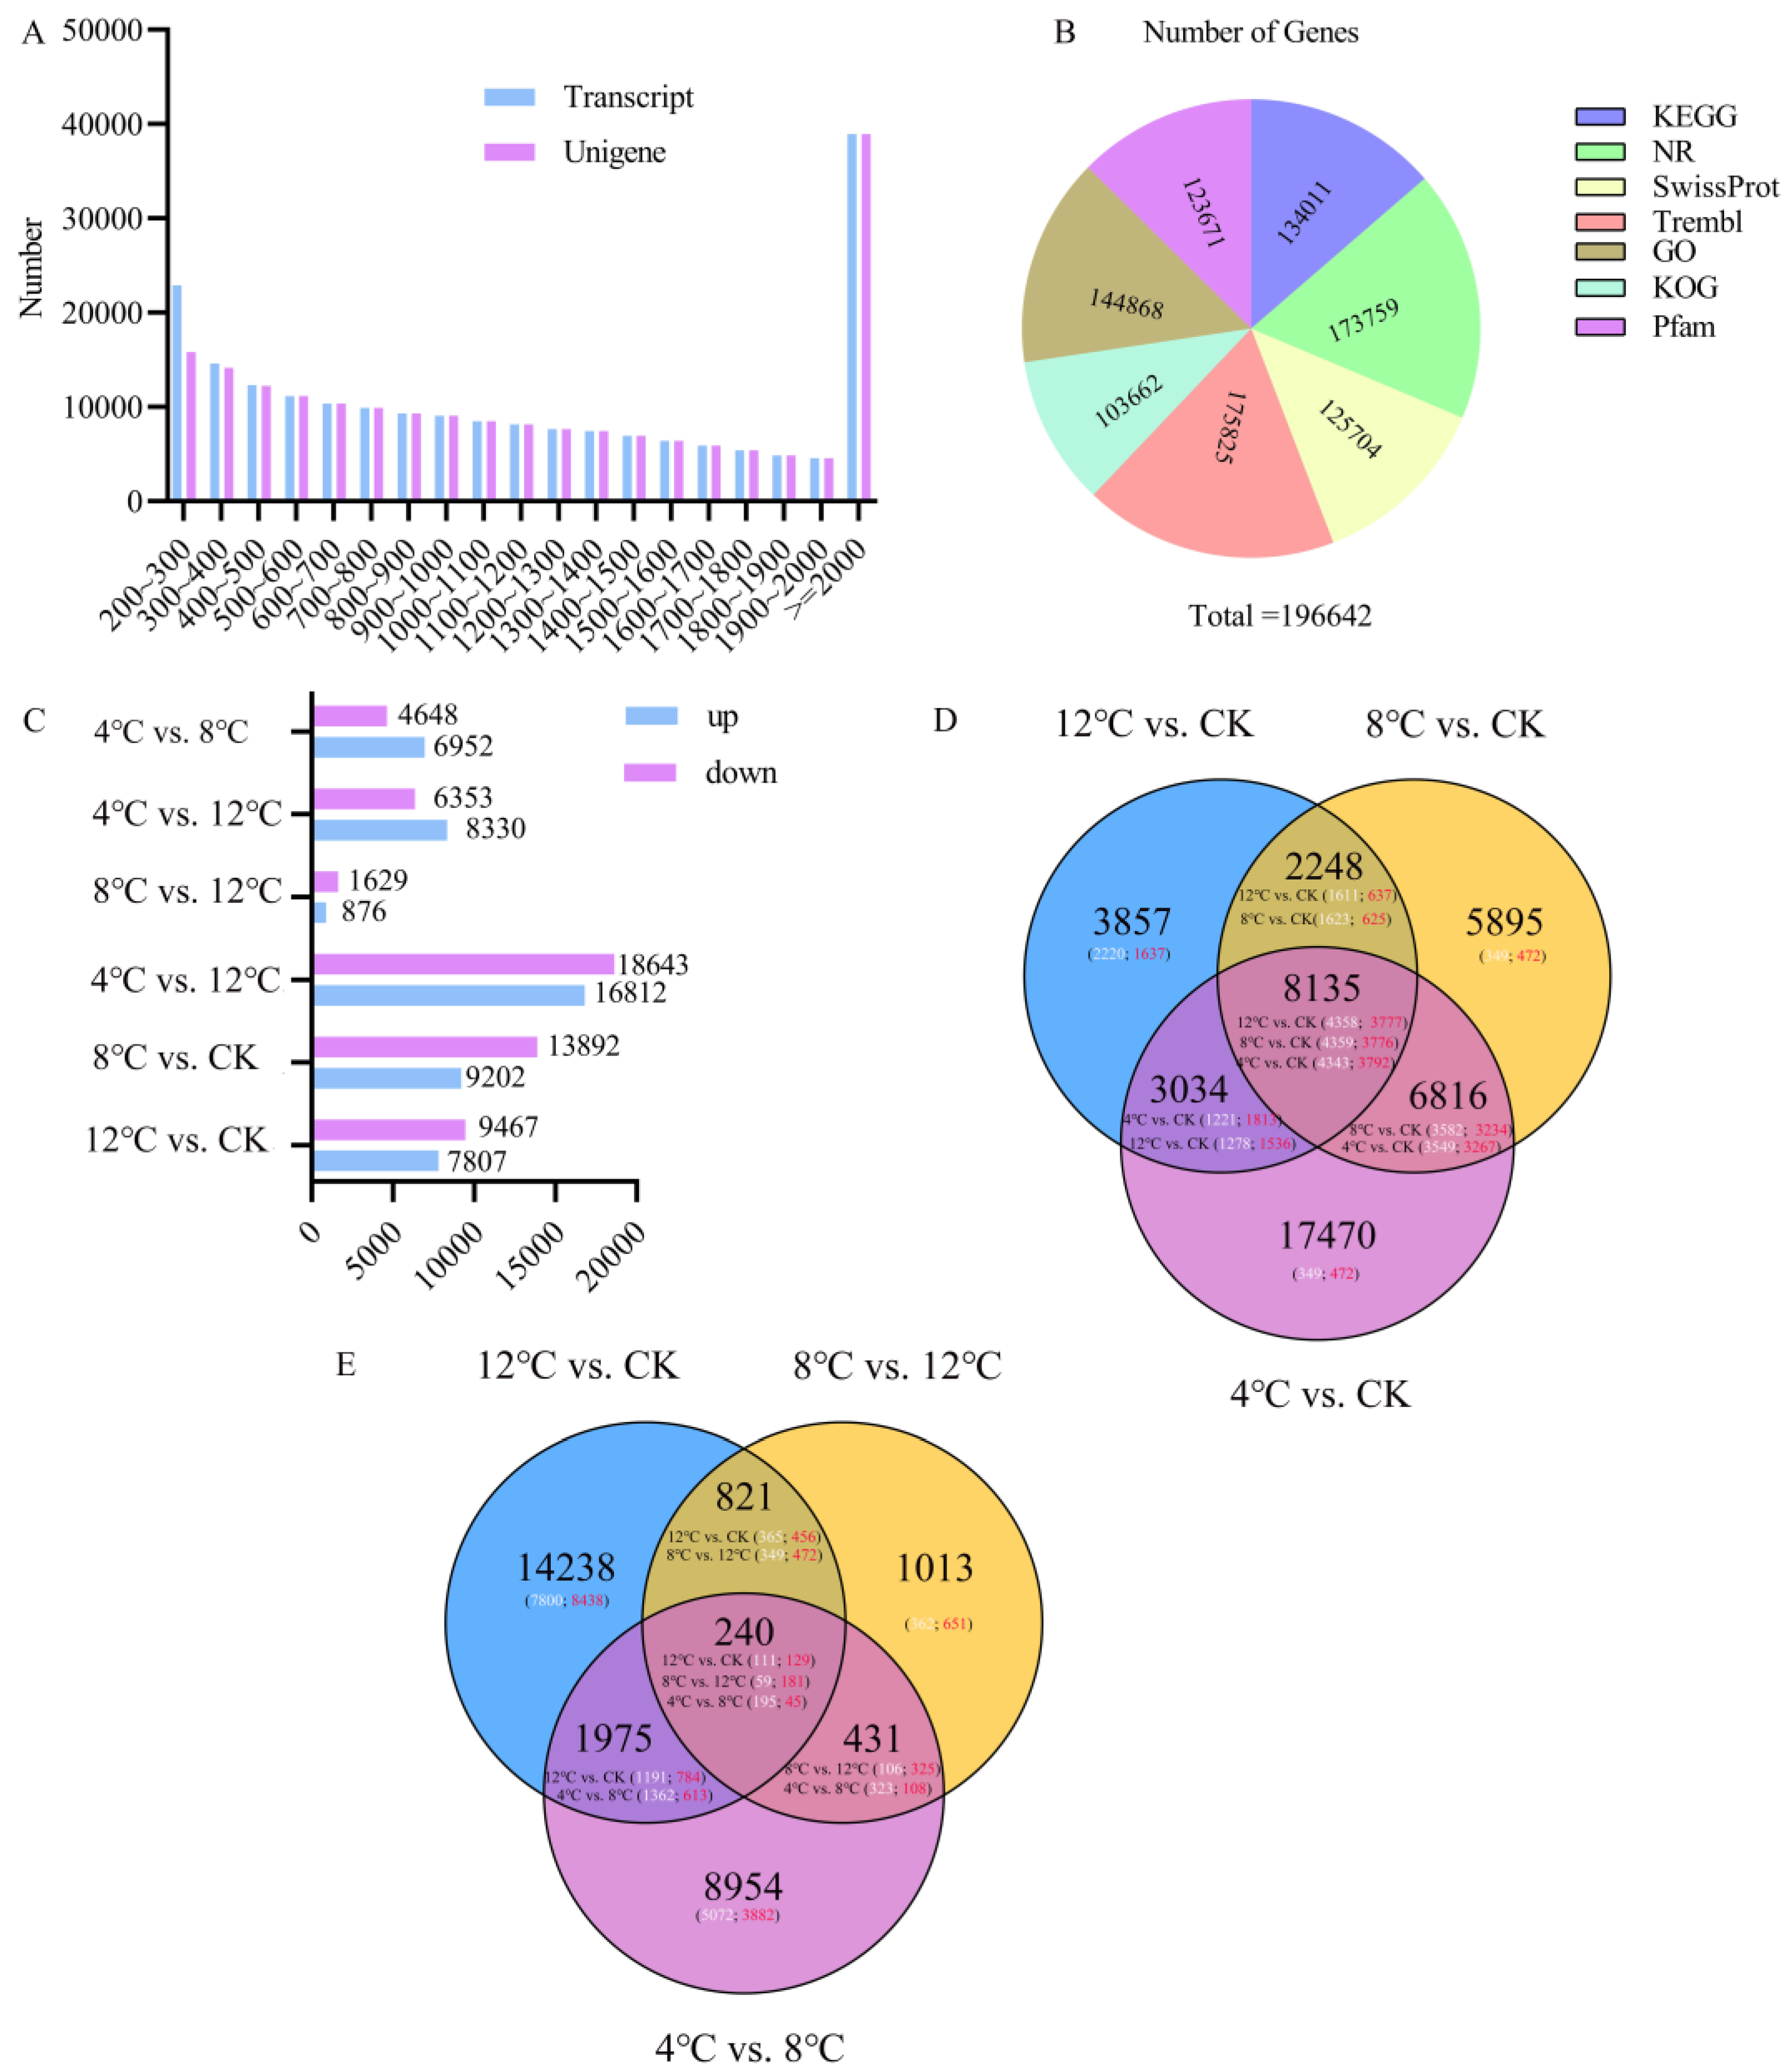
2.2. Transcriptome Data Summary and KEGG Enrichment Analysis

To understand the molecular basis of kohlrabi seedlings under low-temperature stress, twelve samples (CK-1, CK-2, CK-3, 12 °C-1, 12 °C-2, 12 °C-3, 8 °C-1, 8 °C-2, 8 °C-3, 4 °C-1, 4 °C-2, and 4 °C-3) were subjected to total RNA extraction and transcriptome sequencing. A total of 51,903,722~43,469,990 raw reads were obtained, with an average of 48,007,155 raw reads. After filtering the adaptor and low-quality sequence, a total of 48,868,442~42,735,880 clean reads were obtained, with an average number of clean reads per sample of 45,754,446. The guanine and cytosine bases’ content ranged from 43.97 to 47.42%, the Q30 value for each library was >93.33%, and the Q20 value for each library was >97.67%.
The size and distribution of the transcripts’ and unigenes’ length showed that 49,843 (24.39%) transcripts were less than 500 bp in length, and 38,951 (19.06%) transcripts were greater than 2000 bp. Similarly, a total of 42,181 (21.45%) unigenes were less than 500 bp in length (Figure 2A). A total of 196,642 (100.00%) unigenes were annotated in the Kyoto Encyclopedia of Genes and Genomes (KEGG), NCBI non-redundant (NR), Swiss-Prot, Gene Ontology (GO), euKaryotic Ortholog Groups (KOG), Trembl, and Pfam databases. The results showed that 134,011 (68.15%), 173,759 (88.36%), 125,704 (63.93%), 175,825 (89.41%), 103,662 (52.72%), 144,868 (73.67%), and 123,671 (62.89%) unigenes were annotated in these seven databases, respectively (Table S2). Furthermore, 177,301 (90.16%) unigenes were assigned to be annotated in at least one database (Figure 2B). RNA-Seq results showed that a total of 52,836 unigenes were identified as differentially expressed genes. Then, we performed pairwise comparisons of all DEGs. In the comparison of 12 °C vs. CK, 17,274 DEGs (7807 upregulated and 9467 downregulated at 12 °C) were identified; in the comparison of 8 °C vs. CK, 23,094 DEGs (9202 upregulated and 13,892 downregulated at 8 °C) were identified; in the comparison of 4 °C vs. CK, 35,455 DEGs (16,812 upregulated and 18,643 downregulated at 4 °C) were identified; in the comparison of 4 °C vs. 12 °C, 14,683 DEGs (8330 upregulated and 6353 downregulated at 4 °C) were identified; in the comparison of 4 °C vs. 8 °C, 11,600 DEGs (6952 upregulated and 4648 downregulated at 4 °C) were identified; and in the comparison of 8 °C vs. 12 °C, 2505 DEGs (876 upregulated and 1629 downregulated at 8 °C) were identified (Figure 2C).
At the same time, the 8135 common DEGs were analyzed in the comparison of 12 °C vs. CK, 8 °C vs. CK, and 4 °C vs. CK (Figure 2D, Table S3). Similarly, 240 common DEGs were searched for in the comparison of 12 °C vs. CK, 8 °C vs. 12 °C, and 4 °C vs. 8 °C (Figure 2E, Table S4). The results of the KEGG enrichment analysis are shown in Figure S1, and the top three pathways in the KEGG enrichment analyses are demonstrated for 4 °C vs. CK (Figure S1A,B). The top three pathways are the metabolic pathway (ko01100), plant hormone signal transduction pathway (ko04075), and the plant–pathogen interaction (ko04626) pathway. The top three pathways in the KEGG enrichment analysis were demonstrated at 8 °C vs. CK (Figure S1C,D), with the top three pathways being the metabolic pathway (ko01100), biosynthesis of secondary metabolites pathway (ko01110), and the plant hormone signal transduction pathway (ko04075). Similarly, the top three pathways in KEGG enrichment analysis were demonstrated at 12 °C vs. CK (Figure S1E,F), with the top three pathways being the metabolic pathway (ko01100), biosynthesis of secondary metabolites pathway (ko01110), and the plant hormone signal transduction pathway (ko04075). K-means cluster analysis showed that ten subclasses were present. Subclass 5 included 4744 unigenes with a continuous decrease in expression profile from CK to 4 °C. Subclass 9 included genes with a continuous increase in expression from CK to 4 °C (Figure S2, Table S5). According to sequence alignment with the NR database, we found that Brassica napus had the most unigene hits (72,081, 41.48%), followed by Brassica oleracra var. oleracra (66,448, 38.24%) (Figure S3).

2.3. Availability Analysis of Transcriptome Data

The accuracy of RNA-Seq data was confirmed via RT-qPCR. Ten randomly selected DEGs were tested in kohlrabi with three replications. The 2−ΔΔCT of RT-qPCR and log2(FPKM) of RNA-Seq were analyzed at 4 °C, 8 °C, 12 °C, and CK (Figure 3). The results showed that the relative expression levels of DEGs (BnaC05g00840D (Cluster-17807.81882), SYD (Cluster-17807.82832), Zinc finger protein CONSTANS-LIKE 4 (Cluster-17807.77797), C3H49 (Cluster-17807.85268), C3H30 (Cluster-17807.81598), RGA2 (Cluster-17807.82153), DOF3.3 (Cluster-17807.86516), and B-box zinc finger protein 25 (Cluster-17807.84461)) were highly consistent with RNA-Seq data (R > 0.95). In addition, the relative expression levels of DEGs (MYB1-R1 (Cluster-17807.81941)) were consistent with RNA-Seq data (R ≥ 0.90). The results of the analysis indicated that RT-qPCR and transcriptome data had a significant positive correlation, which showed that transcriptome data were available.

2.4. Basic Genetic Analysis of Metabolite Networks under Low-Temperature Stress

According to the literature and the web-based KEGG database, the metabolic pathways were proposed and constructed to achieve an in-depth understanding of the regulatory pathways that respond to low-temperature stress. The important known pathways include the Glycolysis/Gluconeogenesis (ko00010), starch and sucrose metabolism (ko00500), glyoxylate and dicarboxylate metabolism (ko00630), and the butanoate metabolism pathway (ko00650) (Figure 4). Sixty-six DEGs related to low temperature were identified in kohlrabi seedlings. In the Glycolysis/Gluconeogenesis pathway, four low-temperature-related DEGs (PGM1, GPI1, GAPC2, and PGAM1) were notably downregulated. In the starch and sucrose metabolism pathway, nine low-temperature-related DEGs (six AMY2 and three ISA3) were notably upregulated or downregulated. In the glyoxylate and dicarboxylate metabolism pathway, no low-temperature-related DEGs were found to be notably upregulated or downregulated. In the butanoate metabolism pathway, five low-temperature-related DEGs (three GAD2 and two POP2) were notably downregulated.

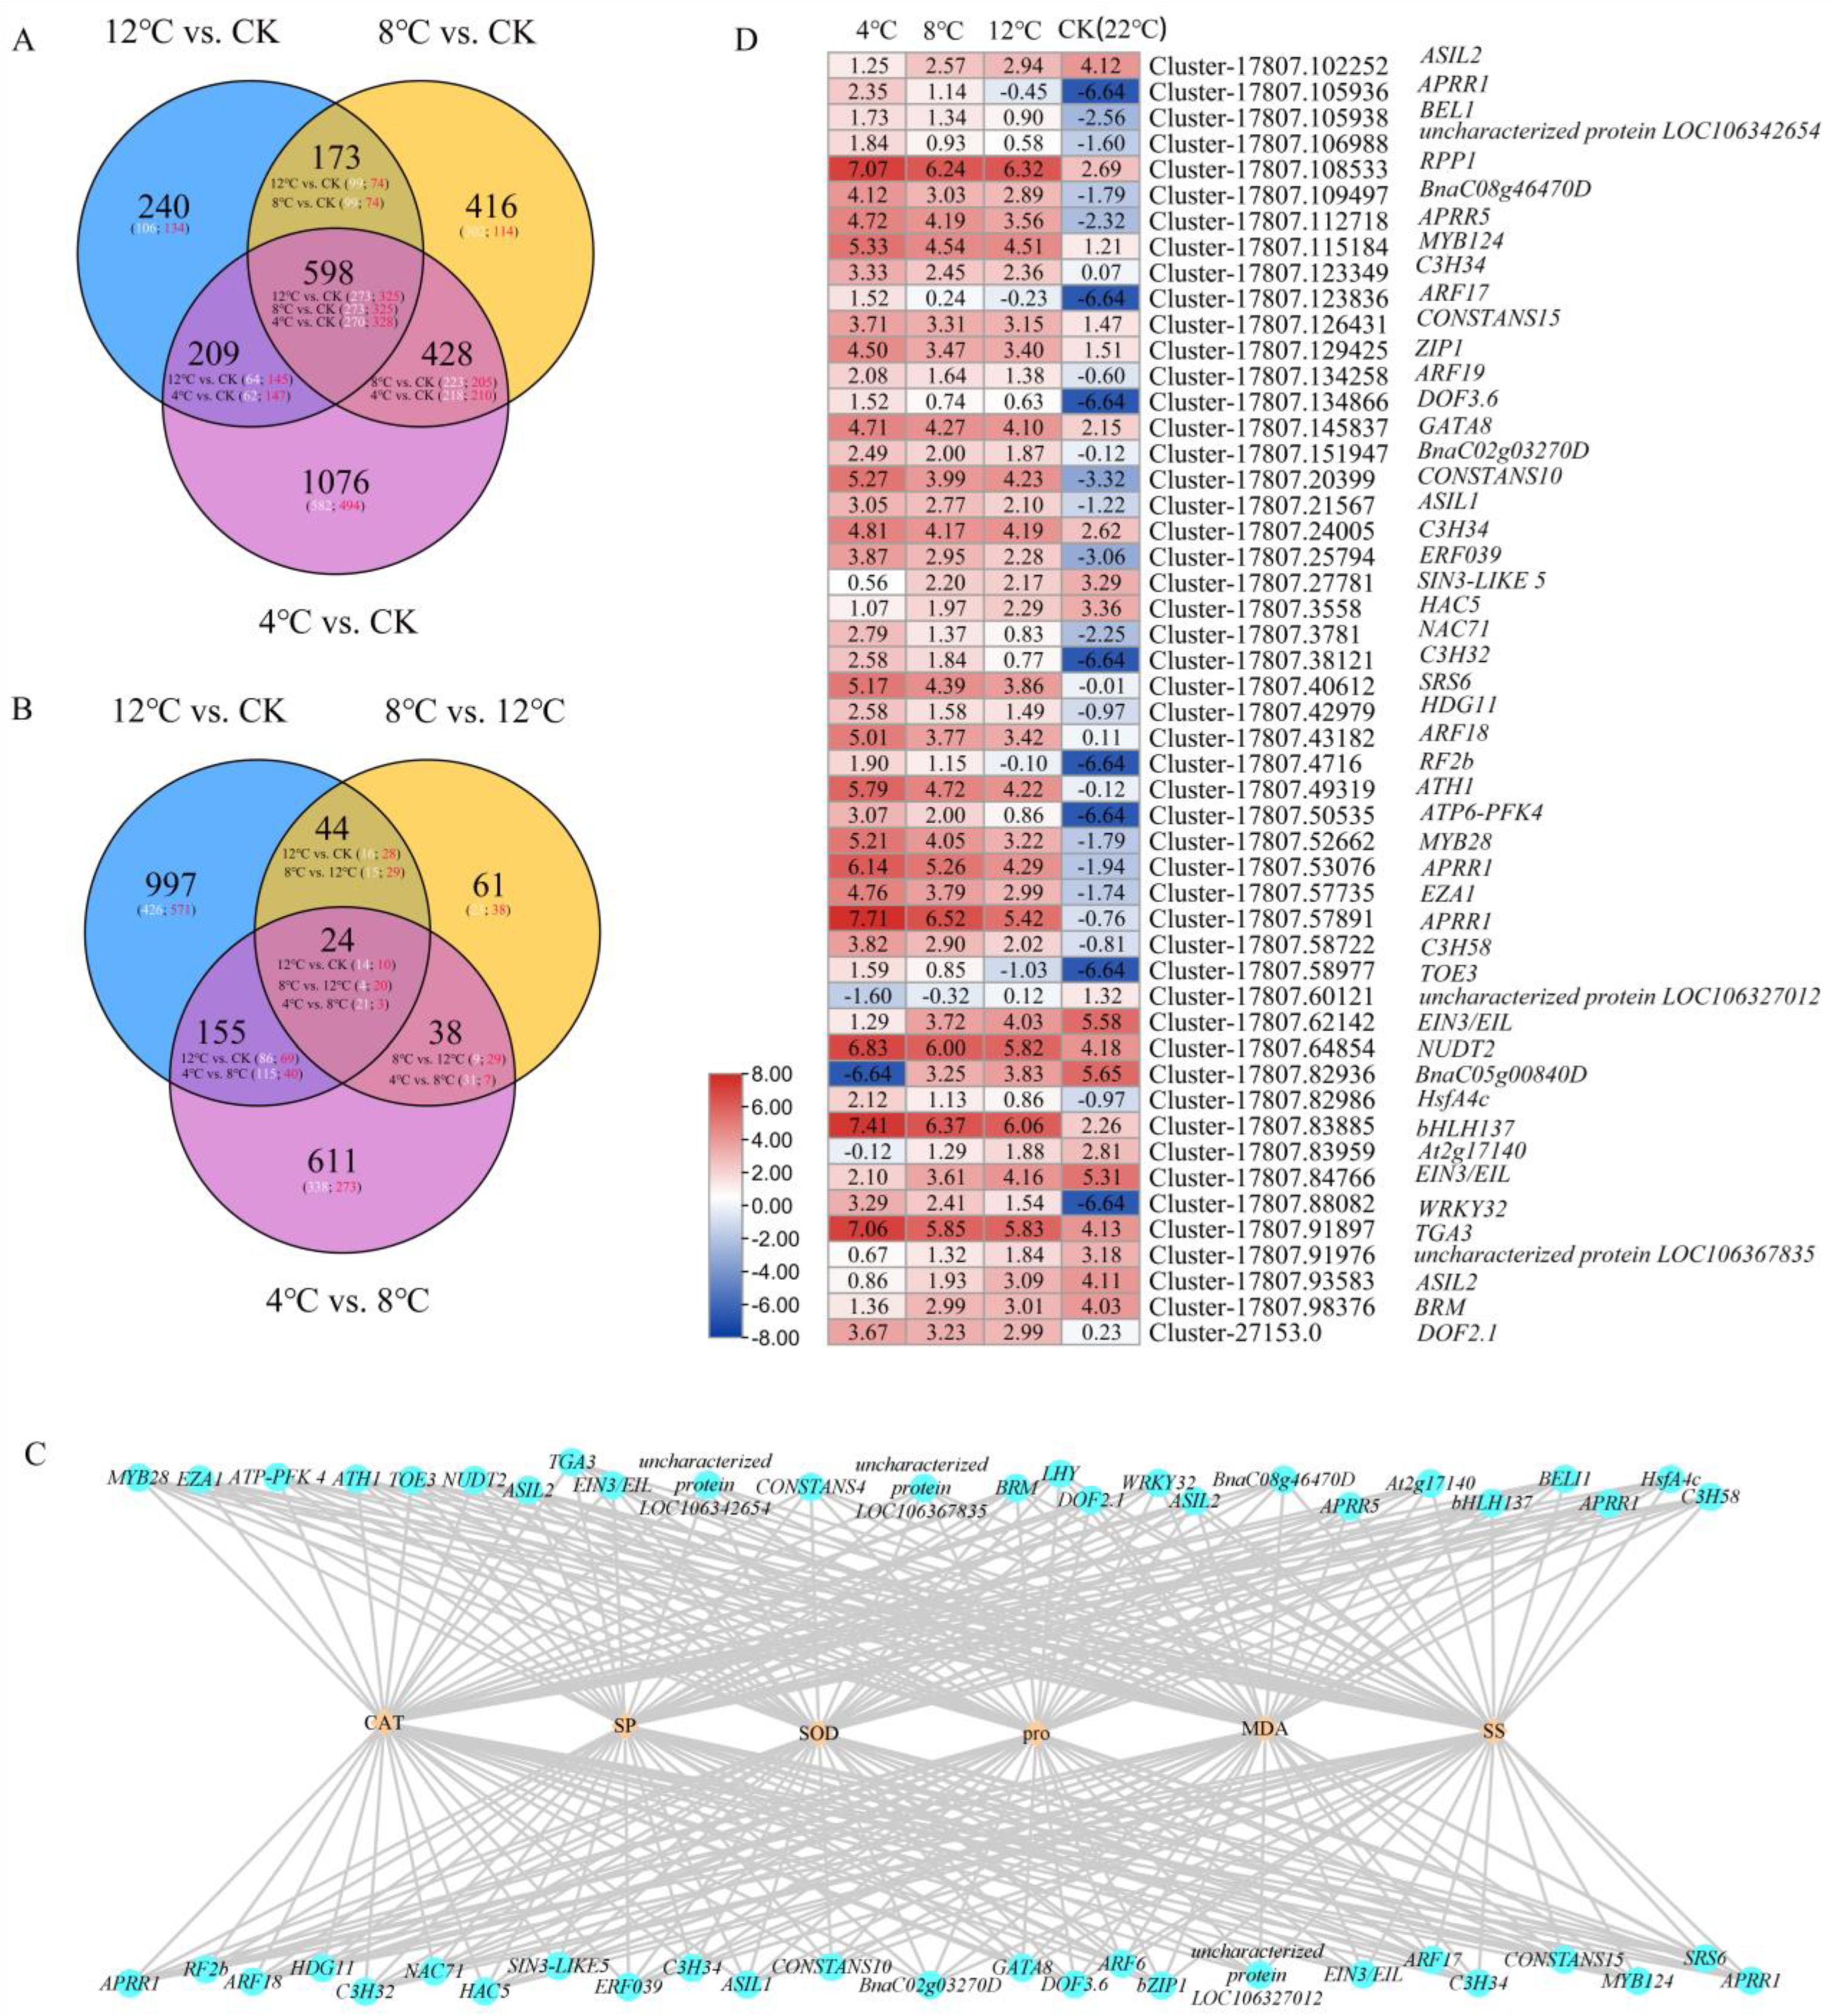
2.5. Analysis of Differentially Expressed Transcription Factor and Weighted Gene Co-Expression Network Analysis between Biochemical Indicators Related to Low Temperature and Differentially Expressed Transcription Factors

To identify the differentially expressed transcription factors in kohlrabi under low-temperature stress, we performed pairwise comparisons of all differentially expressed transcription factors, with the results showing that 598 common differentially expressed transcription factors were searched for in 12 °C vs. CK, 8 °C vs. CK, and 4 °C vs. CK (Figure 5A, Table S6). Similarly, a total of 24 common differentially expressed transcription factors was searched for in 12 °C vs. CK, 8 °C vs. 12 °C, and 4 °C vs. 8 °C (Figure 5B, Table S7). Biochemical indicators (CAT activity, SOD activity, MDA content, pro content, soluble protein content, and soluble sugar content) and differentially expressed transcription factors were analyzed using weighted gene correlations. Fifty differentially expressed transcription factors showed a high correlation with CAT activity, SOD activity, MDA content, pro content, soluble protein content, and soluble sugar content, including WRKY32, bHLH137, APRR1, MYB28 and so forth (Figure 5C). In order to further apprehend the trend in expressions of these differentially expressed transcription factors, a heatmap of the expression of 50 of these factors was constructed using their Log2FPKM values (Figure 5D). The results showed that the expression level of eleven differentially expressed transcription factors (ASL2, SINS-LIKE5, HAC5, uncharacterized protein LOC106327012, two EIN3/EILs, BnaC05g00840D, At2g17140, TGA3, uncharacterized protein LOC106367835, ASIL2, BRM) have a decreasing trend from CK to 12 °C, 8 °C, and 4 °C. Then, 50 transcription factors show an increased trend from CK to 12 °C, 8 °C, and 4 °C. Then, 50 transcription factors were classified via the transcription factor annotation file, and the results showed that the family of 50 transcription factors contains four Pseudo ARR-B transcription factor family member genes, four C3H transcription factor family member genes, three AP2/ERF transcription factor family member genes, three bZIP transcription factor family member genes, and others.

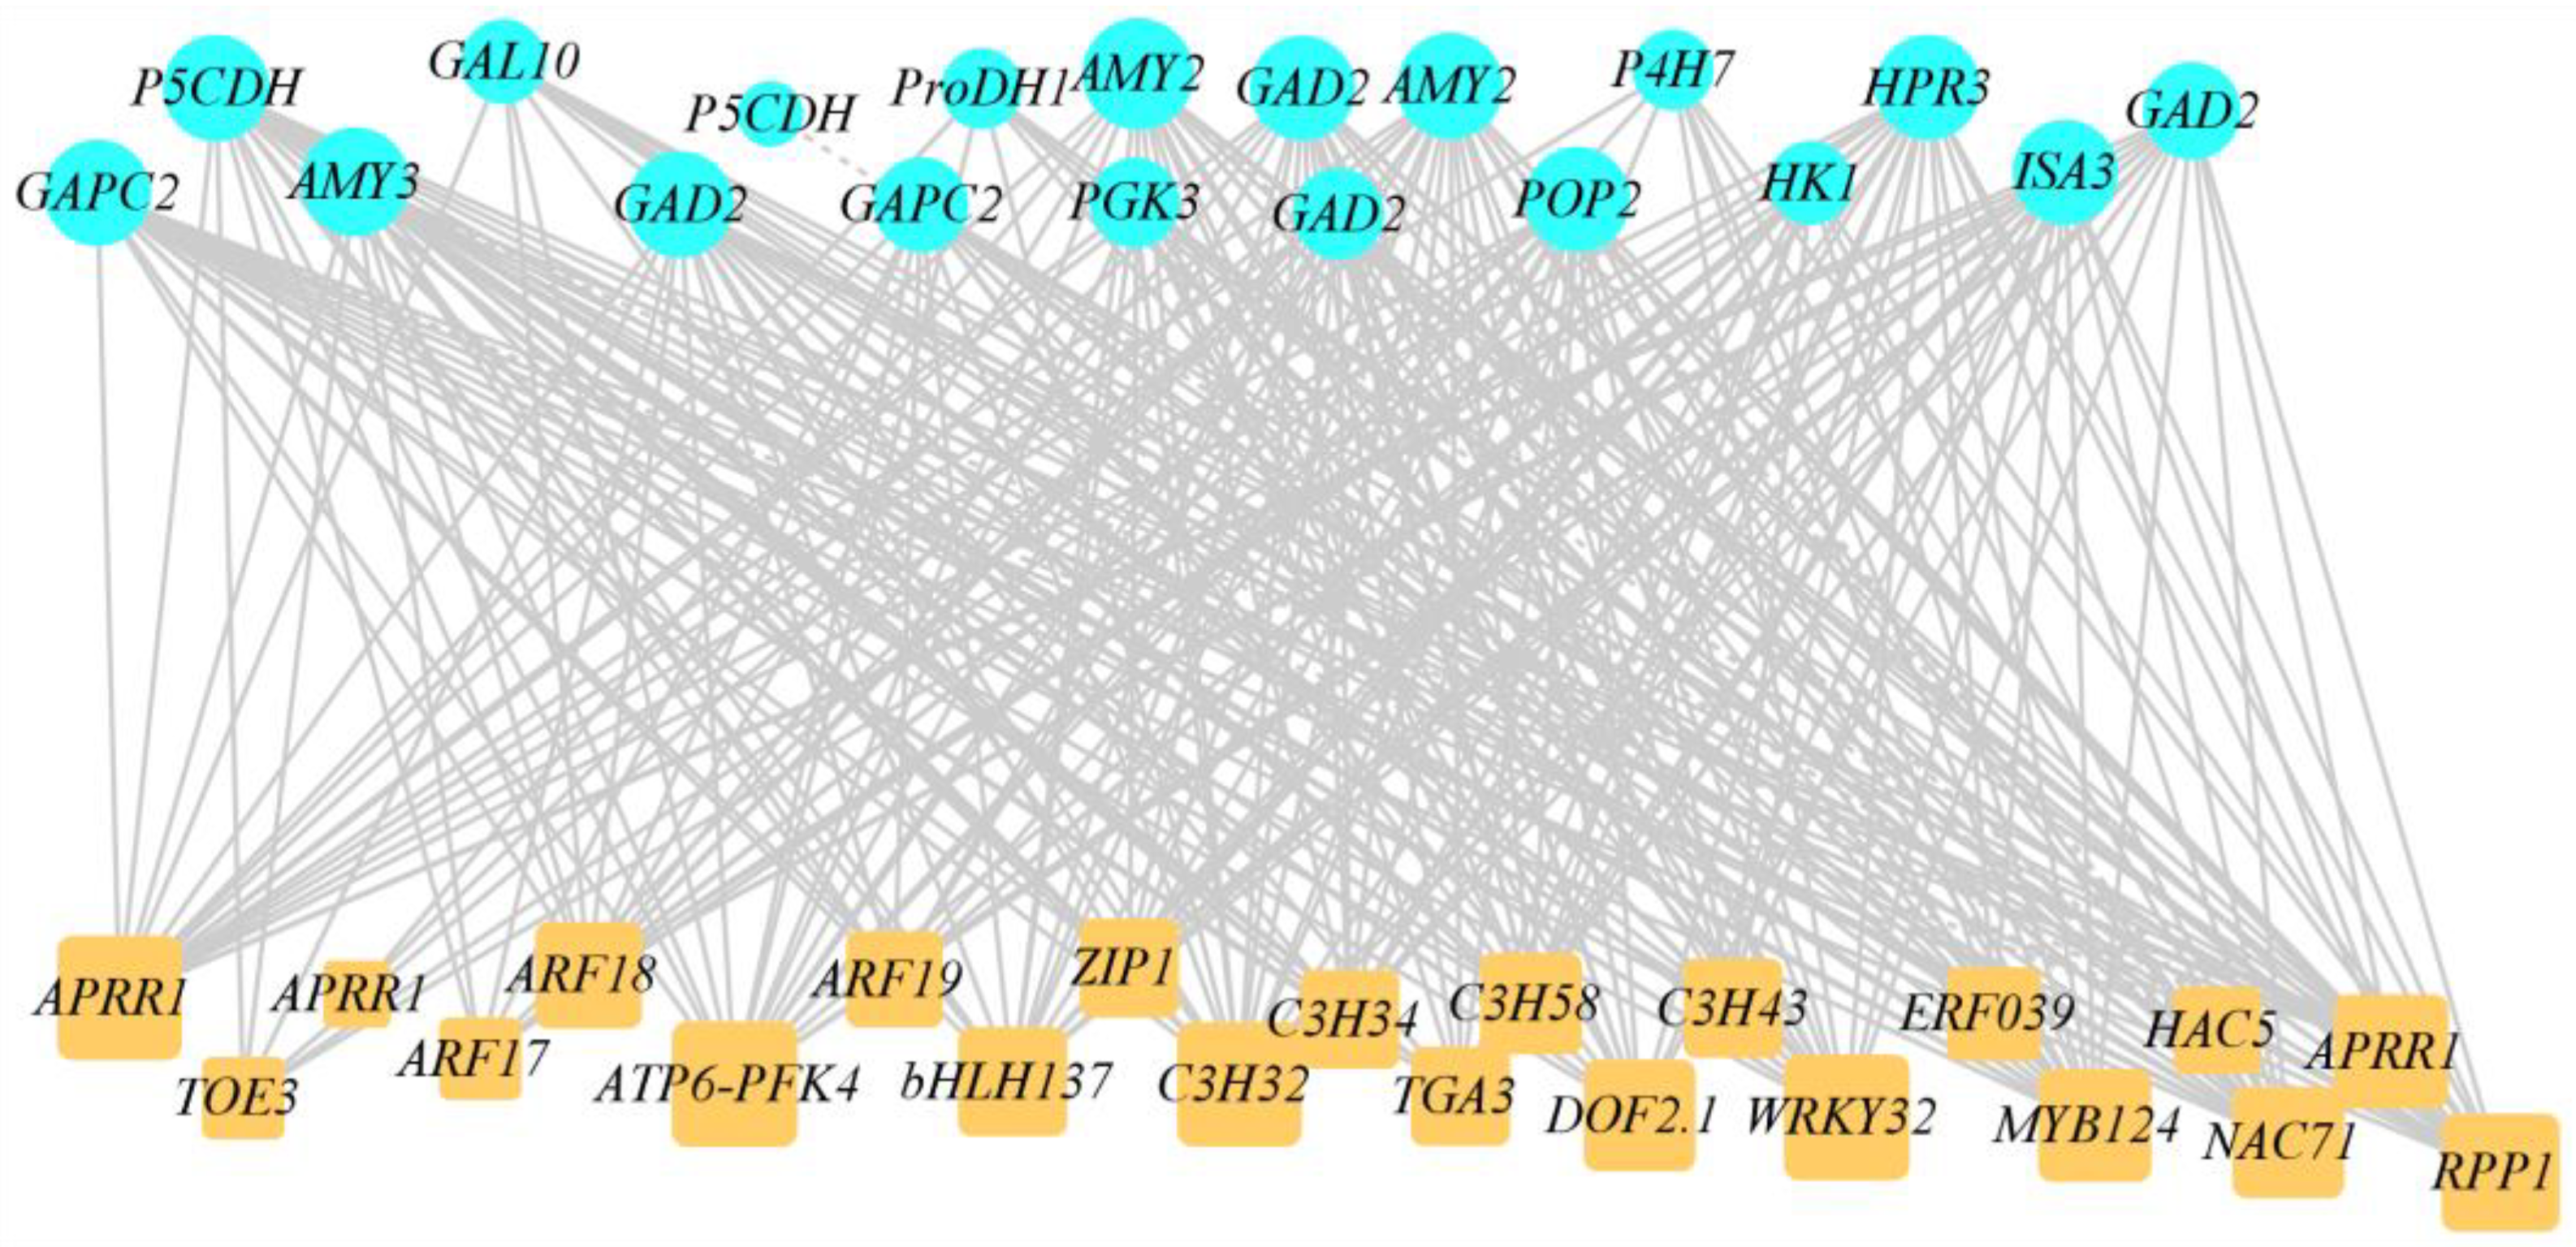
2.6. Joint Analysis of Low-Temperature-Related Differentially Expressed Transcription Factors and DEGs

To further accurately identify low-temperature-related DEGs and differentially expressed transcription factors, the interaction regulatory network between DEGs and differentially expressed transcription factors was analyzed using weighted gene correlations (Figure 6, Table S8). The results showed that nineteen DEGs showed a high correlation with low temperature, including GAD2, AMY2, POP2, GAL10, and others. Similarly, twenty-two differentially expressed transcription factors were obtained, including APRR1, WRKY32, TOE3, bHLH137, ARF17, MYB124, and others. We speculated that these twenty-two differentially expressed transcription factors may improve the low-temperature resistance of plants and thus promote the polymorphic aggregation of sugar and proline in the pathway. We hypothesized that these twenty-two differentially expressed transcription factors may regulate specific genes, thereby enhancing the synthetic accumulation of sugar and proline in the pathway and potentially improving low-temperature resistance. The twenty-two differentially expressed transcription factors contain four ARR-B transcription factor family member genes, four C3H transcription factor family member genes, two B3-ARF transcription factor family member genes, and others.

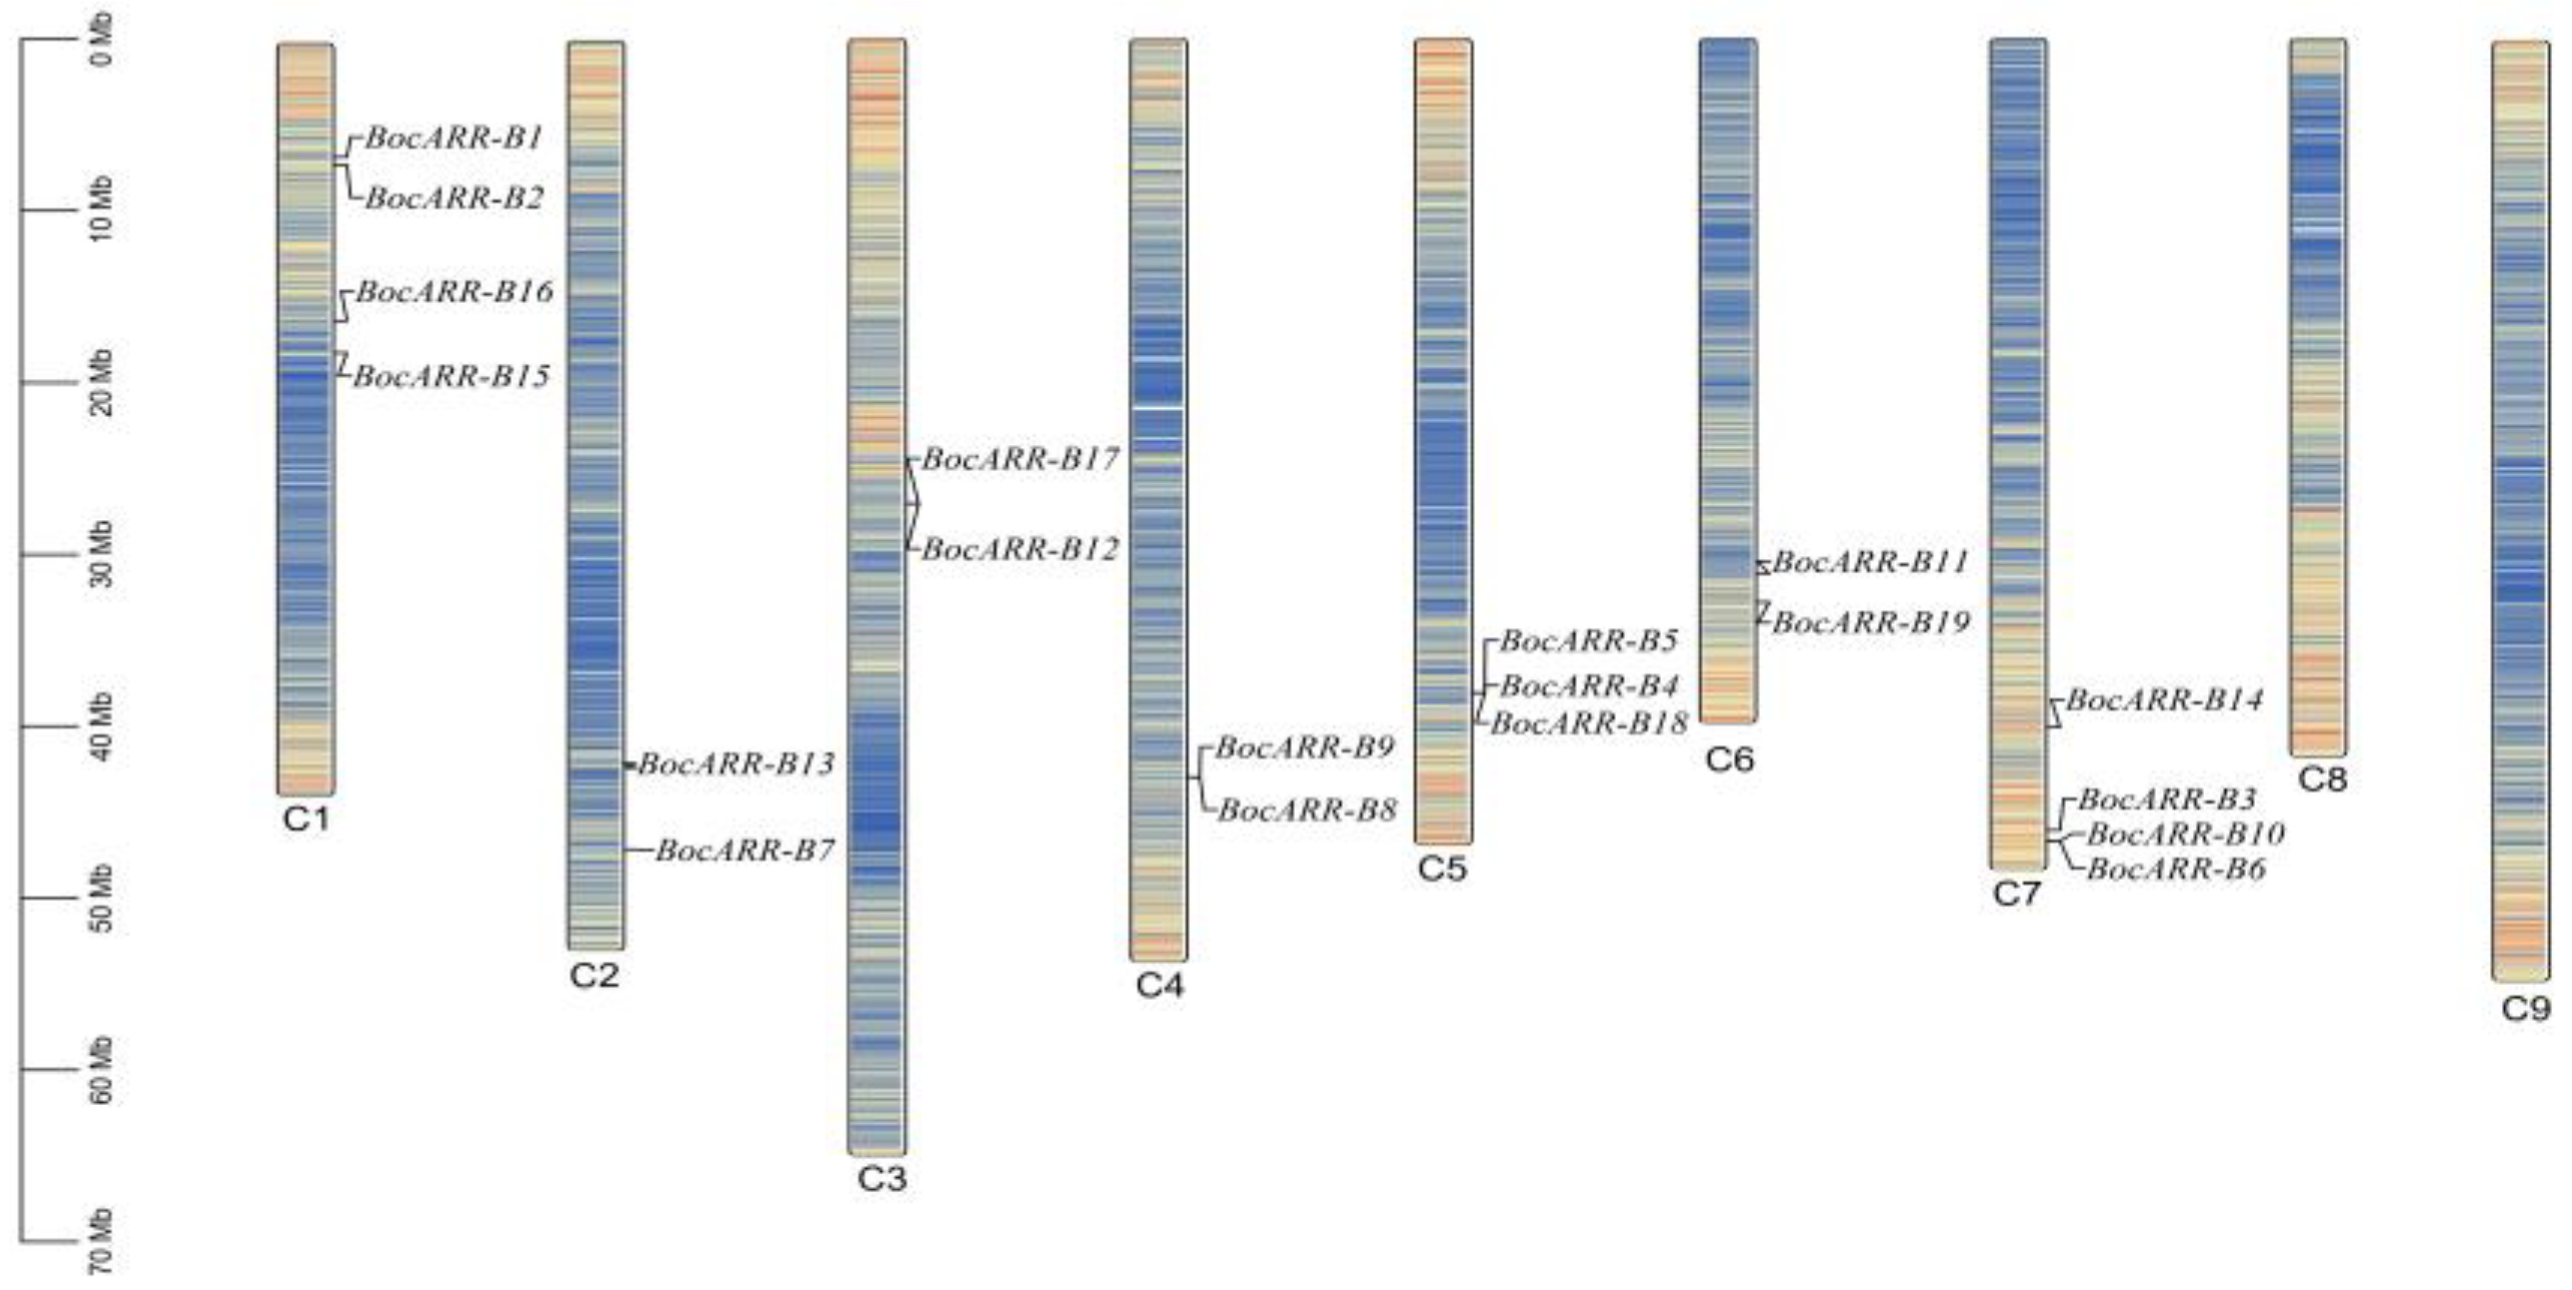
2.7. BocARR-B Transcription Factor Gene Family Member Identification and Chromosomal Localization

In consideration of the high correlation of many ARR-B transcription factor family member genes with low-temperature stress, we identified and analyzed the BocARR-B transcription factor family in kohlrabi based on transcriptomes. A total of 19 putative ARR-B family candidate genes were obtained by confirming the conserved domain (PF00072 and PF00249) of ARR-Bs. Because some genes have similar sequences, we further performed multiple sequence alignments using the DNAMAN software. The result showed that these genes are unique. To distinguish between ARR-B transcription factor family member genes, in this study, nineteen BocARR-Bs were named according to their order on the chromosomes. The length of BocARR-B proteins ranged from 376 to 680 amino acids (aa), and the molecular weight (MW) ranged from 41,499 Da to 74,038 Da. The theoretical isoelectric point (pI) ranged from 5.08 to 8.87. The aliphatic index of BocARR-B proteins ranged from 69.4 to 89.15. The length of the CDS sequences and other details of the 19 BocARR-B genes are listed in Table 1.
Nineteen BocARR-B genes were found to the chromosome (C) of kohlrabi. The results showed that nineteen BocARR-B genes were randomly distributed on the different chromosomes of kohlrabi, and no genes were distributed on the C8 and C9 (Figure 7). Chromosome 1 contained four genes (BocARR-B1, BocARR-B2, BocARR-B3, and BocARR-B4). Equally, chromosome 7 harbored four genes (BocARR-B16, BocARR-B17, BocARR-B18, and BocARR-B19). Chromosomes 2, 3, 4, and 6 harbored only two genes. Chromosome 5 contained three genes. This result highlights the irregular distribution of BocARR-B genes on the chromosomes.

2.8. Gene Structure and Conserved Motif Analysis of BocARR-B Transcription Factor Genes Family

To comprehensively comprehend the conserved traits of the BocARR-B protein and analyze its evolutionary variances, motif analysis was performed utilizing MEME, resulting in the identification of four types of conserved motifs (Figure 8D). Nineteen BocARR-B transcription factor gene family members were divided into three groups that contain group Ⅰ (BocARR-B18, BocARR-B19, BocARR-B16, BocARR-B3, BocARR-B4, BocARR-B7, BocARR-B8, BocARR-B11, BocARR-B13, BocARR-B12, BocARR-B6, BocARR-B5, BocARR-B15, and BocARR-B14), group Ⅱ (BocARR-B17, BocARR-B9, and BocARR-B10,) and group Ⅲ (BocARR-B2, and BocARR-B1) (Figure 8A). The results of motif analysis showed that motif 1 and motif 3 were present in all BocARR-B members, while motif 2 was absent in group Ⅲ, and motif 4 was absent in group Ⅰ in certain BocARR-B members (BocARR-B5, BocARR-B15, and BocARR-B14) (Figure 8B). An analysis of the conserved structural domains of the 19 BocARR-B proteins indicated that all BocARR-B proteins exhibited highly conserved structural domains. The distribution of the REC_type_ARR-like domain, myb_SHAQKYF domain, PLN03162 superfamily domain, and HFD_SF superfamily domain are shown in Figure 8C.

2.9. Evolutionary Analysis of BocARR-B Transcription Factor Gene Family

To investigate the phylogenetic relationship of ARR-B proteins in kohlrabi, we generated a phylogenetic tree using the maximum likelihood (ML) method based on the multiple sequence alignment of 15 ARR-B proteins from Arabidopsis and 19 ARR-B proteins from kohlrabi (Figure 9). All the ARR-B genes were clustered into 11 groups named I–XI. Group I, group II, group III, group IV, group V, and group VI contain only ARR-B genes from Arabidopsis. All the ARR-B genes were clustered into 11 groups named I–XI. Group VII and group X contain only ARR-B genes from kohlrabi. The ARR-B genes from kohlrabi were clustered into group IX, group X, and group XI.

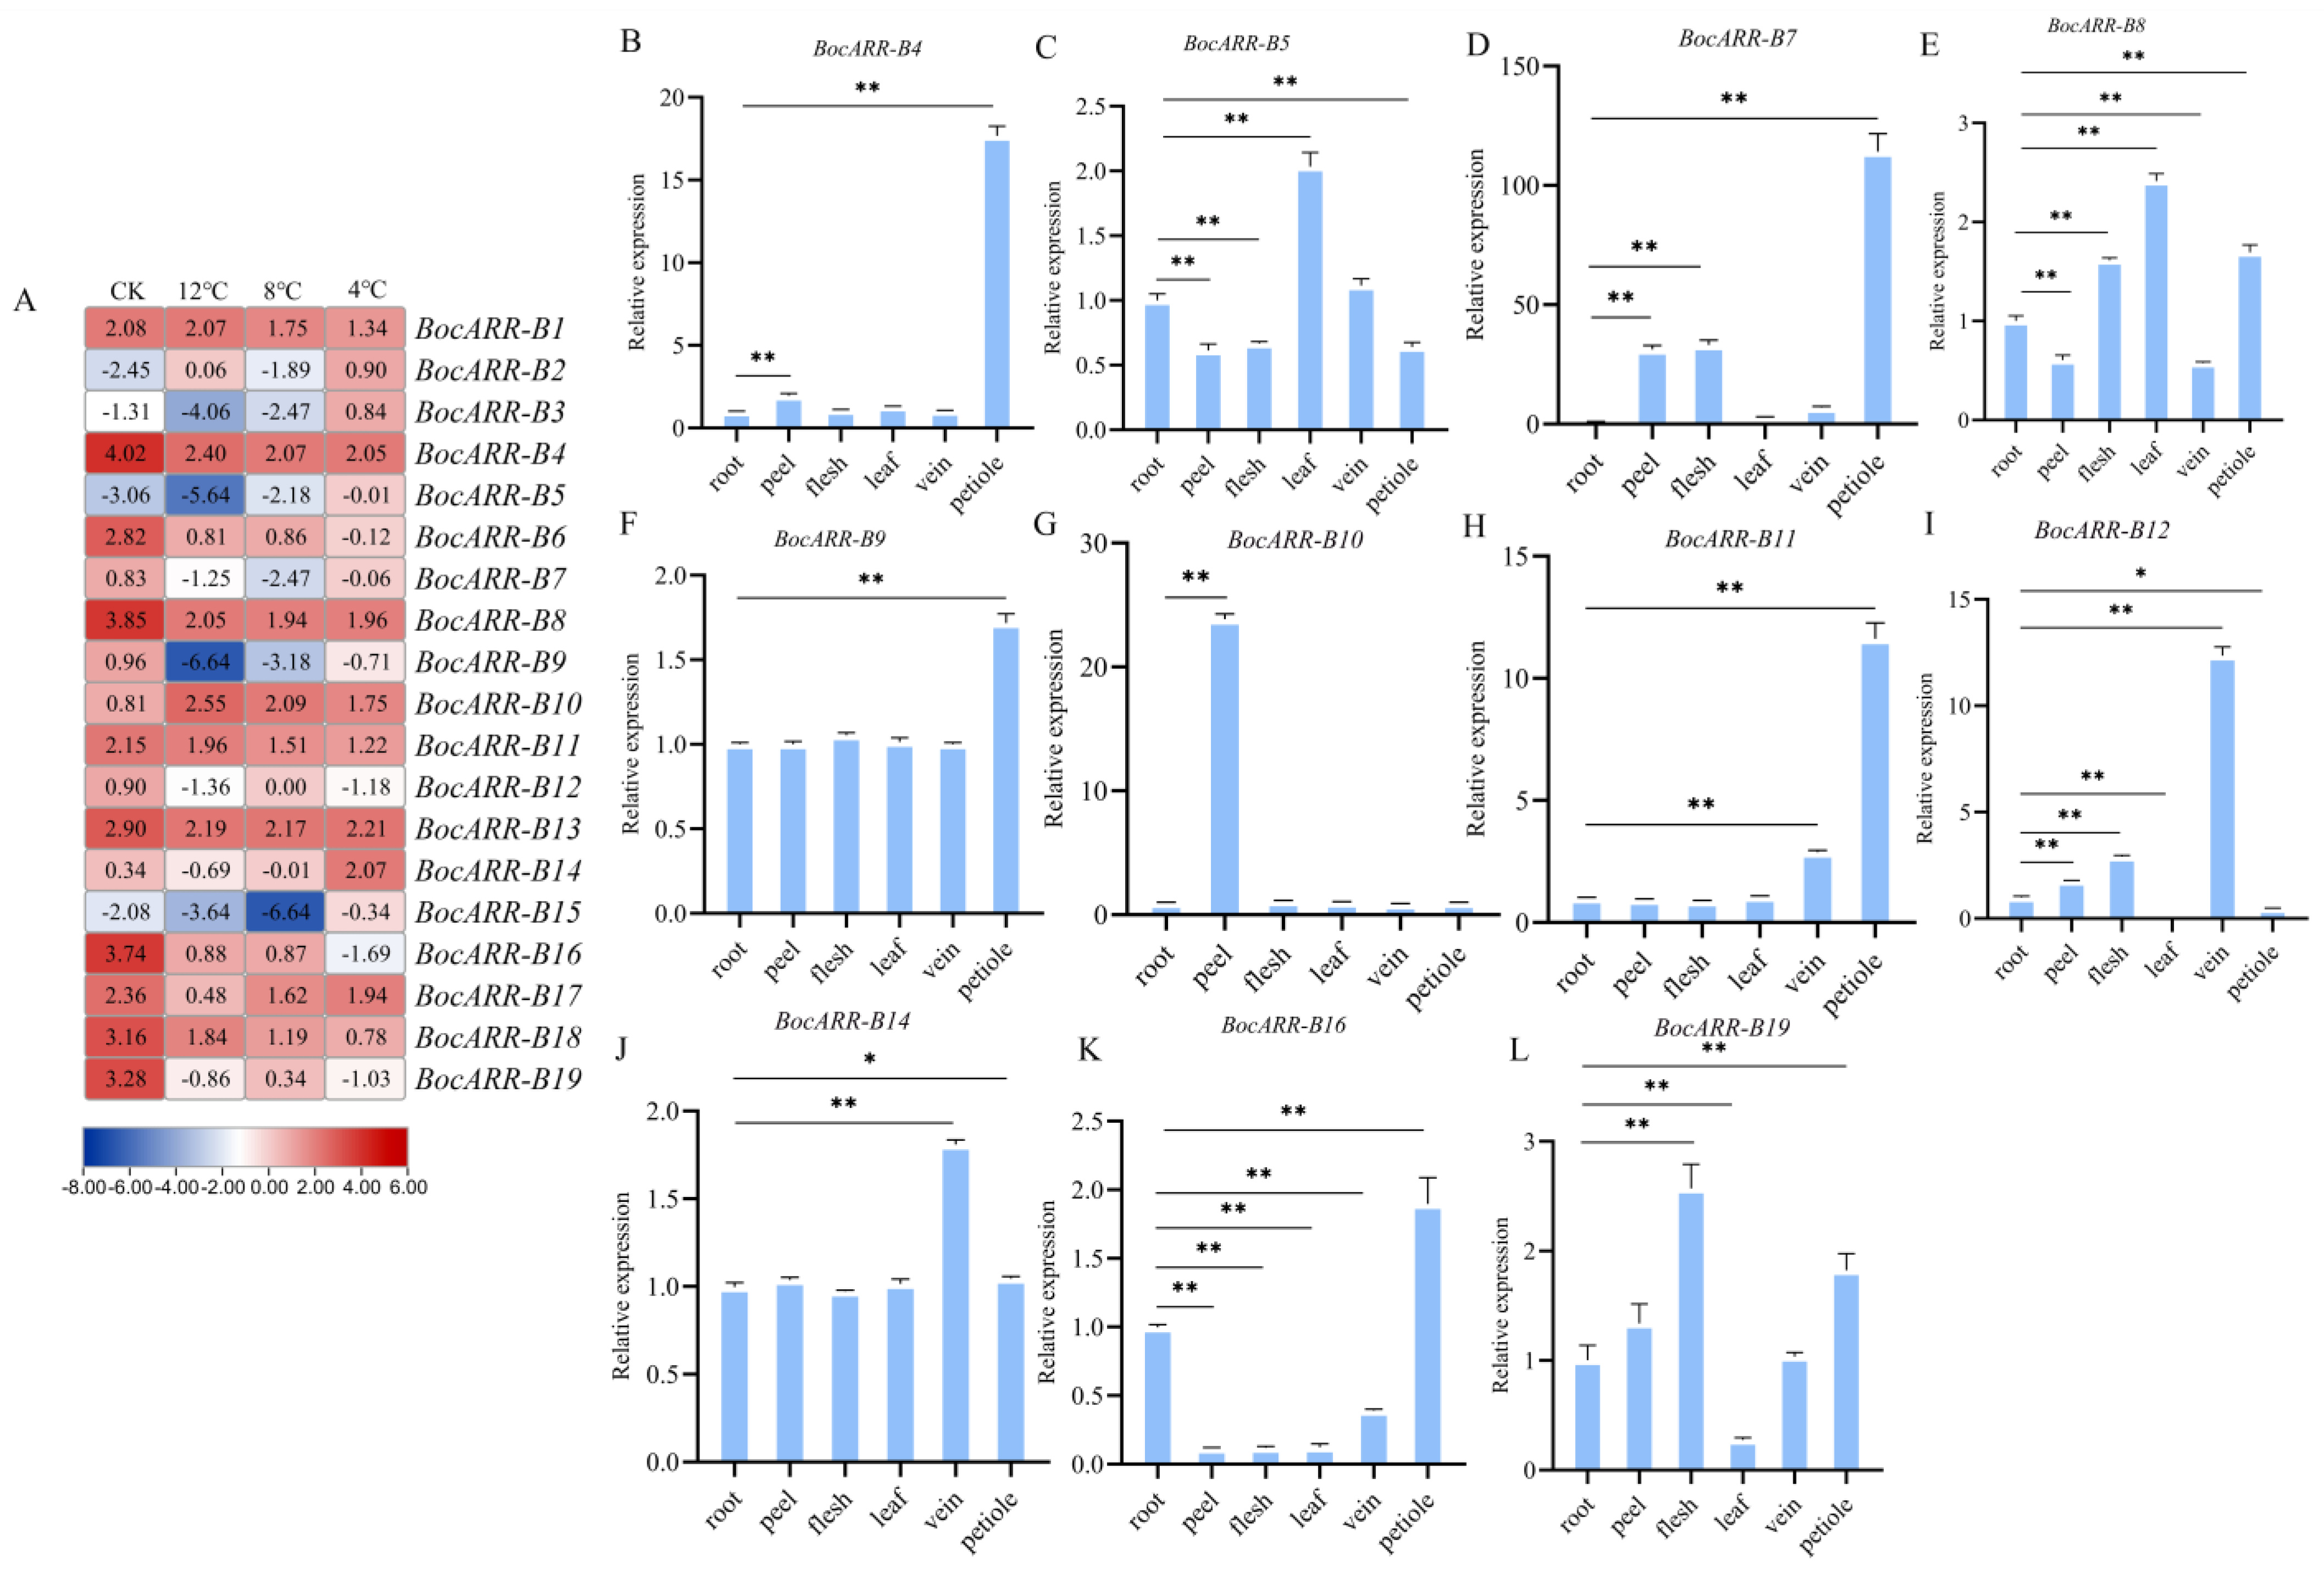
2.10. Expression Analysis of BocARR-Bs via RT-qPCR and RNA Sequencing in Different Tissues and under Low-Temperature Stress

To identify the expression profile of BocARR-Bs in kohlrabi during low-temperature stress, the relative expression levels of these 19 BocARR-B genes were also analyzed; the results are shown in Figure 10A. Four genes (BocARR-B1, BocARR-B4, BocARR-B16, and BocARR-B18) showed a significant downward trend under low-temperature stress. Because the expression levels of the eight genes were too low to be detected via qRT-PCR, we obtained the relative expression levels of 11 BocARR-Bs in different tissues (Figure 10B–L). The primers used are listed in Table S9. Eleven BocARR-Bs showed relatively lower expression levels in their roots. Two BocARR-B genes (BocARR-B7 and BocARR-B10) showed relatively higher expression levels in their peels. Similarly, BocARR-B7 and BocARR-B12 showed relatively higher expression levels in their flesh, while BocARR-B7 also showed relatively higher expression levels in its leaves. Three BocARR-B genes (BocARR-B7, BocARR-B11, and BocARR-B12) showed relatively higher expression levels in their veins. Three BocARR-B genes (BocARR-B4, BocARR-B7, and BocARR-B11) showed relatively higher expression levels in their petioles.

3. Discussion

Plant response to abiotic stress refers to the interaction of different stress-sensitive mechanisms [32]. The ability of plants to resist abiotic stress is related to the level of the antioxidant system [33]. The metabolism of ROS (active oxygen) was found to be limited in plants that contain H2O2, OH, -OH, and O2− at low temperatures [34,35,36]. Bychkov et al. [37] found that an increase in malondialdehyde could reduce the development of oxidative stress in Arabidopsis under hypothermic conditions (4 °C, 5 days). Garratt et al. [38] theorized that the primary enzyme involved in this antioxidant effect was SOD, which could scavenge the O2− and simultaneously produce H2O2. Then, CAT degrades excess H2O2 to prevent peroxidative damage. Samarina et al. [39] discovered that the soluble sugar content and proline content were elevated in Caucasian tea under low-temperature stress. At the same time, many studies showed that in the process of resisting plant cold stress, proline can not only act as an osmoregulator but can also protect protein molecules and scavenge reactive oxygen in plants [40,41,42]. We found that the trends for CAT activity, SOD activity, MDA content, proline content, and soluble sugar content measured at different low-temperature conditions were basically consistent with the above results. In addition, plants can produce more soluble proteins to protect against damage under low-temperature stress. We also determined the content of soluble proteins, and the results showed that the content of soluble proteins increased with decreasing temperatures.
Positive/negative regulators play important roles in plants at low temperatures. The molecular mechanisms underlying the response to chilling stress are intricate and warrant further exploration [43,44]. Cui et al. [45] found that soluble sugar could enhance the low-temperature stress tolerance of sweet potato roots. At the same time, many studies showed that sucrose may function as a signaling molecule to interact with reactive oxygen species (ROS) and modulate the stress tolerance in plants [46,47]. To explore the changes in the regulatory mechanisms of DEG under low-temperature stress, we constructed a genetic metabolite network based on the glycolysis/gluconeogenesis and glucose metabolism pathway that included glyoxylate and dicarboxylate metabolism pathway and the butanoate metabolism pathway. By analyzing the regulatory DEG changes in the metabolic pathways, we obtained sixty-six DEGs related to low-temperature responses in kohlrabi seedlings.
Co-expression network analysis is an effective way to understand transcriptomic datasets better [48]. To date, co-expression network analysis has been used to screen numerous novel transcription factors and structural candidate genes in turnip [49], Arabidopsis [50], rice [51,52,53], switchgrass [54,55,56], and poplar [57,58]. Using co-expression network analysis of differentially expressed transcription factors and DEGs associated with biochemical indicator changes; we obtained twenty-two differentially expressed transcription factors, which contain APRR1, WRKY32, TOE3, bHLH137, ARF17, MYB124, and others. We hypothesized that these twenty-two differentially expressed transcription factors may regulate specific genes, thereby enhancing the synthetic accumulation of sugar and proline in the pathway, potentially improving low-temperature resistance.
The ARR-B transcription factor gene family is one of the important plant-specific transcription factor families, which play an important role in abiotic stress resistance and plant development [25,59]. Previous studies have shown that the ARR-B transcription factor family plays a key role in cold stress responses in rubber trees and paper mulberries [60,61]. Jeon et al. [27] reported that type-B ARRs are able to regulate type-A ARRs, improving the cold tolerance of crops. Kang et al. [28] reported that cold stress resistance can be improved by the overexpression of ARR 22. Wang et al. [30] found that the relative expression levels of SlARR-B3, SlARR-B4, SlARR-B5, SlARR-B6, SlARR-B8, and SlARR-B9 in tomatoes peaked after a 9 h cold treatment. However, similar studies have not been conducted regarding the BocARR-B family in kohlrabi. In this study, using transcriptome data, we identified 19 BocARR-B transcription factor gene family members in kohlrabi. A low-temperature-stress-induced expression analysis of four genes (BocARR-B1, BocARR-B4, BocARR-B16, and BocARR-B18) showed a significant downtrend and demonstrated that some BocARR-B genes play key roles in indirect, positive responses to environmental stress. Specific expression analysis of BocARR-Bs in six different tissues (roots, peels, flesh, leaves, veins, and petioles) showed that eleven BocARR-Bs had relatively lower expression levels in their roots, while levels were higher in their veins and petioles. BocARR-B7 showed relatively higher expression levels in its peels, flesh, leaves, veins, and petioles. Based on the analysis of BocARR-B’s expression characteristics, it is evident that BocARR-B genes play a crucial role in plant response to low-temperature stress, the effectiveness of which is contingent upon the specific response site, as well as the timing and severity of the stress.

4. Materials and Methods

4.1. Plant Material and Low-Temperature Stress Treatment

The green kohlrabi variety “C8” was used as the research material. It was supplied by the Brassica vegetable crop breeding team at the Academy of Agriculture and Forestry Sciences of Qinghai University. Kohlrabi seeds were sowed in soil and cultivated in a light incubator (Thermo Fisher Scientific, Waltham, MA, USA) at 22 ± 2 °C, under long-day specific conditions, a 12h light/12h dark cycle, 70% relative humidity, and a light intensity of 120 mmol m−2 s−1. After 35 days, growing seedlings were treated at different temperature points (CK (22 °C), 12 °C, 8 °C, 4 °C). Samples were collected on day 7, with three biological replicates for each treatment. Twelve individual plants were considered equivalent to one biological replicate under low-temperature conditions. The third and fourth leaves from top to bottom were sampled. Then, the samples were either used immediately or shock-frozen in liquid nitrogen and stored at −80 °C.

4.2. Measurement of Biochemical Indicators

To measure the biochemical indicators of kohlrabi at low temperature, a biochemical detection kit (catalase (CAT) activity detection kit (BC0205), superoxide dismutase (SOD) activity detection kit (BC0175), malondialdehyde (MDA) content detection kit (BC0025), proline (Pro) content detection kit (BC0295), soluble protein (SP) content detection kit (BC3185), soluble sugar (SS) content detection kit (BC0035)) were used. All biochemical indicator detection kits were manufactured by Beijing Solarbio Science and Technology Co., Ltd. (Beijing, China). The operation process of specific indicators refers to the instructions of the corresponding indicators of the kit. The statistical analysis of biochemical indicators was performed, and bar graphs were plotted.

4.3. Transcriptomic Analysis of Kohlrabi Leaves under Low-Temperature Stress Treatment

Leaves from the control and kohlrabi under low-temperature stress were collected. Total RNA was extracted, cDNA synthesis was carried out, and a cDNA library was constructed by Wuhan Metware Biotechnology Co., Ltd. (Wuhan, China). The obtained clean reads were used to assemble the reference sequence for further analysis by Trinity software (http://trinityrnaseq.sourceforge.net/, accessed on 18 July 2024) [62]. The unigene sequence was annotated using the BLAST search tool in the KEGG, NR, Swiss-Prot, GO, KOG, Trembl, and Pfam databases, respectively. The longest sequence obtained via Corset (https://code.google.com/p/corset-project/, accessed on 18 July 2024) hierarchical clustering was used as a unigene for analysis. The dataset was uploaded to the NCBI Short Read Archive (SRA) under the accession number PRJNA1051351 (SRR27183516, SRR27183515, SRR27183512) and PRJNA1131915 (SRR29752385, SRR29752384, SRR29752383, SRR29752382, SRR29752381, SRR29752380, SRR29752379, SRR29752378, SRR29752377).

4.4. Availability Validation of RNA-Sequencing

In order to validate the accuracy of RNA-Seq data of kohlrabi under low-temperature stress, ten DEGs were casually selected for quantitative real-time PCR (RT-qPCR) analysis. The samples were tested to verify that each sample contained three biological replicates. The primers used for RT-qPCR were designed by Primer Premier 5 software; the primers are shown in Table S10.

4.5. Co-Expression Network Analysis of Discriminated Low-Temperature-Related DEGs

In order to screen DEGs, we performed differential analyses. Genes with a false discovery rate (FDR) < 0.05 and |log2Fold| ≥ 1 were considered differentially expressed. Co-expression network analysis was generated by FPKM values of DEGs and six low-temperature-associated biochemical indicators using R package 3.16.5 [63] based on Pearson’s correlation coefficient. The qualification for the co-expressed genes was |r| > 0.8 and p < 0.05. The co-expression network in Cytoscape v3.8.0 was used to visualize the results [64].

4.6. Identification and Chromosomal Distribution of BocARR-B Transcription Factor Family Members in Kohlrabi

To identify all ARR-B genes in kohlrabi, the transcriptome unigene annotation file was used as a query [65]. ARR-B, as keywords, were screened in the KEGG files. The NCBI for online BLAST analyzed the CDS sequences that were searched. Then, in order to eliminate false-positive sequences, the analyzed cluster and homologous sequences were aligned using the DNAMAN 9.0 software. The conserved domain of the BocARR-B protein was identified using the NCBI-CDD database search tool. Interpro (http://www.ebi.ac.uk/interpro/, accessed on 29 June 2024) was used to confirm that all ARR-B proteins contained, at a minimum, the PF00072 and PF 00249 domains [66]. Full-length CDS sequences were discovered for 19 BocARR-Bs. The predicted physicochemical parameters of the BocARR-B proteins were obtained from ProtParam (http://web.expasy.org/protparam/, accessed on 1 July 2024). The conserved motifs of 19 BocARR-B protein sequences were predicted using the online tool MEME (http://meme-suite.org/meme/tools/meme, accessed on 2 July 2024) [67]. The chromosomal locations of 19 BocARR-B genes in kohlrabi were retrieved from the Brassica oleracea genome database, which visualized the chromosomal locations and the conserved motifs of 19 BocARR-B genes using Tbtools software V1.098 [68].

4.7. Phylogenetic Analysis of BocARR-B Transcription Factor Family

Using the Arabidopsis Information Resource database (https://www.arabidopsis.org, accessed on 3 July 2024), the ARR-B amino acid sequences of A. thaliana were downloaded. The protein sequences of 19 BocARR-Bs from kohlrabi and 15 AtARR-Bs from A. thaliana were aligned with a phylogenetic tree constructed by MEGA 11 using the neighbor-joining method (with 1000 bootstrap replicates) [69,70]. By the online Interactive Tree Of Life (http://itol.embl.de/upload.cgi, accessed on 3 July 2024), the phylogenetic trees were visualized and enhanced.

4.8. Quantitative Real-Time PCR (RT-qPCR)

RNA extraction was performed using a Tiangen RNAprep plant kit (Tiangen, Beijing, China); cDNA synthesis was performed using a PrimeScriptTM RT reagent Kit (TaKaRa, Tokyo, Japan), and the cDNA concentration was diluted to 200 ng/μL using RNase free water. The RT-qPCR reaction was performed using a TB Green Premix Ex Taq II Kit (Tli RNaseH Plus) (2X) (TaKaRa, Tokyo, Japan). In a 96-well plate, the RT-qPCR reaction (20 µL) was prepared with 10 µL of TB Green Premix Ex Taq II (Tli RNaseH Plus) (2X), 1 µL of cDNA, 7.4 µL of ddH2O, and 0.8 µL of each primer. The TIP4 gene was used as an internal control. Each biological replicate contained three technical replicates. The expression of genes was analyzed using the comparative CT method (2−ΔΔCt) [71]. Excel 97-2003 and the TBtools software were used for statistical analysis and plotted heatmaps.

5. Conclusions

In this study, ninety differentially expressed genes (DEGs) in kohlrabi were identified under low-temperature stress through metabolic pathway analysis, and fifty differentially expressed transcription factors were obtained via co-expression network analysis. Via a comprehensive analysis of differentially expressed transcription factors and DEGs associated with biochemical indicator changes, twenty-two differentially expressed transcription factors were obtained, including APRR1, WRKY32, TOE3, bHLH137, ARF17, MYB124, and so forth. Subsequently, 19 BocARR-B genes (named BocARR-B1-BocARR-B19) were analyzed, and these genes were distributed unevenly across the seven chromosomes. Four conserved motifs were detected, and all 19 BocARR-B genes were divided into three groups. A relative-expression-level analysis of BocARR-B in kohlrabi showed distinct specificity across different tissues, with their efficacy contingent upon the specific response site and the timing and severity of the stress. This study lays a foundation and provides new insights into the low-temperature resistance mechanism and response pathways of kohlrabi. In addition, this study provides a theoretical basis for the functional analysis of 19 BocARR-B transcription factor gene family members.

Supplementary Materials

The following supporting information can be downloaded at https://www.mdpi.com/article/10.3390/ijms25179261/s1.

Author Contributions

Methodology, software, validation, data curation, formal analysis, investigation, and writing—original draft preparation, S.B.; methodology, writing—original draft preparation, and supervision, D.S.; software, data curation, validation, and formal analysis, Q.Z.; resources, data curation, writing—original draft preparation, Q.L.; Conceptualization, methodology, writing—original draft preparation, writing—review and editing, and supervision, Y.R. All authors have read and agreed to the published version of the manuscript.

Funding

This research was funded by the project of central guiding the local science and technology development funding (2024ZY010).

Data Availability Statement

The dataset is available from the NCBI Short Read Archive (SRA) under accession numbers PRJNA1051351 and PRJNA1131915.

Acknowledgments

The authors would like to thank Wuhan Metware Biotechnology Co., Ltd. for transcript sequencing.

Conflicts of Interest

The authors declare no conflicts of interest.

References

  1. Soltan, H.A.H.; Osman, S.A.M.; Tantawy, I.A.A. The Role of New Transformants Phosphate Bio-Stimulates (PBS) Bacteria Inoculates on Growth. Yield and Quality of Kohlrabi Plants. J. Plant Sci. 2021, 12, 541–551. [Google Scholar] [CrossRef]
  2. Lim, T. Brassica oleracea (gongylodes group). In Edible Medicinal and Non Medicinal Plants; Springer: Dordrecht, The Netherlands, 2015; pp. 768–776. [Google Scholar] [CrossRef]
  3. Iradukunda, M.; Read, P.E. Influence of Fertilizer Rate on Swollen Stem Formation (“Bulbing”) and Vitamin C Content in Different Kohlrabi Cultivars. Ph.D. Thesis, University of Nebraska, Lincoln, NE, USA, 2022. [Google Scholar]
  4. Jahangir, M.; Kim, H.K.; Choi, Y.H.; Verpoorte, R. Health-affecting compounds in Brassicaceae. Compr. Rev. Food Sci. Food Saf. 2009, 8, 31–43. [Google Scholar] [CrossRef]
  5. Park, W.T.; Kim, J.K.; Park, S.; Lee, S.-W.; Li, X.; Kim, Y.B.; Uddin, M.R.; Park, N.I.; Kim, S.-J.; Park, S.U. Metabolic profiling of glucosinolates, anthocyanins, carotenoids, and other secondary metabolites in kohlrabi (Brassica oleracea var. gongylodes). J. Agric. Food Chem. 2012, 60, 8111–8116. [Google Scholar] [CrossRef] [PubMed]
  6. Zhang, Y.; Hu, Z.; Zhu, M.; Zhu, Z.; Wang, Z.; Tian, S.; Chen, G. Anthocyanin accumulation and molecular analysis of correlated genes in purple kohlrabi (Brassica oleracea var. gongylodes L.). J. Agric. Food Chem. 2015, 63, 4160–4169. [Google Scholar] [CrossRef]
  7. Prajapati, R.; Seong, S.H.; Kim, H.R.; Jung, H.A.; Choi, J.S. Isolation and Identification of Bioactive Compounds from the Tuber of Brassica oleracea var. gongylodes. Nat. Prod. Sci. 2020, 26, 214–220. [Google Scholar] [CrossRef]
  8. Golob, A.; Novak, T.; Marši’c, N.K.; Šircelj, H.; Stibilj, V.; Jerše, A.; Kroflič, A.; Germ, M. Biofortification with selenium and iodine changes morphological properties of Brassica oleracea L. var. gongylodes) and increases their contents in tubers. Plant Physiol. Biochem. 2020, 150, 234–243. [Google Scholar] [CrossRef]
  9. Sanghera, G.S.; Wani, S.H.; Hussain, W.; Singh, N.B. Engineering cold stress tolerance in crop plants. Curr. Genomics. 2011, 12, 30–43. [Google Scholar] [CrossRef]
  10. Jeon, J.; Kim, J. Cold stress signaling networks in Arabidopsis. J. Plant Biol. 2013, 56, 69–76. [Google Scholar] [CrossRef]
  11. Lyons, J.M. Chilling injury in plants. Ann. Rev. Plant Physiol. 1973, 24, 445–660. [Google Scholar] [CrossRef]
  12. Jouyban, Z.; Hasanzade, R.; Sharafi, S. Chilling stress in plants. Int. J. Agric. Crop Sci. 2013, 5, 2961–2968. [Google Scholar]
  13. Huang, B.-L.; Li, X.; Liu, P.; Ma, L.; Wu, W.; Zhang, X.; Li, Z.; Huang, B. Transcriptomic analysis of Eruca vesicaria subs. sativa lines with contrasting tolerance to polyethylene glycol-simulated drought stress. BMC Plant Biol. 2019, 19, 419. [Google Scholar] [CrossRef] [PubMed]
  14. Tang, X.; Sun, F.; Zhang, N.; Rana, B.B.; Kharel, R.; Luo, P.; Si, H. RNA-seq provides insights into potato deubiquitinase responses to drought stress in seedling stage. Front. Plant Sci. 2023, 14, 1268448. [Google Scholar] [CrossRef] [PubMed]
  15. Li, X.Y.; Wang, Y.; Dai, Y.; He, Y.; Li, C.X.; Mao, P.; Ma, X.R. The transcription factors of tall fescue in response to temperature stress. Plant Biol. J. 2021, 23, 89–99. [Google Scholar] [CrossRef]
  16. Dai, X.; Xu, Y.; Ma, Q.; Xu, W.; Wang, T.; Xue, Y.; Chong, K. Overexpression of an R1R2R3 MYB gene, OsMYB3R-2, increases tolerance to freezing, drought, and salt stress in transgenic Arabidopsis. Plant Physiol. 2007, 143, 1739–1751. [Google Scholar] [CrossRef]
  17. Yang, X.; Zhao, T.; Rao, P.; Gao, K.; Yang, X.; Chen, Z.; An, X. Transcriptome profiling of Populus tomentosa under cold stress. Ind. Crops Prod. 2019, 135, 283–293. [Google Scholar] [CrossRef]
  18. Fiehn, O. Metabolomics—The link between genotypes and phenotypes. Plant Mol. Biol. 2002, 48, 155–171. [Google Scholar] [CrossRef]
  19. Töpfer, N.; Kleessen, S.; Nikoloski, Z. Integration of metabolomics data into metabolic networks. Front. Plant Sci. 2015, 6, 49. [Google Scholar] [CrossRef]
  20. Thomashow, M.F. Plant cold acclimation: Freezing tolerance genes and regulatory mechanisms. Annu. Rev. Plant Physiol. Plant Mol. Biol. 1999, 50, 571–599. [Google Scholar] [CrossRef]
  21. Zhang, N.; Shi, J.; Zhao, H.; Jiang, J. Activation of small heat shock protein (SlHSP17.7) gene by cell wall invertase inhibitor (SlCIF1) gene involved in sugar metabolism in tomato. Gene 2018, 679, 90–99. [Google Scholar] [CrossRef]
  22. Zhu, J.K. Abiotic stress signaling and responses in plants. Cell 2016, 167, 313–324. [Google Scholar] [CrossRef]
  23. Kidokoro, S.; Yoneda, K.; Takasaki, H.; Takahashi, F.; Shinozaki, K.; Yamaguchi-Shinozaki, K. Different cold-signaling pathways function in the responses to rapid and gradual decreases in temperature. Plant Cell 2017, 29, 760–774. [Google Scholar] [CrossRef] [PubMed]
  24. Zhang, H.; Zhu, J.; Gong, Z.; Zhu, J.-K. Abiotic stress responses in plants. Nat. Rev. Genet. 2021, 23, 104–119. [Google Scholar] [CrossRef] [PubMed]
  25. Li, H.; Chen, R.; Chen, Z.; Lin, J.; Jin, X.; Ren, C.; Chen, Q.; Chen, F.; Yu, G.; Zhang, Y. The molecular characteristics of soybean ARR-B transcription factors. BIOCELL 2022, 46, 1575–1592. [Google Scholar] [CrossRef]
  26. Nguyen, K.H.; Ha, C.V.; Nishiyama, R.; Watanabe, Y.; Leyva-González, M.A. Arabidopsis type-B cytokinin response regulators ARR1, ARR10, and ARR12 negatively regulate plant responses to drought. Proc. Natl. Acad. Sci. USA 2016, 113, 3090–3095. [Google Scholar] [CrossRef]
  27. Jeon, J.; Kim, N.Y.; Kim, S.; Kang, N.Y.; Novák, O. A subset of cytokinin two-component signaling system plays a role in cold temperature stress response in Arabidopsis. J. Biol. Chem. 2010, 285, 23371–23386. [Google Scholar] [CrossRef]
  28. Kang, N.Y.; Chuloh, C.; Jungmook, K. Inducible expression of Arabidopsis Response Regulator 22 (ARR22), a type-C ARR, in transgenic Arabidopsis enhances drought and freezing tolerance. PLoS ONE 2013, 8, e79248. [Google Scholar] [CrossRef]
  29. Zeng, J.J.; Zhu, X.D.; Haider, M.S.; Wang, X.C.; Zhang, C.; Wang, C. Genome-Wide Identification and Analysis of the Type-B Authentic Response Regulator Gene Family in Peach (Prunus persica). Cytogenet. Genome Res. 2017, 151, 41–49. [Google Scholar] [CrossRef]
  30. Wang, J.; Xia, J.; Song, Q. Genome-wide identification, genomic organization and expression profiles of SlARR-B gene family in tomato. J. Appl. Genet. 2020, 61, 391–404. [Google Scholar] [CrossRef]
  31. Yue, C.; Chen, Q.; Hu, J.; Li, C.; Luo, L.; Zeng, L. Genome-Wide Identification and Characterization of GARP Transcription Factor Gene Family Members Reveal Their Diverse Functions in Tea Plant (Camellia sinensis). Front. Plant Sci. 2022, 13, 947072. [Google Scholar] [CrossRef]
  32. Ahmad, A.; Selim, M.M.; Alderfasi, A.A.; Afzal, M. Effect of Drought Stress on Mungbean (Vigna radiata L.) under Arid Climatic Conditions of Saudi Arabia. In Ecosystems and Sustainable Development X; WIT Press: Southampton, UK, 2015; pp. 185–193. [Google Scholar] [CrossRef]
  33. Ball, L.; Accotto, G.P.; Bechtold, U.; Creissen, G.; Funck, D.; Jimenez, A.; Kular, B.; Leyland, N.; Mejia-Carranza, J.; Reynolds, H.; et al. Evidence for a direct link between glutathione biosynthesis and stress defense gene expression in Arabidopsis. Plant Cell 2004, 16, 2448–2462. [Google Scholar] [CrossRef]
  34. Vranova, E.; Inze, D.; Van Breusegem, F. Signal transduction during oxidative stress. J. Exp. Bot. 2002, 53, 1227–1236. [Google Scholar] [CrossRef] [PubMed]
  35. Apel, K.; Hirt, H. Reactive oxygen species: Metabolism, oxidative stress, and signal transduction. Annu. Rev. Plant Biol. 2004, 55, 373–399. [Google Scholar] [CrossRef] [PubMed]
  36. Zalutskaya, Z.; Skryabina, U.S.; Ermilova, E.V. Generation of hydrogen peroxide and transcriptional regulation of antioxidant enzyme expression in Chlamydomonas reinhardtii under hypothermia. Russ. J. Plant Physiol. 2019, 66, 223–230. [Google Scholar] [CrossRef]
  37. Bychkov, I.A.; Kudryakova, N.V.; Kuznetsov, V.V.; Kusnetsov, V.V. Cold Stress Activates the Expression of Genes of the Chloroplast Transcription Apparatus in Arabidopsis thaliana Plants. Doklady. Biochem. Biophys. 2020, 494, 235–239. [Google Scholar] [CrossRef]
  38. Garratt, L.C.; Janagoudar, B.S.; Lowe, K.C.; Anthony, P.; Power, J.B.; Davey, M.R. Salinity tolerance and antioxidant status in cotton cultures. Free Radic. Biol. Med. 2002, 33, 502–511. [Google Scholar] [CrossRef]
  39. Samarina, L.S.; Malyukova, L.S.; Efremov, A.M.; Simonyan, T.A.; Matskiv, A.O.; Koninskaya, N.G.; Rakhmangulov, R.S.; Gvasaliya, M.V.; Malyarovskaya, V.I.; Ryndin, A.V.; et al. Physiological, biochemical and genetic responses of Caucasian tea (Camellia sinensis (L.) Kuntze) genotypes under cold and frost stress. PeerJ 2020, 8, e9787. [Google Scholar] [CrossRef]
  40. Rajendrakumar, C.S.V.; Reddy, B.V.B.; Reddy, A.R. Proline-protein interactions: Protection of structural and functional integrity of M4, lactate dehydrogenase. Biochem. Biophys. Res. Commun. 1994, 201, 957–963. [Google Scholar] [CrossRef]
  41. Anjum, F.; Rishi, V.; Ahmed, F. Compatibility of osmolytes with gibbs energy of stabilization of proteins. Biochim. Biophys. Acta 2000, 1476, 75–84. [Google Scholar] [CrossRef]
  42. Matysik, J.; Alia; Bhalu, B.; Mohanty, P. Molecular mechanisms of quenching of reaction oxygen species by proline under stress in plants. Curr. Sci. 2002, 82, 525–532. Available online: http://www.jstor.org/stable/24105959 (accessed on 13 July 2024).
  43. Jung, K.H.; An, G. Application of MapMan and RiceNet drives systematic analyses of the early heat stress transcriptome in rice seedlings. J. Plant Biol. 2012, 55, 436–449. [Google Scholar] [CrossRef]
  44. Vinocur, B.; Altman, A. Recent advances in engineering plant tolerance to abiotic stress: Achievements and limitations. Curr. Opin. Biotechnol. 2005, 16, 123–132. [Google Scholar] [CrossRef] [PubMed]
  45. Cui, P.; Li, Y.; Cui, C.; Huo, Y.; Lu, G.; Yang, H. Proteomic and metabolic profile analysis of low-temperature storage responses in Ipomoea batata Lam. tuberous roots. BMC Plant Biol. 2020, 20, 435. [Google Scholar] [CrossRef] [PubMed]
  46. Van Den Ende, W.; Valluru, R. Sucrose, sucrosyl oligosaccharides, and oxidative stress: Scavenging and salvaging? J. Exp. Bot. 2009, 60, 9–18. [Google Scholar] [CrossRef] [PubMed]
  47. Li, L.; Sheen, J. Dynamic and diverse sugar signaling. Curr. Opin. Plant Biol. 2016, 33, 116–125. [Google Scholar] [CrossRef]
  48. Rao, X.; Dixon, R.A. Co-expression networks for plant biology: Why and how. Acta Biochim. Biophys. Sin. 2019, 51, 981–988. [Google Scholar] [CrossRef]
  49. Ren, Y.; Han, R.; Ma, Y.; Li, X.; Deng, C.; Zhao, M.; Li, J.; Hou, Q.; Zhong, Q.; Shao, D. Transcriptomics Integrated with Metabolomics Unveil Carotenoids Accumulation and Correlated Gene Regulation in White and Yellow-Fleshed Turnip (Brassica rapa ssp. rapa). Genes 2022, 13, 953. [Google Scholar] [CrossRef]
  50. Hansen, B.O.; Vaid, N.; Musialak-Lange, M.; Janowski, M.; Mutwil, M. Elucidating gene function and function evolution through comparison of coexpression networks of plants. Front. Plant Sci. 2014, 5, 394. [Google Scholar] [CrossRef]
  51. Hirano, K.; Aya, K.; Morinaka, Y.; Nagamatsu, S.; Sato, Y.; Antonio, B.A.; Namiki, N. Survey of genes involved in rice secondary cell wall formation through a co-expression network. Plant Cell Physiol. 2013, 54, 1803–1821. [Google Scholar] [CrossRef]
  52. Chandran, A.K.N.; Jeong, H.Y.; Jung, K.-H.; Lee, C. Development of functional modules based on co-expression patterns for cell-wall biosynthesis related genes in rice. J. Plant Biol. 2016, 59, 1–15. [Google Scholar] [CrossRef]
  53. Hirano, K.; Kondo, M.; Aya, K.; Miyao, A.; Sato, Y.; Antonio, B.A.; Namiki, N. Identification of transcription factors involved in rice secondary cell wall formation. Plant Cell Physiol. 2013, 54, 1791–1802. [Google Scholar] [CrossRef]
  54. Rao, X.; Chen, X.; Shen, H.; Ma, Q.; Li, G.; Tang, Y.; Pena, M. Gene regulatory networks for lignin biosynthesis in switchgrass (Panicum virgatum). Plant Biotechnol. J. 2019, 17, 580–593. [Google Scholar] [CrossRef] [PubMed]
  55. Rao, X.; Shen, H.; Pattathil, S.; Hahn, M.G.; Gelineo-Albersheim, I.; Mohnen, D.; Pu, Y. Dynamic changes in transcriptome and cell wall composition underlying brassinosteroid-mediated lignification of switchgrass suspension cells. Biotechnol. Biofuels 2017, 10, 266. [Google Scholar] [CrossRef]
  56. Chen, X.; Ma, Q.; Rao, X.; Tang, Y.; Wang, Y.; Li, G.; Zhang, C. Genomescale identification of cell-wall-related genes in switchgrass through comparative genomics and computational analyses of transcriptomic data. Bioenergy Res. 2015, 9, 172–180. [Google Scholar] [CrossRef]
  57. Shi, R.; Wang, J.P.; Lin, Y.C.; Li, Q.; Sun, Y.H.; Chen, H.; Sederoff, R.R. Tissue and cell-type co-expression networks of transcription factors and wood component genes in Populus trichocarpa. Planta 2017, 245, 927–938. [Google Scholar] [CrossRef] [PubMed]
  58. Cai, B.; Li, C.-H.; Huang, J. Systematic identification of cell-wall related genes in Populus based on analysis of functional modules in co-expression network. PLoS ONE 2014, 9, e95176. [Google Scholar] [CrossRef] [PubMed]
  59. D’Agostino, I.B. Characterization of the response of the Arabidopsis response regulator gene family to cytokinin. Plant Physiol. 2000, 124, 1706–1717. [Google Scholar] [CrossRef]
  60. Gong, X.; Yan, B.; Hu, J.; Yang, C.; Li, Y.; Liu, J.; Liao, W. Transcriptome profiling of rubber tree (Hevea brasiliensis) discovers candidate regulators of the cold stress response. Genes. Genom. 2018, 40, 1181–1197. [Google Scholar] [CrossRef]
  61. Peng, X.; Wu, Q.; Teng, L.; Tang, F.; Pi, Z.; Shen, S. Transcriptional regulation of the paper mulberry under cold stress as revealed by a comprehensive analysis of transcription factors. BMC Plant Biol. 2015, 15, 108. [Google Scholar] [CrossRef]
  62. Grabherr, M.G.; Haas, B.J.; Yassour, M.; Levin, J.Z.; Thompson, D.A.; Amit, I.; Adiconis, X.; Fan, L.; Raychowdhury, R.; Zeng, Q. Full length transcriptome assembly from RNA Seq data without a reference genome. Nat. Biotechnol. 2011, 29, 644–652. [Google Scholar] [CrossRef]
  63. Lucas, A. Amap: Another Multidimensional Analysis Package. 2022. Available online: https://cran.r-project.org/web/packages/amap/index.html (accessed on 23 December 2023).
  64. Shannon, P.; Markiel, A.; Ozier, O.; Baliga, N.S.; Wang, J.T.; Ramage, D.; Amin, N.; Schwikowski, B.; Ideker, T. Cytoscape: A software environment for integrated models of biomolecular interaction networks. Genome Res. 2003, 13, 2498–2504. [Google Scholar] [CrossRef]
  65. Bian, S.; Zhao, M.; Zhang, H.; Ren, Y. Differentially Expressed Genes Identification of Kohlrabi Seedlings (Brassica oleracea var. caulorapa L.) under Polyethylene Glycol Osmotic Stress and AP2/ERF Transcription Factor Family Analysis. Plants 2024, 13, 1167. [Google Scholar] [CrossRef] [PubMed]
  66. Marchler-Bauer, A.; Bo, Y.; Han, L.; He, J.; Lanczycki, C.J.; Lu, S.; Chitsaz, F.; Derbyshire, M.K.; Geer, R.C.; Gonzales, N.R.; et al. CDD/SPARCLE: Functional classification of proteins via subfamily domain architectures. Nucleic Acids Res. 2017, 45, D200–D203. [Google Scholar] [CrossRef]
  67. Bailey, T.L.; Boden, M.; Buske, F.A.; Frith, M.; Grant, C.E.; Clementi, L.; Ren, J.; Li, W.W.; Noble, W.S. MEME SUITE: Tools for motif discovery and searching. Nucleic Acids Res. 2009, 37, W202–W208. [Google Scholar] [CrossRef] [PubMed]
  68. Chen, C.J.; Chen, H.; Zhang, Y.; Thomas, H.R.; Frank, M.H.; He, Y.H.; Xia, R. TBtools: An integrative toolkit developed for interactive analyses of big biological data. Mol. Plant 2020, 13, 1194–1202. [Google Scholar] [CrossRef] [PubMed]
  69. Edgar, R.C. MUSCLE: Multiple sequence alignment with high accuracy and high throughput. Nucleic Acids Res. 2004, 32, 1792–1797. [Google Scholar] [CrossRef]
  70. Kumar, S.; Stecher, G.; Tamura, K. MEGA7: Molecular Evolutionary Genetics Analysis Version 7.0 for Bigger Datasets. Mol. Biol. Evol. 2016, 33, 1870–1874. [Google Scholar] [CrossRef]
  71. Livak, K.J.; Schmittgen, T.D. Analysis of relative gene expression data using real-time quantitative PCR and the 2−∆∆CT method. Methods 2001, 25, 402–408. [Google Scholar] [CrossRef]
Figure 1. Biochemical indicators of kohlrabi seedlings at low temperature (CK) and under low-temperature stress at 12 °C, 8 °C, and 4 °C. (A) Fresh and dry weight. (B) Water content. (C) Catalase (CAT) activity. (D) Superoxide dismutase (SOD) activity. (E) Malondialdehyde (MDA) content. (F) Proline (Pro) content. (G) Soluble protein content. (H) Soluble sugar content. ** Represents a significant difference when the p-value is 0.01.
Ijms 25 09261 g001
Figure 2. Transcriptome data summary and analysis of differentially expressed unigenes in kohlrabi seedlings under low-temperature stress. (A) The transcript and unigene sequences’ length distribution. (B) Functional annotation of assembled unigenes. (C) Differentially expressed unigenes in different pairwise comparisons. (D) Venn diagram of differentially expressed unigene numbers in pairwise comparisons between control and treatment of 12 °C vs. CK, 8 °C vs. CK, and 4 °C vs. CK. White and red digits indicate the number of downregulated and upregulated genes, respectively. (E) Venn diagram of differentially expressed unigene numbers in pairwise comparisons of treatment of 12 °C vs. CK, 8 °C vs. 12 °C, and 4 °C vs. 8 °C. White and red digits indicate the number of downregulated and upregulated genes, respectively.
Ijms 25 09261 g002
Figure 3. Availability analysis of transcriptome data using RNA-Seq and RT-qPCR was used to construct the expression-level bar graphs at 4 °C, 8 °C, 12 °C, and CK (22 °C). (A) BnaC05g00840D (Cluster-17807.81882); (B) SYD (Cluster-17807.82832); (C) Zinc finger protein CONSTANS-LIKE 4 (Cluster-17807.77797); (D) MYB1-R1 (Cluster-17807.81941); (E) C3H49 (Cluster-17807.85268); (F) C3H30 (Cluster-17807.81598); (G) Zinc finger protein CONSTANS-LIKE 4 (Cluster-17807.83850); (H) RGA2 (Cluster-17807.82153); (I) DOF3.3 (Cluster-17807.86516); (J) B-box zinc finger protein 25 (Cluster-17807.84461).
Ijms 25 09261 g003
Figure 4. A putative interplay of kohlrabi seedlings under low-temperature stress. The DEG changes were represented by the log2FPKM. Blue and red, respectively, represent a decrease and an increase in the expression level of genes.
Ijms 25 09261 g004
Figure 5. Analysis of differentially expressed transcription factors and identification of low-temperature-related differentially expressed transcription factors. (A) Venn diagram of differentially expressed transcription factors in the comparison of 12 °C vs. CK, 8 °C vs. CK, and 4 °C vs. CK. White and red digits indicate the number of downregulated and upregulated genes, respectively. (B) Venn diagram of the differentially expressed transcription factor in the comparison of 12 vs. CK, 8 °C vs. 12 °C, and 4 °C vs. 8 °C. White and red digits indicate the number of downregulated and upregulated genes, respectively. (C) Co-expression network map between differentially expressed transcription factors and CAT activity, SOD activity, MDA content, Pro content, and soluble sugar content. Yellow squares indicate biochemical indicators related to the low temperature. Blue circles indicate differentially expressed transcription factors. (D) Expression profile of differentially expressed transcription factors’ related low-temperature stress in kohlrabi using RNA sequencing. The changes in the differentially expressed transcription factors are represented by the log2FPKM.
Ijms 25 09261 g005
Figure 6. Co-expression network map between differentially expressed transcription factors related to the low temperature and DEGs related to the metabolites pathway. Blue circles indicate DEGs related to the metabolites pathway; yellow squares indicate differentially expressed transcription factors related to the low temperature.
Ijms 25 09261 g006
Figure 7. Chromosomal locations of BocARR-B genes in kohlrabi. Note: C1–C9 indicates nine chromosomes. The scale bar on the left shows the chromosome lengths (Mb). The blue and yellow regions of the chromosome represent a low and high gene density, respectively.
Ijms 25 09261 g007
Figure 8. Evolutionary relationships, conserved protein motifs, and domains of the 19 BocARR-Bs. (A) Phylogenetic relationship analysis using amino acid sequences of BocARR-Bs by MEGA11. The size of the purple circle represents the bootstrap value. The display range indicates the branch metadata bootstrap. (B) Distribution of 4 motifs. (C) Distribution of REC_type_ARR-like domain, myb_SHAQKYF domain, PLN03162 superfamily domain, and HFD_SF superfamily domain. (D) Four different conserved motifs of BocARR-Bs.
Ijms 25 09261 g008
Figure 9. Evolutionary tree of BocARR-B family genes in kohlrabi and Arabidopsis.
Ijms 25 09261 g009
Figure 10. Expression analysis of BocARR-B family genes in kohlrabi. (A) Expression profile of BocARR-B genes in kohlrabi using RNA sequencing during low-temperature stress. Data in the heatmap box are normalized expression levels of three replicates. (BL) RT-qPCR analysis of eleven BocARR-B transcription factor genes in different tissues of kohlrabi. * Represents a significant difference when the p-value is 0.05. ** Represents a significant difference when the p-value is 0.01.
Ijms 25 09261 g010
Table 1. Description of BocARR-B genes in kohlrabi.
Gene IDSequence IDAccession Number of NCBI Reference SequenceLength of cDNANumber of Amino AcidsMolecular WeightTheoretical pIAliphatic Index
BocARR-B1Cluster-17807.114153XM_013763325.1151850556,405.736.3375.03
BocARR-B2Cluster-17807.114154XM_022718524.2149149655,418.66.2475.6
BocARR-B3Cluster-17807.84395XM_013746126.1189663168,971.176.0870.25
BocARR-B4Cluster-17807.71963XM_013816288.3189963269,032.276.1769.68
BocARR-B5Cluster-17807.7188XM_013760760.1113137641,499.488.7489.15
BocARR-B6Cluster-17807.138306XM_048748308.1131443748,873.928.8788.1
BocARR-B7Cluster-17807.90061XM_013774622.1194164670,765.036.3869.69
BocARR-B8Cluster-17807.24114XM_013774622.1194164670,941.296.4869.4
BocARR-B9Cluster-17807.138684XM_013775692.1174658163,895.56.0674.17
BocARR-B10Cluster-17807.138685XM_013775692.1173457763,465.096.0674.68
BocARR-B11Cluster-17807.122837XM_013731190.1204067974,037.85.9472.77
BocARR-B12Cluster-17807.96507XM_013731190.1204368073,913.575.8773.51
BocARR-B13Cluster-17807.119682XM_013731190.1204067974,002.755.9473.34
BocARR-B14Cluster-17807.22246XM_013736811.1160853560,256.555.2880.5
BocARR-B15Cluster-18118.0XM_013736309.1150650156,851.625.0881.08
BocARR-B16Cluster-17807.71962XM_013743001.1180360065,834.766.2170.63
BocARR-B17Cluster-17807.116306XM_013743960.1176758865,877.45.7877.6
BocARR-B18Cluster-17807.137797XM_013852208.3180960266,358.366.4771.51
BocARR-B19Cluster-17807.18348XM_013852209.3180660166,152.096.3870.67
Disclaimer/Publisher’s Note: The statements, opinions and data contained in all publications are solely those of the individual author(s) and contributor(s) and not of MDPI and/or the editor(s). MDPI and/or the editor(s) disclaim responsibility for any injury to people or property resulting from any ideas, methods, instructions or products referred to in the content.

