
Gold Nanoparticles for Retinal Molecular Optical Imaging


Abstract
1. Introduction
2. Gold Nanoparticles (GNPs): Synthesis and Properties as Contrast Agents
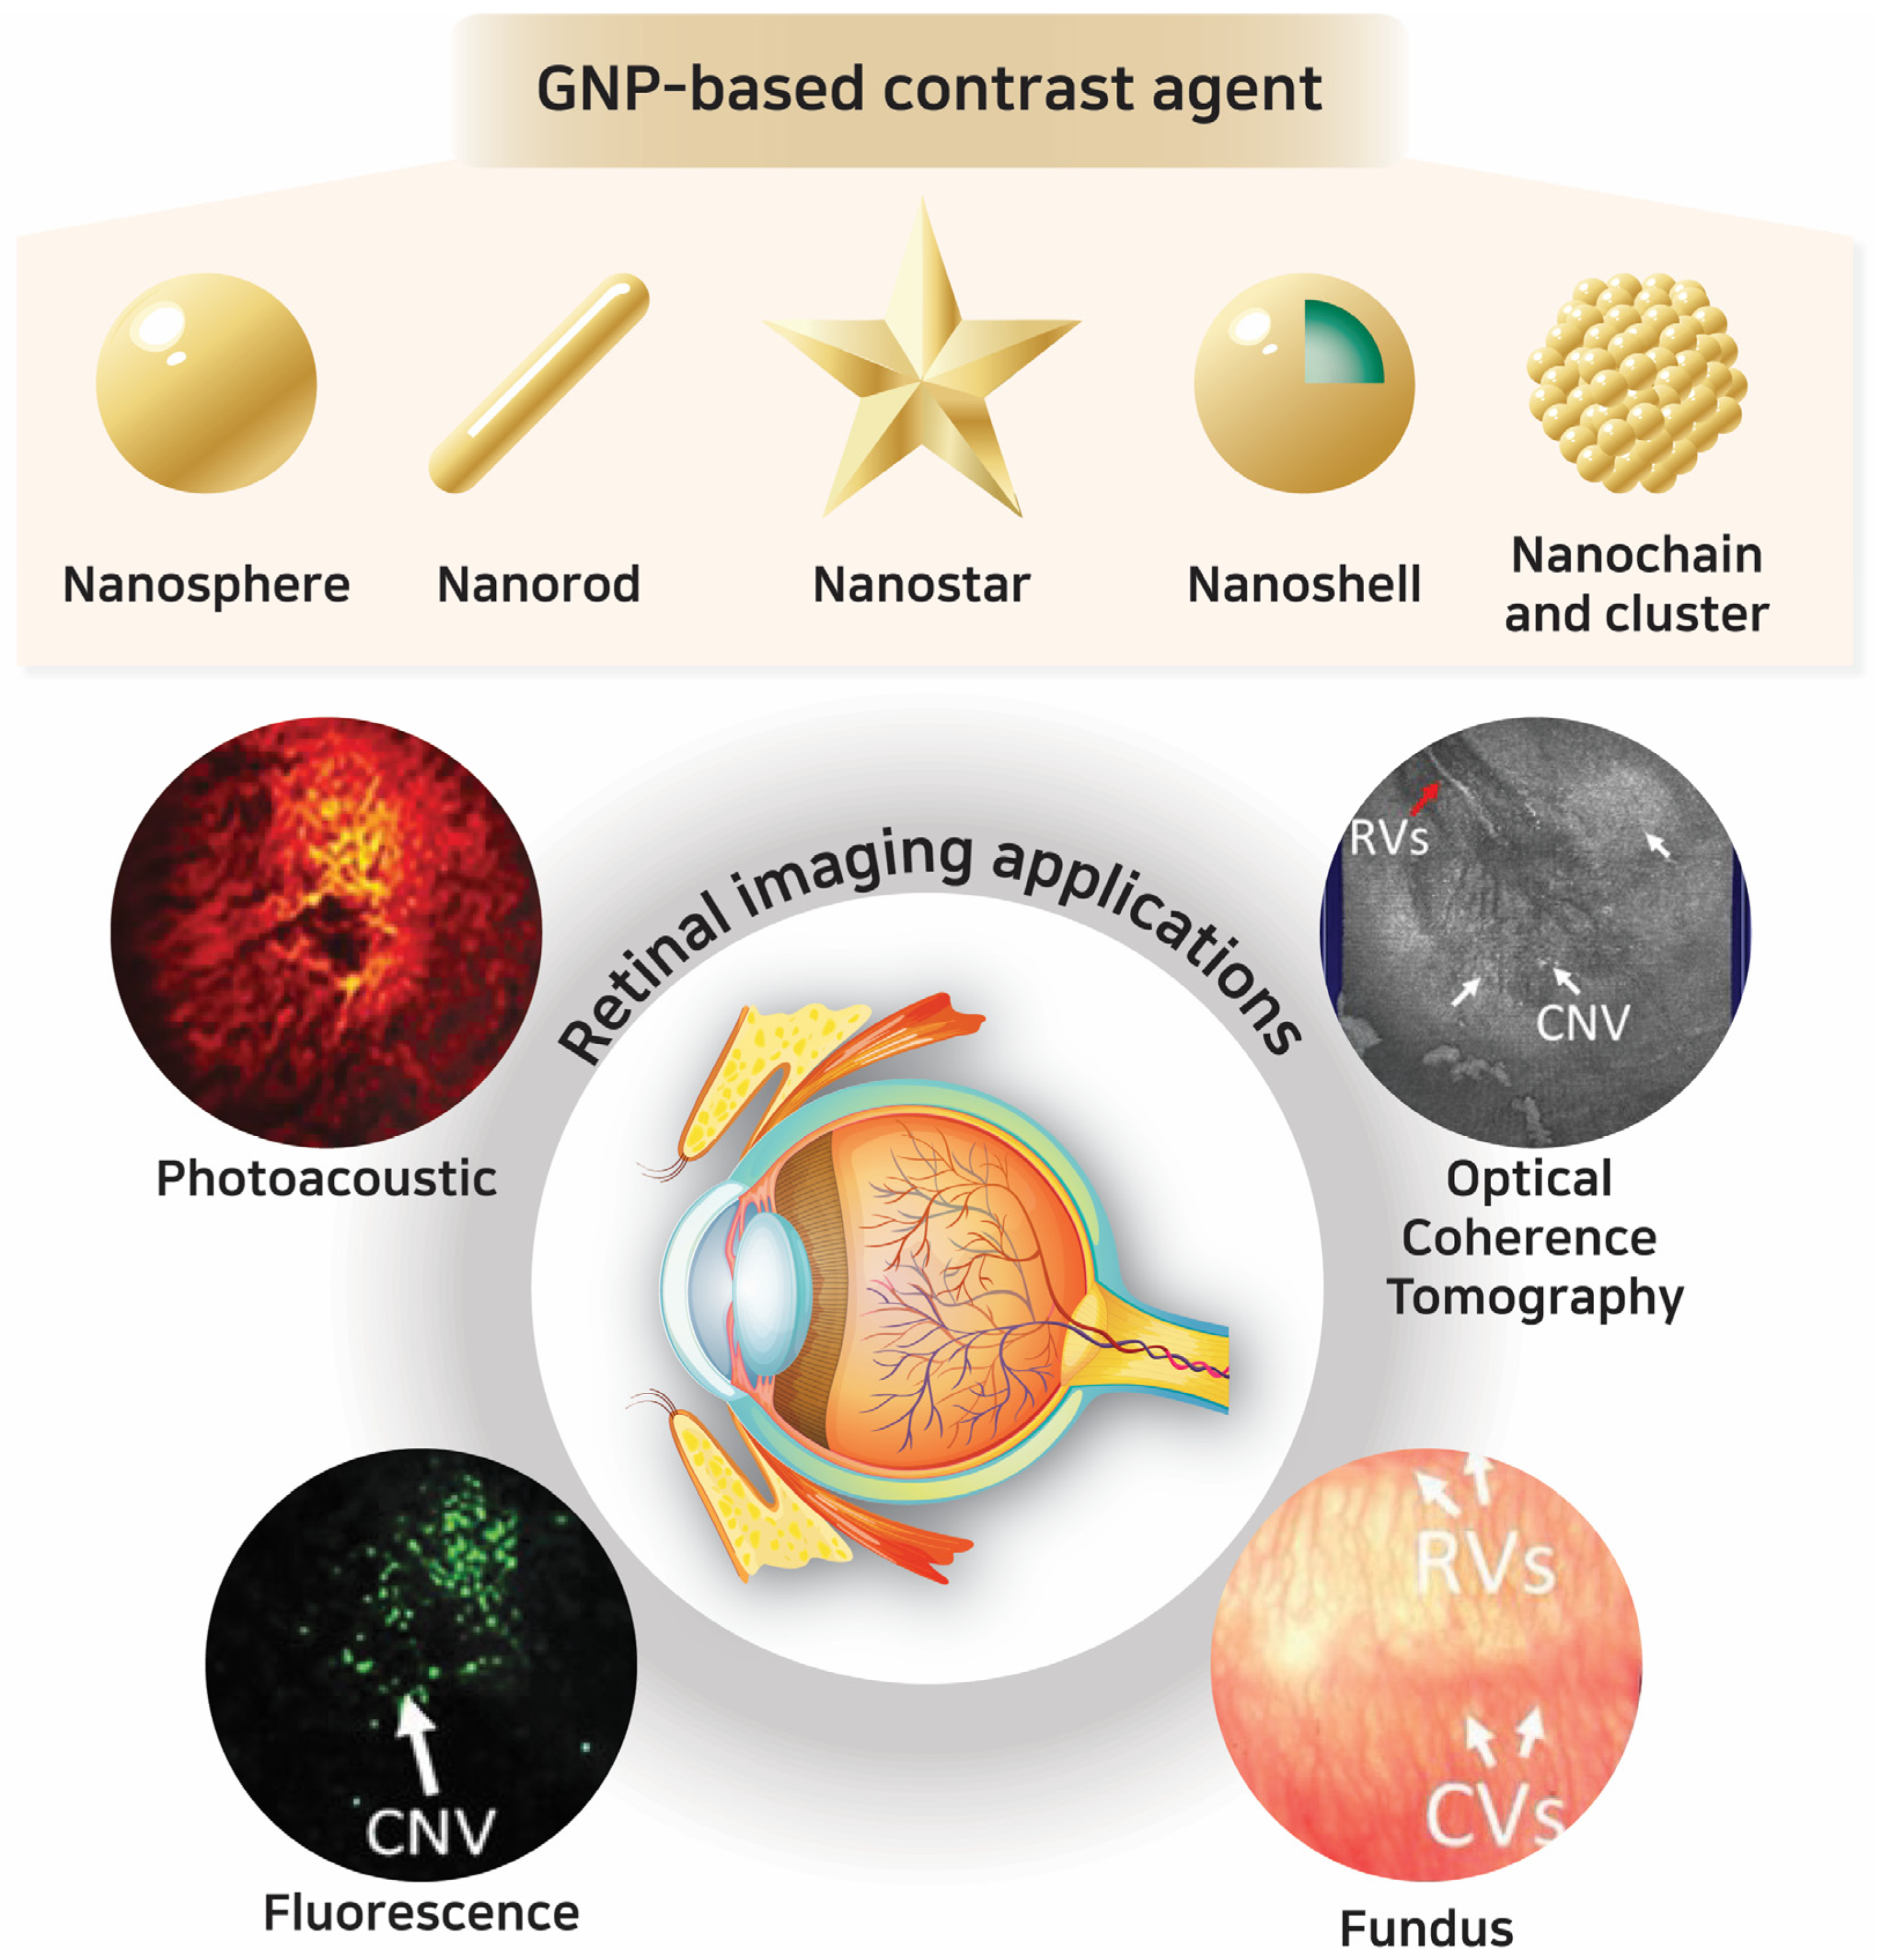
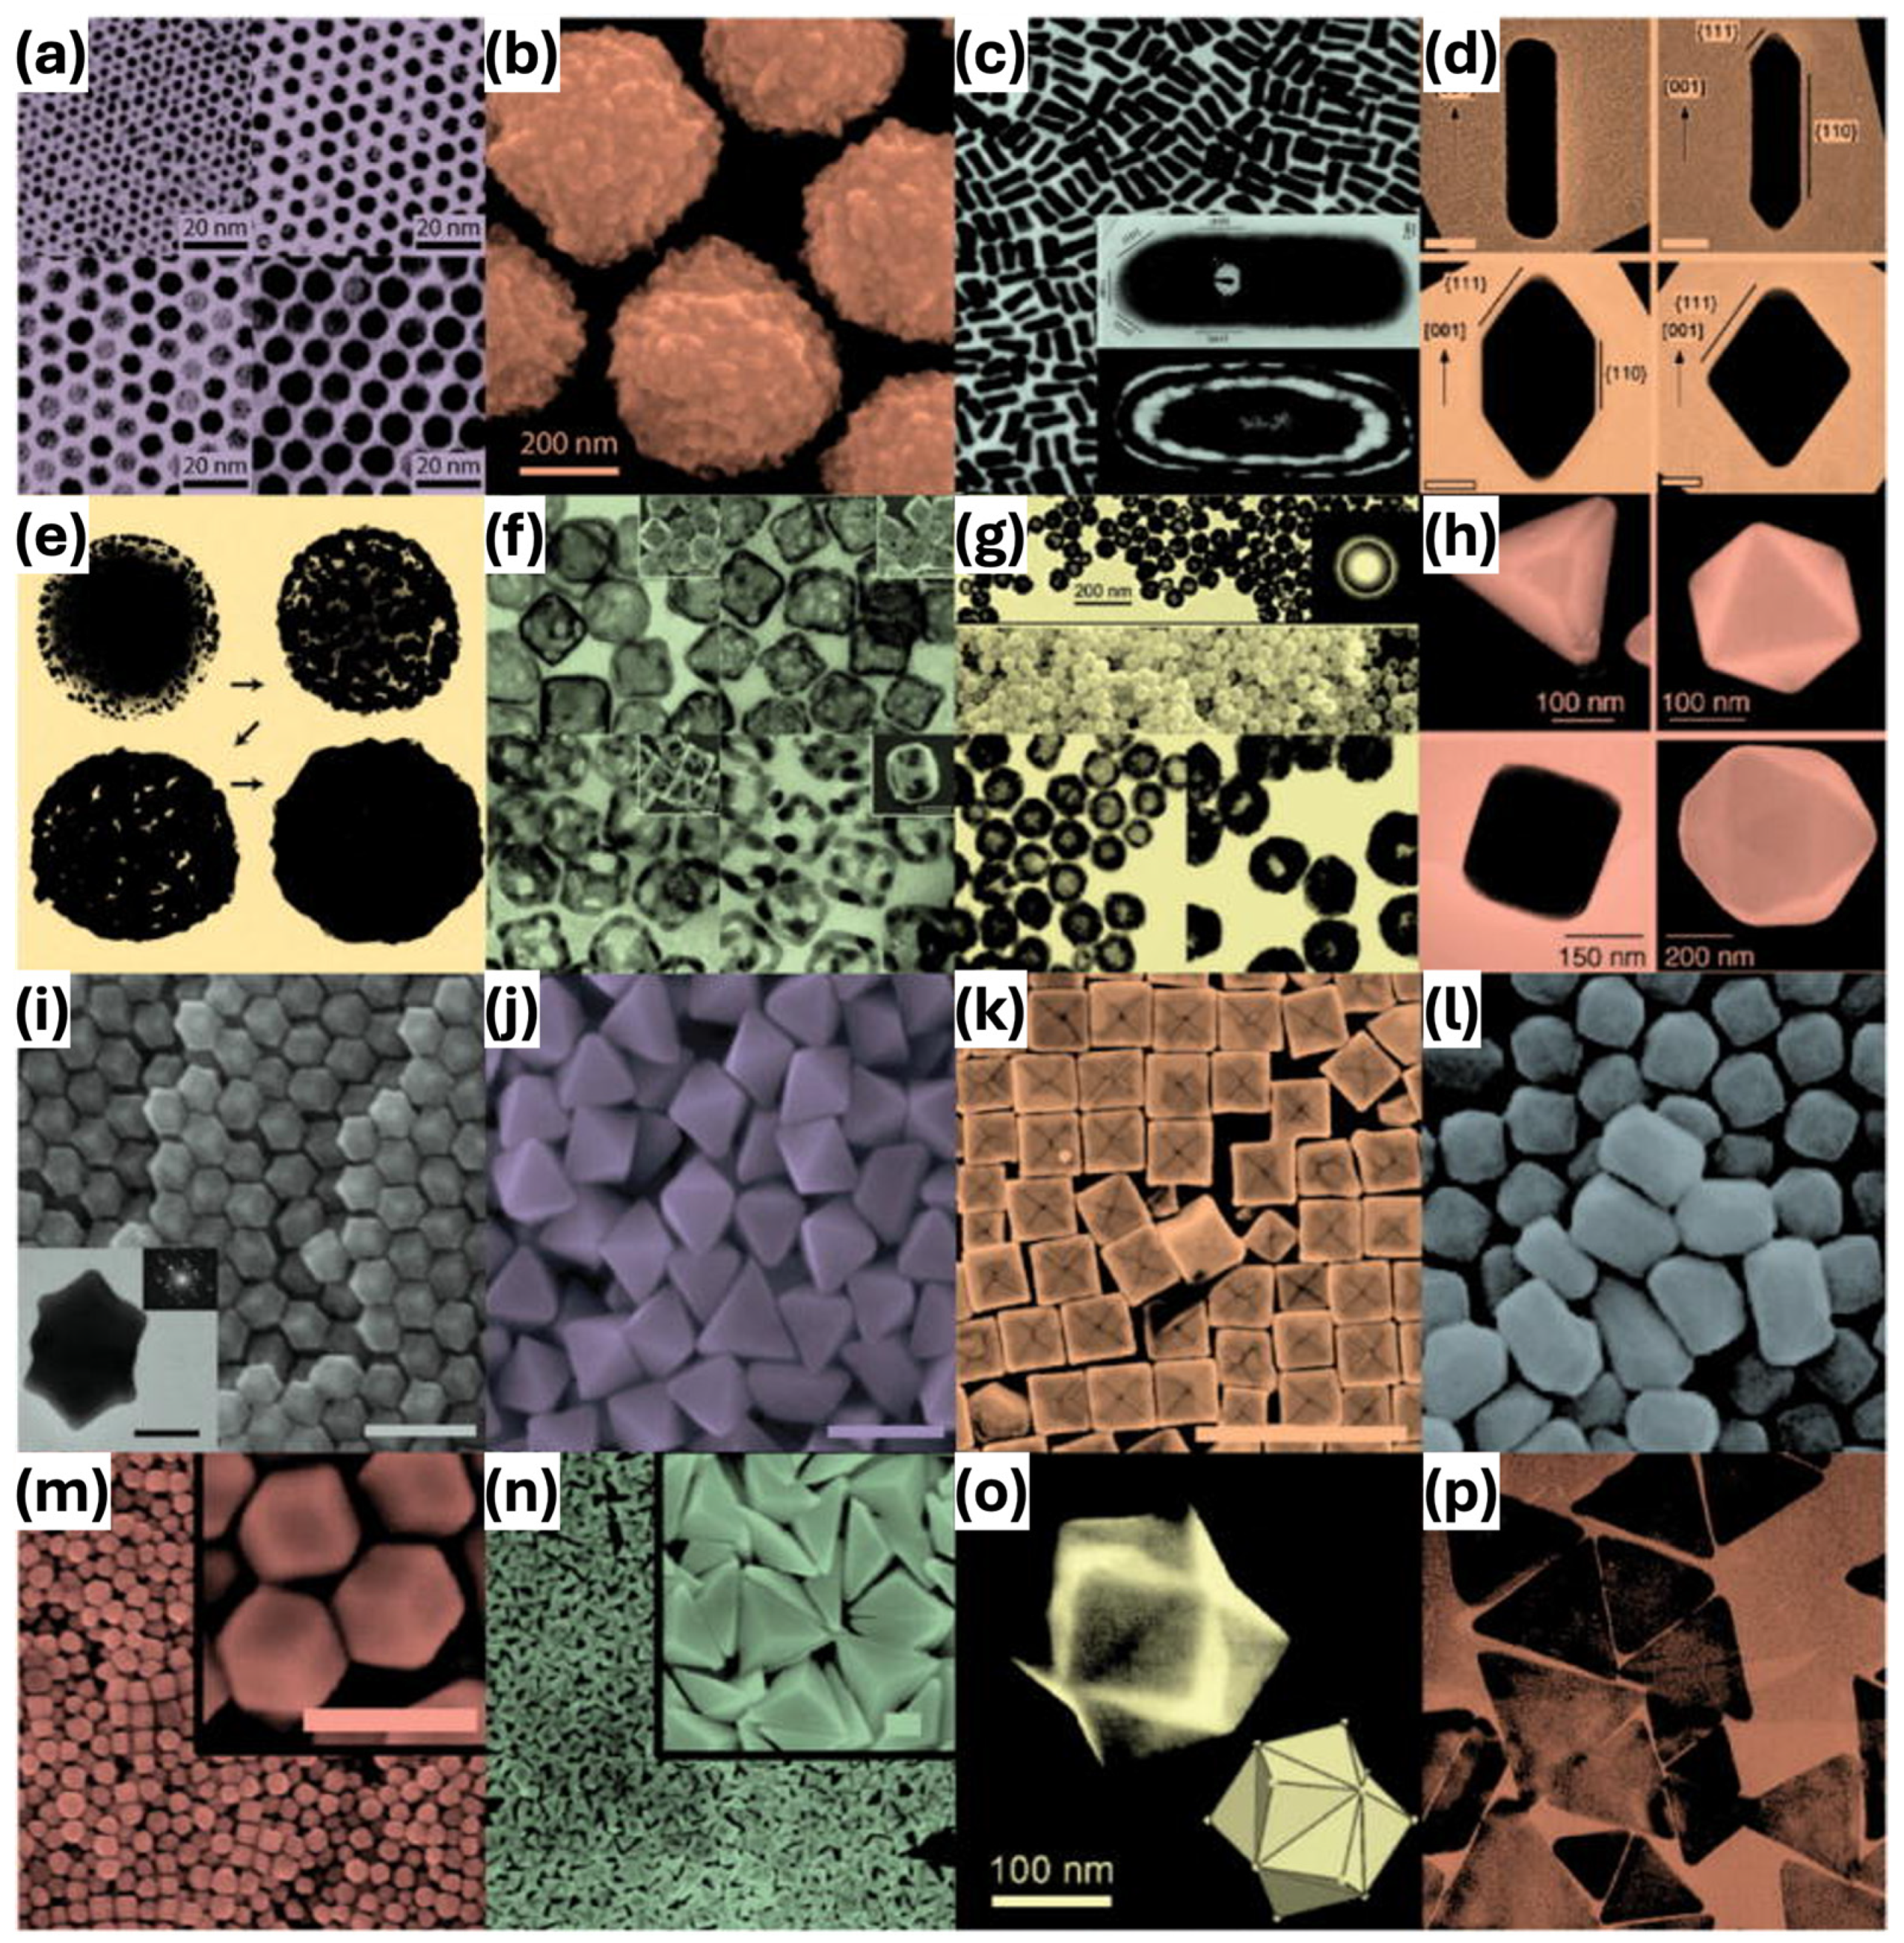
2.1. Principles and Classification of GNPs

| Morphology | Synthetic Methods | Size (nm) | Maximum Absorption (nm) | Applications | Ref. |
|---|---|---|---|---|---|
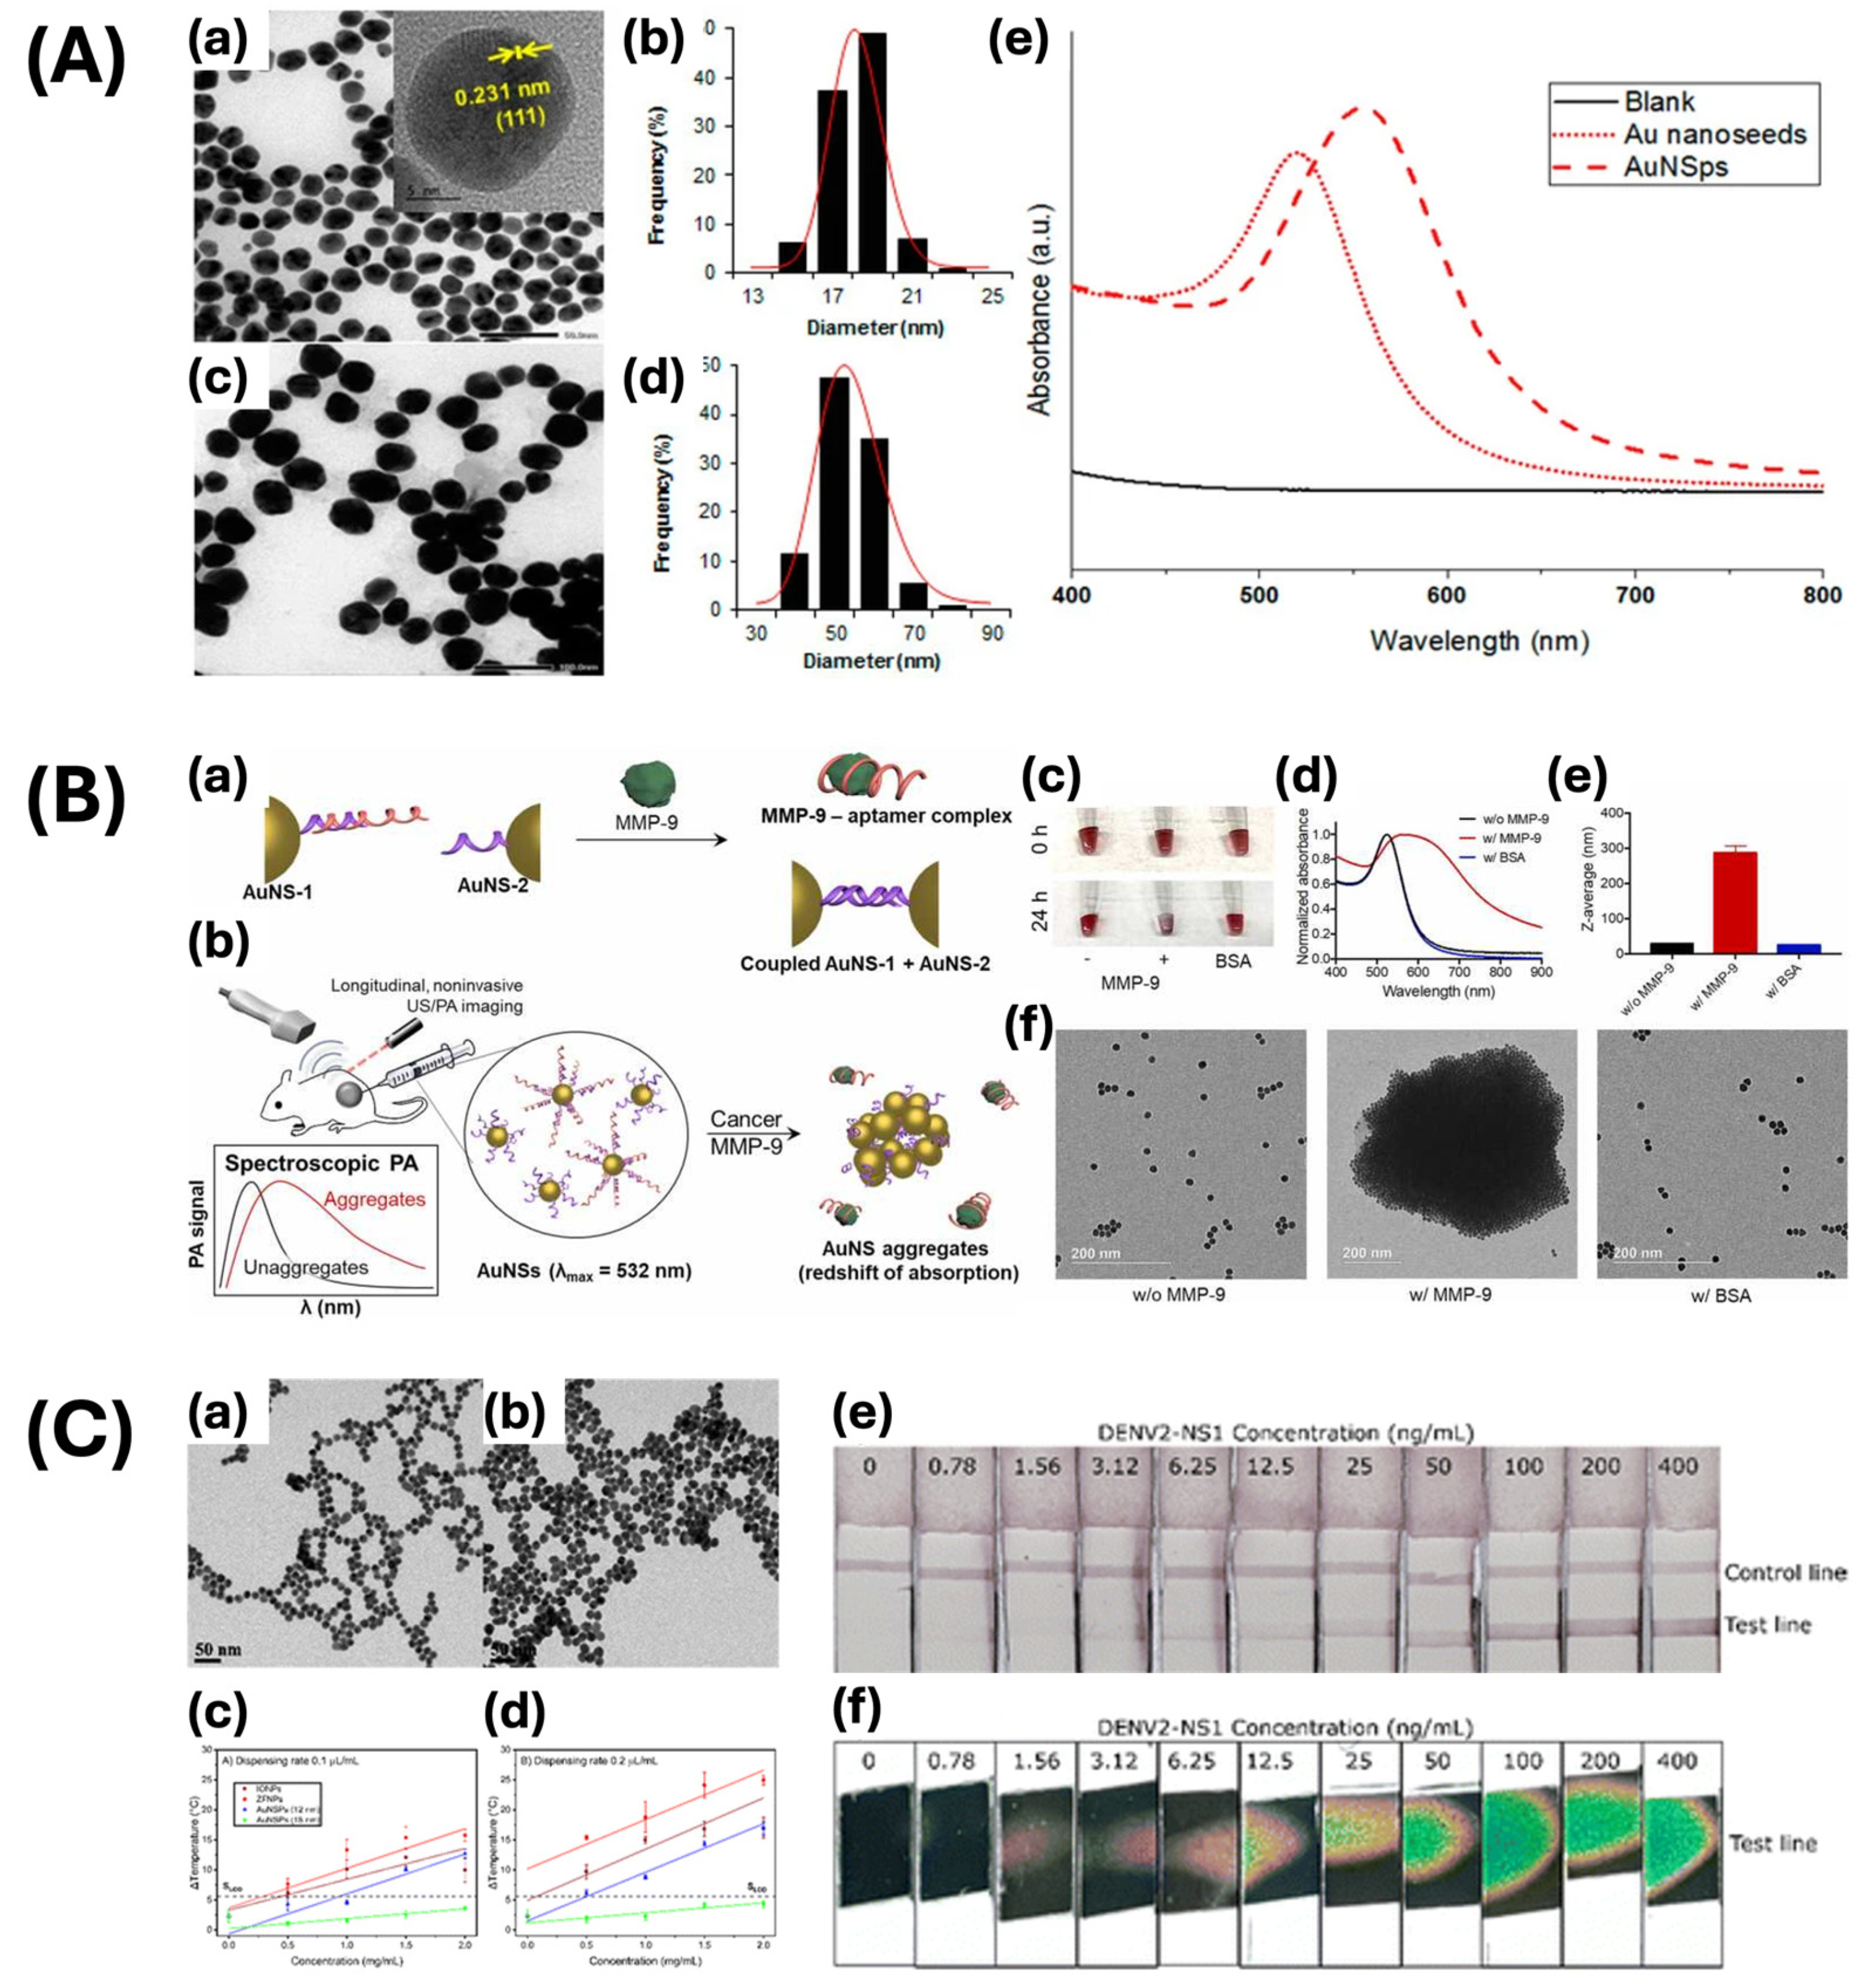
| Nanosphere | Seed-mediated growth method | 30 | 530 | Photothermal cancer treatment | [46] |
| 53 | 560 | Residual fungicide detection | [47] | ||
| 15 | 520 | Photoacoustic imaging | [48] | ||
| 26–50 | - | X-ray CT and fluorescence imaging | [49] | ||
| 10 | 560 | Contrast agent for photoacoustic imaging | [50] | ||
| Citrate reduction method | 15 | 520–526 | Antibiofilm nanomaterial | [51] | |
| 12, 18 | 517, 522 | Lateral flow assay | [52] | ||
| Nanorod | Seed-mediated growth method | - | 800 | Stem cell photoacoustic imaging | [53] |
| 10 × 50, 10 × 59 | 900, 980 | Cell labeling | [54] | ||
| 51 ± 5 × 23 ± 3 | 642 | Sonodynamic therapy | [55] | ||
| - | 818 | Contrast agent for ultrasound and photoacoustic imaging | [56] | ||
| 35 ± 2 × 9 ± 2 | 783 | pesticide thiram detection | [57] | ||
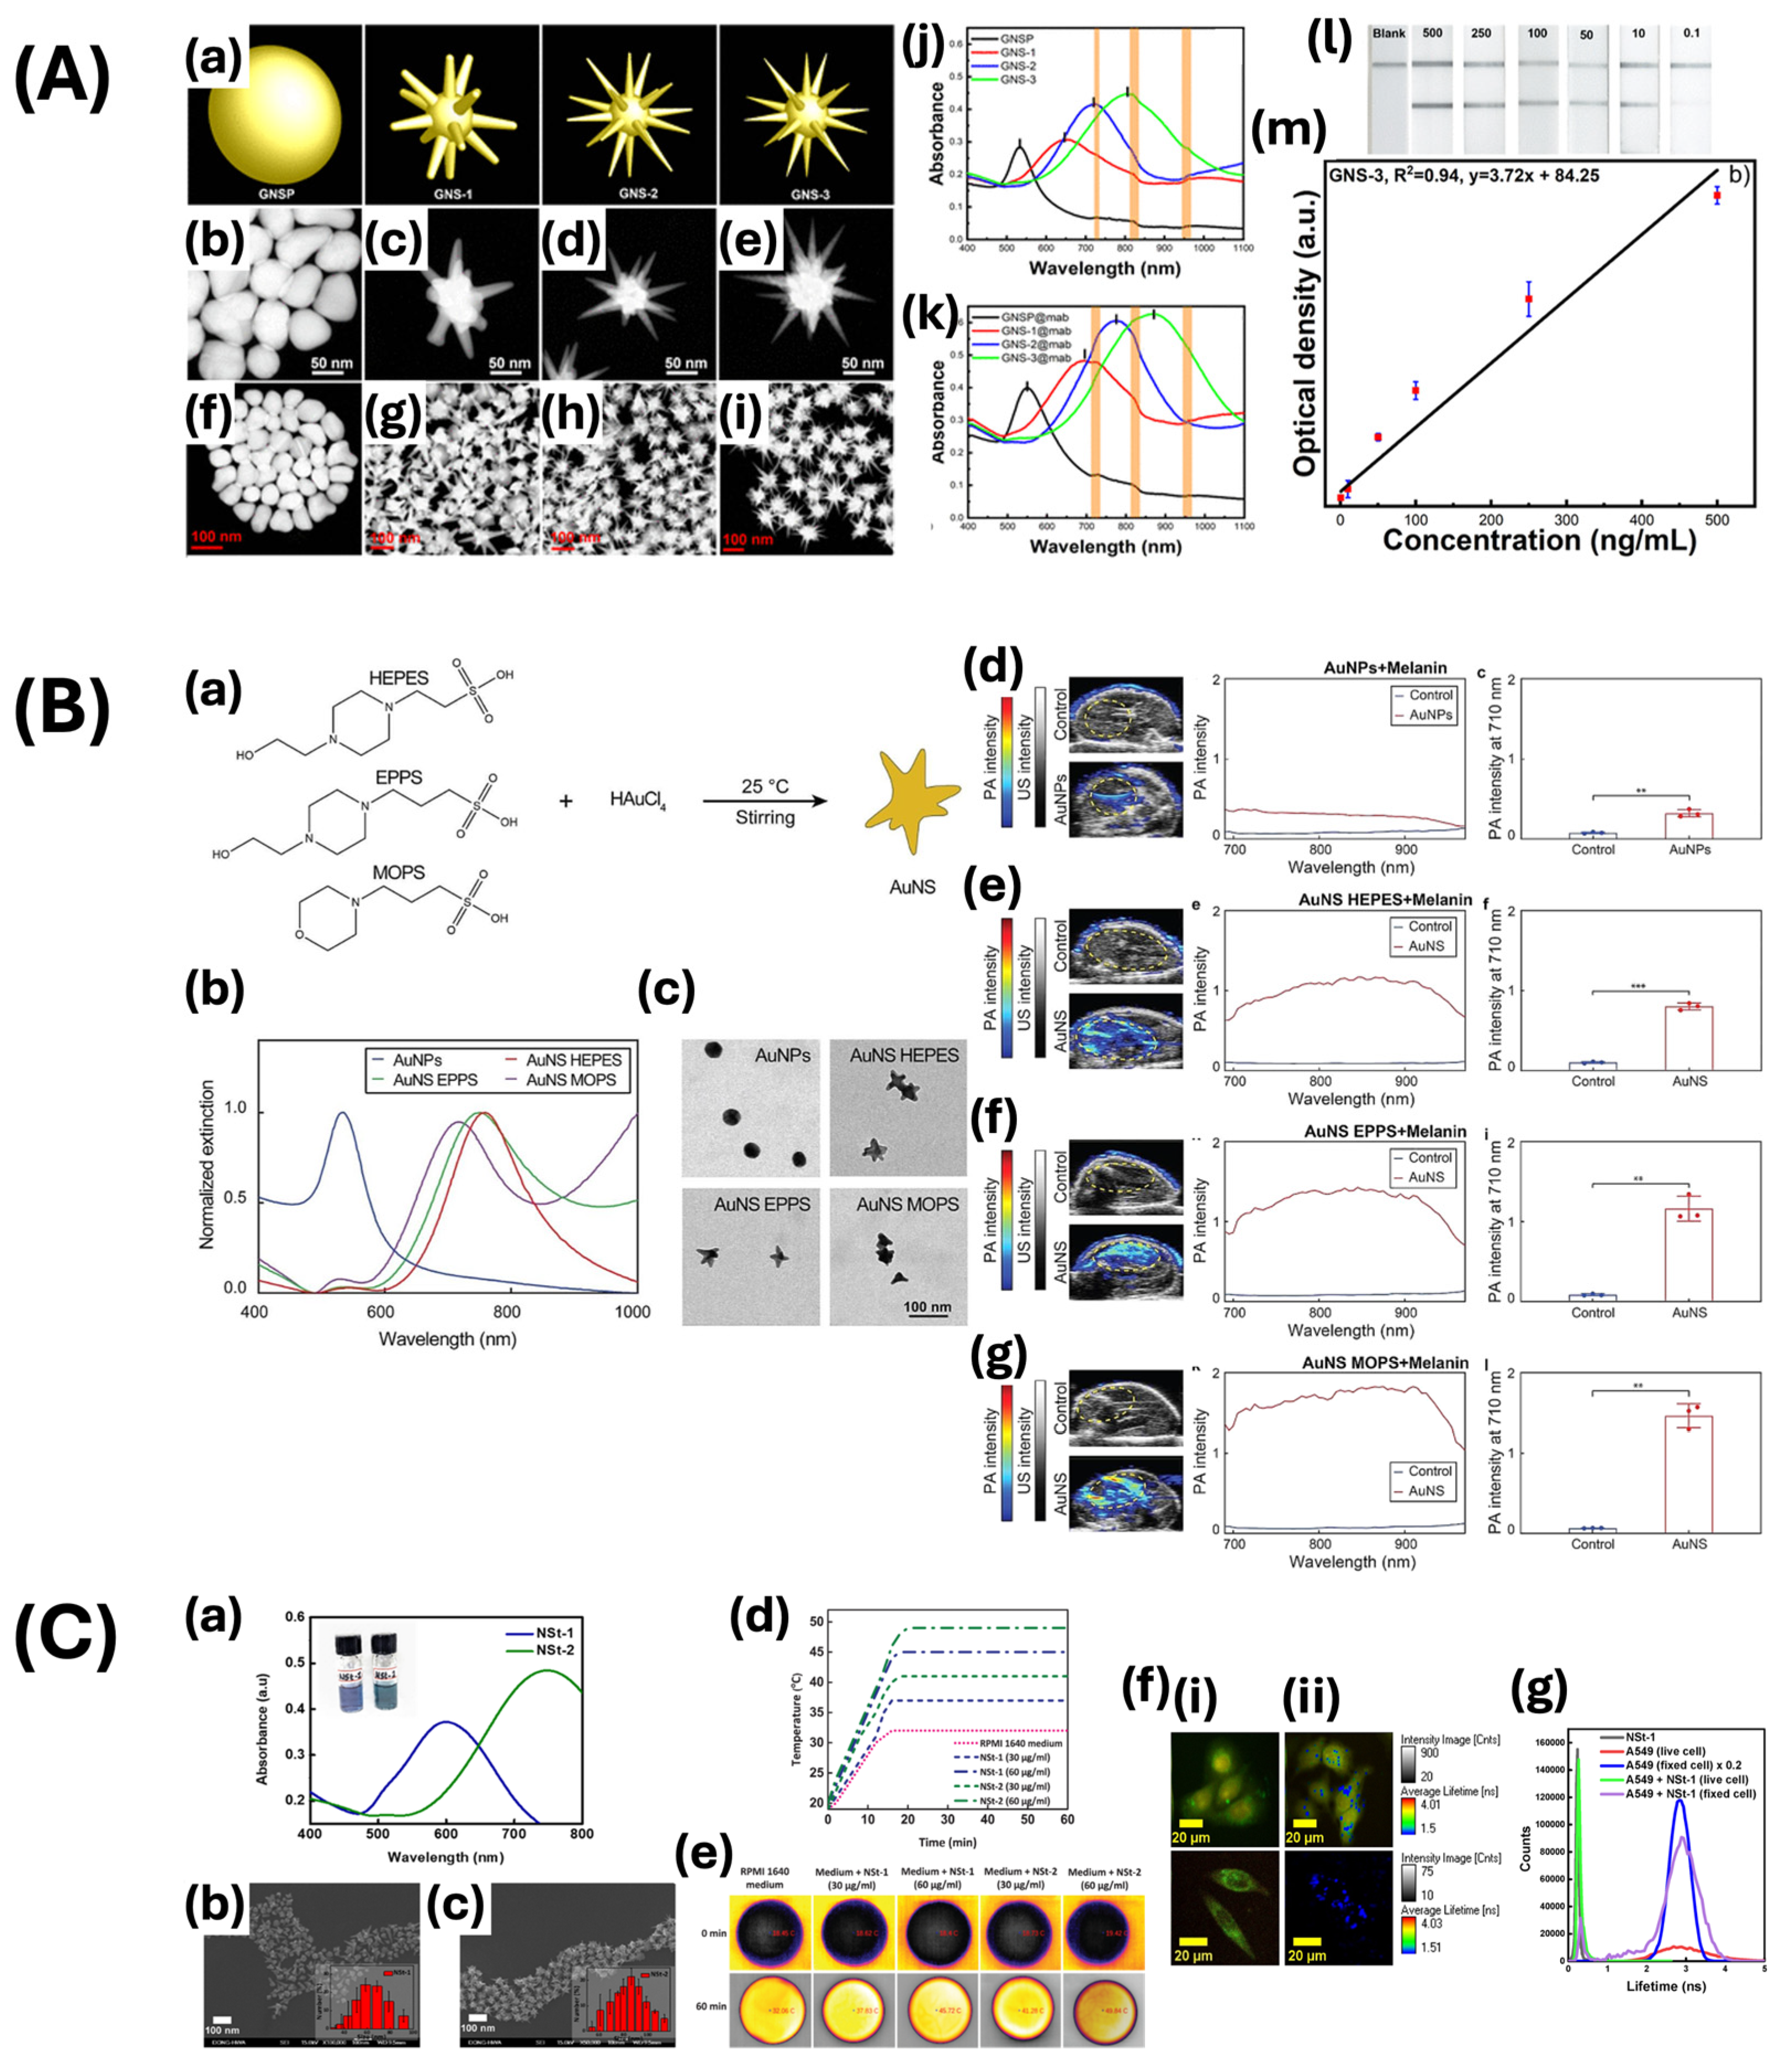
| Nanostar | Seed-mediated growth method | 200 | 850 | Photoacoustic imaging-guided photothermal therapy | [58] |
| 55 ± 5 | 790 | Photoacoustic imaging | [59] | ||
| 95 ± 7 | 820 | Lateral flow immunoassay | [60] | ||
| 126 ± 2.9 | 544 | Photocatalytic Water Remediation | [61] | ||
| - | 520–650 | Colorimetric immunoassay | [62] | ||
| One-pot method | 45 | 720 | Photoacoustic imaging | [63] | |
| Surfactant-free growth method | 47 ± 17 | 718 | Cellular imaging | [64] | |
| 58, 78 | 600, 750 | Cancer diagnostic and therapeutic agent | [65] | ||
| Nanoshell | Oldenburg method | 135.98 ± 2.36 | 799 | Chemophotothermal theragnostic agent | [66] |
| Seed-mediated growth method | - | 845 | Drug release monitoring | [67] | |
| 22 | 539 | MR imaging and photothermal therapy | [68] | ||
| 271 ± 19 | - | Cancer diagnostics agent | [69] | ||
| Thermal reduction | - | 523 | Exosome assay | [70] | |
| Nanochain and nanocluster | pulsed laser ablation-based self-assembly | 64 × 20 | 650 | PAM, OCT imaging contrast agent | [7] |
| 30.0 ± 2.1 × 7.8 ± 1.1 | 610 | Imaging photosensitizer for PAM, OCT, fluorescence | [8] | ||
| NaOH-mediated NaBH4 reduction | >5.5 | 274, 398 | Imaging-guided cancer immunotherapy | [71] | |
| Microwave-assisted method | 3.2 ± 0.4 | - | Contrast agents for confocal fluorescence imaging | [72] |
2.2. Physicochemical and Optical Properties
2.3. Criteria for Selection of Gold-Based Contrast Agents in Retinal Imaging
3. GNPs in Optical Imaging Techniques for Retinal Applications
4. Clinical Applications and Challenges of GNPs in Retinal Imaging
4.1. Safety and Toxicity
4.2. Overcoming Limitations of Imaging Systems
4.3. Enhancing GNPs for Clinical Use in Retinal Imaging
4.4. Clinical Translation and Regulatory Considerations
5. Conclusions
Author Contributions
Funding
Conflicts of Interest
References
- Chen, F.; Si, P.; de la Zerda, A.; Jokerst, J.V.; Myung, D. Gold Nanoparticles to Enhance Ophthalmic Imaging. Biomater. Sci. 2021, 9, 367–390. [Google Scholar] [CrossRef] [PubMed]
- Masse, F.; Ouellette, M.; Lamoureux, G.; Boisselier, E. Gold Nanoparticles in Ophthalmology. Med. Res. Rev. 2019, 39, 302–327. [Google Scholar] [CrossRef] [PubMed]
- Kang, M.S.; Lee, S.Y.; Kim, K.S.; Han, D.-W. State of the Art Biocompatible Gold Nanoparticles for Cancer Theragnosis. Pharmaceutics 2020, 12, 701. [Google Scholar] [CrossRef] [PubMed]
- D’Acunto, M.; Cioni, P.; Gabellieri, E.; Presciuttini, G. Exploiting Gold Nanoparticles for Diagnosis and Cancer Treatments. Nanotechnology 2021, 32, 192001. [Google Scholar] [CrossRef]
- de la Zerda, A.; Prabhulkar, S.; Perez, V.L.; Ruggeri, M.; Paranjape, A.S.; Habte, F.; Gambhir, S.S.; Awdeh, R.M. Optical Coherence Contrast Imaging Using Gold Nanorods in Living Mice Eyes. Clin. Exp. Ophthalmol. 2015, 43, 358–366. [Google Scholar] [CrossRef]
- Nguyen, V.-P.; Li, Y.; Henry, J.; Zhang, W.; Aaberg, M.; Jones, S.; Qian, T.; Wang, X.; Paulus, Y.M. Plasmonic Gold Nanostar-Enhanced Multimodal Photoacoustic Microscopy and Optical Coherence Tomography Molecular Imaging to Evaluate Choroidal Neovascularization. ACS Sens. 2020, 5, 3070–3081. [Google Scholar] [CrossRef]
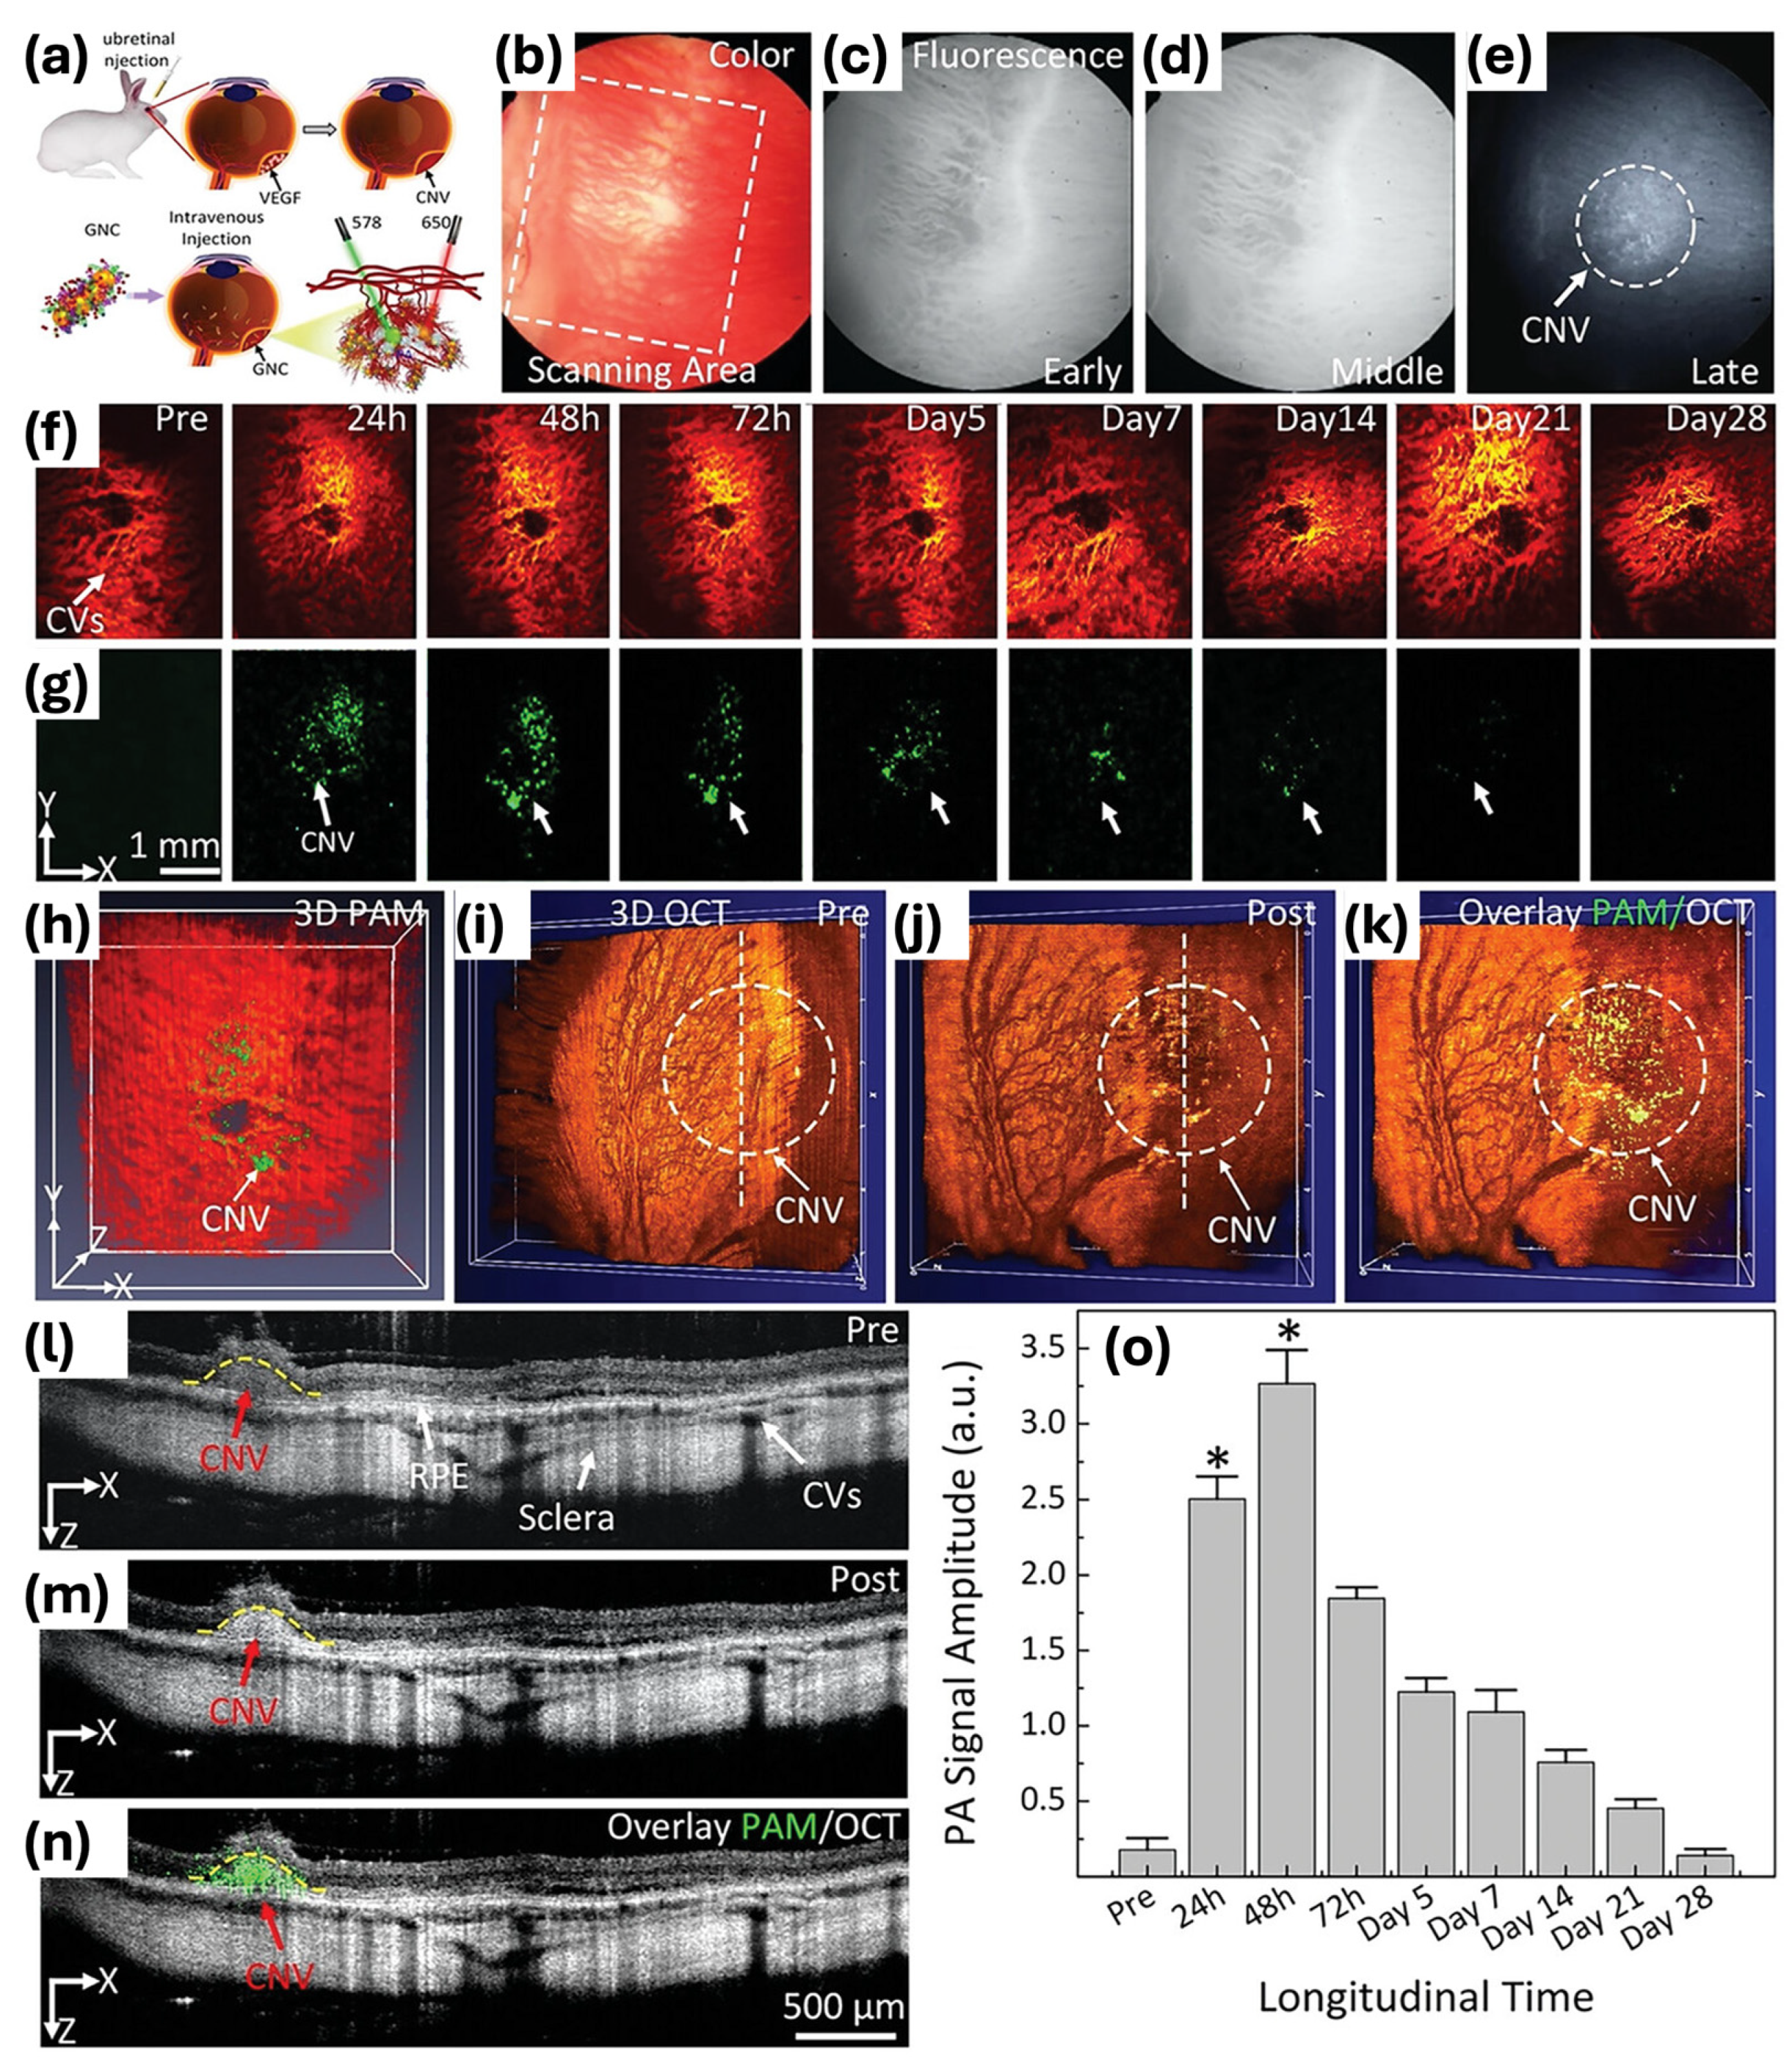
- Nguyen, V.P.; Qian, W.; Li, Y.; Liu, B.; Aaberg, M.; Henry, J.; Zhang, W.; Wang, X.; Paulus, Y.M. Chain-like Gold Nanoparticle Clusters for Multimodal Photoacoustic Microscopy and Optical Coherence Tomography Enhanced Molecular Imaging. Nat. Commun. 2021, 12, 34. [Google Scholar] [CrossRef]
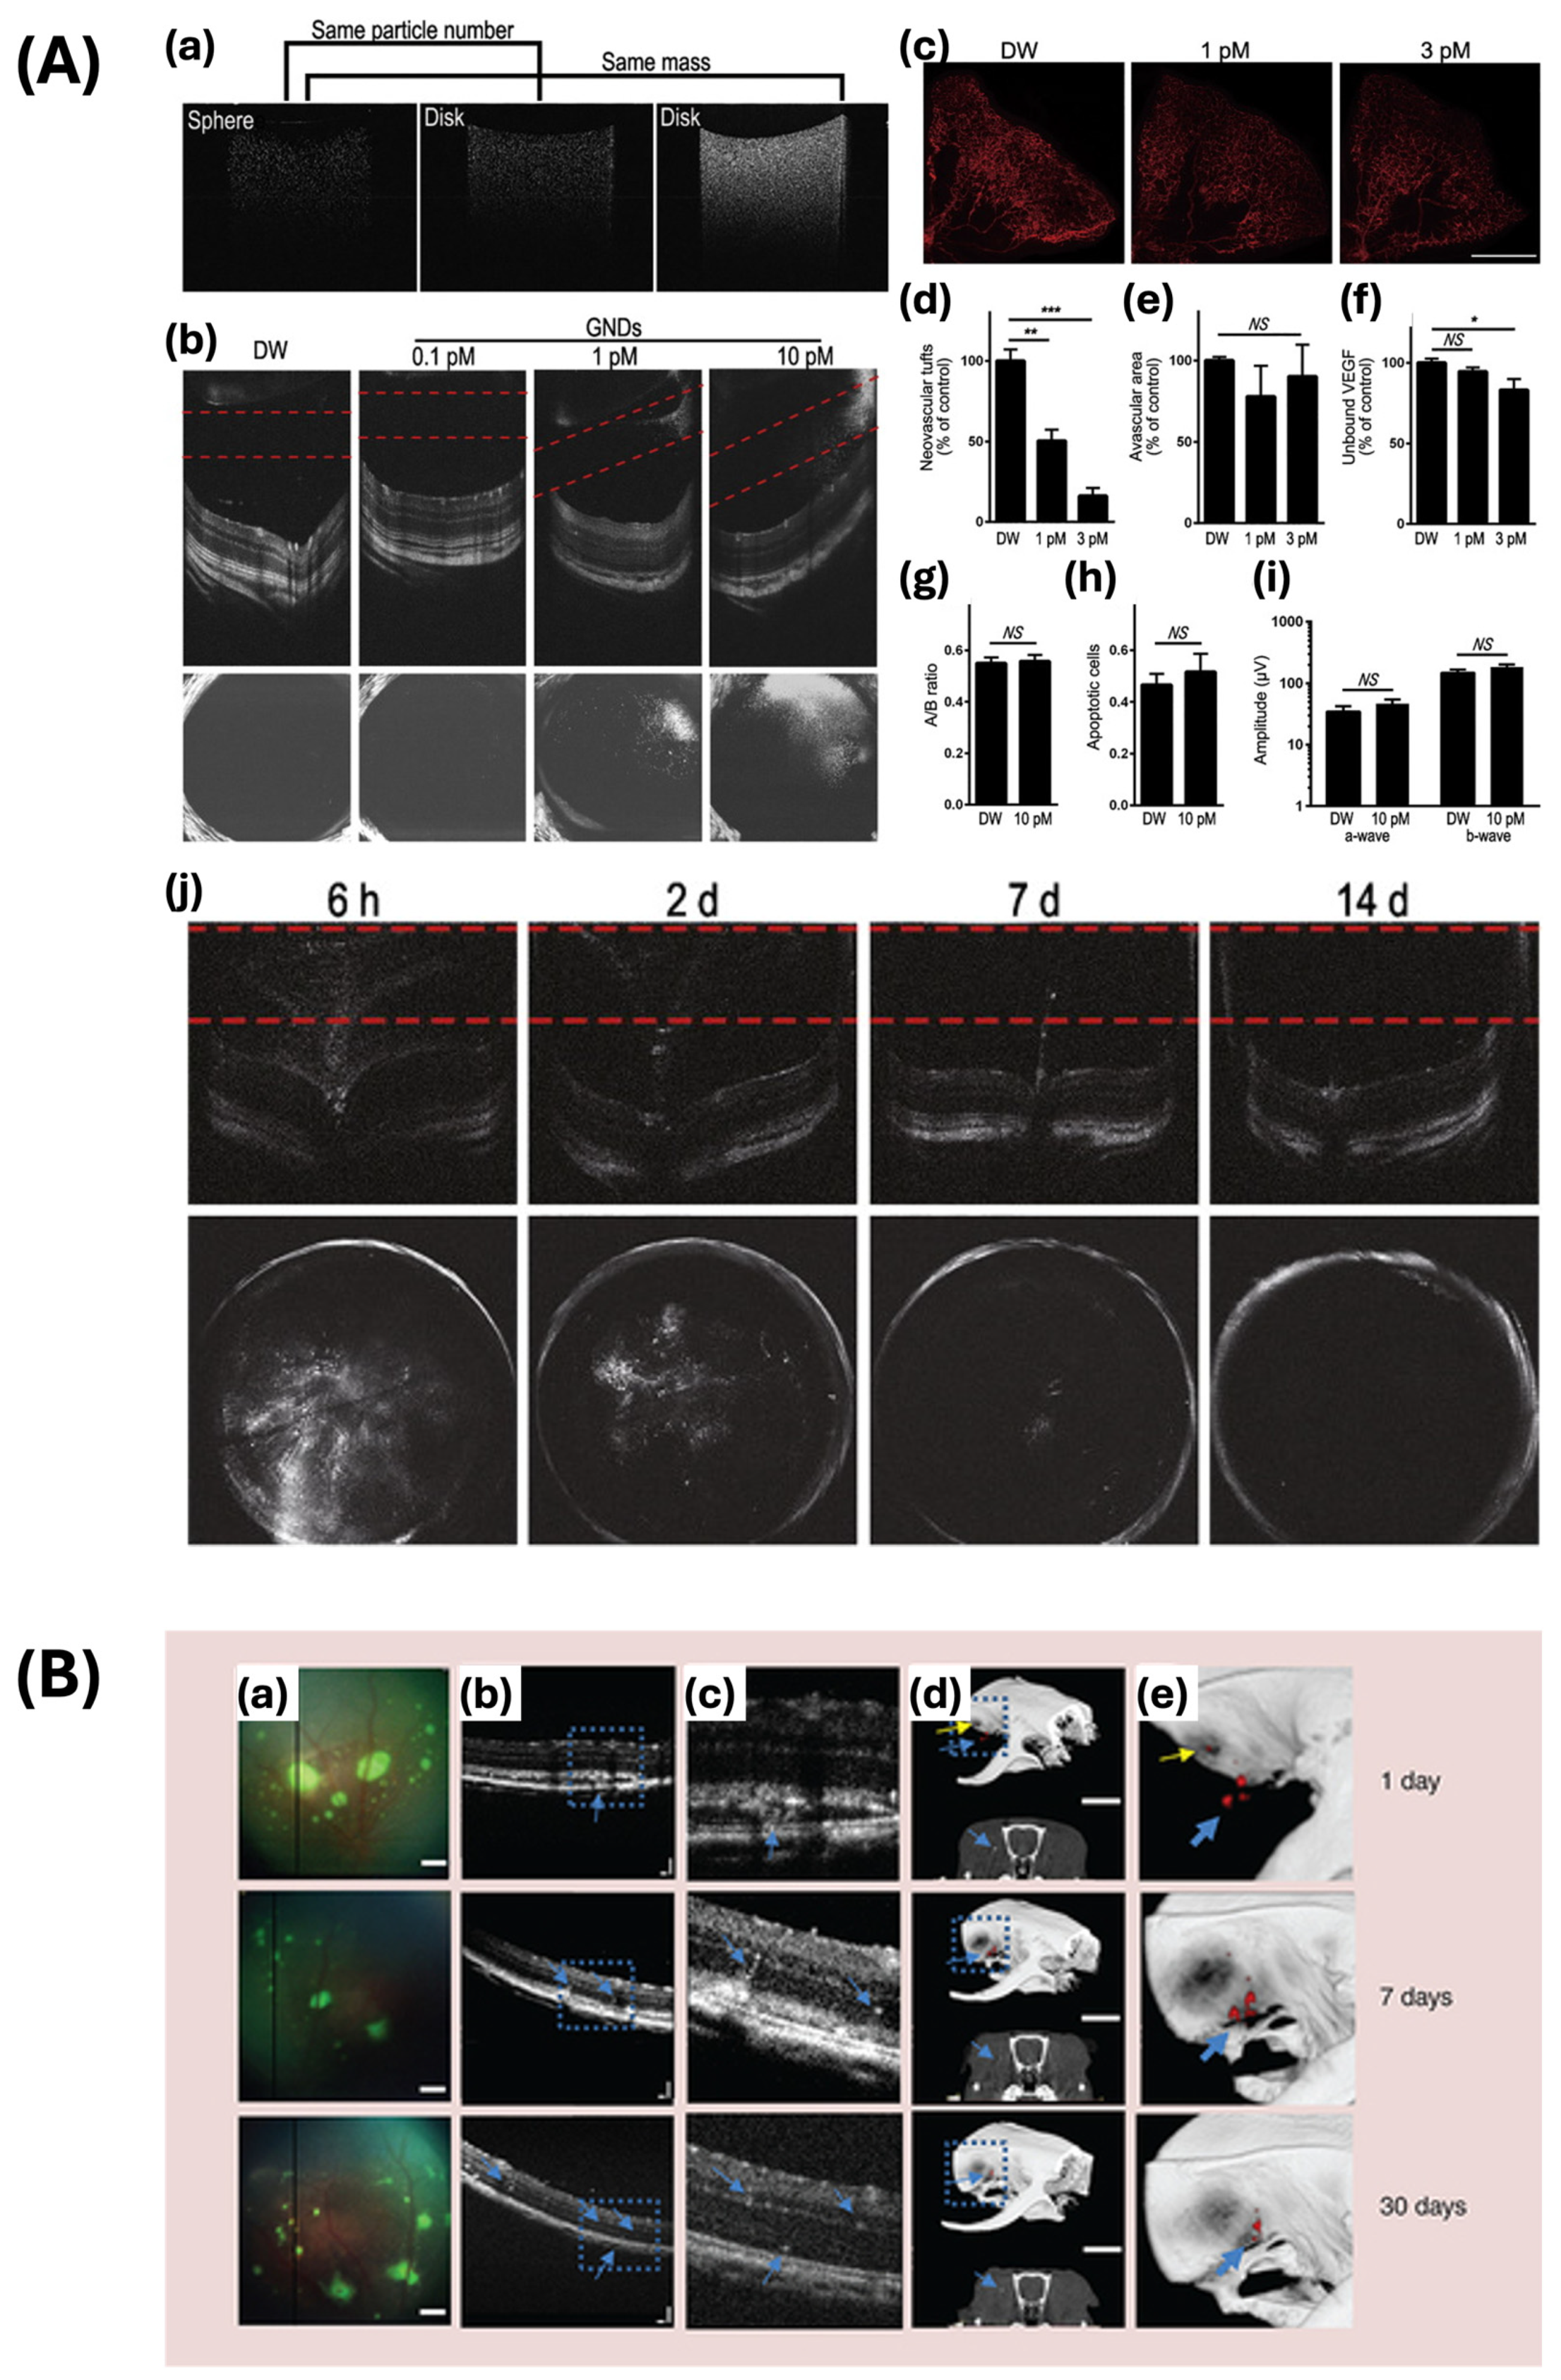
- Nguyen, V.P.; Qian, W.; Zhe, J.; Henry, J.; Wang, M.; Liu, B.; Zhang, W.; Wang, X.; Paulus, Y.M. Renally Clearable Ultraminiature Chain-Like Gold Nanoparticle Clusters for Multimodal Molecular Imaging of Choroidal Neovascularization. Adv. Mater. Deerfield Beach Fla 2023, 35, e2302069. [Google Scholar] [CrossRef]
- Häner, N.U.; Dysli, C.; Munk, M.R. Imaging in Retinal Vascular Disease: A Review. Clin. Exp. Ophthalmol. 2023, 51, 217–228. [Google Scholar] [CrossRef]
- Li, D.Q.; Choudhry, N. The Future of Retinal Imaging. Curr. Opin. Ophthalmol. 2020, 31, 199. [Google Scholar] [CrossRef]
- Jeon, S.; Kim, J.; Lee, D.; Baik, J.W.; Kim, C. Review on Practical Photoacoustic Microscopy. Photoacoustics 2019, 15, 100141. [Google Scholar] [CrossRef]
- Nguyen, V.P.; Paulus, Y.M. Photoacoustic Ophthalmoscopy: Principle, Application, and Future Directions. J. Imaging 2018, 4, 149. [Google Scholar] [CrossRef]
- Liu, C.; Liang, Y.; Wang, L. Single-Shot Photoacoustic Microscopy of Hemoglobin Concentration, Oxygen Saturation, and Blood Flow in Sub-Microseconds. Photoacoustics 2020, 17, 100156. [Google Scholar] [CrossRef] [PubMed]
- Liu, C.; Wang, L. Functional Photoacoustic Microscopy of Hemodynamics: A Review. Biomed. Eng. Lett. 2022, 12, 97–124. [Google Scholar] [CrossRef] [PubMed]
- The U.S. National Institutes of Health (NIH). Photoacoustic Microscopy of Vascular Adaptation and Tissue Oxygen Metabolism during Cutaneous Wound Healing—PubMed. Available online: https://pubmed-ncbi-nlm-nih-gov.proxy.lib.umich.edu/35774317/ (accessed on 25 March 2024).
- Liu, W.; Yao, J. Photoacoustic Microscopy: Principles and Biomedical Applications. Biomed. Eng. Lett. 2018, 8, 203–213. [Google Scholar] [CrossRef] [PubMed]
- Ni, L.; Wang, X.; Xu, G. Photoacoustic Clinical Applications: Musculoskeletal and Abdominal Imaging. Z. Für Med. Phys. 2023, 33, 324–335. [Google Scholar] [CrossRef] [PubMed]
- Razansky, D. 4.19—Optoacoustic Imaging. In Comprehensive Biomedical Physics; Brahme, A., Ed.; Elsevier: Oxford, UK, 2014; pp. 281–300. ISBN 978-0-444-53633-4. [Google Scholar]
- Galetta, K.M.; Calabresi, P.A.; Frohman, E.M.; Balcer, L.J. Optical Coherence Tomography (OCT): Imaging the Visual Pathway as a Model for Neurodegeneration. Neurother. J. Am. Soc. Exp. Neurother. 2011, 8, 117–132. [Google Scholar] [CrossRef] [PubMed]
- Urfalioğlu, S.; Akkök, B.; Özdemir, G.; Daghan, B.; Guler, M. OCTA Evaluation of Posterior Ocular Blood Flow in Patients after COVID-19 Infection without Pneumonia. J. Fr. Ophtalmol. 2023, 46, 468–474. [Google Scholar] [CrossRef] [PubMed]
- Yamaguchi, S.; Maruko, I.; Maruko, R.; Hasegawa, T.; Iida, T. Blood Flow Pattern in Eye before Development of Type 3 Macular Neovascularization. PLoS ONE 2023, 18, e0283202. [Google Scholar] [CrossRef]
- Hua, D.; Xu, Y.; Heiduschka, P.; Zhang, W.; Zhang, X.; Zeng, X.; Zhu, X.; He, T.; Zheng, H.; Xiao, X.; et al. Retina Vascular Perfusion Dynamics During Exercise With and Without Face Masks in Healthy Young Adults: An OCT Angiography Study. Transl. Vis. Sci. Technol. 2021, 10, 23. [Google Scholar] [CrossRef]
- Rodriguez Torres, Y.; Lee, P.; Mihlstin, M.; Tomsak, R.L. Correlation Between Optic Disc Peripapillary Capillary Network and Papilledema Grading in Patients with Idiopathic Intracranial Hypertension: A Study of Optical Coherence Tomography Angiography. J. Neuro-Ophthalmol. 2021, 41, 48–53. [Google Scholar] [CrossRef]
- de Carlo, T.E.; Romano, A.; Waheed, N.K.; Duker, J.S. A Review of Optical Coherence Tomography Angiography (OCTA). Int. J. Retina Vitr. 2015, 1, 5. [Google Scholar] [CrossRef] [PubMed]
- Pichi, F.; Abboud, E.B.; Ghazi, N.G.; Khan, A.O. Fundus Autofluorescence Imaging in Hereditary Retinal Diseases. Acta Ophthalmol. 2018, 96, e549–e561. [Google Scholar] [CrossRef] [PubMed]
- Markan, A.; Agarwal, A.; Arora, A.; Bazgain, K.; Rana, V.; Gupta, V. Novel Imaging Biomarkers in Diabetic Retinopathy and Diabetic Macular Edema. Ther. Adv. Ophthalmol. 2020, 12, 2515841420950513. [Google Scholar] [CrossRef] [PubMed]
- Ruia, S.; Tripathy, K. Fluorescein Angiography. In StatPearls; StatPearls Publishing: Treasure Island, FL, USA, 2024. [Google Scholar]
- Elsharkawy, M.; Elrazzaz, M.; Sharafeldeen, A.; Alhalabi, M.; Khalifa, F.; Soliman, A.; Elnakib, A.; Mahmoud, A.; Ghazal, M.; El-Daydamony, E.; et al. The Role of Different Retinal Imaging Modalities in Predicting Progression of Diabetic Retinopathy: A Survey. Sensors 2022, 22, 3490. [Google Scholar] [CrossRef]
- Ahn, S.J. Editorial: Molecular Imaging in Retinal Diseases. Front. Med. 2023, 10, 1180330. [Google Scholar] [CrossRef] [PubMed]
- Szeto, S.K.-H.; Hui, V.W.K.; Siu, V.; Mohamed, S.; Chan, C.K.M.; Cheung, C.Y.L.; Hsieh, Y.T.; Tan, C.S.; Chhablani, J.; Lai, T.Y.Y.; et al. Recent Advances in Clinical Applications of Imaging in Retinal Diseases. Asia-Pac. J. Ophthalmol. 2023, 12, 252–263. [Google Scholar] [CrossRef]
- Kavalaraki, A.; Spyratou, E.; Kouri, M.A.; Efstathopoulos, E.P. Gold Nanoparticles as Contrast Agents in Ophthalmic Imaging. Optics 2023, 4, 74–99. [Google Scholar] [CrossRef]
- Jans, H.; Huo, Q. Gold Nanoparticle-Enabled Biological and Chemical Detection and Analysis. Chem. Soc. Rev. 2012, 41, 2849–2866. [Google Scholar] [CrossRef]
- Hu, X.; Zhang, Y.; Ding, T.; Liu, J.; Zhao, H. Multifunctional Gold Nanoparticles: A Novel Nanomaterial for Various Medical Applications and Biological Activities. Front. Bioeng. Biotechnol. 2020, 8, 990. [Google Scholar] [CrossRef]
- Son, H.Y.; Kim, K.R.; Hong, C.A.; Nam, Y.S. Morphological Evolution of Gold Nanoparticles into Nanodendrites Using Catechol-Grafted Polymer Templates. ACS Omega 2018, 3, 6683–6691. [Google Scholar] [CrossRef]
- Dreaden, E.C.; Alkilany, A.M.; Huang, X.; Murphy, C.J.; El-Sayed, M.A. The Golden Age: Gold Nanoparticles for Biomedicine. Chem. Soc. Rev. 2012, 41, 2740–2779. [Google Scholar] [CrossRef] [PubMed]
- Hassan, H.; Sharma, P.; Hasan, M.R.; Singh, S.; Thakur, D.; Narang, J. Gold Nanomaterials—The Golden Approach from Synthesis to Applications. Mater. Sci. Energy Technol. 2022, 5, 375–390. [Google Scholar] [CrossRef]
- Bharadwaj, K.K.; Rabha, B.; Pati, S.; Sarkar, T.; Choudhury, B.K.; Barman, A.; Bhattacharjya, D.; Srivastava, A.; Baishya, D.; Edinur, H.A.; et al. Green Synthesis of Gold Nanoparticles Using Plant Extracts as Beneficial Prospect for Cancer Theranostics. Molecules 2021, 26, 6389. [Google Scholar] [CrossRef]
- Jennings, T.; Strouse, G. Past, Present, and Future of Gold Nanoparticles. In Bio-Applications of Nanoparticles; Chan, W.C.W., Ed.; Springer: New York, NY, USA, 2007; pp. 34–47. ISBN 978-0-387-76713-0. [Google Scholar]
- Fan, J.; Cheng, Y.; Sun, M. Functionalized Gold Nanoparticles: Synthesis, Properties and Biomedical Applications. Chem. Rec. 2020, 20, 1474–1504. [Google Scholar] [CrossRef]
- He, M.-Q.; Ai, Y.; Hu, W.; Guan, L.; Ding, M.; Liang, Q. Recent Advances of Seed-Mediated Growth of Metal Nanoparticles: From Growth to Applications. Adv. Mater. 2023, 35, 2211915. [Google Scholar] [CrossRef]
- Filipczak, P.; Borkowski, M.; Chudobinski, P.; Bres, S.; Matusiak, M.; Nowaczyk, G.; Kozanecki, M. Sodium Citrate Stabilized Ag NPs under Thermal Treatment, Electron-Beam and Laser Irradiations. Radiat. Phys. Chem. 2020, 169, 107948. [Google Scholar] [CrossRef]
- Becerril-Castro, I.B.; Calderon, I.; Pazos-Perez, N.; Guerrini, L.; Schulz, F.; Feliu, N.; Chakraborty, I.; Giannini, V.; Parak, W.J.; Alvarez-Puebla, R.A. Gold Nanostars: Synthesis, Optical and SERS Analytical Properties. Anal. Sens. 2022, 2, e202200005. [Google Scholar] [CrossRef]
- Wall, M.A.; Harmsen, S.; Pal, S.; Zhang, L.; Arianna, G.; Lombardi, J.R.; Drain, C.M.; Kircher, M.F. Surfactant-Free Shape Control of Gold Nanoparticles Enabled by Unified Theoretical Framework of Nanocrystal Synthesis. Adv. Mater. Deerfield Beach Fla 2017, 29, 1605622. [Google Scholar] [CrossRef]
- Zhou, M.; Bron, M.; Schuhmann, W. Controlled Synthesis of Gold Nanostructures by a Thermal Approach. J. Nanosci. Nanotechnol. 2008, 8, 3465–3472. [Google Scholar] [CrossRef] [PubMed]
- Goncharova, D.; Salaev, M.; Volokitina, A.; Magaev, O.; Svetlichnyi, V.; Vodyankina, O. Gold-Based Catalysts Prepared by Pulsed Laser Ablation: A Review of Recent Advances. Mater. Today Chem. 2023, 33, 101709. [Google Scholar] [CrossRef]
- Panikkanvalappil, S.R.; Hooshmand, N.; El-Sayed, M.A. Intracellular Assembly of Nuclear-Targeted Gold Nanosphere Enables Selective Plasmonic Photothermal Therapy of Cancer by Shifting Their Absorption Wavelength toward Near-Infrared Region. Bioconjug. Chem. 2017, 28, 2452–2460. [Google Scholar] [CrossRef]
- Nguyen Thi Nhat, H.; Le, N.T.T.; Phuong Phong, N.T.; Nguyen, D.H.; Nguyen-Le, M.-T. Potential Application of Gold Nanospheres as a Surface Plasmon Resonance Based Sensor for In-Situ Detection of Residual Fungicides. Sensors 2020, 20, 2229. [Google Scholar] [CrossRef] [PubMed]
- Kim, J.; Yu, A.M.; Kubelick, K.P.; Emelianov, S.Y. Gold Nanoparticles Conjugated with DNA Aptamer for Photoacoustic Detection of Human Matrix Metalloproteinase-9. Photoacoustics 2021, 25, 100307. [Google Scholar] [CrossRef] [PubMed]
- Song, J.-T.; Yang, X.-Q.; Zhang, X.-S.; Yan, D.-M.; Yao, M.-H.; Qin, M.-Y.; Zhao, Y.-D. Composite Silica Coated Gold Nanosphere and Quantum Dots Nanoparticles for X-ray CT and Fluorescence Bimodal Imaging. Dalton Trans. 2015, 44, 11314–11320. [Google Scholar] [CrossRef] [PubMed]
- Kim, M.; Kim, J.; VanderLaan, D.; Kubelick, K.P.; Jhunjhunwala, A.; Choe, A.; Emelianov, S.Y. Tunable Interparticle Connectivity in Gold Nanosphere Assemblies for Efficient Photoacoustic Conversion. Adv. Funct. Mater. 2023, 33, 2305202. [Google Scholar] [CrossRef] [PubMed]
- Amarasekara, D.L.; Kariyawasam, C.S.; Hejny, M.A.; Torgall, V.B.; Werfel, T.A.; Fitzkee, N.C. Protein-Functionalized Gold Nanospheres with Tunable Photothermal Efficiency for the Near-Infrared Photothermal Ablation of Biofilms. ACS Appl. Mater. Interfaces 2024, 16, 4321–4332. [Google Scholar] [CrossRef]
- Trakoolwilaiwan, T.; Takeuchi, Y.; Leung, T.S.; Sebek, M.; Storozhuk, L.; Nguyen, L.; Tung, L.D.; Thanh, N.T.K. Development of a Thermochromic Lateral Flow Assay to Improve Sensitivity for Dengue Virus Serotype 2 NS1 Detection. Nanoscale 2023, 15, 12915–12925. [Google Scholar] [CrossRef]
- Salah, D.; Moghanm, F.S.; Arshad, M.; Alanazi, A.A.; Latif, S.; El-Gammal, M.I.; Shimaa, E.M.; Elsayed, S. Polymer-Peptide Modified Gold Nanorods to Improve Cell Conjugation and Cell Labelling for Stem Cells Photoacoustic Imaging. Diagnostics 2021, 11, 1196. [Google Scholar] [CrossRef]
- Jia, Y.; Liu, G.; Gordon, A.Y.; Gao, S.S.; Pechauer, A.D.; Stoddard, J.; McGill, T.J.; Jayagopal, A.; Huang, D. Spectral Fractionation Detection of Gold Nanorod Contrast Agents Using Optical Coherence Tomography. Opt. Express 2015, 23, 4212–4225. [Google Scholar] [CrossRef]
- Loke, Y.L.; Beishenaliev, A.; Wang, P.-W.; Lin, C.-Y.; Chang, C.-Y.; Foo, Y.Y.; Faruqu, F.N.; Leo, B.F.; Misran, M.; Chung, L.Y.; et al. ROS-Generating Alginate-Coated Gold Nanorods as Biocompatible Nanosonosensitisers for Effective Sonodynamic Therapy of Cancer. Ultrason. Sonochem. 2023, 96, 106437. [Google Scholar] [CrossRef] [PubMed]
- Sun, I.-C.; Dumani, D.S.; Emelianov, S.Y. Applications of the Photocatalytic and Photoacoustic Properties of Gold Nanorods in Contrast-Enhanced Ultrasound and Photoacoustic Imaging. ACS Nano 2024, 18, 3575–3582. [Google Scholar] [CrossRef] [PubMed]
- Bhavvya, M.B.; Tripathi, A.; Yadav, S.; John, N.S.; Thapa, R.; Altaee, A.; Saxena, M.; Samal, A.K. A Unique Bridging Facet Assembly of Gold Nanorods for the Detection of Thiram through Surface-Enhanced Raman Scattering. ACS Sustain. Chem. Eng. 2022, 10, 7330–7340. [Google Scholar] [CrossRef]
- Chen, Y.; Xu, C.; Cheng, Y.; Cheng, Q. Photostability Enhancement of Silica-Coated Gold Nanostars for Photoacoustic Imaging Guided Photothermal Therapy. Photoacoustics 2021, 23, 100284. [Google Scholar] [CrossRef]
- Nie, L.; Wang, S.; Wang, X.; Rong, P.; Ma, Y.; Liu, G.; Huang, P.; Lu, G.; Chen, X. In Vivo Volumetric Photoacoustic Molecular Angiography and Therapeutic Monitoring with Targeted Plasmonic Nanostars. Small 2014, 10, 1585–1593. [Google Scholar] [CrossRef]
- Atta, S.; Canning, A.J.; Odion, R.; Wang, H.; Hau, D.; Devadhasan, J.P.; Summers, A.J.; Gates-Hollingsworth, M.A.; Pflughoeft, K.J.; Gu, J.; et al. Sharp Branched Gold Nanostar-Based Lateral-Flow Immunoassay for Detection of Yersinia Pestis. ACS Appl. Nano Mater. 2023, 6, 3884–3892. [Google Scholar] [CrossRef]
- Zheng, F.; Martins, P.M.; Queirós, J.M.; Tavares, C.J.; Vilas-Vilela, J.L.; Lanceros-Méndez, S.; Reguera, J. Size Effect in Hybrid TiO2:Au Nanostars for Photocatalytic Water Remediation Applications. Int. J. Mol. Sci. 2022, 23, 13741. [Google Scholar] [CrossRef]
- Luo, L.; Luo, S.-Z.; Jia, B.-Z.; Zhang, W.-F.; Wang, H.; Wei, X.-Q.; Shen, Y.-D.; Lei, H.-T.; Xu, Z.-L.; Yang, J.-Y. A High-Resolution Colorimetric Immunoassay for Tyramine Detection Based on Enzyme-Enabled Growth of Gold Nanostar Coupled with Smartphone Readout. Food Chem. 2022, 396, 133729. [Google Scholar] [CrossRef]
- Zhang, R.; Thoröe-Boveleth, S.; Chigrin, D.N.; Kiessling, F.; Lammers, T.; Pallares, R.M. Nanoscale Engineering of Gold Nanostars for Enhanced Photoacoustic Imaging. J. Nanobiotechnol. 2024, 22, 115. [Google Scholar] [CrossRef] [PubMed]
- Theodorou, I.G.; Ruenraroengsak, P.; Gonzalez-Carter, D.A.; Jiang, Q.; Yagüe, E.; Aboagye, E.O.; Coombes, R.C.; Porter, A.E.; Ryan, M.P.; Xie, F. Towards Multiplexed Near-Infrared Cellular Imaging Using Gold Nanostar Arrays with Tunable Fluorescence Enhancement. Nanoscale 2019, 11, 2079–2088. [Google Scholar] [CrossRef]
- Pearl, W.G.; Perevedentseva, E.V.; Karmenyan, A.V.; Khanadeev, V.A.; Wu, S.-Y.; Ma, Y.-R.; Khlebtsov, N.G.; Cheng, C.-L. Multifunctional Plasmonic Gold Nanostars for Cancer Diagnostic and Therapeutic Applications. J. Biophotonics 2022, 15, e202100264. [Google Scholar] [CrossRef] [PubMed]
- Manivasagan, P.; Nguyen, V.T.; Jun, S.W.; Hoang, G.; Mondal, S.; Kim, H.; Doan, V.H.M.; Kim, J.; Kim, C.-S.; Oh, J. Anti-EGFR Antibody Conjugated Thiol Chitosan-Layered Gold Nanoshells for Dual-Modal Imaging-Guided Cancer Combination Therapy. J. Control. Release 2019, 311–312, 26–42. [Google Scholar] [CrossRef] [PubMed]
- Wang, L.; Patskovsky, S.; Gauthier-Soumis, B.; Meunier, M. Porous Au–Ag Nanoparticles from Galvanic Replacement Applied as Single-Particle SERS Probe for Quantitative Monitoring. Small 2022, 18, 2105209. [Google Scholar] [CrossRef]
- Dheyab, M.A.; Aziz, A.A.; Khaniabadi, P.M.; Jameel, M.S. Potential of a Sonochemical Approach to Generate MRI-PPT Theranostic Agents for Breast Cancer. Photodiagn. Photodyn. Ther. 2021, 33, 102177. [Google Scholar] [CrossRef] [PubMed]
- Bertok, T.; Lorencova, L.; Hroncekova, S.; Gajdosova, V.; Jane, E.; Hires, M.; Kasak, P.; Kaman, O.; Sokol, R.; Bella, V.; et al. Advanced Impedimetric Biosensor Configuration and Assay Protocol for Glycoprofiling of a Prostate Oncomarker Using Au Nanoshells with a Magnetic Core. Biosens. Bioelectron. 2019, 131, 24–29. [Google Scholar] [CrossRef] [PubMed]
- Zhang, Y.; Fan, J.; Zhao, J.; Xu, Z. A Biochip Based on Shell-Isolated Au@MnO2 Nanoparticle Array-Enhanced Fluorescence Effect for Simple and Sensitive Exosome Assay. Biosens. Bioelectron. 2022, 216, 114373. [Google Scholar] [CrossRef]
- Yang, G.; Pan, X.; Feng, W.; Yao, Q.; Jiang, F.; Du, F.; Zhou, X.; Xie, J.; Yuan, X. Engineering Au44 Nanoclusters for NIR-II Luminescence Imaging-Guided Photoactivatable Cancer Immunotherapy. ACS Nano 2023, 17, 15605–15614. [Google Scholar] [CrossRef]
- Hada, A.-M.; Craciun, A.-M.; Focsan, M.; Vulpoi, A.; Borcan, E.-L.; Astilean, S. Glutathione-Capped Gold Nanoclusters as near-Infrared-Emitting Efficient Contrast Agents for Confocal Fluorescence Imaging of Tissue-Mimicking Phantoms. Mikrochim. Acta 2022, 189, 337. [Google Scholar] [CrossRef]
- He, Y.Q.; Liu, S.P.; Kong, L.; Liu, Z.F. A Study on the Sizes and Concentrations of Gold Nanoparticles by Spectra of Absorption, Resonance Rayleigh Scattering and Resonance Non-Linear Scattering. Spectrochim. Acta A Mol. Biomol. Spectrosc. 2005, 61, 2861–2866. [Google Scholar] [CrossRef]
- Stone, J.; Jackson, S.; Wright, D. Biological Applications of Gold Nanorods. WIREs Nanomed. Nanobiotechnol. 2011, 3, 100–109. [Google Scholar] [CrossRef]
- Elahi, N.; Kamali, M.; Baghersad, M.H. Recent Biomedical Applications of Gold Nanoparticles: A Review. Talanta 2018, 184, 537–556. [Google Scholar] [CrossRef] [PubMed]
- Hosseinniay, S.; Rezayan, A.H.; Ghasemi, F.; Malekmohamadi, M.; Taheri, R.A.; Hosseini, M.; Alvandi, H. Fabrication and Evaluation of Optical Nanobiosensor Based on Localized Surface Plasmon Resonance (LSPR) of Gold Nanorod for Detection of CRP. Anal. Chim. Acta 2023, 1237, 340580. [Google Scholar] [CrossRef]
- Peixoto, L.P.F.; Santos, J.F.L.; Andrade, G.F.S. Surface Enhanced Fluorescence Immuno-Biosensor Based on Gold Nanorods. Spectrochim. Acta A Mol. Biomol. Spectrosc. 2023, 284, 121753. [Google Scholar] [CrossRef]
- Xi, Z.; Zhang, R.; Kiessling, F.; Lammers, T.; Pallares, R.M. Role of Surface Curvature in Gold Nanostar Properties and Applications. ACS Biomater. Sci. Eng. 2024, 10, 38–50. [Google Scholar] [CrossRef]
- An, L.; Wang, Y.; Tian, Q.; Yang, S. Small Gold Nanorods: Recent Advances in Synthesis, Biological Imaging, and Cancer Therapy. Materials 2017, 10, 1372. [Google Scholar] [CrossRef] [PubMed]
- Hu, J.; Rivero, F.; Torres, R.A.; Loro Ramírez, H.; Rodríguez, E.M.; Alfonso, F.; García Solé, J.; Jaque, D. Dynamic Single Gold Nanoparticle Visualization by Clinical Intracoronary Optical Coherence Tomography. J. Biophoton. 2017, 10, 674–682. [Google Scholar] [CrossRef] [PubMed]
- Shahidian, A.; Ghassemi, M.; Mohammadi, J.; Hashemi, M. 6—Laser-Assisted Cancer Treatment. In Bio-Engineering Approaches to Cancer Diagnosis and Treatment; Shahidian, A., Ghassemi, M., Mohammadi, J., Hashemi, M., Eds.; Academic Press: Cambridge, MA, USA, 2020; pp. 131–156. ISBN 978-0-12-817809-6. [Google Scholar]
- Singh, R.; Rajaraman, S.; Balasubramanian, M. A Novel Nanoparticle Mediated Selective Inner Retinal Photocoagulation (SIReP) for Diseases of the Inner Retina. IEEE Trans. Nanobiosci. 2017, 16, 542–554. [Google Scholar] [CrossRef]
- Chen, Y.; Meng, W.; Chen, M.; Zhang, L.; Chen, M.; Chen, X.; Peng, J.; Huang, N.; Zhang, W.; Chen, J. Biotin-Decorated Hollow Gold Nanoshells for Dual-Modal Imaging-Guided NIR-II Photothermal and Radiosensitizing Therapy toward Breast Cancer. J. Mater. Chem. B 2023, 11, 10003–10018. [Google Scholar] [CrossRef]
- Wang, Y.; Xie, X.; Wang, X.; Ku, G.; Gill, K.L.; O’Neal, D.P.; Stoica, G.; Wang, L.V. Photoacoustic Tomography of a Nanoshell Contrast Agent in the In Vivo Rat Brain. Nano Lett. 2004, 4, 1689–1692. [Google Scholar] [CrossRef]
- Kravets, V.V.; Ocola, L.E.; Khalavka, Y.; Pinchuk, A.O. Polarization and Distance Dependent Coupling in Linear Chains of Gold Nanoparticles. Appl. Phys. Lett. 2015, 106, 053104. [Google Scholar] [CrossRef]
- Zhang, C.; Gao, X.; Chen, W.; He, M.; Yu, Y.; Gao, G.; Sun, T. Advances of Gold Nanoclusters for Bioimaging. iScience 2022, 25, 105022. [Google Scholar] [CrossRef] [PubMed]
- Bai, Y.; Shu, T.; Su, L.; Zhang, X. Fluorescent Gold Nanoclusters for Biosensor and Bioimaging Application. Crystals 2020, 10, 357. [Google Scholar] [CrossRef]
- Nguyen, V.P.; Zhe, J.; Hu, J.; Ahmed, U.; Paulus, Y.M. Molecular and Cellular Imaging of the Eye. Biomed. Opt. Express 2023, 15, 360–386. [Google Scholar] [CrossRef] [PubMed]
- Choi, H.S.; Liu, W.; Misra, P.; Tanaka, E.; Zimmer, J.P.; Ipe, B.I.; Bawendi, M.G.; Frangioni, J.V. Renal Clearance of Nanoparticles. Nat. Biotechnol. 2007, 25, 1165–1170. [Google Scholar] [CrossRef] [PubMed]
- Wang, T.; Bai, J.; Jiang, X.; Nienhaus, G.U. Cellular Uptake of Nanoparticles by Membrane Penetration: A Study Combining Confocal Microscopy with FTIR Spectroelectrochemistry. ACS Nano 2012, 6, 1251–1259. [Google Scholar] [CrossRef] [PubMed]
- Zhang, M.; Gao, S.; Yang, D.; Fang, Y.; Lin, X.; Jin, X.; Liu, Y.; Liu, X.; Su, K.; Shi, K. Influencing Factors and Strategies of Enhancing Nanoparticles into Tumors In Vivo. Acta Pharm. Sin. B 2021, 11, 2265–2285. [Google Scholar] [CrossRef]
- Suk, J.S.; Xu, Q.; Kim, N.; Hanes, J.; Ensign, L.M. PEGylation as a Strategy for Improving Nanoparticle-Based Drug and Gene Delivery. Adv. Drug Deliv. Rev. 2016, 99, 28–51. [Google Scholar] [CrossRef]
- Karakoçak, B.B.; Raliya, R.; Davis, J.T.; Chavalmane, S.; Wang, W.-N.; Ravi, N.; Biswas, P. Biocompatibility of Gold Nanoparticles in Retinal Pigment Epithelial Cell Line. Toxicol. In Vitro 2016, 37, 61–69. [Google Scholar] [CrossRef]
- Raveendran, S.; Lim, H.-T.; Maekawa, T.; Matham, M.V.; Kumar, D.S. Gold Nanocages Entering into the Realm of High-Contrast Photoacoustic Ocular Imaging. Nanoscale 2018, 10, 13959–13968. [Google Scholar] [CrossRef]
- Nguyen, V.-P.; Li, Y.; Henry, J.; Zhang, W.; Wang, X.; Paulus, Y.M. Gold Nanorod Enhanced Photoacoustic Microscopy and Optical Coherence Tomography of Choroidal Neovascularization. ACS Appl. Mater. Interfaces 2021, 13, 40214–40228. [Google Scholar] [CrossRef]
- Nguyen, V.P.; Henry, J.; Zhe, J.; Kieu, Q.; Qian, W.; Fu, Y.; Wang, X.; Paulus, Y.M. Age Differential Response to Bevacizumab Therapy in Choroidal Neovascularization in Rabbits. Exp. Eye Res. 2022, 223, 109215. [Google Scholar] [CrossRef]
- Song, H.B.; Wi, J.-S.; Jo, D.H.; Kim, J.H.; Lee, S.-W.; Lee, T.G.; Kim, J.H. Intraocular Application of Gold Nanodisks Optically Tuned for Optical Coherence Tomography: Inhibitory Effect on Retinal Neovascularization without Unbearable Toxicity. Nanomed. Nanotechnol. Biol. Med. 2017, 13, 1901–1911. [Google Scholar] [CrossRef] [PubMed]
- Chemla, Y.; Betzer, O.; Markus, A.; Farah, N.; Motiei, M.; Popovtzer, R.; Mandel, Y. Gold Nanoparticles for Multimodal High-Resolution Imaging of Transplanted Cells for Retinal Replacement Therapy. Nanomed. 2019, 14, 1857–1871. [Google Scholar] [CrossRef] [PubMed]
- Nguyen, V.P.; Qian, W.; Wang, X.; Paulus, Y.M. Chapter Eighteen—Functionalized Contrast Agents for Multimodality Photoacoustic Microscopy, Optical Coherence Tomography, and Fluorescence Microscopy Molecular Retinal Imaging. In Methods in Enzymology; Chan, J., Ed.; Photoacoustic Probes for In Vivo Imaging; Academic Press: Cambridge, MA, USA, 2021; Volume 657, pp. 443–480. [Google Scholar]
- Zhang, X.-D.; Wu, H.-Y.; Wu, D.; Wang, Y.-Y.; Chang, J.-H.; Zhai, Z.-B.; Meng, A.-M.; Liu, P.-X.; Zhang, L.-A.; Fan, F.-Y. Toxicologic Effects of Gold Nanoparticles In Vivo by Different Administration Routes. Int. J. Nanomed. 2010, 5, 771–781. [Google Scholar] [CrossRef] [PubMed]
- Arvizo, R.R.; Miranda, O.R.; Thompson, M.A.; Pabelick, C.M.; Bhattacharya, R.; Robertson, J.D.; Rotello, V.M.; Prakash, Y.S.; Mukherjee, P. Effect of Nanoparticle Surface Charge at the Plasma Membrane and Beyond. Nano Lett. 2010, 10, 2543–2548. [Google Scholar] [CrossRef] [PubMed]
- Jin, Y.; Wang, H.; Yi, K.; Lv, S.; Hu, H.; Li, M.; Tao, Y. Applications of Nanobiomaterials in the Therapy and Imaging of Acute Liver Failure. Nano-Micro Lett. 2020, 13, 25. [Google Scholar] [CrossRef]
- Zhu, G.H.; Gray, A.B.C.; Patra, H.K. Nanomedicine: Controlling Nanoparticle Clearance for Translational Success. Trends Pharmacol. Sci. 2022, 43, 709–711. [Google Scholar] [CrossRef]
- Nguyen, V.P.; Li, Y.; Qian, W.; Liu, B.; Tian, C.; Zhang, W.; Huang, Z.; Ponduri, A.; Tarnowski, M.; Wang, X.; et al. Contrast Agent Enhanced Multimodal Photoacoustic Microscopy and Optical Coherence Tomography for Imaging of Rabbit Choroidal and Retinal Vessels In Vivo. Sci. Rep. 2019, 9, 5945. [Google Scholar] [CrossRef]
- Lapierre-Landry, M.; Gordon, A.Y.; Penn, J.S.; Skala, M.C. In Vivo Photothermal Optical Coherence Tomography of Endogenous and Exogenous Contrast Agents in the Eye. Sci. Rep. 2017, 7, 9228. [Google Scholar] [CrossRef]
- Kumar, P.P.P.; Lim, D.-K. Photothermal Effect of Gold Nanoparticles as a Nanomedicine for Diagnosis and Therapeutics. Pharmaceutics 2023, 15, 2349. [Google Scholar] [CrossRef]
- Khani, T.; Alamzadeh, Z.; Sarikhani, A.; Mousavi, M.; Mirrahimi, M.; Tabei, M.; Irajirad, R.; Abed, Z.; Beik, J. Fe3O4@Au Core–Shell Hybrid Nanocomposite for MRI-Guided Magnetic Targeted Photo-Chemotherapy. Lasers Med. Sci. 2022, 37, 2387–2395. [Google Scholar] [CrossRef] [PubMed]
- Yin, B.; Ho, W.K.H.; Xia, X.; Chan, C.K.W.; Zhang, Q.; Ng, Y.M.; Lam, C.Y.K.; Cheung, J.C.W.; Wang, J.; Yang, M.; et al. A Multilayered Mesoporous Gold Nanoarchitecture for Ultraeffective Near-Infrared Light-Controlled Chemo/Photothermal Therapy for Cancer Guided by SERS Imaging. Small 2023, 19, 2206762. [Google Scholar] [CrossRef] [PubMed]
- Manivasagan, P.; Bharathiraja, S.; Bui, N.Q.; Jang, B.; Oh, Y.-O.; Lim, I.G.; Oh, J. Doxorubicin-Loaded Fucoidan Capped Gold Nanoparticles for Drug Delivery and Photoacoustic Imaging. Int. J. Biol. Macromol. 2016, 91, 578–588. [Google Scholar] [CrossRef] [PubMed]
- Abbvie Clinical Trials. What Are the Phases of Clinical Trials|Clinical Trial Phases. Available online: https://www.abbvieclinicaltrials.com/resources/clinical-trial-phases/ (accessed on 24 May 2024).


Disclaimer/Publisher’s Note: The statements, opinions and data contained in all publications are solely those of the individual author(s) and contributor(s) and not of MDPI and/or the editor(s). MDPI and/or the editor(s) disclaim responsibility for any injury to people or property resulting from any ideas, methods, instructions or products referred to in the content. |
© 2024 by the authors. Licensee MDPI, Basel, Switzerland. This article is an open access article distributed under the terms and conditions of the Creative Commons Attribution (CC BY) license (https://creativecommons.org/licenses/by/4.0/).
Share and Cite
Park, S.; Nguyen, V.P.; Wang, X.; Paulus, Y.M. Gold Nanoparticles for Retinal Molecular Optical Imaging. Int. J. Mol. Sci. 2024, 25, 9315. https://doi.org/10.3390/ijms25179315
Park S, Nguyen VP, Wang X, Paulus YM. Gold Nanoparticles for Retinal Molecular Optical Imaging. International Journal of Molecular Sciences. 2024; 25(17):9315. https://doi.org/10.3390/ijms25179315
Chicago/Turabian StylePark, Sumin, Van Phuc Nguyen, Xueding Wang, and Yannis M. Paulus. 2024. "Gold Nanoparticles for Retinal Molecular Optical Imaging" International Journal of Molecular Sciences 25, no. 17: 9315. https://doi.org/10.3390/ijms25179315
APA StylePark, S., Nguyen, V. P., Wang, X., & Paulus, Y. M. (2024). Gold Nanoparticles for Retinal Molecular Optical Imaging. International Journal of Molecular Sciences, 25(17), 9315. https://doi.org/10.3390/ijms25179315