
MicroRNA Profiling in Papillary Thyroid Cancer

 ,
,  , , , ,
  , ,
, ,
Abstract
1. Introduction
2. Results
2.1. Study Population
2.2. Descriptive Analysis
2.3. Principal Component Analysis of Every Studied miRNA and Those with Significant Expression Differences
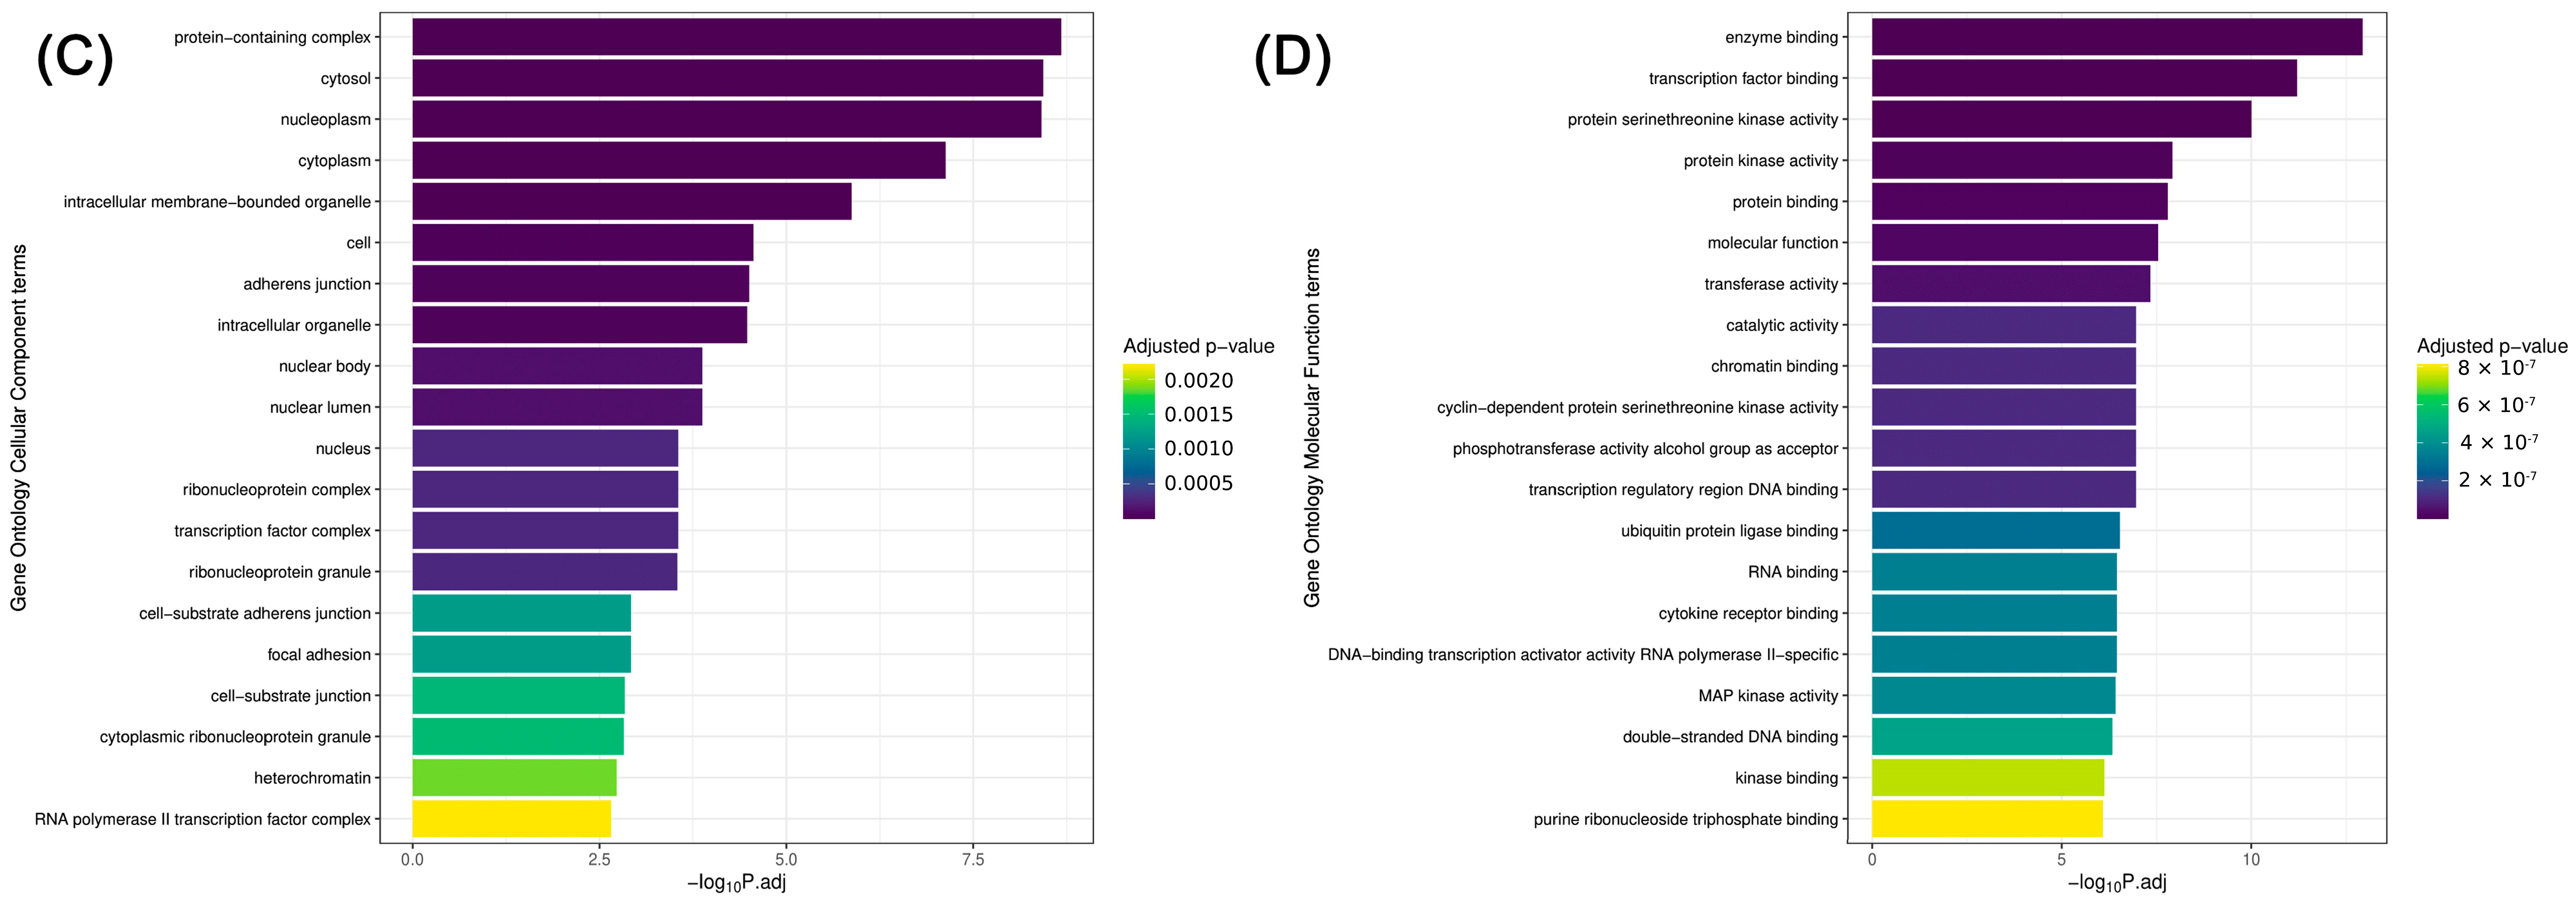
2.4. KEGG Pathway Analysis and Gene Ontology Biological Process, Cellular Component, and Molecular Function Enrichment Analyses Based on Statistically Significant (p ≤ 0.05) miRNAs (ORA—Over-Representation Analysis)
2.5. Association Analysis between miRNA Expressions and States of Selected Clinicopathological Variables
3. Discussion
4. Materials and Methods
4.1. Study Population, Sample Collection, and Histopathological Processing
4.2. Molecular Processing (miRNA Isolation, Quality Control (QC), miRNA Quantification, and Sequencing)
4.3. Data Analysis via Bioinformatics and Statistical Evaluation
4.4. Literature Review
5. Conclusions
Author Contributions
Funding
Institutional Review Board Statement
Informed Consent Statement
Data Availability Statement
Conflicts of Interest
References
- Bartel, D.P. Review MicroRNAs: Genomics, Biogenesis, Mechanism, and Function ulation of hematopoietic lineage differentiation in mam-mals (Chen et al., 2004), and control of leaf and flower development in plants (Aukerman and Sakai). Cell 2004, 116, 281–297. [Google Scholar] [CrossRef] [PubMed]
- Ambros, V. miRNAs Found by Genomics and Reverse Genetics [Internet]. 2004. Available online: www.nature.com/nature (accessed on 1 January 2024).
- Mazeh, H.; Levy, Y.; Mizrahi, I.; Appelbaum, L.; Ilyayev, N.; Halle, D.; Freund, H.R.; Nissan, A. Differentiating benign from malignant thyroid nodules using micro ribonucleic acid amplification in residual cells obtained by fine needle aspiration biopsy. J. Surg. Res. 2013, 180, 216–221. [Google Scholar] [CrossRef] [PubMed]
- Rossing, M.; Kaczkowski, B.; Futoma-Kazmierczak, E.; Glud, M.; Klausen, M.; Faber, J.; Nygaard, B.; Kiss, K.; Sørensen, C.H.; Nielsen, F.C.; et al. A simple procedure for routine RNA extraction and miRNA array analyses from a single thyroid in vivo fine needle aspirate. Scand. J. Clin. Lab. Investig. 2010, 70, 529–534. [Google Scholar] [CrossRef] [PubMed]
- Geropoulos, G.; Psarras, K.; Papaioannou, M.; Giannis, D.; Meitanidou, M.; Kapriniotis, K.; Symeonidis, N.; Pavlidis, E.T.; Pavlidis, T.E.; Sapalidis, K.; et al. Circulating microRNAs and Clinicopathological Findings of Papillary Thyroid Cancer: A Systematic Review. In Vivo 2022, 36, 1551–1569. [Google Scholar] [CrossRef]
- Ghafouri-Fard, S.; Shirvani-Farsani, Z.; Taheri, M. The role of microRNAs in the pathogenesis of thyroid cancer. Non-Coding RNA Res. 2020, 5, 88–98. [Google Scholar] [CrossRef]
- Ruiz-Pozo, V.A.; Cadena-Ullauri, S.; Guevara-Ramírez, P.; Paz-Cruz, E.; Tamayo-Trujillo, R.; Zambrano, A.K. Differential microRNA expression for diagnosis and prognosis of papillary thyroid cancer. Front. Med. 2023, 10, 1139362. [Google Scholar] [CrossRef]
- Sassi, Y.; Avramopoulos, P.; Ramanujam, D.P.; Grüter, L.; Werfel, S.; Giosele, S.; Brunner, A.-D.; Esfandyari, D.; Papadopoulou, A.-S.; De Strooper, B.; et al. Cardiac myocyte miR-29 promotes pathological remodeling of the heart by activating Wnt signaling. Nat. Commun. 2017, 8, 1614. [Google Scholar] [CrossRef]
- Reddy, S.; Hu, D.-Q.; Zhao, M.; Blay, E.; Sandeep, N.; Ong, S.-G.; Jung, G.; Kooiker, K.B.; Coronado, M.; Fajardo, G.; et al. miR-21 is associated with fibrosis and right ventricular failure. JCI Insight 2017, 2, e91625. [Google Scholar] [CrossRef]
- De Martinis, M.; Ginaldi, L.; Allegra, A.; Sirufo, M.M.; Pioggia, G.; Tonacci, A.; Gangemi, S. The osteoporosis/microbiota linkage: The role of miRNA. Int. J. Mol. Sci. 2020, 21, 8887. [Google Scholar] [CrossRef]
- Ghaffari, M.; Razi, S.; Zalpoor, H.; Nabi-Afjadi, M.; Mohebichamkhorami, F.; Zali, H. Association of MicroRNA-146a with Type 1 and 2 Diabetes and their Related Complications. J. Diabetes Res. 2023, 2023, 2587104. [Google Scholar] [CrossRef]
- Nielsen, L.B.; Wang, C.; Sørensen, K.; Bang-Berthelsen, C.H.; Hansen, L.; Andersen, M.-L.M.; Hougaard, P.; Juul, A.; Zhang, C.-Y.; Pociot, F.; et al. Circulating levels of MicroRNA from children with newly diagnosed type 1 diabetes and healthy controls: Evidence that miR-25 associates to residual beta-cell function and glycaemic control during disease progression. Exp. Diabetes Res. 2012, 2012, 896362. [Google Scholar]
- Xie, Y.; Zhang, L.; Gao, Y.; Ge, W.; Tang, P. The multiple roles of microrna-223 in regulating bone metabolism. Molecules 2015, 20, 19433–19448. [Google Scholar] [CrossRef] [PubMed]
- Plotkin, L.I.; Wallace, J.M. MicroRNAs and osteocytes. Bone 2021, 150, 115994. [Google Scholar] [CrossRef]
- Li, M.P.; Hu, Y.D.; Hu, X.L.; Zhang, Y.J.; Yang, Y.L.; Jiang, C.; Tang, J.; Chen, X.P. MiRNAs and miRNA polymorphisms modify drug response. Int. J. Environ. Res. Public Health 2016, 13, 1096. [Google Scholar] [CrossRef] [PubMed]
- Esquela-Kerscher, A.; Slack, F.J. Oncomirs—MicroRNAs with a role in cancer. Nat. Rev. Cancer 2006, 6, 259–269. [Google Scholar] [CrossRef] [PubMed]
- Ab Mutalib, N.S.; Othman, S.N.; Yusof, A.M.; Suhaimi, S.N.A.; Muhammad, R.; Jamal, R. Integrated microRNA, gene expression and transcription factors signature in papillary thyroid cancer with lymph node metastasis. PeerJ 2016, 2016, e2119. [Google Scholar] [CrossRef]
- Li, X.; Abdel-Mageed, A.B.; Mondal, D.; Kandil, E. MicroRNA expression profiles in differentiated thyroid cancer, a review. Int. J. Clin. Exp. Med. 2013, 6, 74–80. [Google Scholar]
- Le, F.; Luo, P.; Yang, Q.O.; Zhong, X.M. MiR-181a promotes growth of thyroid cancer cells by targeting tumor suppressor RB1. Eur. Rev. Med. Pharmacol. Sci. 2017, 21, 5638–5647. [Google Scholar]
- Calin, G.A.; Croce, C.M. MicroRNA signatures in human cancers. Nat. Rev. Cancer 2006, 6, 857–866. [Google Scholar] [CrossRef]
- Toraih, E.A.; Fawzy, M.S.; Hussein, M.H.; El-Labban, M.M.; Ruiz, E.M.L.; Attia, A.A.; Halat, S.; Moroz, K.; Errami, Y.; Zerfaoui, M.; et al. MicroRNA-based risk score for predicting tumor progression following radioactive iodine ablation in well-differentiated thyroid cancer patients: A propensity-score matched analysis. Cancers 2021, 13, 4649. [Google Scholar] [CrossRef] [PubMed]
- Chen, Y.T.; Kitabayashi, N.; Zhou, X.K.; Fahey, T.J.; Scognamiglio, T. MicroRNA analysis as a potential diagnostic tool for papillary thyroid carcinoma. Mod. Pathol. 2008, 21, 1139–1146. [Google Scholar] [CrossRef] [PubMed]
- Nikiforova, M.N.; Tseng, G.C.; Steward, D.; Diorio, D.; Nikiforov, Y.E. MicroRNA expression profiling of thyroid tumors: Biological significance and diagnostic utility. J. Clin. Endocrinol. Metab. 2008, 93, 1600–1608. [Google Scholar] [CrossRef] [PubMed]
- Cancer Genome Atlas Research Network. Integrated Genomic Characterization of Papillary Thyroid Carcinoma. Cell 2014, 159, 676–690. [Google Scholar] [CrossRef]
- Bertol, B.C.; Massaro, J.D.; Debortoli, G.; Santos, A.L.P.; de Araújo, J.N.G.; Giorgenon, T.M.V.; e Silva, M.C.; de Figueiredo-Feitosa, N.L.; Collares, C.V.A.; de Freitas, L.C.C.; et al. BRAF, TERT and HLA-G Status in the Papillary Thyroid Carcinoma: A Clinicopathological Association Study. Int. J. Mol. Sci. 2023, 24, 12459. [Google Scholar] [CrossRef] [PubMed]
- Yusof, A.M.; Jamal, R.; Muhammad, R.; Suhaimi, S.N.A.; Rose, I.M.; Saidin, S.; Ab Mutalib, N.-S. Integrated characterization of MicroRNA and mRNA transcriptome in papillary thyroid carcinoma. Front. Endocrinol. 2018, 9, 158. [Google Scholar]
- Santiago, K.; Chen Wongworawat, Y.; Khan, S. Differential MicroRNA-Signatures in Thyroid Cancer Subtypes. J. Oncol. 2020, 2020, 2052396. [Google Scholar] [CrossRef]
- Ricarte-Filho, J.C.; Casado-Medrano, V.; Reichenberger, E.; Spangler, Z.; Scheerer, M.; Isaza, A.; Baran, J.; Patel, T.; MacFarland, S.P.; Brodeur, G.M.; et al. DICER1 RNase IIIb domain mutations trigger widespread miRNA dysregulation and MAPK activation in pediatric thyroid cancer. Front. Endocrinol. 2023, 14, 1083382. [Google Scholar] [CrossRef]
- Pallante, P.; Visone, R.; Ferracin, M.; Ferraro, A.; Berlingieri, M.T.; Troncone, G.; Chiappetta, G.; Liu, C.G.; Santoro, M.; Negrini, M.; et al. MicroRNA deregulation in human thyroid papillary carcinomas. Endocr. Relat. Cancer 2006, 13, 497–508. [Google Scholar] [CrossRef]
- He, H.; Jazdzewski, K.; Li, W.; Liyanarachchi, S.; Nagy, R.; Volinia, S.; Calin, G.A.; Liu, C.G.; Franssila, K.; Suster, S.; et al. The role of microRNA genes in papillary thyroid carcinoma. Proc. Natl. Acad. Sci. USA 2005, 102, 19075–19080. [Google Scholar] [CrossRef]
- Chou, C.K.; Chen, R.F.; Chou, F.F.; Chang, H.W.; Chen, Y.J.; Lee, Y.F.; Yang, K.D.; Cheng, J.T.; Huang, C.C.; Liu, R.T. miR-146b is Highly Expressed in Adult Papillary Thyroid Carcinomas with High Risk Features Including Extrathyroidal Invasion and the BRAF V600E Mutation. Thyroid 2010, 20, 489–494. [Google Scholar] [CrossRef]
- Hatmal, M.M.; Al-Hatamleh, M.A.I.; Olaimat, A.N.; Alshaer, W.; Hasan, H.; Albakri, K.A.; Alkhafaji, E.; Issa, N.N.; Al-Holy, M.A.; Abderrahman, S.M.; et al. MiRNA-221/222 in thyroid cancer: A meta-analysis. Clin. Chim. Acta 2018, 484, 284–292. [Google Scholar]
- Gómez-Pérez, A.M.; Cornejo Pareja, I.M.; García Alemán, J.; Coín Aragüez, L.; Sebastián Ochoa, A.; Alcaide Torres, J.; Molina Vega, M.; Clu Fernández, C.; Mancha Doblas, I.; Tinahones, F.J. New molecular biomarkers in differentiated thyroid carcinoma: Impact of miR-146, miR-221 and miR-222 levels in the evolution of the disease. Clin. Endocrinol. 2019, 91, 187–194. [Google Scholar] [CrossRef] [PubMed]
- Chou, C.-K.; Yang, K.D.; Chou, F.-F.; Huang, C.-C.; Lan, Y.-W.; Lee, Y.-F.; Kang, H.-Y.; Liu, R.-T. Prognostic implications of miR-146b expression and its functional role in papillary thyroid carcinoma. J. Clin. Endocrinol. Metab. 2013, 98, E196–E205. [Google Scholar] [CrossRef]
- Deng, X.; Wu, B.; Xiao, K.; Kang, J.; Xie, J.; Zhang, X.; Fan, Y. MiR-146b-5p promotes metastasis and induces epithelial-mesenchymal transition in thyroid cancer by targeting ZNRF3. Cell. Physiol. Biochem. 2015, 35, 71–82. [Google Scholar] [CrossRef] [PubMed]
- Khan, R.; Riaz, A.; Abbasi, S.A.; Sadaf, T.; Baig, R.M.; Mansoor, Q. Identification of transcriptional level variations in microRNA-221 and microRNA-222 as alternate players in the thyroid cancer tumor microenvironment. Sci. Rep. 2023, 13, 15800. [Google Scholar] [CrossRef] [PubMed]
- Pishkari, S.; Paryan, M.; Hashemi, M.; Baldini, E.; Mohammadi-Yeganeh, S. The role of microRNAs in different types of thyroid carcinoma: A comprehensive analysis to find new miRNA supplementary therapies. J. Endocrinol. Investig. 2018, 41, 269–283. [Google Scholar] [CrossRef]
- Liu, L.; Wang, J.; Li, X.; Ma, J.; Shi, C.; Zhu, H.; Xi, Q.; Zhang, J.; Zhao, X.; Gu, M. MiR-204-5p suppresses cell proliferation by inhibiting IGFBP5 in papillary thyroid carcinoma. Biochem. Biophys. Res. Commun. 2015, 457, 621–626. [Google Scholar] [CrossRef]
- Schwertheim, S.; Sheu, S.Y.; Worm, K.; Grabellus, F.; Schmid, K.W. Analysis of deregulated miRNAs is helpful to distinguish poorly differentiated thyroid carcinoma from papillary thyroid carcinoma. Horm. Metab. Res. 2009, 41, 475–481. [Google Scholar] [CrossRef]
- Park, J.L.; Kim, S.K.; Jeon, S.; Jung, C.K.; Kim, Y.S. Microrna profile for diagnostic and prognostic biomarkers in thyroid cancer. Cancers 2021, 13, 632. [Google Scholar] [CrossRef]
- Haugen, B.R.; Alexander, E.K.; Bible, K.C.; Doherty, G.M.; Mandel, S.J.; Nikiforov, Y.E.; Pacini, F.; Randolph, G.W.; Sawka, A.M.; Schlumberger, M.; et al. 2015 American Thyroid Association Management Guidelines for Adult Patients with Thyroid Nodules and Differentiated Thyroid Cancer: The American Thyroid Association Guidelines Task Force on Thyroid Nodules and Differentiated Thyroid Cancer. Thyroid 2016, 26, 1–133. [Google Scholar] [CrossRef]
- Kanehisa, M.; Furumichi, M.; Tanabe, M.; Sato, Y.; Morishima, K. KEGG: New perspectives on genomes, pathways, diseases and drugs. Nucleic Acids Res. 2017, 45, D353–D361. [Google Scholar] [CrossRef] [PubMed]
- KEGG Pathways. Available online: https://www.genome.jp/kegg/ (accessed on 1 January 2024).
- The Gene Ontology Consortium; A Aleksander, S.; Balhoff, J.; Carbon, S.; Cherry, J.M.; Drabkin, H.J.; Ebert, D.; Feuermann, M.; Gaudet, P.; Harris, N.L.; et al. The Gene Ontology knowledgebase in 2023. Genetics 2023, 224, iyad031. [Google Scholar] [PubMed]
- Ashburner, M.; Ball, C.A.; Blake, J.A.; Botstein, D.; Butler, H.; Cherry, J.M.; Davis, A.P.; Dolinski, K.; Dwight, S.S.; Eppig, J.T.; et al. Gene Ontology: Tool for the unification of biology The Gene Ontology Consortium. Nat. Genet. 2000, 25, 25–29. [Google Scholar] [CrossRef] [PubMed]
- GeneOntology. Available online: https://geneontology.org/ (accessed on 1 January 2024).
- Abdullah, M.I.; Junit, S.M.; Ng, K.L.; Jayapalan, J.J.; Karikalan, B.; Hashim, O.H. Papillary thyroid cancer: Genetic alterations and molecular biomarker investigations. Int. J. Med. Sci. 2019, 16, 450–460. [Google Scholar] [CrossRef] [PubMed]
- Hu, Y.; Wang, H.; Chen, E.; Xu, Z.; Chen, B.; Lu, G. Candidate microRNAs as biomarkers of thyroid carcinoma: A systematic review, meta-analysis, and experimental validation. Cancer Med. 2016, 5, 2602–2614. [Google Scholar] [CrossRef]
- Silaghi, C.A.; Lozovanu, V.; Silaghi, H.; Georgescu, R.D.; Pop, C.; Dobrean, A.; Georgescu, C.E. The prognostic value of micrornas in thyroid cancers—A systematic review and meta-analysis. Cancers 2020, 12, 2608. [Google Scholar] [CrossRef]
- Geraldo, M.V.; Yamashita, A.S.; Kimura, E.T. MicroRNA miR-146b-5p regulates signal transduction of TGF-Β by repressing SMAD4 in thyroid cancer. Oncogene 2012, 31, 1910–1922. [Google Scholar] [CrossRef]
- McLeod, D.S.A.; Zhang, L.; Durante, C.; Cooper, D.S. Contemporary debates in adult papillary thyroid cancer management. Endocr. Rev. 2019, 40, 1481–1499. [Google Scholar] [CrossRef]
- Yip, L.; Kelly, L.; Shuai, Y.; Armstrong, M.J.; Nikiforov, Y.E.; Carty, S.E.; Nikiforova, M.N. MicroRNA signature distinguishes the degree of aggressiveness of papillary thyroid carcinoma. Ann. Surg. Oncol. 2011, 18, 2035–2041. [Google Scholar] [CrossRef]
- Stojanović, S.; Šelemetjev, S.; Đorić, I.; Miljuš, J.J.; Tatić, S.; Živaljević, V.; Denčić, T.I. BRAFV600E, BANCR, miR-203a-3p and miR-204-3p in Risk Stratification of PTC Patients. Biomedicines 2023, 11, 3338. [Google Scholar] [CrossRef]
- Sheu, S.Y.; Grabellus, F.; Schwertheim, S.; Handke, S.; Worm, K.; Schmid, K.W. Lack of correlation between BRAF V600E mutational status and the expression profile of a distinct set of miRNAs in papillary thyroid carcinoma. Horm. Metab. Res. 2009, 41, 482–487. [Google Scholar] [CrossRef]
- Nixon, A.M.; Provatopoulou, X.; Kalogera, E.; Zografos, G.N.; Gounaris, A. Circulating thyroid cancer biomarkers: Current limitations and future prospects. Clin. Endocrinol. 2017, 87, 117–126. [Google Scholar] [CrossRef] [PubMed]
- Stokowy, T.; Wojtas, B.; Jarzab, B.; Krohn, K.; Fredman, D.; Dralle, H.; Musholt, T.; Hauptmann, S.; Lange, D.; Hegedüs, L.; et al. Two-miRNA classifiers differentiate mutation-negative follicular thyroid carcinomas and follicular thyroid adenomas in fine needle aspirations with high specificity. Endocrine 2016, 54, 440–447. [Google Scholar] [CrossRef] [PubMed]
- Zang, Y.; Zhu, J.; Li, Q.; Tu, J.; Li, X.; Hu, R.; Yang, D. Mir-137-3p modulates the progression of prostate cancer by regulating the JNK3/EZH2 axis. Onco. Targets Ther. 2020, 13, 7921–7932. [Google Scholar] [CrossRef] [PubMed]
- Mazurek, M.; Mlak, R.; Homa-Mlak, I.; Powrózek, T.; Brzozowska, A.; Kwaśniewski, W.; Opielak, G.; Małecka-Massalska, T. Low miR 511-5p Expression as a Potential Predictor of a Poor Nutritional Status in Head and Neck Cancer Patients Subjected to Intensity-Modulated Radiation Therapy. J. Clin. Med. 2022, 11, 805. [Google Scholar] [CrossRef]
- Qiao, D.H.; He, X.M.; Deng, X.; Ji, Y.C.; Yang, H.; Cheng, L.; Zhou, X.Y. Aberrant expression of five miRNAs in papillary thyroid carcinomas. J. Clin. Lab. Anal. 2021, 35, e23907. [Google Scholar] [CrossRef]
- Swierniak, M.; Wojcicka, A.; Czetwertynska, M.; Stachlewska, E.; Maciag, M.; Wiechno, W.; Gornicka, B.; Bogdanska, M.; Koperski, L.; de la Chapelle, A.; et al. In-depth characterization of the MicroRNA transcriptome in normal thyroid and papillary thyroid carcinoma. J. Clin. Endocrinol. Metab. 2013, 98, E1401–E1409. [Google Scholar] [CrossRef]
- Ji, T.; Gao, L.; Yu, Z. Tumor-suppressive microRNA-551b-3p targets H6PD to inhibit gallbladder cancer progression. Cancer Gene Ther. 2021, 28, 693–705. [Google Scholar] [CrossRef]
- Bai, S.Y.; Ji, R.; Wei, H.; Guo, Q.H.; Yuan, H.; Chen, Z.F.; Wang, Y.P.; Liu, Z.; Yang, X.Y.; Zhou, Y.N. Serum miR-551b-3p is a potential diagnostic biomarker for gastric cancer. Turk. J. Gastroenterol. 2019, 30, 415–419. [Google Scholar] [CrossRef]
- Kondrotienė, A.; Daukša, A.; Pamedytytė, D.; Kazokaitė, M.; Žvirblienė, A.; Daukšienė, D.; Simanavičienė, V.; Klimaitė, R.; Golubickaitė, I.; Stakaitis, R.; et al. Papillary thyroid carcinoma tissue mir-146b,-21,-221,-222,-181b expression in relation with clinicopathological features. Diagnostics 2021, 11, 418. [Google Scholar] [CrossRef]
- Zhang, T.; Chen, Y.; Lin, W.; Zheng, J.; Liu, Y.; Zou, J.; Cai, J.; Chen, Y.; Li, Z.; Chen, Y. Prognostic and Immune-Infiltrate Significance of miR-222-3p and Its Target Genes in Thyroid Cancer. Front. Genet. 2021, 12, 710412. [Google Scholar] [CrossRef] [PubMed]
- Dell’aquila, M.; Granitto, A.; Martini, M.; Capodimonti, S.; Cocomazzi, A.; Musarra, T.; Fiorentino, V.; Pontecorvi, A.; Lombardi, C.P.; Fadda, G.; et al. PD-L1 and thyroid cytology: A possible diagnostic and prognostic marker. Cancer Cytopathol. 2020, 128, 177–189. [Google Scholar] [CrossRef] [PubMed]
- Martini, M.; de Pascalis, I.; D’alessandris, Q.G.; Fiorentino, V.; Pierconti, F.; Marei, H.E.-S.; Ricci-Vitiani, L.; Pallini, R.; Larocca, L.M. VEGF-121 plasma level as biomarker for response to anti-angiogenetic therapy in recurrent glioblastoma. BMC Cancer 2018, 18, 553. [Google Scholar] [CrossRef] [PubMed]
- Papaioannou, M.; Chorti, A.G.; Chatzikyriakidou, A.; Giannoulis, K.; Bakkar, S.; Papavramidis, T.S. MicroRNAs in Papillary Thyroid Cancer: What Is New in Diagnosis and Treatment. Front. Oncol. 2022, 11, 755097. [Google Scholar] [CrossRef]
- YLam, A.K.; Coast, G.; Yau Lo, C.; King-Yin Lam, A.; Lo, C.Y.; Siu-Ling Lam, K. Papillary Carcinoma of Thyroid: A 30-yr Clinicopathological Review of the Histological Variants. Endocr. Pathol. 2005, 16, 323–330. [Google Scholar]
- Almukhtar, Z.K. Histopathological Types of Papillary Thyroid Carcinoma: Clinicopathologic Study. Open Access Maced. J. Med. Sci. 2022, 10, 79–83. [Google Scholar] [CrossRef]


| PTC Subtype | n= | % |
|---|---|---|
| Conventional | 96 | 81.35 |
| Follicular subtype | 16 | 13.56 |
| Oncocytic | 4 | 3.39 |
| Columnar cell | 1 | 0.85 |
| Warthin-like | 1 | 0.85 |
| All PTC subtypes | 118 | 100 |
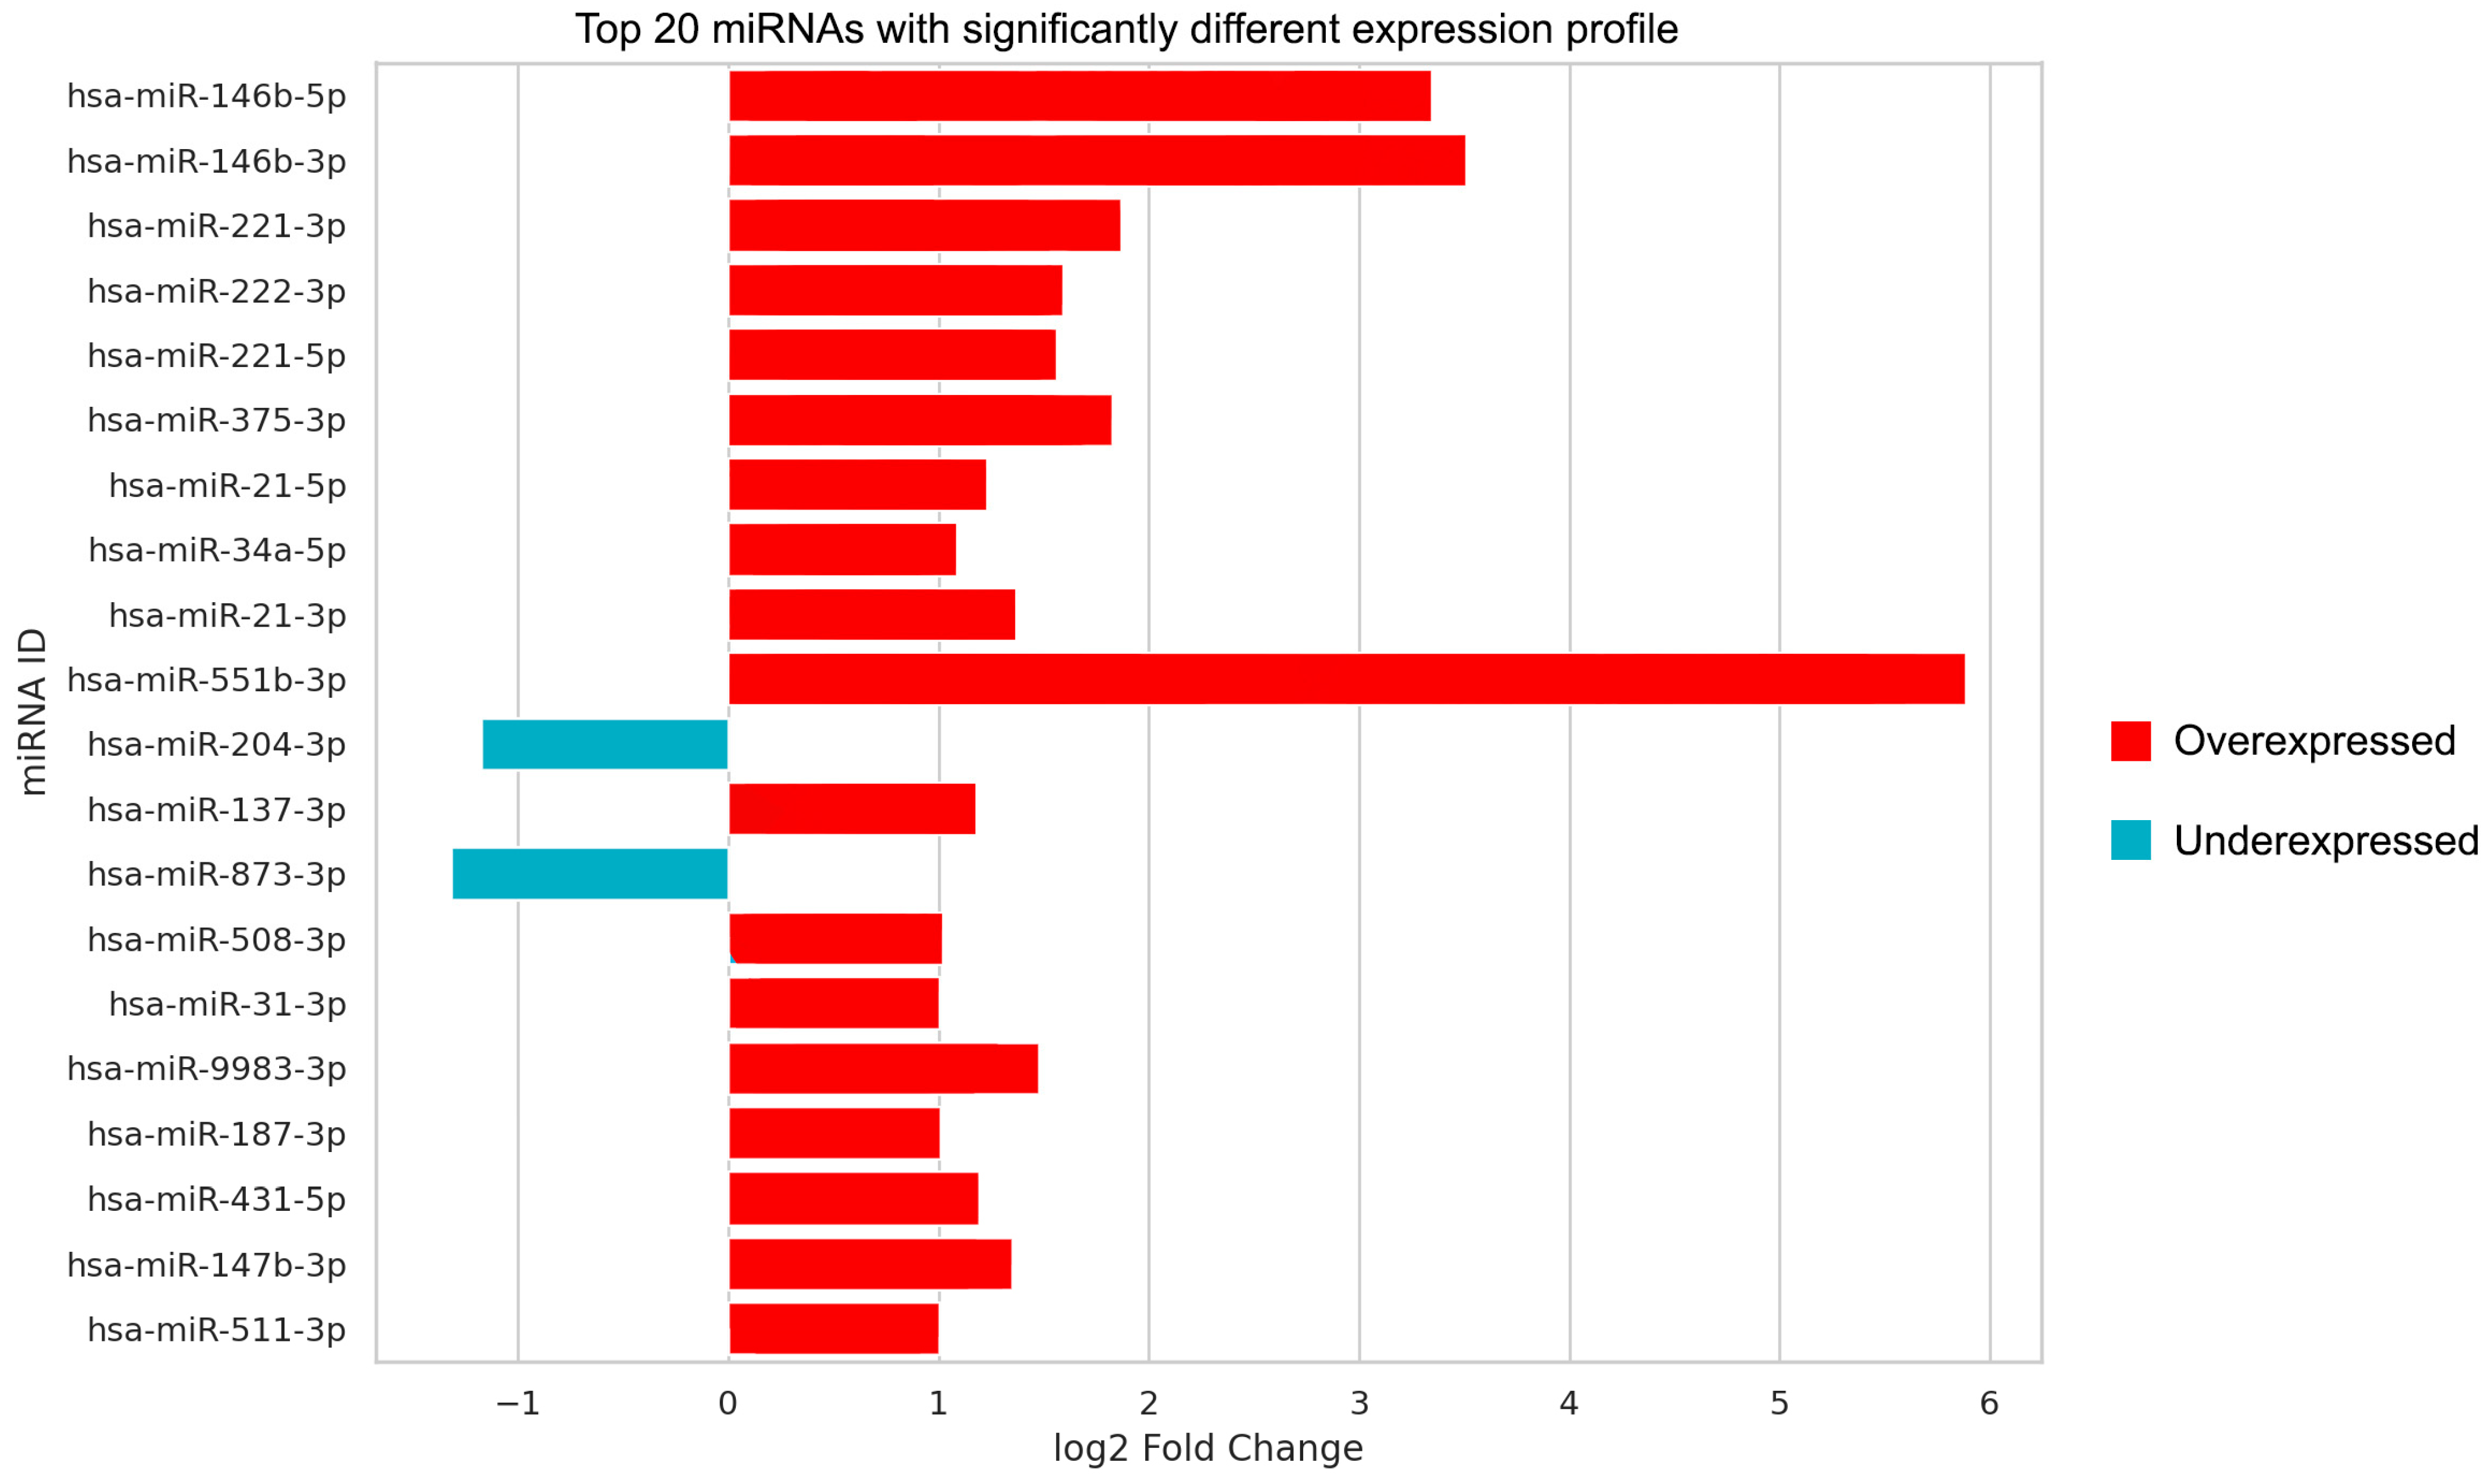
| miRNA | log2 FC | SE | FDR-Corrected p |
|---|---|---|---|
| hsa-miR-21-5p | 1.227 | 0.130 | 3.969 × 10⁻¹⁹ |
| hsa-miR-21-3p | 1.364 | 0.163 | 3.926 × 10⁻¹⁵ |
| hsa-miR-31-3p | 1.004 | 0.164 | 3.018 × 10⁻⁸ |
| hsa-miR-34a-5p | 1.084 | 0.120 | 1.999 × 10⁻¹⁷ |
| hsa-miR-187-3p | 1.005 | 0.176 | 2.520 × 10⁻⁷ |
| hsa-miR-221-5p | 1.560 | 0.144 | 4.208 × 10⁻²⁵ |
| hsa-miR-221-3p | 1.866 | 0.153 | 8.969 × 10⁻³² |
| hsa-miR-222-5p | 1.035 | 0.353 | 0.01644 |
| hsa-miR-222-3p | 1.591 | 0.135 | 6.766 × 10⁻³⁰ |
| hsa-miR-137-3p | 1.175 | 0.175 | 9.120 × 10⁻¹⁰ |
| hsa-miR-375-3p | 1.823 | 0.178 | 1.694 × 10⁻²² |
| hsa-miR-376a-5p | 1.475 | 0.381 | 8.764 × 10⁻⁴ |
| hsa-miR-431-5p | 1.189 | 0.209 | 2.520 × 10⁻⁷ |
| hsa-miR-511-3p | 1.003 | 0.201 | 8.883 × 10⁻⁶ |
| hsa-miR-146b-5p | 3.345 | 0.202 | 1.294 × 10−58 |
| hsa-miR-146b-3p | 3.507 | 0.245 | 4.798 × 10−44 |
| hsa-miR-508-3p | 1.017 | 0.159 | 5.819 × 10⁻⁹ |
| hsa-miR-510-5p | 1.147 | 0.415 | 0.0251 |
| hsa-miR-514a-5p | 1.229 | 0.350 | 0.0031 |
| hsa-miR-556-5p | 1.333 | 0.312 | 1.913 × 10⁻⁴ |
| hsa-miR-551b-5p | 2.166 | 0.589 | 0.0017 |
| hsa-miR-551b-3p | 5.884 | 0.797 | 1.006 × 10⁻¹¹ |
| hsa-miR-147b-3p | 1.351 | 0.267 | 6.713 × 10⁻⁶ |
| hsa-miR-1277-5p | 1.064 | 0.415 | 0.0405 |
| hsa-miR-514b-5p | 1.245 | 0.278 | 9.230 × 10⁻⁵ |
| hsa-miR-4695-3p | 1.034 | 0.389 | 0.0317 |
| hsa-miR-9983-3p | 1.479 | 0.253 | 1.247 × 10⁻⁷ |
| hsa-miR-204-3p | −1.175 | 0.170 | 2.675 × 10⁻¹⁰ |
| hsa-miR-206 | −2.273 | 0.488 | 4.060 × 10⁻⁵ |
| hsa-miR-873-3p | −1.316 | 0.197 | 9.781 × 10⁻¹⁰ |
Disclaimer/Publisher’s Note: The statements, opinions and data contained in all publications are solely those of the individual author(s) and contributor(s) and not of MDPI and/or the editor(s). MDPI and/or the editor(s) disclaim responsibility for any injury to people or property resulting from any ideas, methods, instructions or products referred to in the content. |
© 2024 by the authors. Licensee MDPI, Basel, Switzerland. This article is an open access article distributed under the terms and conditions of the Creative Commons Attribution (CC BY) license (https://creativecommons.org/licenses/by/4.0/).
Share and Cite
Armos, R.; Bojtor, B.; Papp, M.; Illyes, I.; Lengyel, B.; Kiss, A.; Szili, B.; Tobias, B.; Balla, B.; Piko, H.; et al. MicroRNA Profiling in Papillary Thyroid Cancer. Int. J. Mol. Sci. 2024, 25, 9362. https://doi.org/10.3390/ijms25179362
Armos R, Bojtor B, Papp M, Illyes I, Lengyel B, Kiss A, Szili B, Tobias B, Balla B, Piko H, et al. MicroRNA Profiling in Papillary Thyroid Cancer. International Journal of Molecular Sciences. 2024; 25(17):9362. https://doi.org/10.3390/ijms25179362
Chicago/Turabian StyleArmos, Richard, Bence Bojtor, Marton Papp, Ildiko Illyes, Balazs Lengyel, Andras Kiss, Balazs Szili, Balint Tobias, Bernadett Balla, Henriett Piko, and et al. 2024. "MicroRNA Profiling in Papillary Thyroid Cancer" International Journal of Molecular Sciences 25, no. 17: 9362. https://doi.org/10.3390/ijms25179362
APA StyleArmos, R., Bojtor, B., Papp, M., Illyes, I., Lengyel, B., Kiss, A., Szili, B., Tobias, B., Balla, B., Piko, H., Illes, A., Putz, Z., Kiss, A., Toth, E., Takacs, I., Kosa, J. P., & Lakatos, P. (2024). MicroRNA Profiling in Papillary Thyroid Cancer. International Journal of Molecular Sciences, 25(17), 9362. https://doi.org/10.3390/ijms25179362