
Exploring the Anticancer Potential of Phenolic nor-Triterpenes from Celastraceae Species

 , , ,
, , ,  ,
,  and
and 
Abstract
:1. Introduction
2. Results
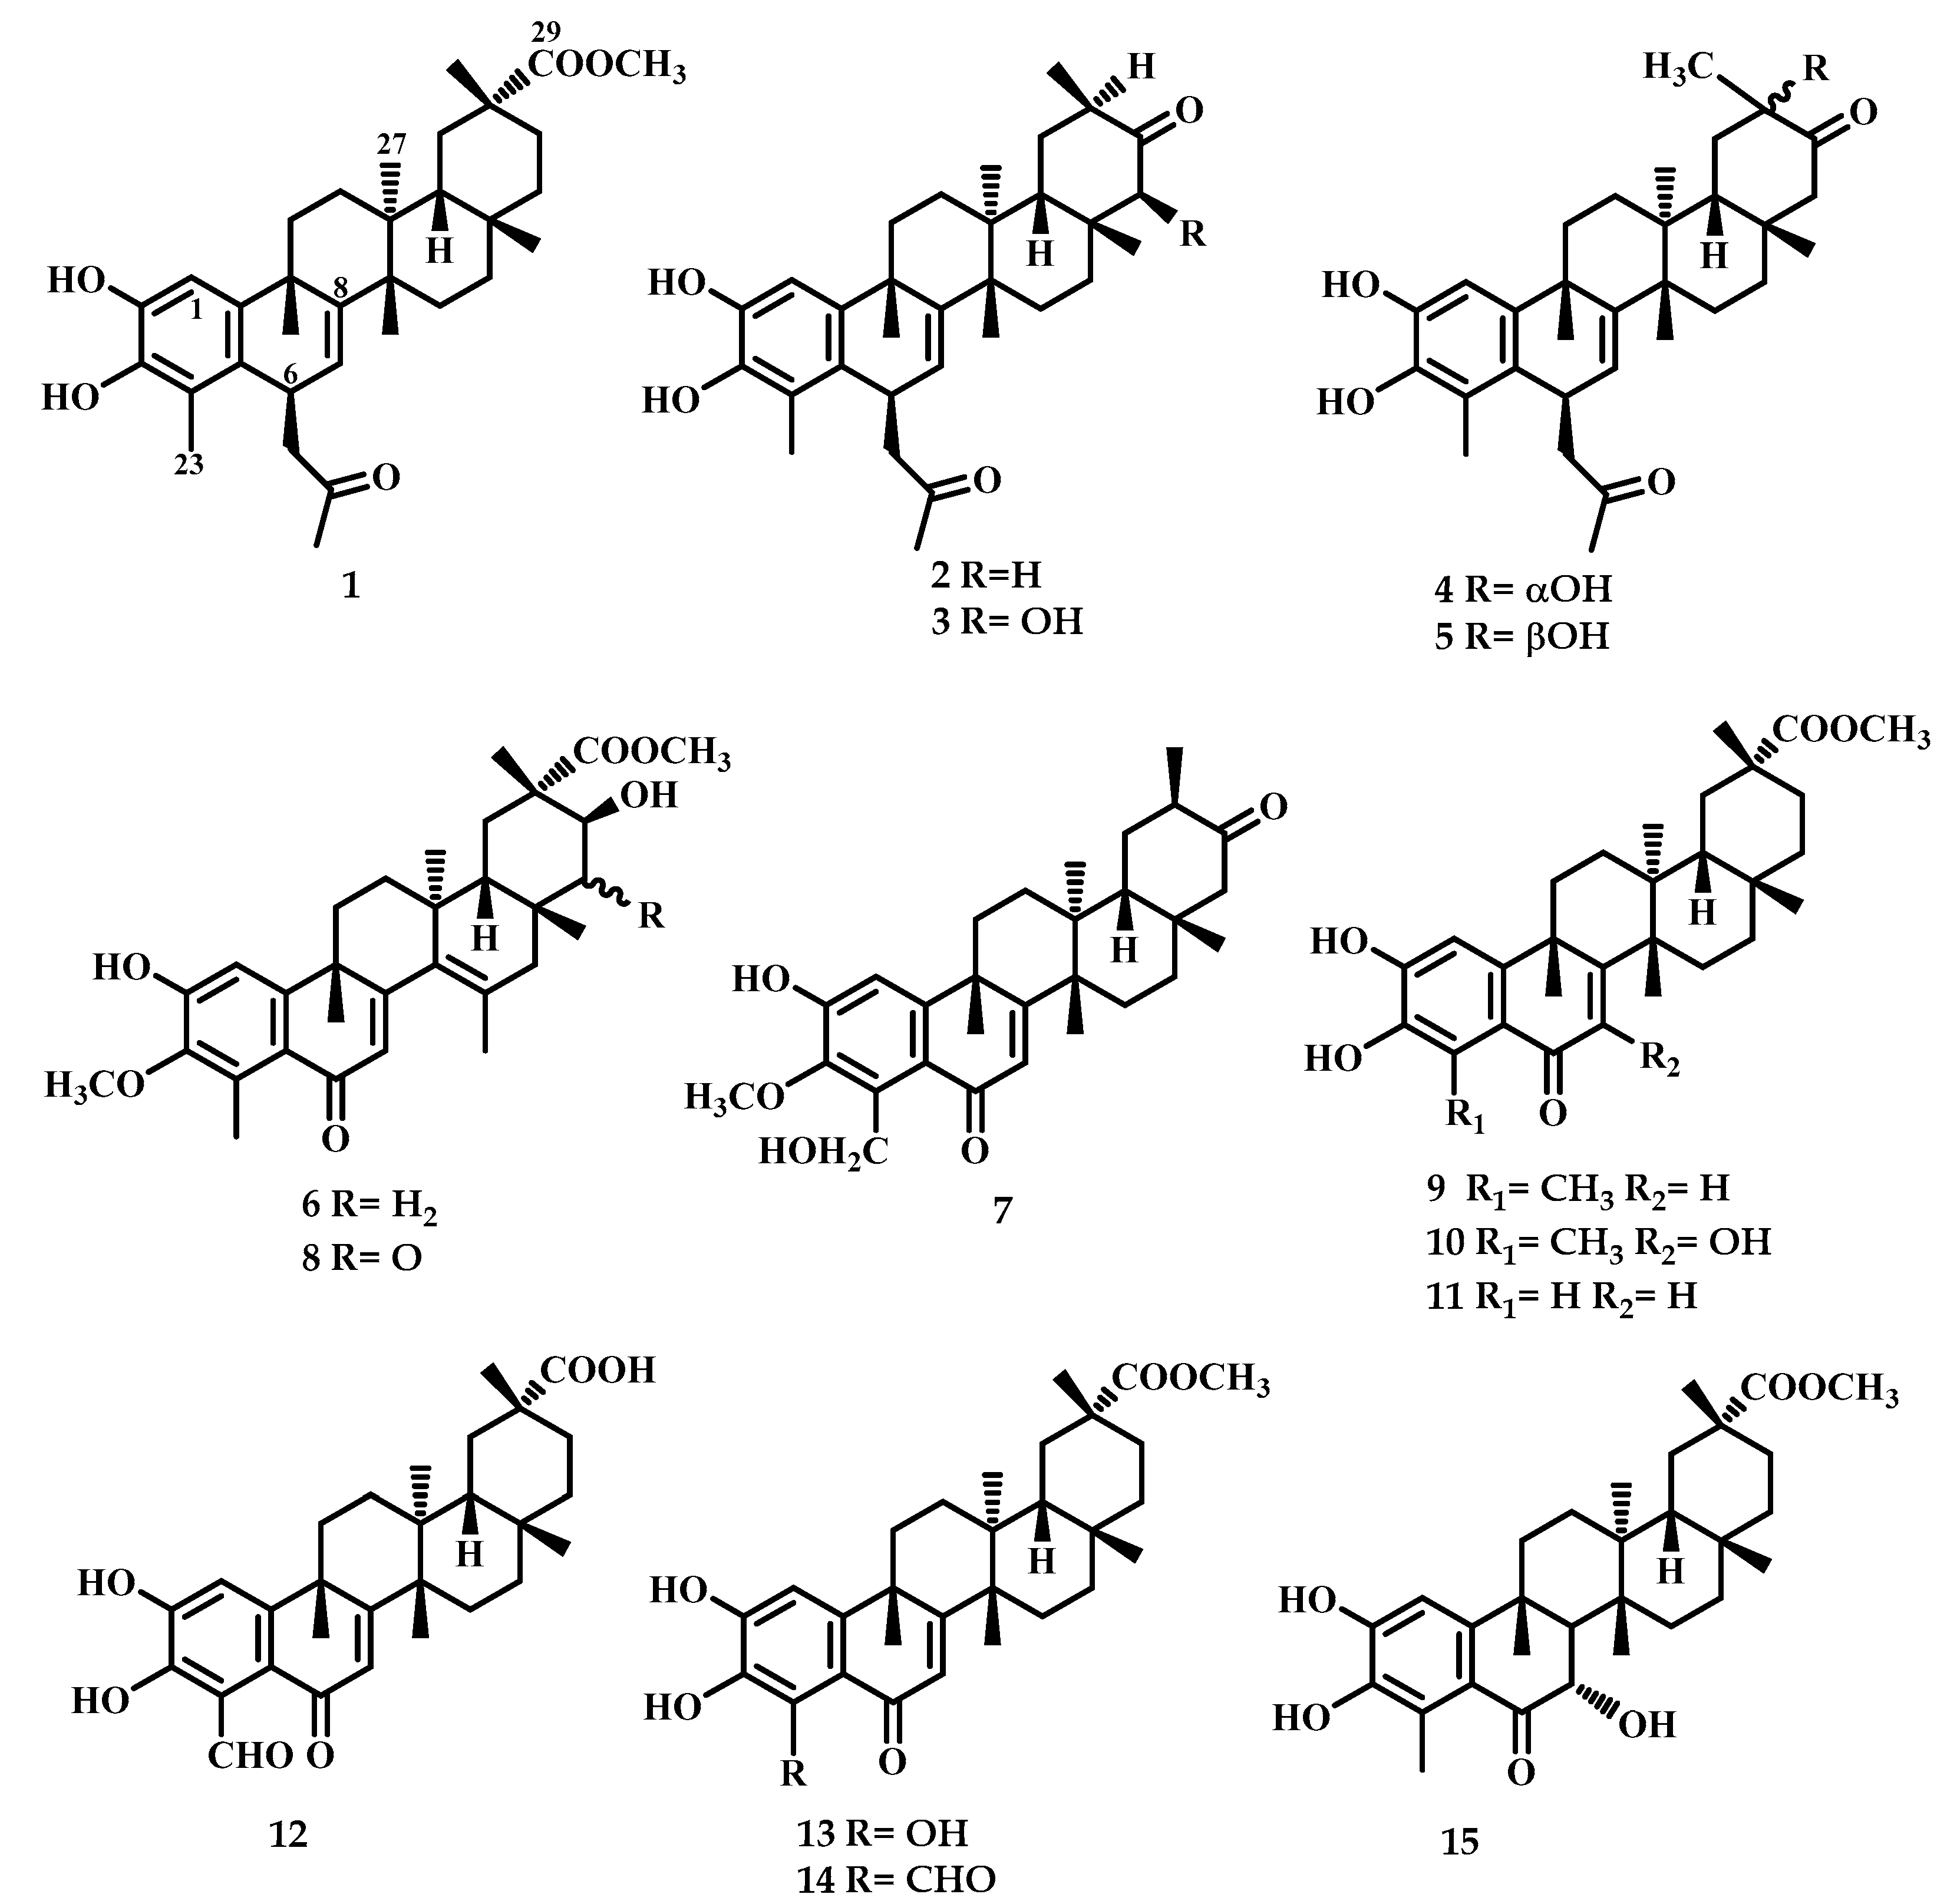
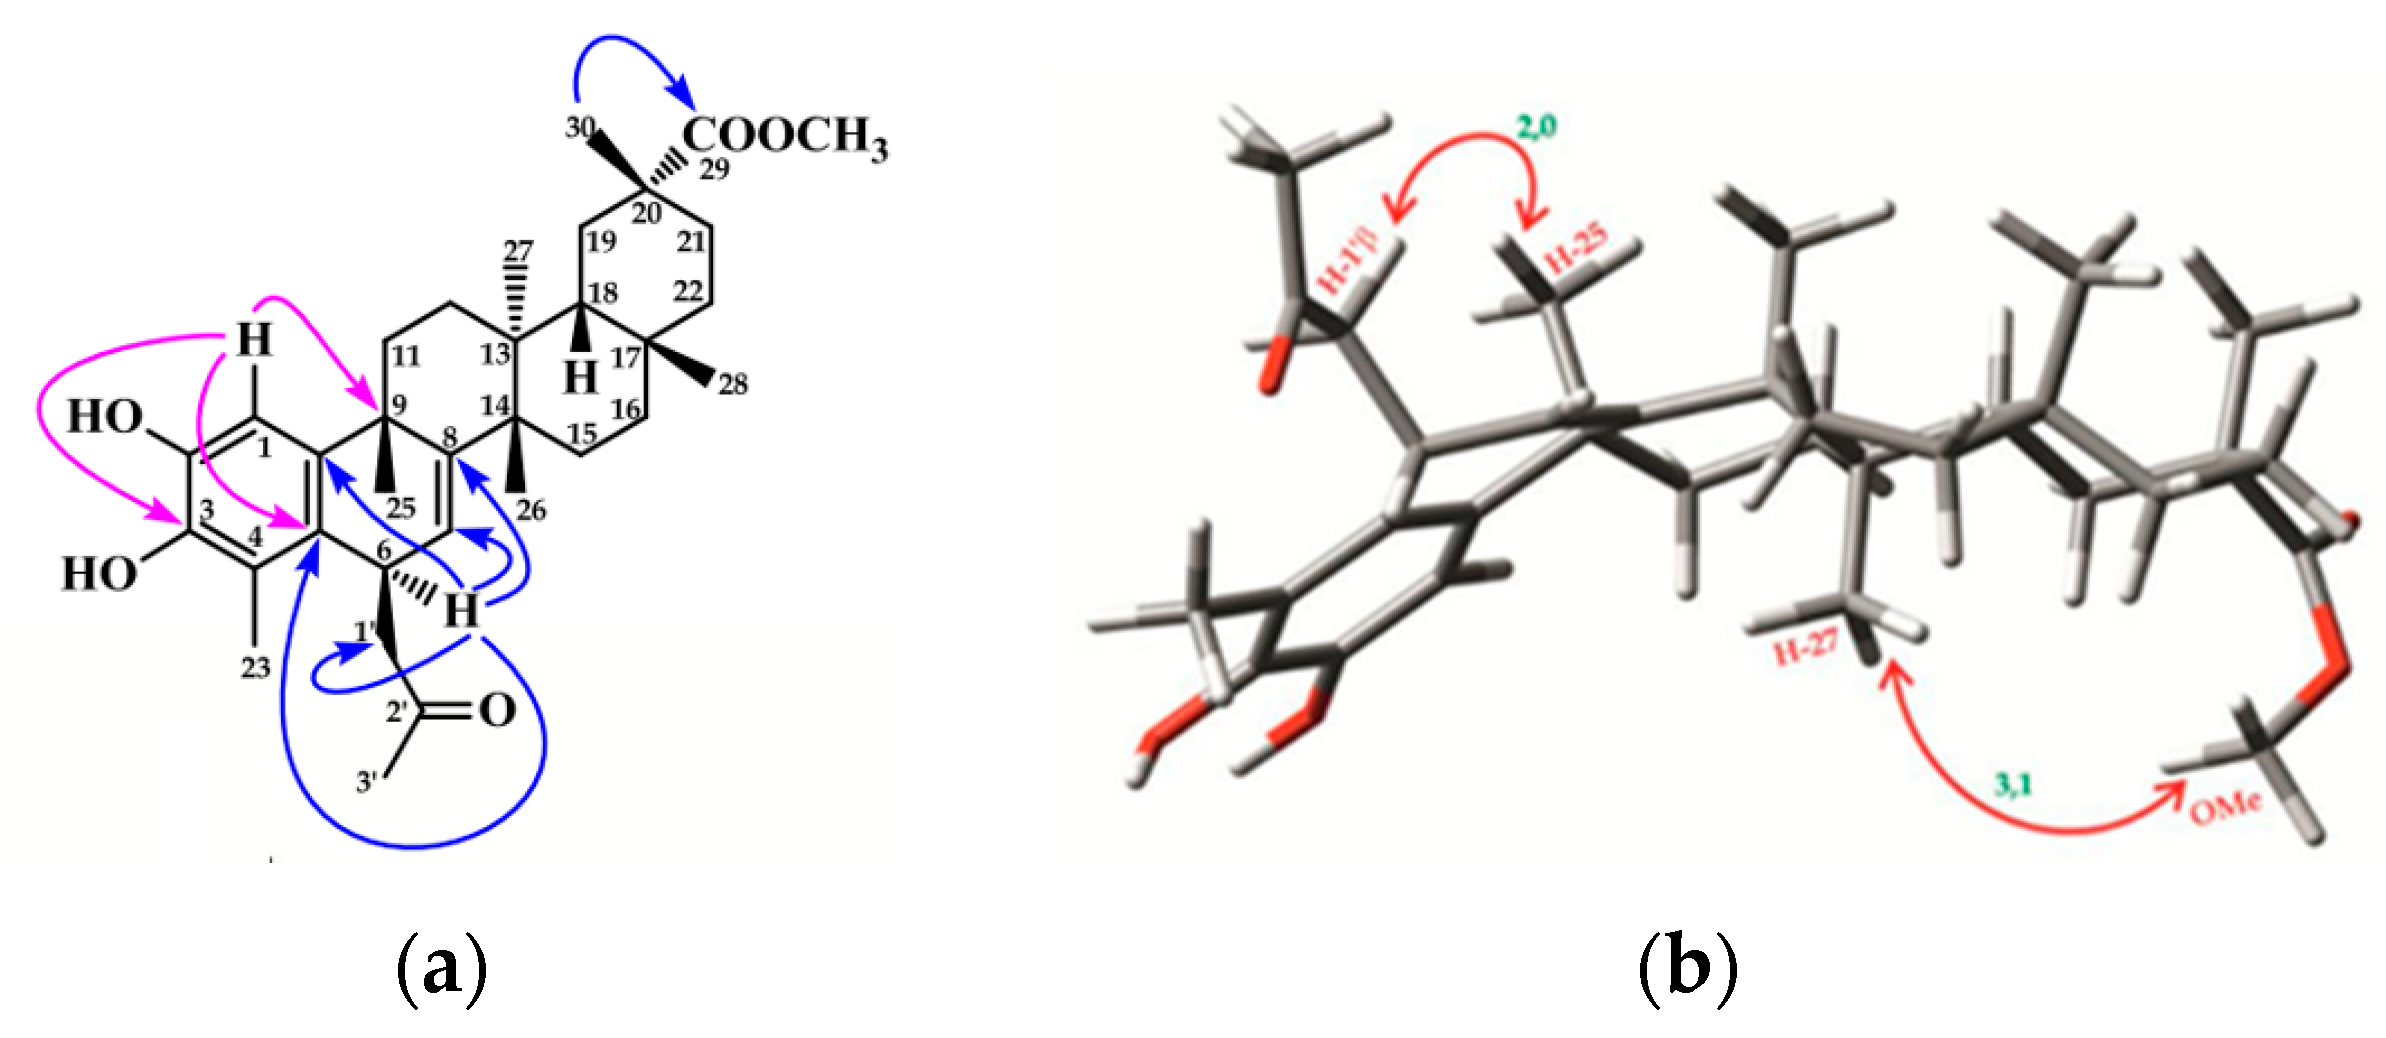
2.1. Chemistry
2.2. Biological Assays
2.2.1. Antiproliferative Activity on Cancer Cell Lines
2.2.2. Structure-Activity Relationship Analysis
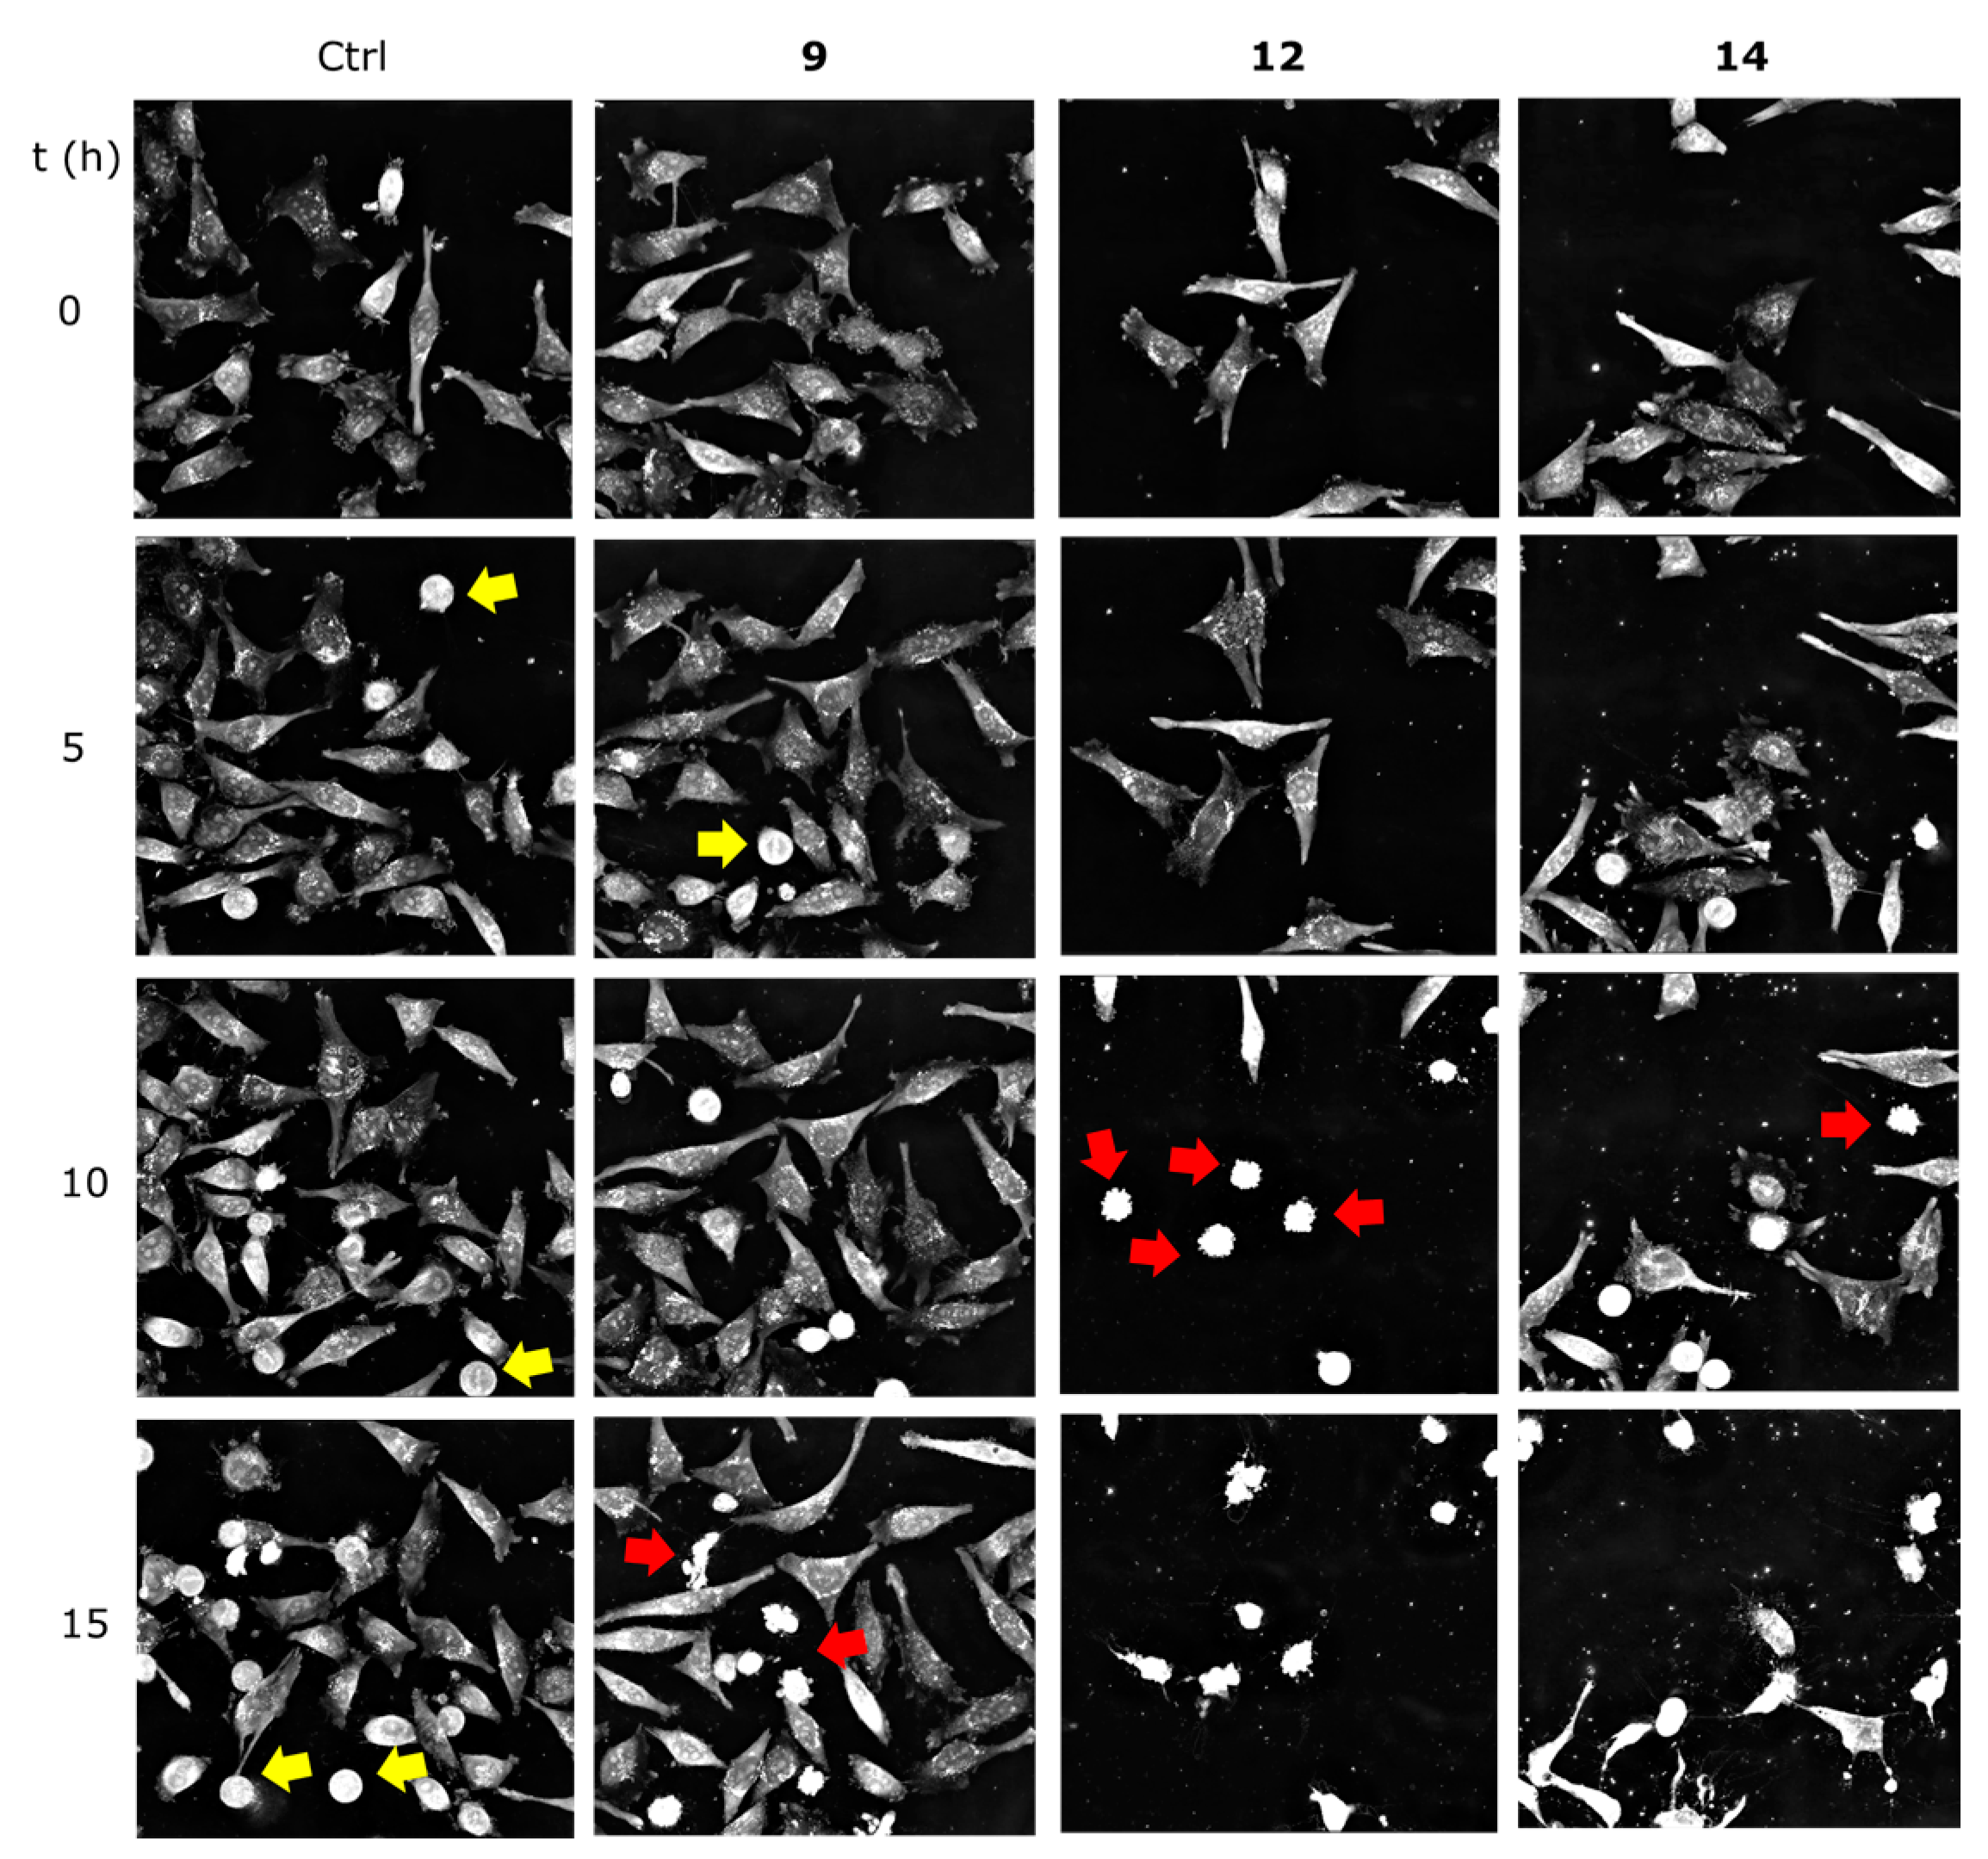
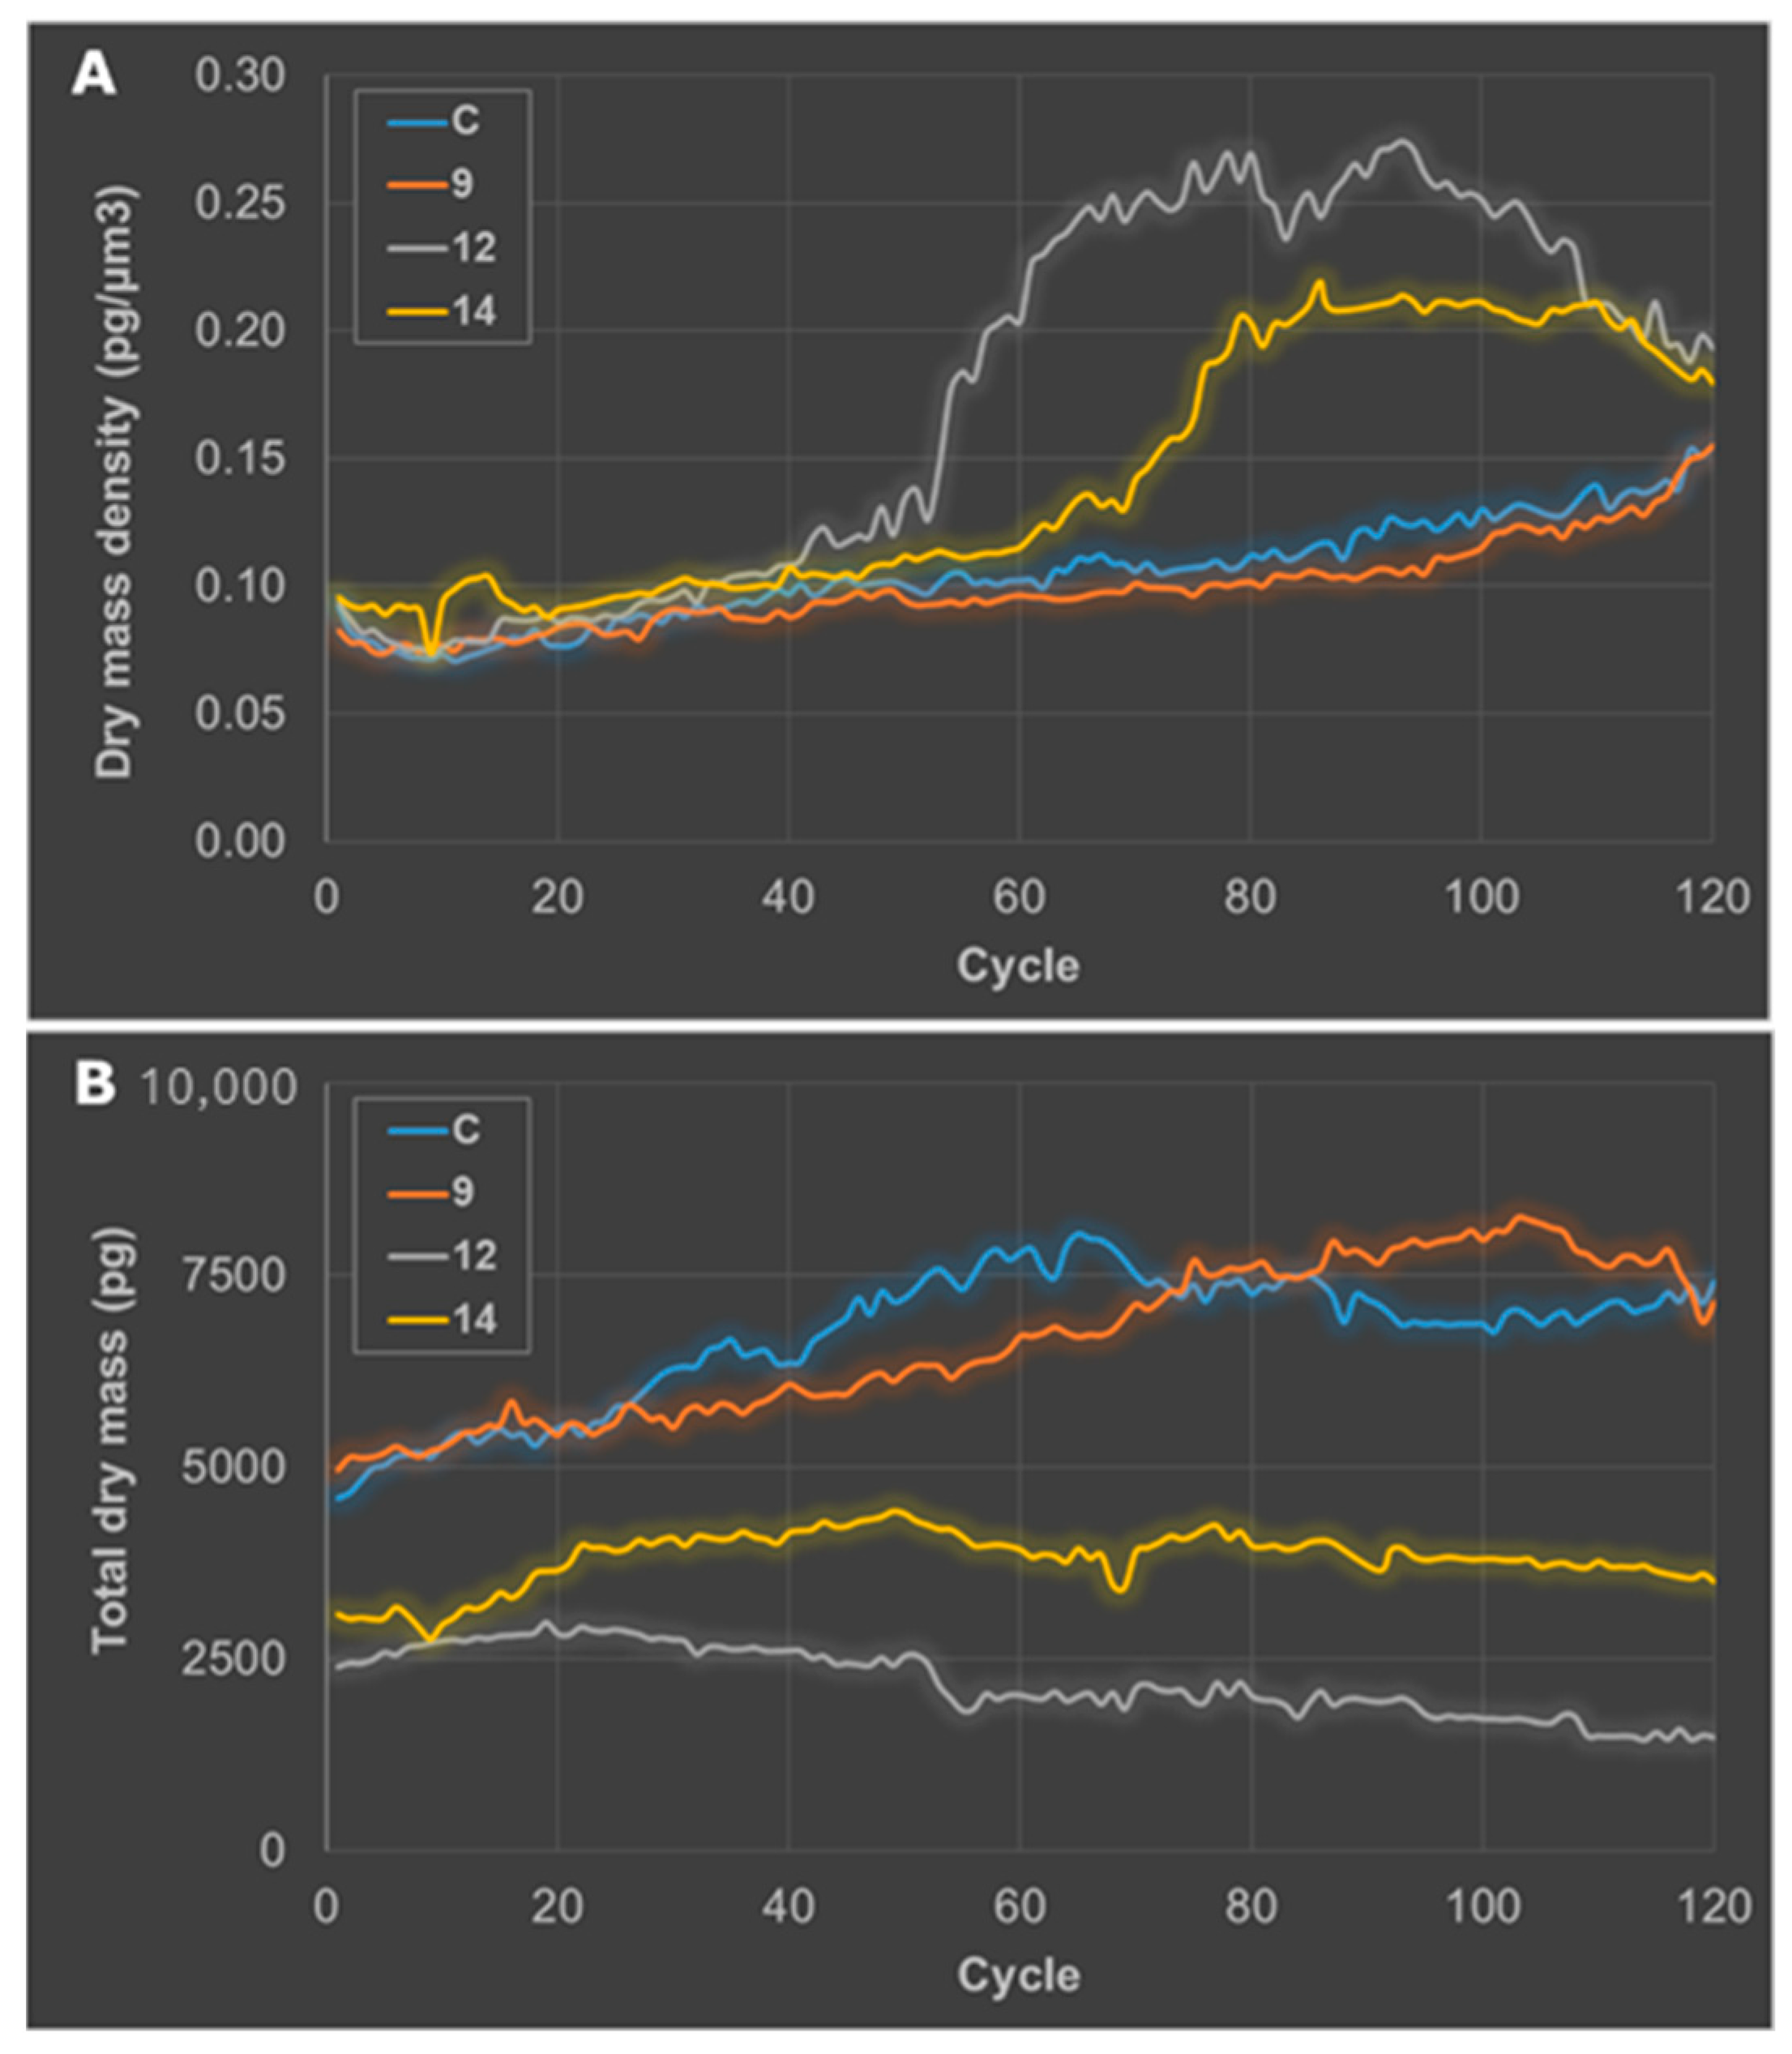
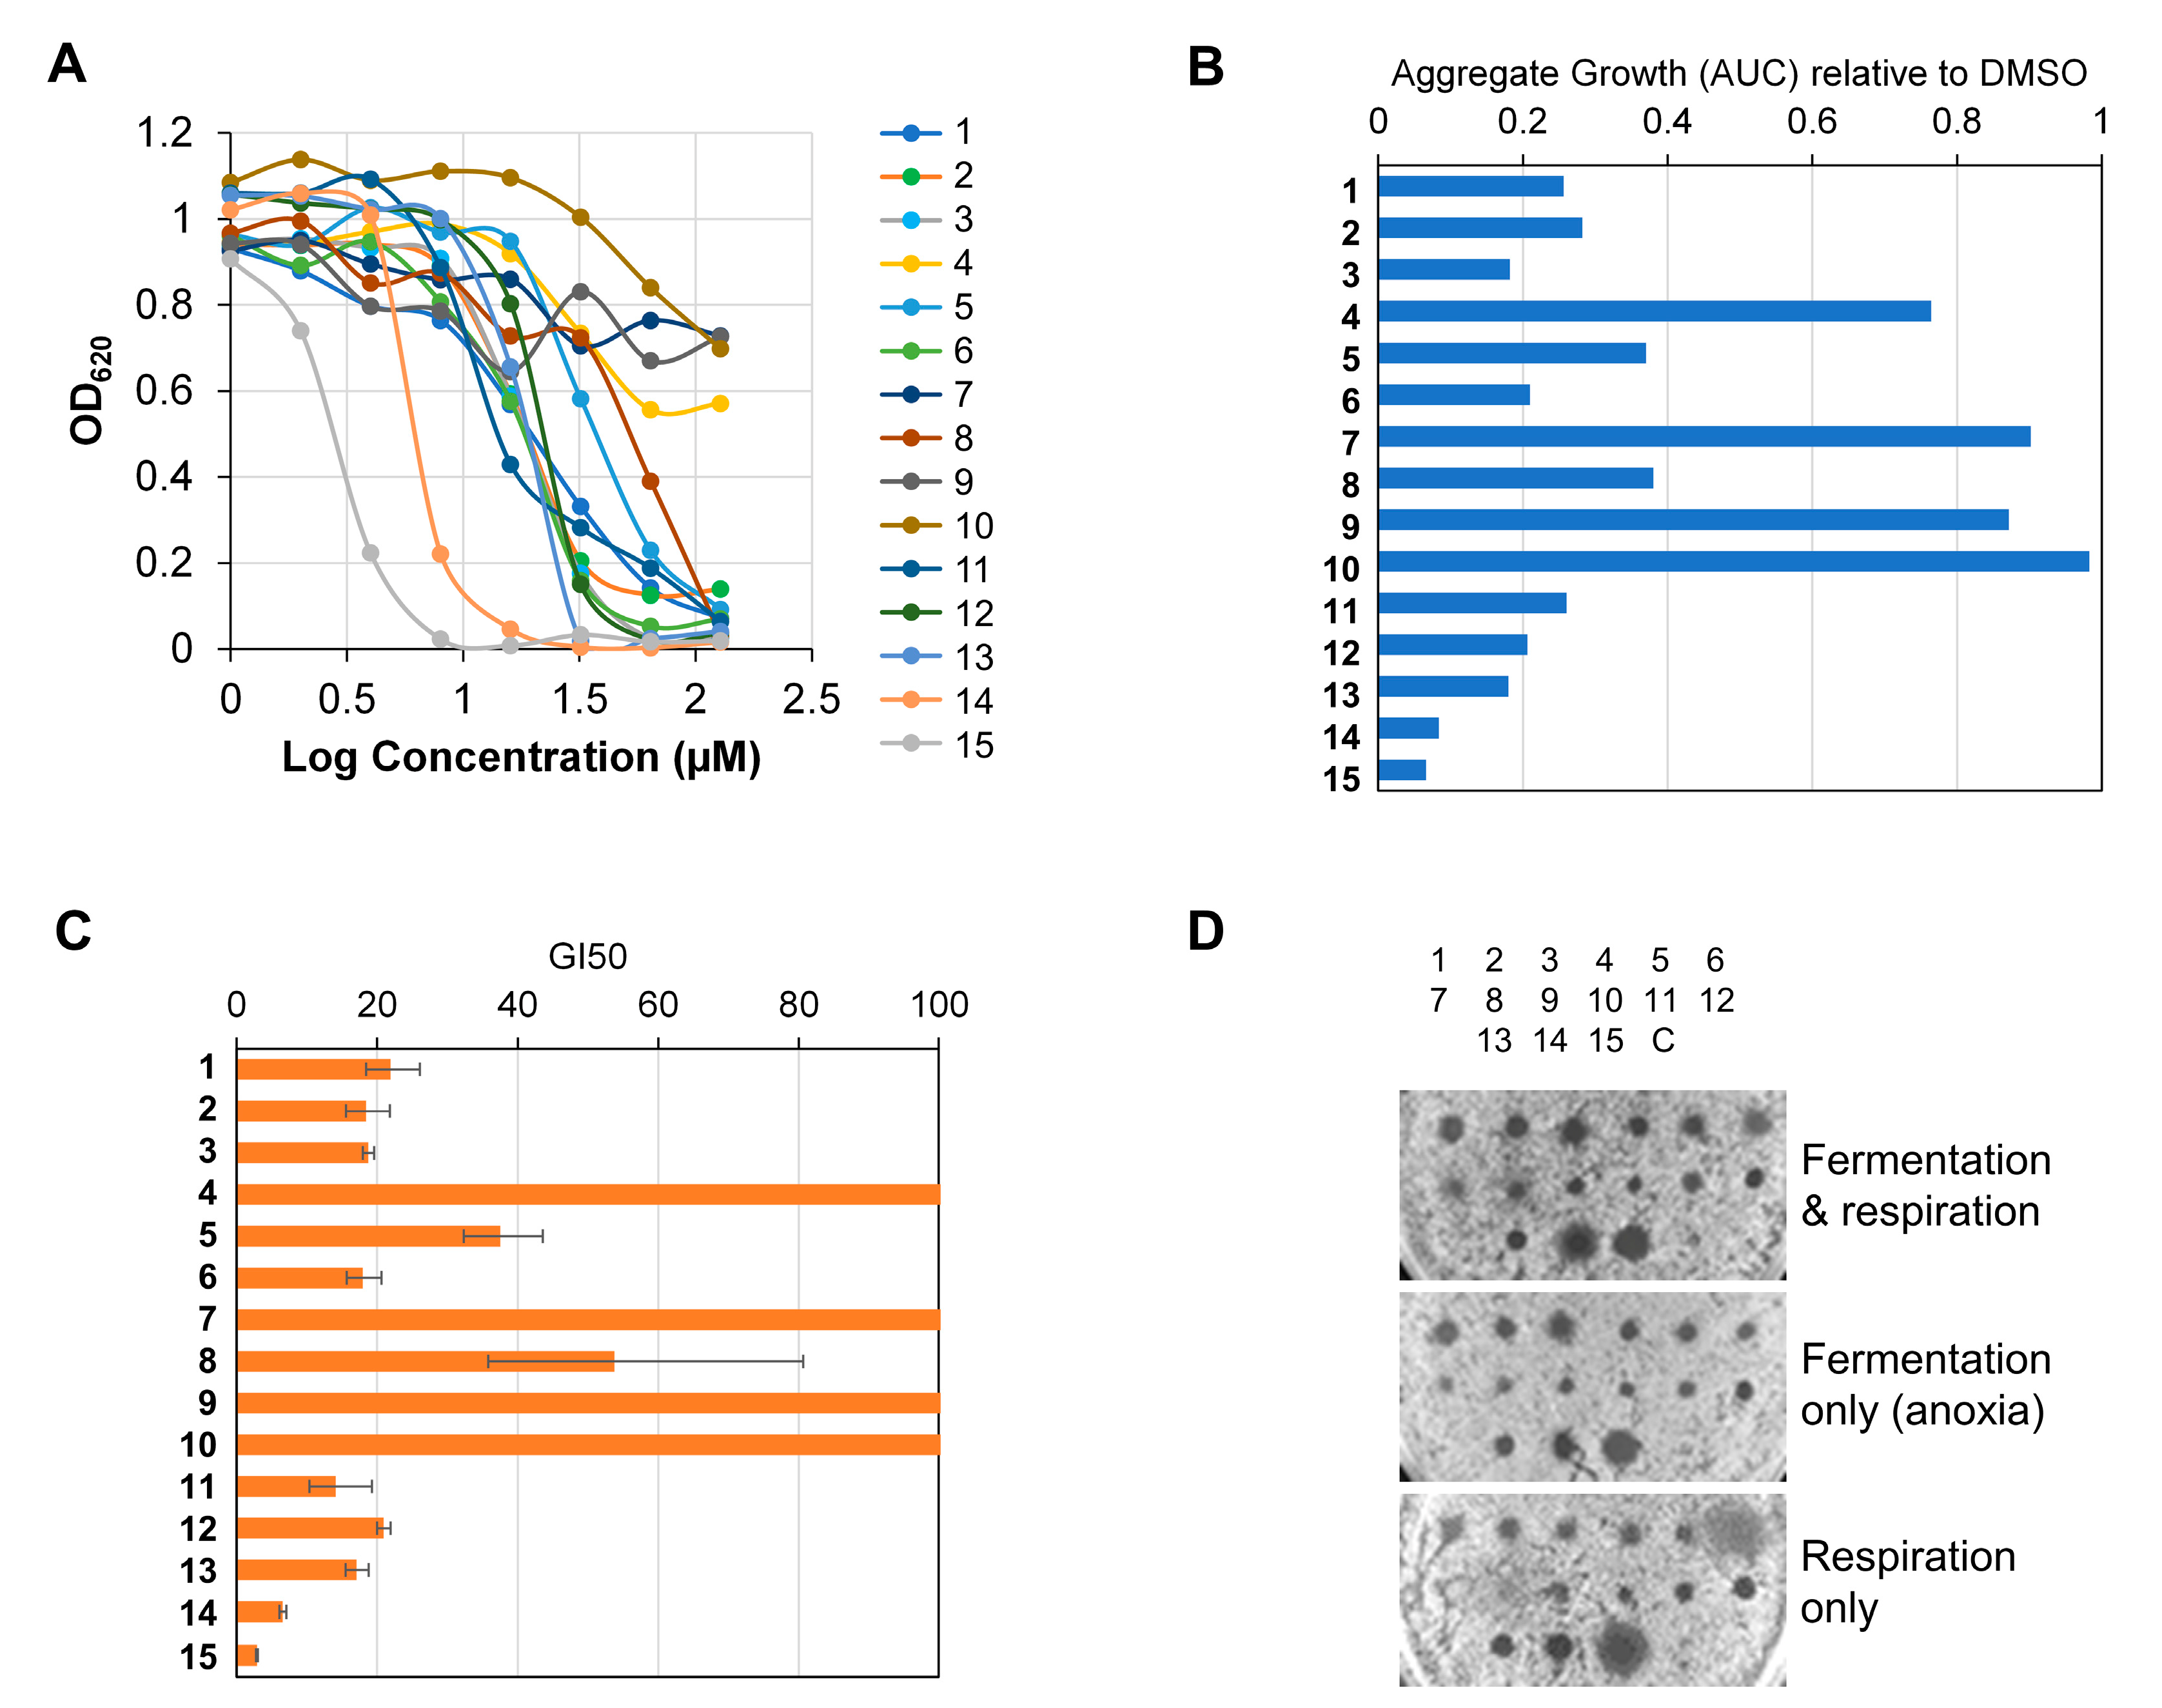
2.2.3. Getting Insights on the Mode of Cell Death
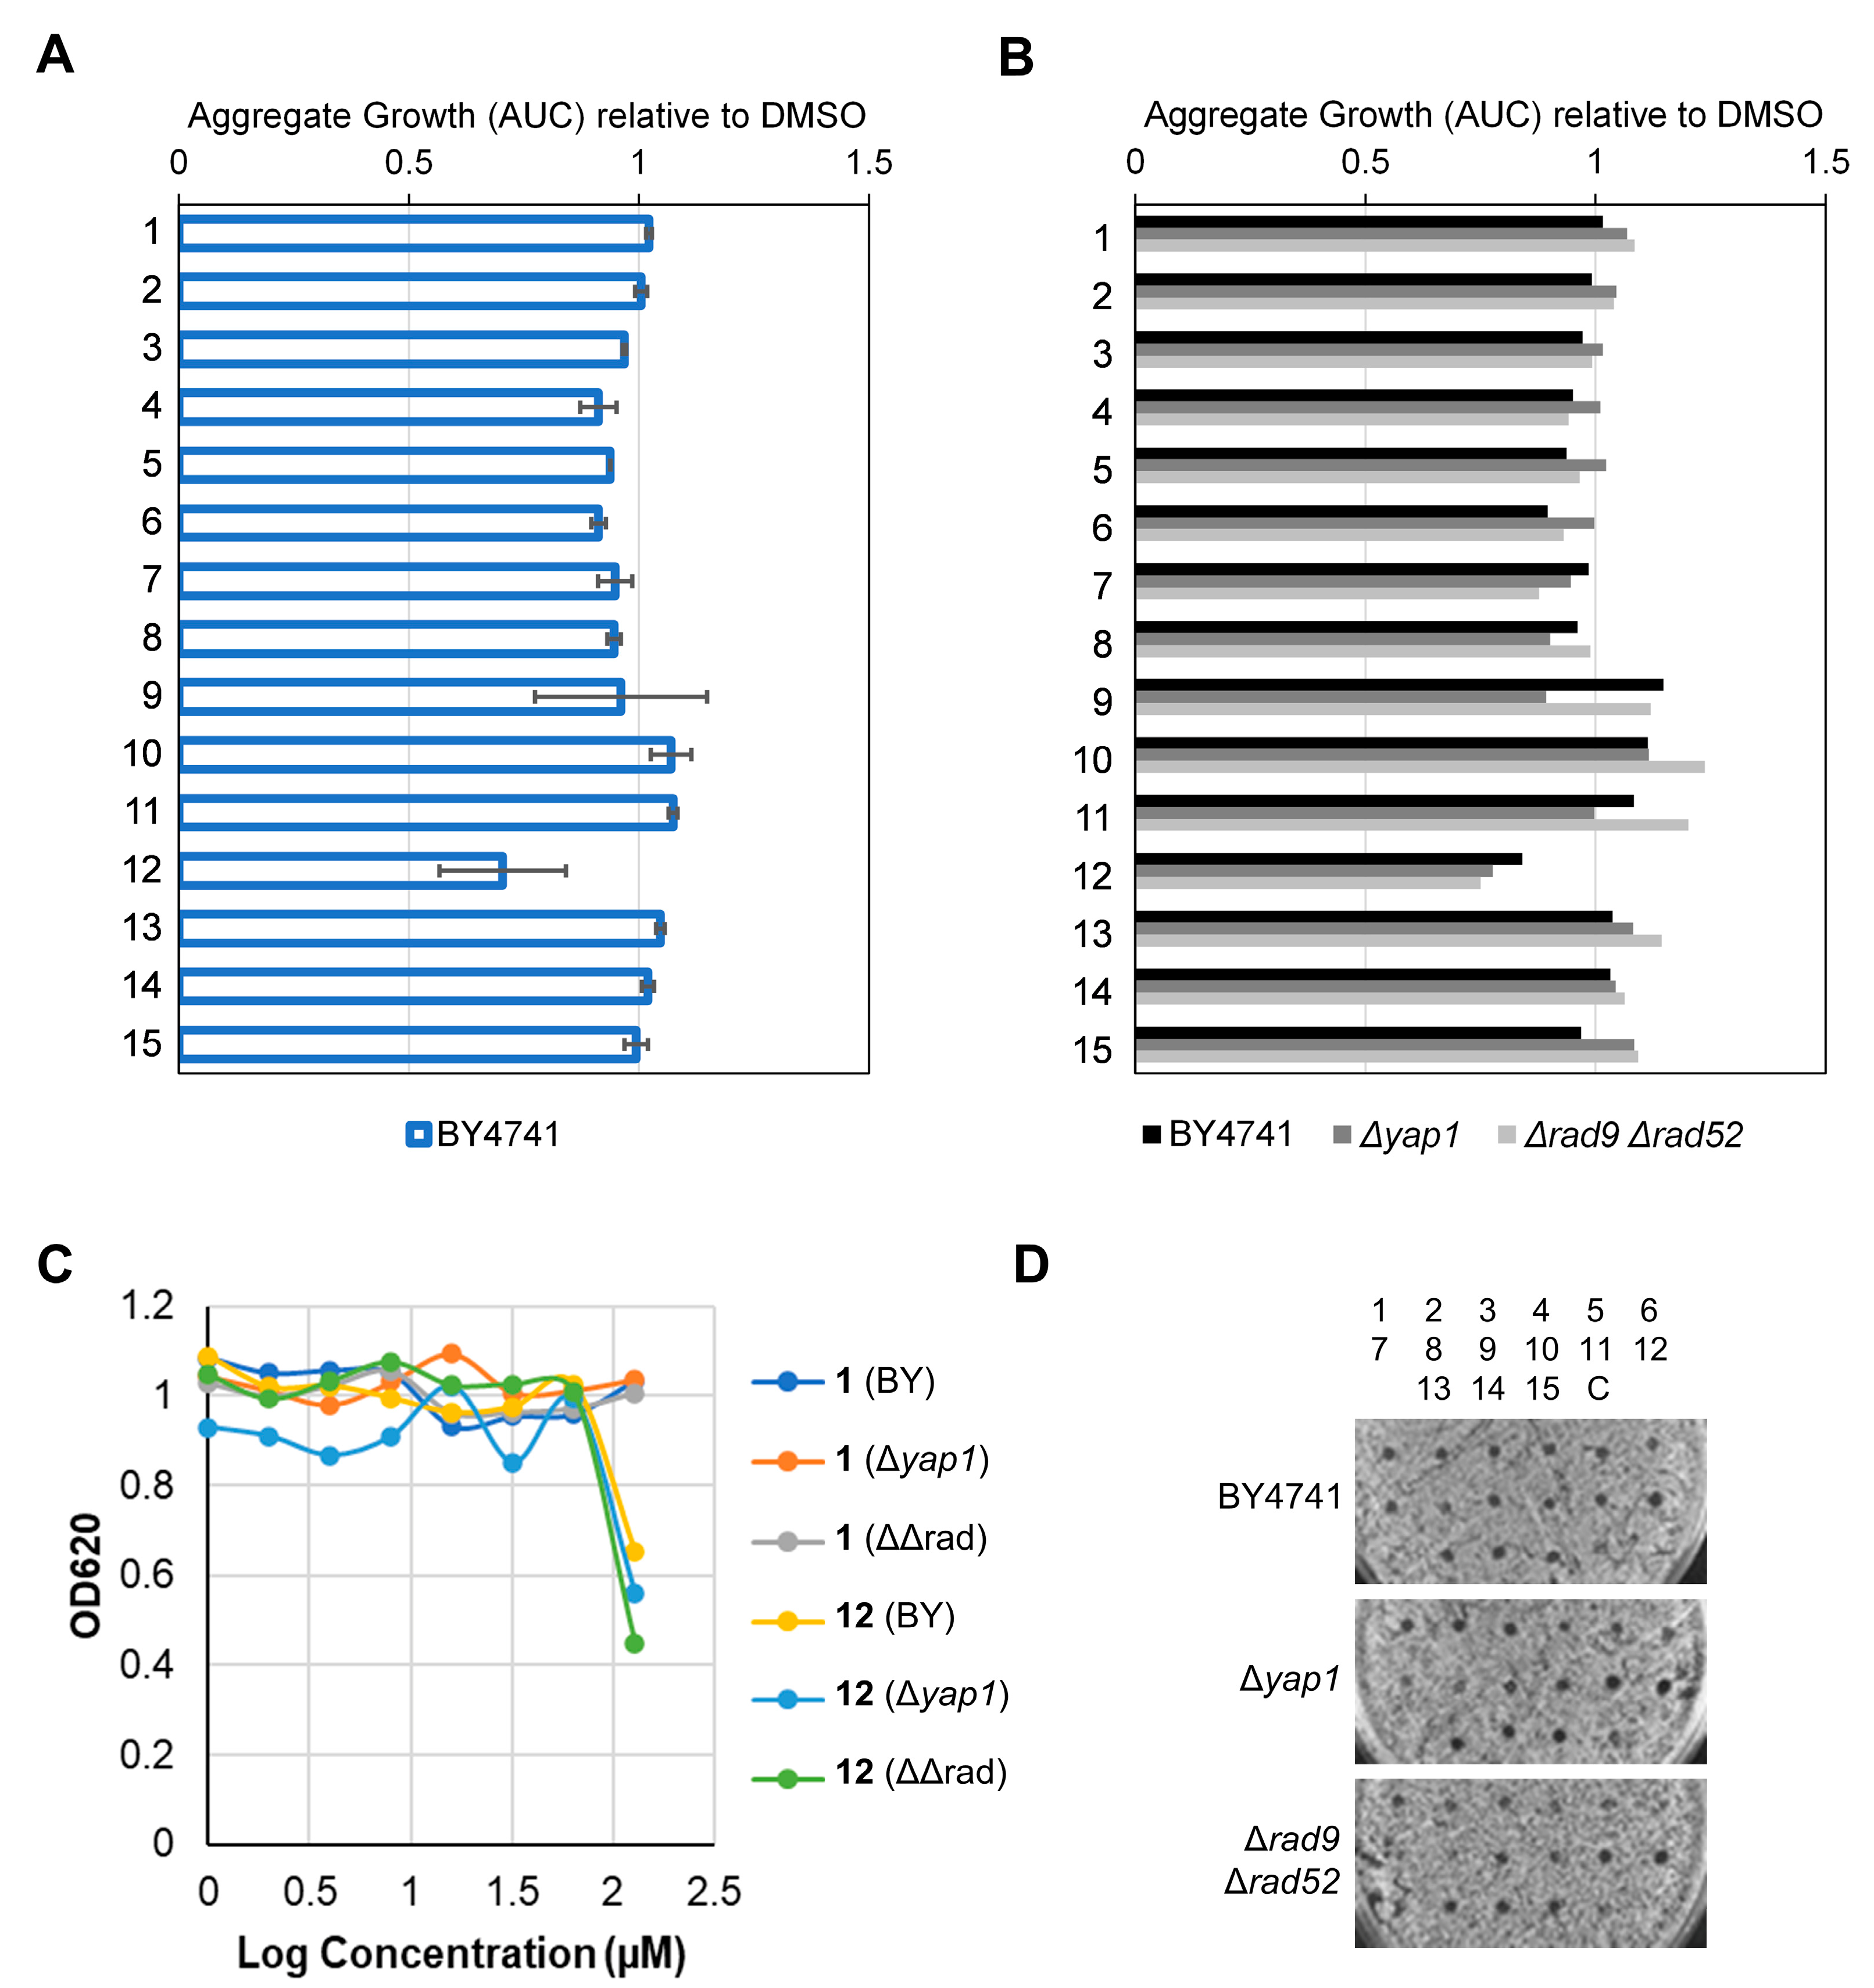
2.2.4. Determination of Toxicity, DNA Damage, Oxidative Stress and Drug Resistance Profiles in Yeast
2.2.5. Determination of Antibacterial Activity
3. Materials and Methods
3.1. General Experimental Procedures
3.2. Plant Material
3.3. Extraction and Isolation
3.3.1. Maytenus jelskii
3.3.2. Maytenus cuzcoina
3.3.3. Celastrus vulcanicola
3.3.4. Spectroscopic Data
3.4. Biological Assays
3.4.1. Human Cancer Cell Lines
3.4.2. Antiproliferative Assay
3.4.3. Label-Free Continuous Live Cell Imaging
3.4.4. Yeast Strains, Growth Conditions and Dose-Response Curves
3.4.5. Bacterial Strains, Growth Conditions and MIC Determination
4. Conclusions
Supplementary Materials
Author Contributions
Funding
Institutional Review Board Statement
Informed Consent Statement
Data Availability Statement
Acknowledgments
Conflicts of Interest
References
- Jassim, A.; Rahrmann, E.P.; Simons, B.D.; Gilbertson, R.J. Cancers make their own luck: Theories of cancer origins. Nat. Rev. Cancer 2023, 23, 710–724. [Google Scholar] [CrossRef] [PubMed]
- Pucci, C.; Martinelli, C.; Ciofani, G. Innovative approaches for cancer treatment: Current perspectives and new challenges. ecancer 2019, 13, 961. [Google Scholar] [CrossRef]
- Nurgali, K.; Rudd, J.A.; Was, H.; Abalo, R. Cancer therapy: The challenge of handling a double-edged sword. Front. Pharmacol. 2022, 13, 1007762. [Google Scholar] [CrossRef]
- Valente, A.; Podolski-Renić, A.; Poetsch, I.; Filipović, N.; López, Ó.; Turel, I.; Heffeter, P. Metal- and metalloid-based compounds to target and reverse cancer multidrug resistance. Drug Resist. 2021, 58, 100778. [Google Scholar] [CrossRef] [PubMed]
- Pistollato, F.; Iglesias, R.C.; Ruiz, R.; Aparicio, S.; Crespo, J.; Lopez, L.D.; Giampieri, F.; Battino, M. The use of natural compounds for the targeting and chemoprevention of ovarian cancer. Cancer Lett. 2017, 411, 191–200. [Google Scholar] [CrossRef] [PubMed]
- Newman, D.J.; Cragg, G.M. Natural products as sources of new drugs over the nearly four decades from January 1981 to September 2019. J. Nat. Prod. 2020, 83, 770–803. [Google Scholar] [CrossRef] [PubMed]
- Perego, P.; Jimenez, G.S.; Gatti, L.; Howell, S.B.; Zunino, F. Yeast mutants as a model system for identification of determinants of chemosensitivity. Pharmacol. Rev. 2000, 52, 477–492. [Google Scholar] [PubMed]
- Viegas, C.A. Microbial bioassays in environmental toxicity testing. Adv. Appl. Microbiol. 2021, 115, 115–158. [Google Scholar] [CrossRef]
- Dunstan, H.M.; Ludlow, C.; Goehle, S.; Cronk, M.; Szankasi, P.; Evans, D.R.H.; Simon, J.A.; Lamb, J.R. Cell-based assays for identification of novel double-strand break-inducing agents. J. Natl. Cancer Inst. 2002, 94, 88–94. [Google Scholar] [CrossRef] [PubMed]
- Morano, K.; Grant, C.M.; Moye-Rowley, W.S. The response to heat shock and oxidative stress in Saccharomyces cerevisiae. Genetics 2012, 190, 1157–1195. [Google Scholar] [CrossRef]
- Anaissi-Afonso, L.; Oramas-Royo, S.; Ayra-Plasencia, J.; Martín-Rodríguez, P.; García-Luis, J.; Lorenzo-Castrillejo, I.; Fernández-Pérez, L.; Estévez-Braun, A.; Machín, F. Lawsone, juglone, and β-lapachone derivatives with enhanced mitochondrial-based toxicity. ACS Chem. Biol. 2018, 13, 1950–1957. [Google Scholar] [CrossRef]
- González, A.G.; Bazzocchi, I.L.; Moujir, L.M.; Jiménez, I.A. Ethnobotanical uses of Celastraceae. Bioactive metabolites. In Studies in Natural Products Chemistry: Bioactive Natural Products; Part D; Atta-ur-Rahman, Ed.; Elsevier Science Publisher: Amsterdam, The Netherlands, 2000; Volume 23, pp. 649–738. [Google Scholar]
- Niero, R.; de Andrade, S.F.; Cechinel, V.F. A review of the ethnopharmacology, phytochemistry and pharmacology of plants of the Maytenus genus. Curr. Pharm. Des. 2011, 17, 1851. [Google Scholar] [CrossRef] [PubMed]
- Gunatilaka, A.A.L. Triterpenoid quinonemethides and related compounds (celastroloids). In Progress in the Chemistry of Organic Natural Products; Herz, W., Kirby, G.W., Moore, R.E., Steglich, W., Tamm, C., Eds.; Springer: New York, NY, USA, 1996; Volume 67, pp. 1–123. [Google Scholar]
- Sun, Y.; Wang, C.; Li, X.; Lu, J.; Wang, M. Recent advances in drug delivery of celastrol for enhancing efficiency and reducing the toxicity. Front. Pharmacol. 2024, 15, 1137289. [Google Scholar] [CrossRef] [PubMed]
- Chávez, H.; Rodríguez, G.; Estévez-Braun, A.; Ravelo, A.G.; Estévez-Reyes, R.; González, A.G.; Fdez-Puente, J.L.; García-Grávalos, D. Macrocarpins A-D, new cytotoxic nor-triterpenes from Maytenus macrocarpa. Bioorg. Med. Chem. Lett. 2000, 10, 759–762. [Google Scholar] [CrossRef] [PubMed]
- Callies, O.; Bedoya, L.M.; Beltrán, M.; Muñoz, A.; Calderón, P.O.; Osorio, A.A.; Jiménez, I.A.; Alcamí, J.; Bazzocchi, I.L. Isolation, structural modification, and HIV inhibition of pentacyclic lupane-type triterpenoids from Cassine xylocarpa and Maytenus cuzcoina. J. Nat. Prod. 2015, 78, 1045–1055. [Google Scholar] [CrossRef]
- Purino, M.; Ardiles, A.E.; Callies, O.; Jiménez, I.A.; Bazzocchi, I.L. Montecrinanes A-C: Triterpenes with an unprecedented rearranged tetracyclic skeleton from Celastrus vulcanicola. Insights into triterpenoid biosynthesis based on DFT calculations. Chem. Eur. J. 2016, 22, 7582–7591. [Google Scholar] [CrossRef]
- Sotanaphun, U.; Lipipun, V.; Yaipakdee, P.; Bavovada, R. New acidic-rearranged compounds from tingenone derivatives and their biological activity. Pharm. Biol. 2005, 43, 39–46. [Google Scholar] [CrossRef]
- Takaishi, Y.; Miyagi, K.; Kawazoe, K.; Nakano, K.; Li, K.; Duan, H. Terpenoids from Tripterygium wilfordii var. regelii. Phytochemistry 1997, 45, 975–978. [Google Scholar] [CrossRef]
- Jeller, A.H.; Silva, D.H.S.; Liao, L.M.; Bolzani, V.S.; Burlan, M. Antioxidant phenolic and quinonemethide triterpenes from Cheiloclinium cognatum. Phytochemistry 2004, 65, 1977–1982. [Google Scholar] [CrossRef]
- Shirota, O.; Morita, H.; Takeya, K.; Itokawa, H. Cytotoxic aromatic triterpenes from Maytenus ilicifolia and Maytenus chuchuhuasca. J. Nat. Prod. 1994, 57, 1675–1681. [Google Scholar] [CrossRef]
- Ankli, A.; Heilmann, J.; Heinrich, M.; Sticher, O. Cytotoxic cardenolides and antibacterial terpenoids from Crossopetalum gaumeri. Phytochemistry 2000, 54, 531–537. [Google Scholar] [CrossRef]
- Gamlath, C.B.; Gunatilaka, A.A.L. Two phenolic friedo-23,24-dinoroleanane triterpenes from Kokoona zeylanica. Phytochemistry 1988, 27, 3221–3224. [Google Scholar] [CrossRef]
- Rodríguez, F.M.; López, M.R.; Jiménez, I.A.; Moujir, L.; Ravelo, A.G.; Bazzocchi, I.L. New phenolic triterpenes from Maytenus blepharodes. Semisynthesis of 6-deoxoblepharodol from pristimerin. Tetrahedron 2005, 61, 2513–2519. [Google Scholar] [CrossRef]
- Gamlath, C.B.; Gunaherath, K.B.; Gunatilaka, A.A.L. Studies on terpenoids and steroids. Part 10. Structures of four new natural phenolic D:A-friedo-24-noroleanane triterpenoids. J. Chem. Soc. Perkin Trans. I 1987, 2849–2853. [Google Scholar] [CrossRef]
- Delle Monache, F.; Marini-Bettolo, G.B.; Goncalves de Lima, O.; d’Albuquerque, I.L.; Coelho, J.S.B. The structure of tingenone, a quinonoid triterpene related to pristimerin. J. Chem. Soc. Perkin Trans. I 1973, 2725–2728. [Google Scholar] [CrossRef]
- Ravelo, A.G.; Estévez-Braun, A.; Chávez-Orellana, H.; Pérez-Sacau, E.; Mesa-Siveiro, D. Recent studies on natural products as anticancer agents. Curr. Top. Med. Chem. 2004, 4, 241–265. [Google Scholar] [CrossRef] [PubMed]
- Puerta, A.; Galán, A.R.; Abdilla, R.; Demanuele, K.; Fernandes, M.X.; Bosica, G.; Padrón, J.M. Naphthol-derived Betti bases as potential SLC6A14 blockers. J. Mol. Clin. Med. 2019, 2, 35–40. [Google Scholar] [CrossRef]
- Gunatilaka, A.A.L.; Fernando, C.; Kikuchi, T.; Tezuka, Y. 1H and 13C NMR Analysis of three quinonemethide triterpenoids. Magn. Reason. Chem. 1989, 27, 803–807. [Google Scholar] [CrossRef]
- Ramos-Pérez, C.; Lorenzo-Castrillejo, I.; Quevedo, O.; García-Luis, J.; Matos-Perdomo, E.; Medina-Coello, C.; Estévez-Braun, A.; Machín, F. Yeast cytotoxic sensitivity to the antitumour agent β-lapachone depends mainly on oxidative stress and is largely independent of microtubule or topoisomerase-mediated DNA damage. Biochem. Pharmacol. 2014, 92, 206–219. [Google Scholar] [CrossRef]
- Miyamoto, Y.; Machida, K.; Mizunuma, M.; Emoto, Y.; Sato, N.; Miyahara, K.; Hirata, D.; Usui, T.; Takahashi, H.; Osada, H.; et al. Identification of Saccharomyces cerevisiae isoleucyl-TRNA synthetase as a target of the G1-specific inhibitor reveromycin A. J. Biol. Chem. 2002, 277, 28810–28814. [Google Scholar] [CrossRef]
- Casero, C.; Estévez-Braun, A.; Ravelo, A.G.; Demo, M.; Méndez-Álvarez, S.; Machín, F. Achyrofuran is an antibacterial agent Capable of killing methicillin-resistant vancomycin-intermediate Staphylococcus aureus in the nanomolar range. Phytomedicine 2013, 20, 133–138. [Google Scholar] [CrossRef] [PubMed]
- Quintana-Espinoza, P.; García-Luis, J.; Amesty, A.; Martín-Rodríguez, P.; Lorenzo-Castrillejo, I.; Ravelo, A.G.; Fernández-Pérez, L.; Machín, F.; Estévez-Braun, A. Synthesis and study of antiproliferative, antitopoisomerase II, DNA-intercalating and DNA-damaging activities of arylnaphthalimides. Bioorg. Med. Chem. 2013, 21, 6484–6495. [Google Scholar] [CrossRef] [PubMed]


| No. | 1 | 4 | 6 | |||
|---|---|---|---|---|---|---|
| δH | δC a | δH | δC a | δH | δC a | |
| 1 | 6.81 s | 109.2 d | 6.80 s | 109.2 d | 6.92 s | 110.2 d |
| 2 | 142.3 s | 142.2 s | 151.6 s | |||
| 3 | 140.3 s | 140.3 s | 144.7 s | |||
| 4 | 119.8 s | 120.0 s | 134.2 s | |||
| 5 | 128.1 s | 127.8 s | 122.0 s | |||
| 6 | 3.99 ddd (2.5, 6.2, 10.4) | 32.8 d | 4.01 t (6.3) | 32.8 d | 186.1 s | |
| 7 | 5.85 d (6.2) | 121.7 d | 5.86 d (6.0) | 121.6 d | 6.00 s | 128.8 d |
| 8 | 150.1 s | 149.6 s | 161.5 s | |||
| 9 | 37.2 s | 37.0 s | 41.2 s | |||
| 10 | 142.0 s | 142.3 s | 151.9 s | |||
| 11 | 1.80, 2.05 m | 35.7 t | 1.96 dt (5.3, 13.2) 2.07 m | 35.7 t | 1.94 dd (5.1, 13.4) 2.04 dd (3.4, 13.4) | 37.4 t |
| 12 | 1.53 m | 30.4 t | 1.52, 1.59 m | 29.5 t | 1.33 dd (3.4, 13.8) 2.46 td (5.1, 13.8) | 35.7 t |
| 13 | 37.7 s | 37.9 s | 35.2 s | |||
| 14 | 43.8 s | 42.9 s | 134.9 s | |||
| 15 | 1.40, 1.53 m | 28.9 t | 1.46, 1.71 m | 28.5 t | 127.5 s | |
| 16 | 1.82 m | 36.7 t | 1.43, 1.81 m | 36.8 t | 1.43 m 2.58 d (16.8) | 38.9 t |
| 17 | 29.7 s | 34.6 s | 42.4 s | |||
| 18 | 1.49 d (8.0) | 44.5 d | 1. 69 m | 43.8 d | 1.48 m | 43.3 d |
| 19 | 1.63 dd (8.0, 16.0) 2.33 d (16.0) | 30.8 t | 2.21 m 2.28 dd (7.5, 16.8) | 34.2 t | β 1.50 m α 1.89 d (10.9) | 34.3 t |
| 20 | 40.5 s | 72.3 s | 48.0 s | |||
| 21 | 2.05 m | 30.0 t | 217.0 s | 4.20 dd (5.4, 11.6) | 68.1 d | |
| 22 | 0.99 m 2.01 m | 34.8 t | 2.16 d (19.4) 2.69 d (19.4) | 47.7 t | 1.55 m | 43.1 t |
| 23 | 2.18 s | 11.2 q | 2.18 b s | 11.3 q | 2.73 s | 15.1 q |
| 25 | 1.45 s | 36.8 q | 1.49 s | 37.5 q | 1.37 s | 27.9 q |
| 26 | 1.17 b s | 22.3 q | 1.27 s | 22.4 q | 1.72 s | 21.7 q |
| 27 | 0.52 | 18.2 q | 0.59 s | 16.5 q | 0.87 s | 24.0 q |
| 28 | 1.05 s | 31.6 q | 1.28 s | 24.9 q | 1.23 s | 31.3 q |
| 29 | 179.3 s | 178.9 s | ||||
| 30 | 1.17 b s | 33.0 q | 1.40 s | 31.2 q | 1.21 s | 13.8 q |
| Compound | A549 | HBL-100 | HeLa | SW1573 | T-47D | WiDr |
|---|---|---|---|---|---|---|
| 1 | 24 ± 2.3 | 21 ± 7.7 | 24 ± 1.8 | 21 ± 7.7 | >25 | >25 |
| 2 | >25 | 18 ± 6.6 | 10 ±6.0 | 17 ± 6.6 | >25 | >25 |
| 3 | >25 | 12 ± 0.6 | 22 ± 4.5 | 19 ± 4.2 | >25 | 14 ± 1.4 |
| 4 | >25 | 18 ± 7.7 | 17 ± 5.7 | 21 ± 2.9 | >25 | >25 |
| 5 | >25 | >25 | >25 | >25 | >25 | >25 |
| 6 | >25 | >25 | >25 | >25 | 19 ± 7.9 | >25 |
| 7 | >25 | >25 | >25 | >25 | >25 | >25 |
| 8 | >25 | >25 | >25 | >25 | >25 | >25 |
| 9 | 8.3 ± 3.5 | 3.1 ± 1.4 | 8.6 ± 0.2 | 4.0 ± 0.6 | 20 ± 6.7 | 8.1 ± 0.6 |
| 10 | >25 | >25 | >25 | 23 ± 3.7 | >25 | >25 |
| 11 | >25 | >25 | 23 ± 3.6 | >25 | >25 | >25 |
| 12 | 0.96 ± 0.36 | 0.45 ± 0.17 | 1.1 ± 0.2 | 1.2 ± 0.2 | 2.4 ± 1.0 | 5.8 ± 1.9 |
| 13 | 19 ± 6.5 | >25 | >25 | 11 ± 1.4 | >25 | >25 |
| 14 | 6.6 ± 1.8 | 3.4 ± 1.4 | 4.1 ± 0.9 | 3.0 ± 0.7 | 7.9 ± 1.1 | 9.9 ± 2.1 |
| 15 | 19 ± 6.8 | 20 ± 9.2 | 19 ± 8.2 | 12 ± 5.2 | >25 | >25 |
| CDDP c | 4.9 ± 0.2 | 1.9 ± 0.2 | 1.8 ± 0.5 | 2.7 ± 0.4 | 17 ± 3.3 | 23 ± 4.3 |
| 5-FU c | 2.2 ± 0.3 | 4.4 ± 0.7 | 16 ± 4.5 | 3.3 ± 1.2 | 43 ± 16 | 49 ± 6.7 |
Disclaimer/Publisher’s Note: The statements, opinions and data contained in all publications are solely those of the individual author(s) and contributor(s) and not of MDPI and/or the editor(s). MDPI and/or the editor(s) disclaim responsibility for any injury to people or property resulting from any ideas, methods, instructions or products referred to in the content. |
© 2024 by the authors. Licensee MDPI, Basel, Switzerland. This article is an open access article distributed under the terms and conditions of the Creative Commons Attribution (CC BY) license (https://creativecommons.org/licenses/by/4.0/).
Share and Cite
Reyes, C.P.; Ardiles, A.; Anaissi-Afonso, L.; González-Bakker, A.; Padrón, J.M.; Jiménez, I.A.; Machín, F.; Bazzocchi, I.L. Exploring the Anticancer Potential of Phenolic nor-Triterpenes from Celastraceae Species. Int. J. Mol. Sci. 2024, 25, 9470. https://doi.org/10.3390/ijms25179470
Reyes CP, Ardiles A, Anaissi-Afonso L, González-Bakker A, Padrón JM, Jiménez IA, Machín F, Bazzocchi IL. Exploring the Anticancer Potential of Phenolic nor-Triterpenes from Celastraceae Species. International Journal of Molecular Sciences. 2024; 25(17):9470. https://doi.org/10.3390/ijms25179470
Chicago/Turabian StyleReyes, Carolina P., Alejandro Ardiles, Laura Anaissi-Afonso, Aday González-Bakker, José M. Padrón, Ignacio A. Jiménez, Félix Machín, and Isabel L. Bazzocchi. 2024. "Exploring the Anticancer Potential of Phenolic nor-Triterpenes from Celastraceae Species" International Journal of Molecular Sciences 25, no. 17: 9470. https://doi.org/10.3390/ijms25179470