
Protein Microarrays for High Throughput Hydrogen/Deuterium Exchange Monitored by FTIR Imaging


Abstract
:
1. Introduction
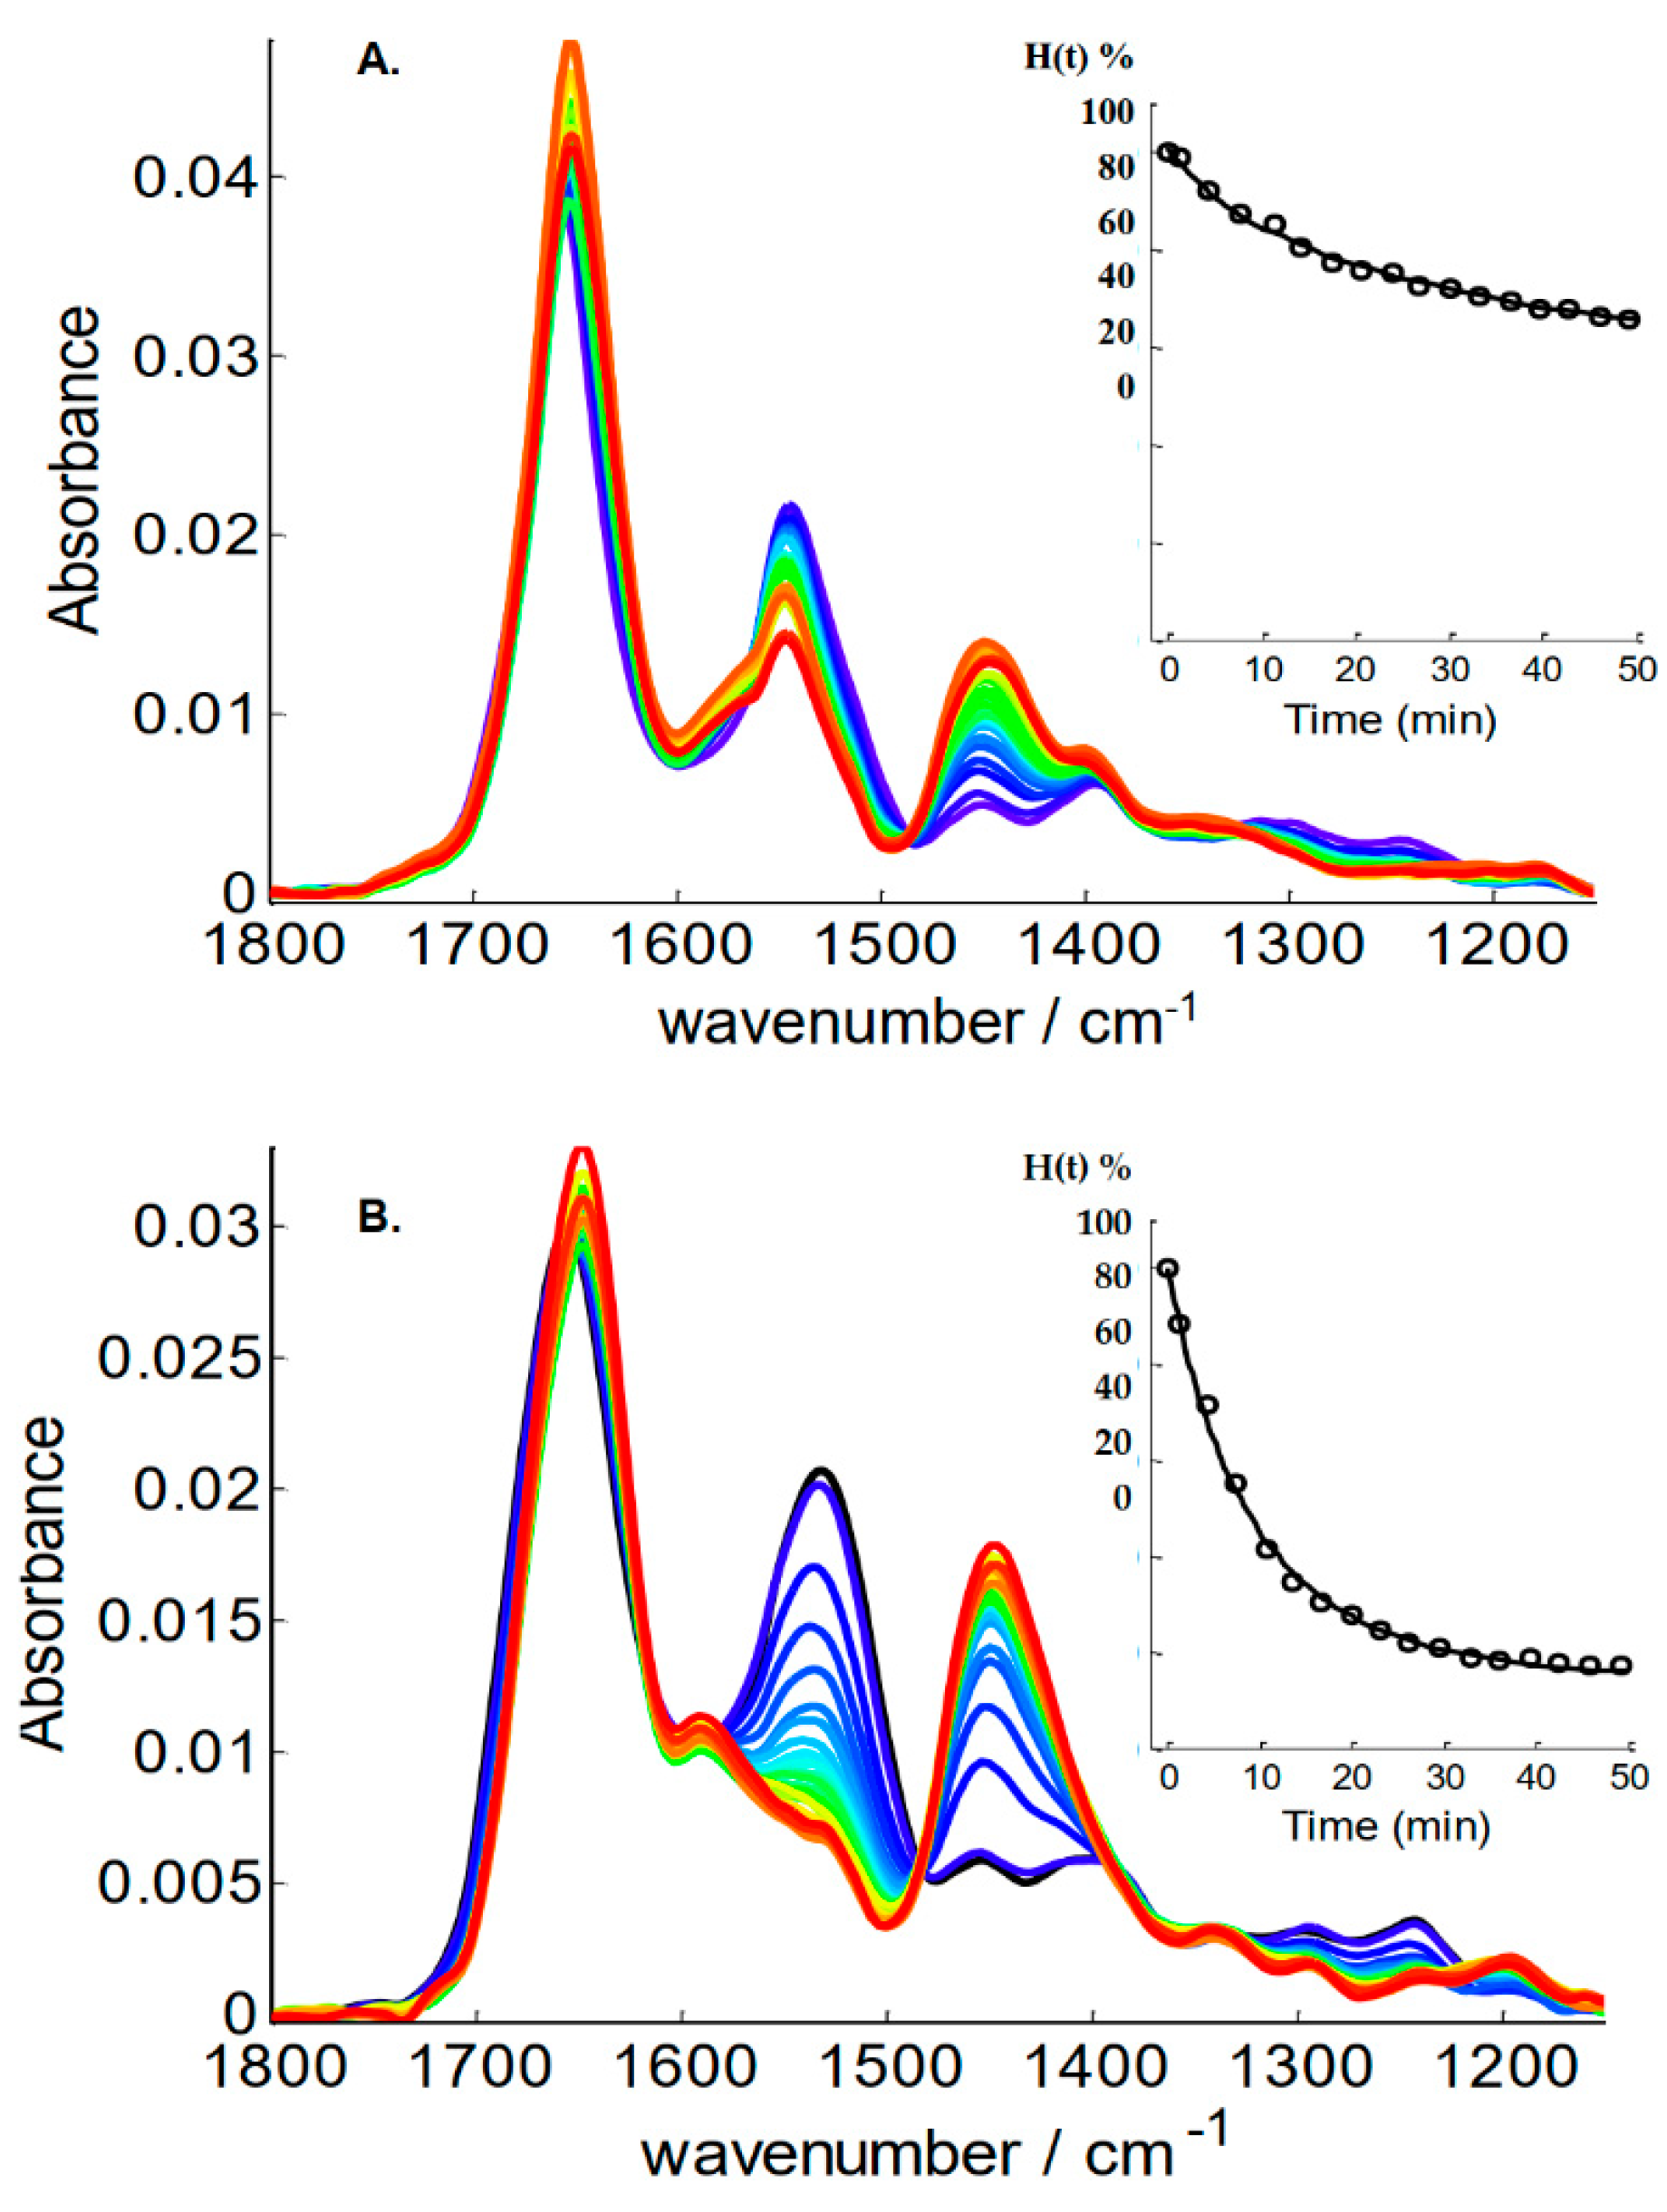
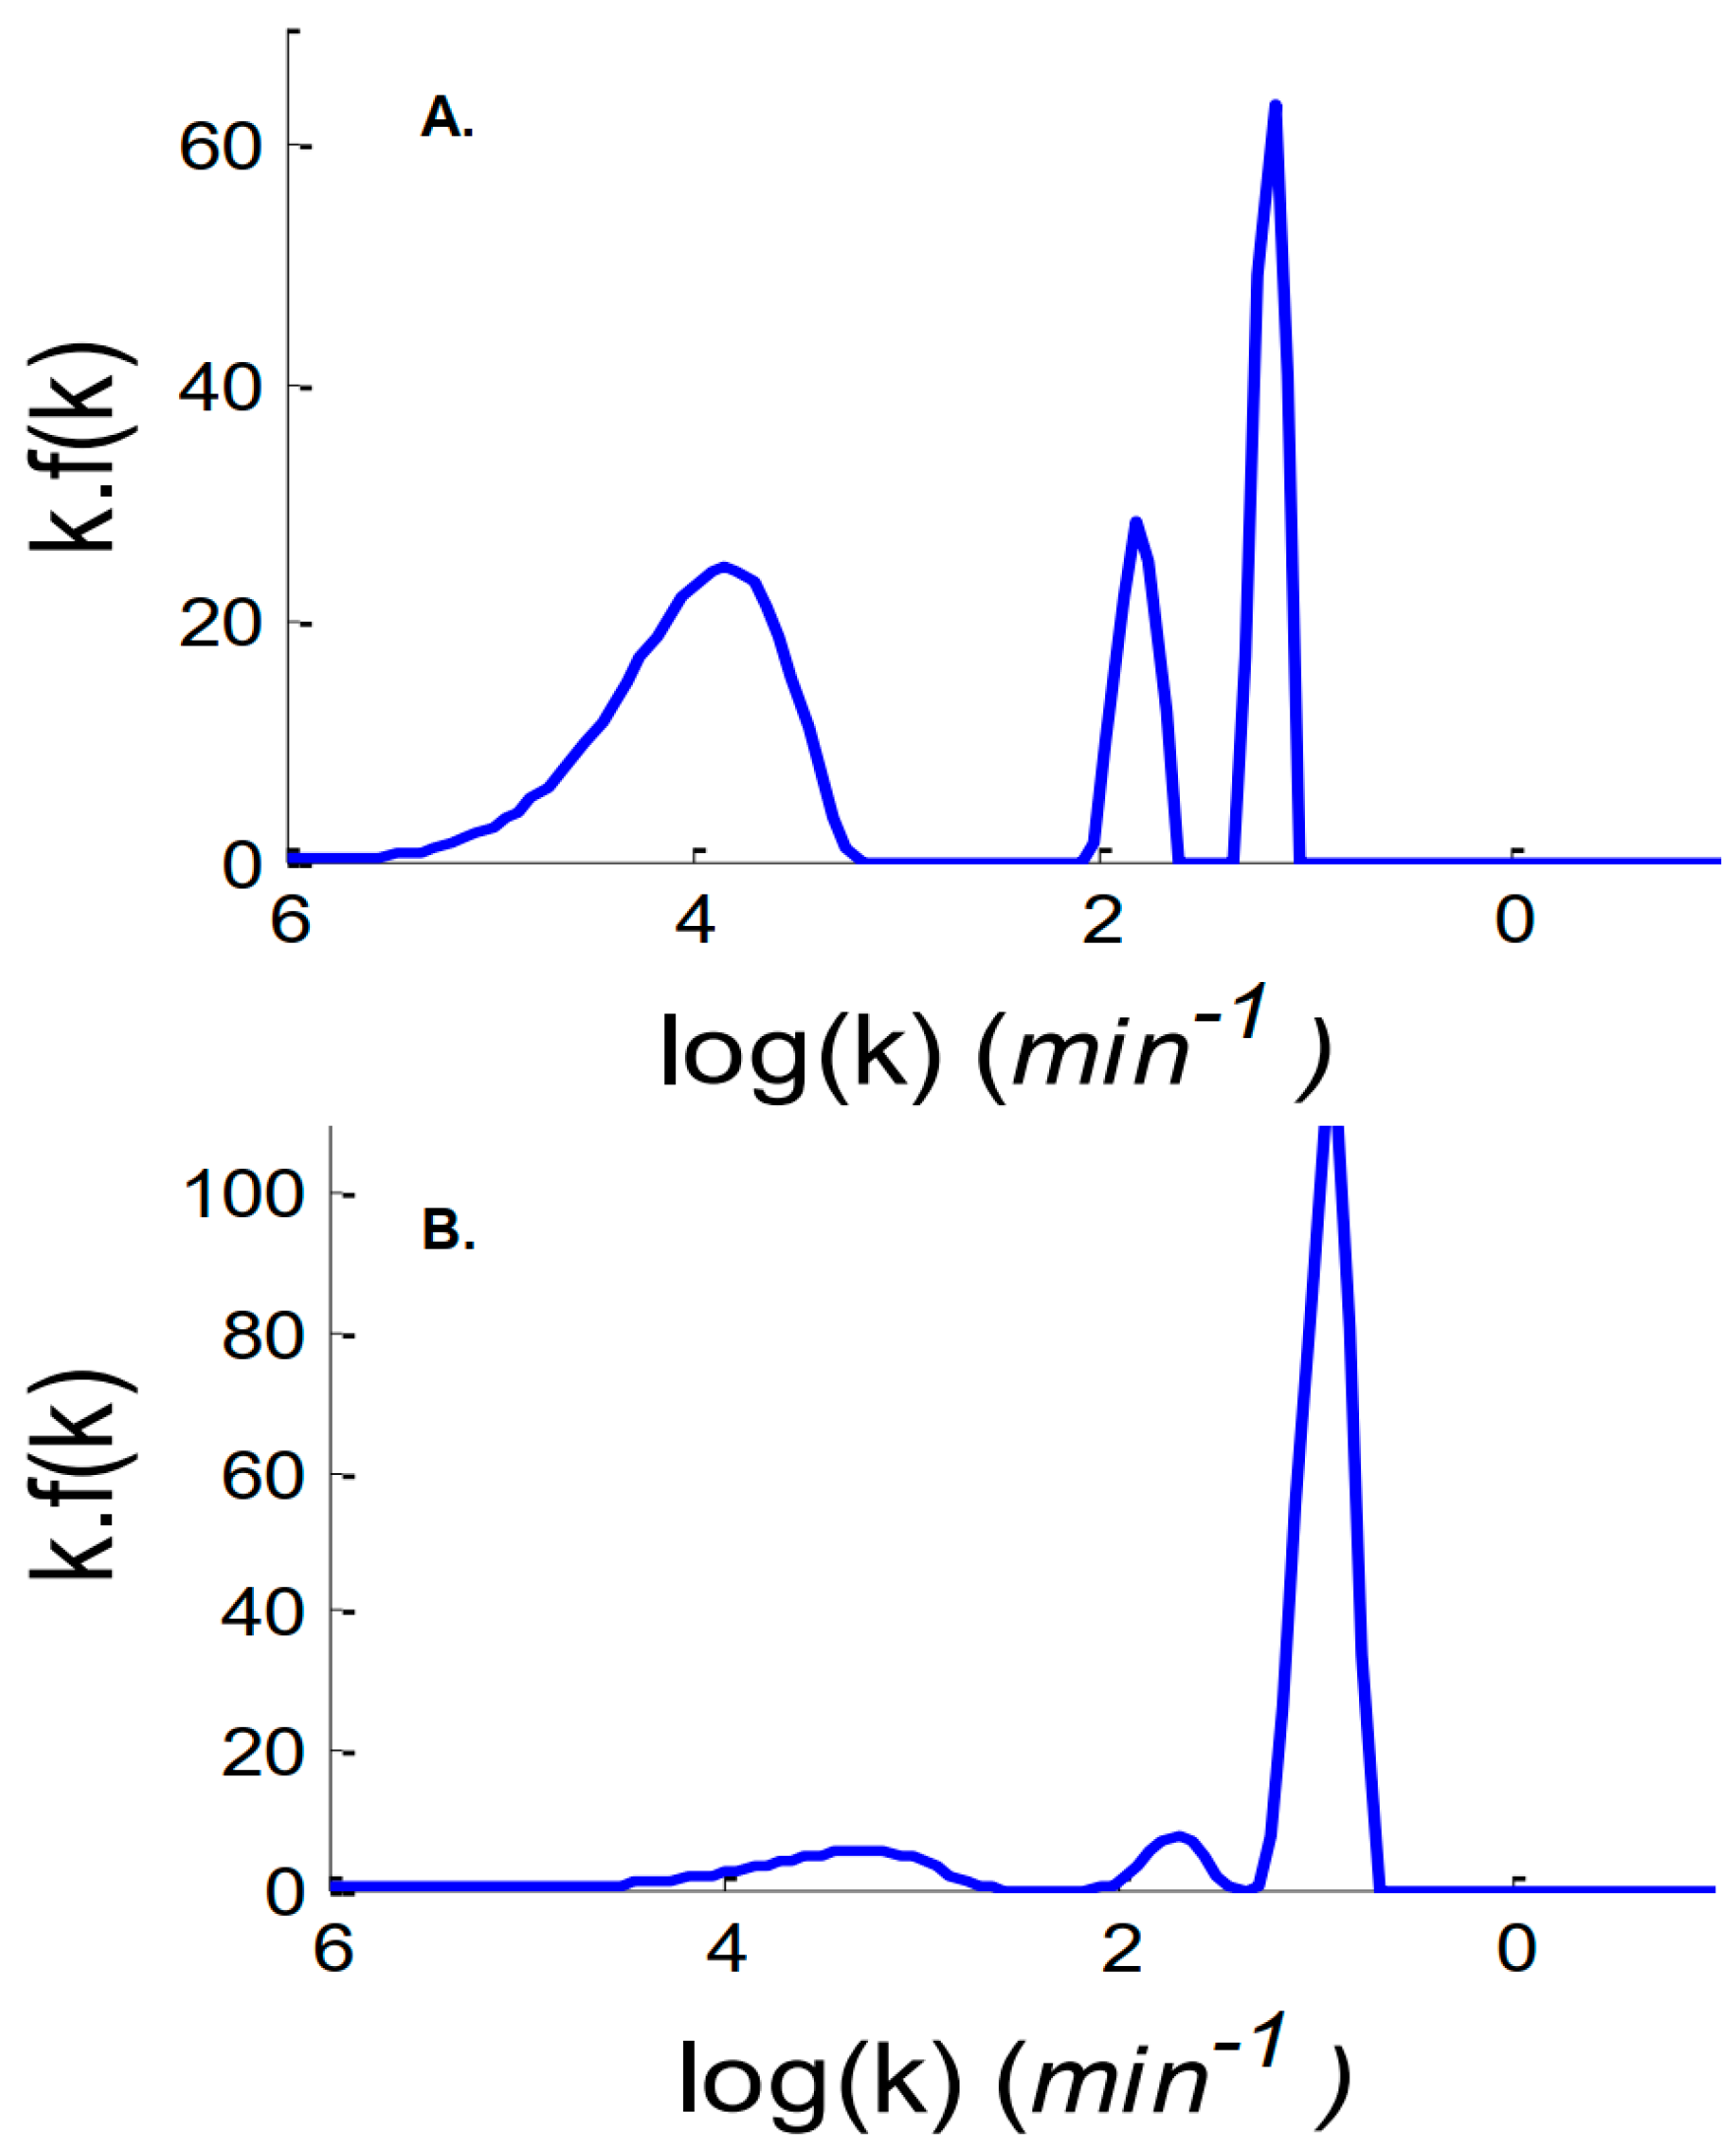
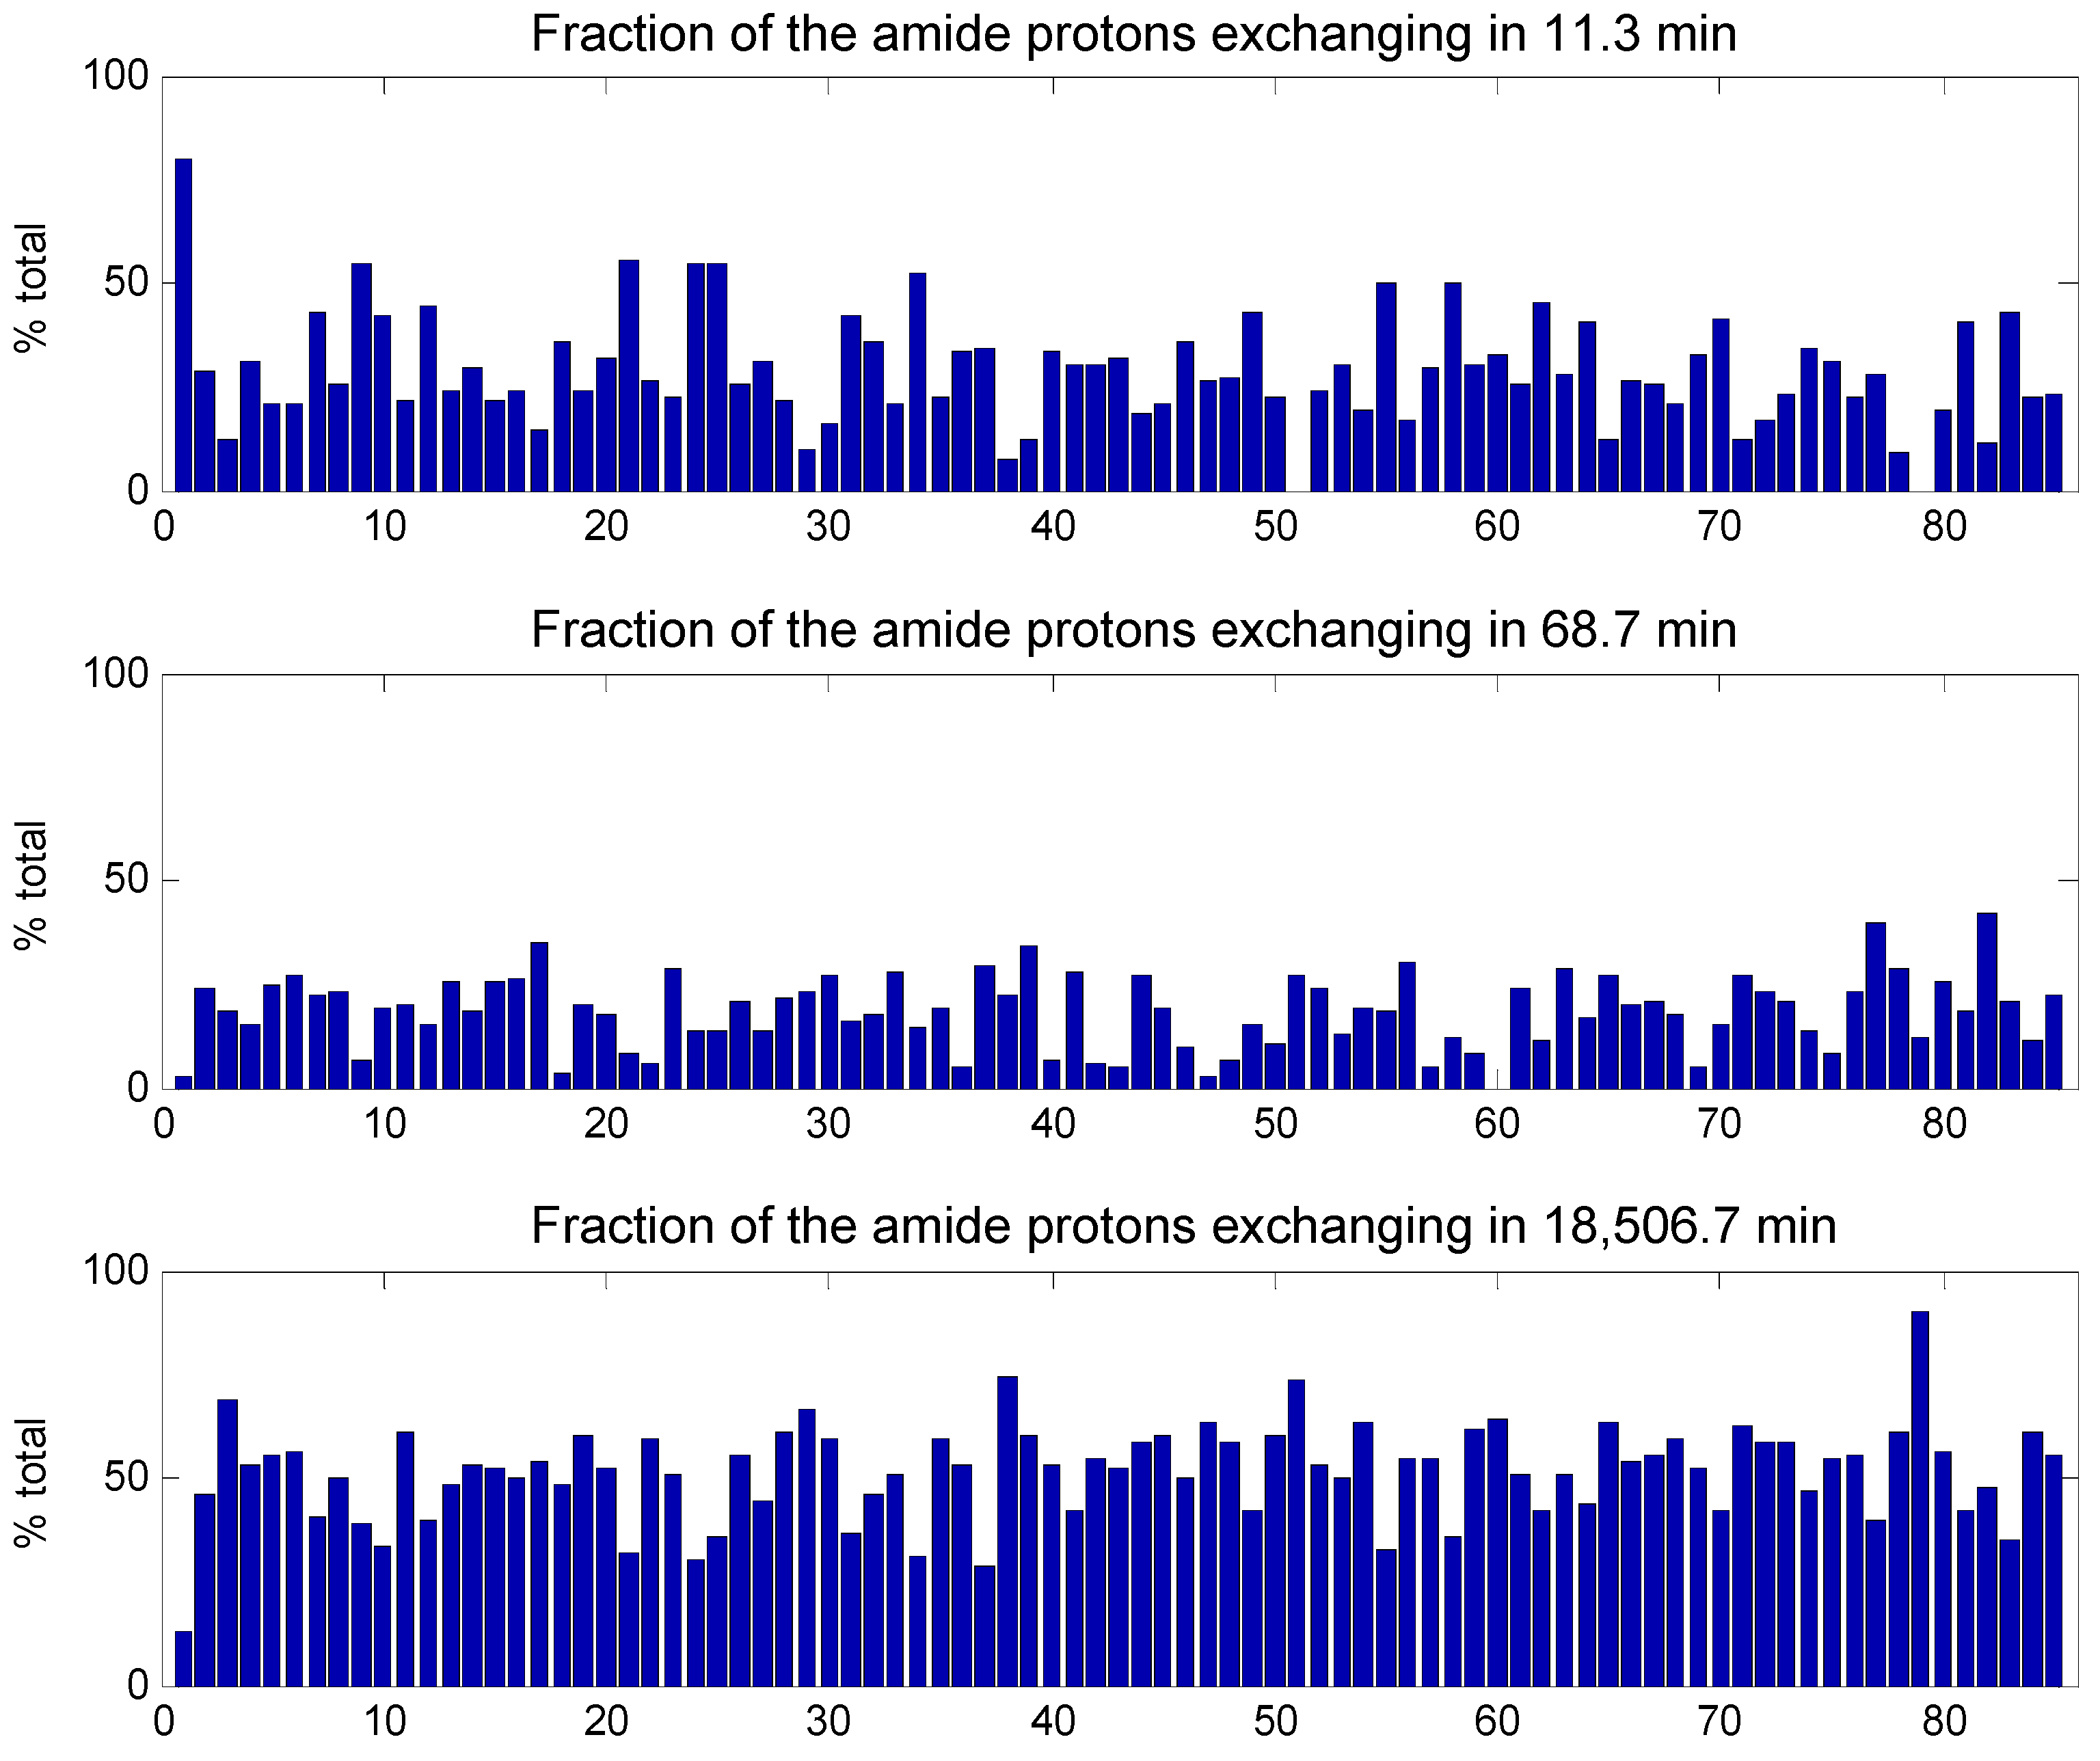
2. Results
3. Discussion
4. Materials and Methods
4.1. Proteins
4.2. Protein Microarray Printing and Imaging
4.3. Hydrogen Deuterium Exchange
4.4. Analysis of the Kinetics
Supplementary Materials
Author Contributions
Funding
Data Availability Statement
Conflicts of Interest
References
- Roberts, C.J. Therapeutic Protein Aggregation: Mechanisms, Design, and Control. Trends Biotechnol. 2014, 32, 372–380. [Google Scholar] [CrossRef] [PubMed]
- Rosa, M.; Roberts, C.J.; Rodrigues, M.A. Connecting High-Temperature and Lowtemperature Protein Stability and Aggregation. PLoS ONE 2017, 12, e0176748. [Google Scholar] [CrossRef] [PubMed]
- Wei, H.; Mo, J.; Tao, L.; Russell, R.J.; Tymiak, A.A.; Chen, G.; Iacob, R.E.; Engen, J.R. Hydrogen/Deuterium Exchange Mass Spectrometry for Probing Higher Order Structure of Protein Therapeutics: Methodology and Applications. Drug Discov. Today 2014, 19, 95–102. [Google Scholar] [CrossRef] [PubMed]
- Berkowitz, S.A.; Engen, J.R.; Mazzeo, J.R.; Jones, G.B. Analytical Tools for Characterizing Biopharmaceuticals and the Implications for Biosimilars. Nat. Rev. Drug Discov. 2012, 11, 527–540. [Google Scholar] [CrossRef] [PubMed]
- Zhang, Z. Complete Extraction of Protein Dynamics Information in Hydrogen/Deuterium Exchange Mass Spectrometry Data. Anal. Chem. 2020, 92, 6486–6494. [Google Scholar] [CrossRef]
- Hilser, V.J.; Dowdy, D.; Oas, T.G.; Freire, E. The structural distribution of cooperative interactions in proteins: Analysis of the native state ensemble. Proc. Natl. Acad. Sci. USA 1998, 95, 9903–9908. [Google Scholar] [CrossRef]
- Salmas RE, B.A. Deep Learning Enables Automatic Correction of Experimental HDX-MS Data with Applications in Protein Modeling. J. Am. Soc. Mass Spectrom. 2024, 35, 197–204. [Google Scholar] [CrossRef]
- Zhang, Z.; Smith, D.L. Determination of Amide Hydrogen Exchange by Mass Spectrometry: A New Tool for Protein Structure Elucidation. Protein Sci. 1993, 2, 522–531. [Google Scholar] [CrossRef]
- Englander, J.J.; Del Mar, C.; Li, W.; Englander, S.W.; Kim, J.S.; Stranz, D.D.; Hamuro, Y.; Woods, V.L. Protein Structure Change Studied by Hydrogen-Deuterium Exchange, Functional Labeling, and Mass Spectrometry. Proc. Natl. Acad. Sci. USA 2003, 100, 7057–7062. [Google Scholar] [CrossRef]
- Lam, T.T.; Lanman, J.K.; Emmett, M.R.; Hendrickson, C.L.; Marshall, A.G.; Prevelige, P.E. Mapping of Protein:Protein Contact Surfaces by Hydrogen/Deuterium Exchange, Followed by on-Line High-Performance Liquid Chromatography-Electrospray Ionization Fourier-Transform Ion-Cyclotron-Resonance Mass Analysis. J. Chromatogr. A 2002, 982, 85–95. [Google Scholar] [CrossRef]
- Nazari, Z.E.; van de Weert, M.; Bou-Assaf, G.; Houde, D.; Weiskopf, A.; Rand, K.D. Rapid Conformational Analysis of Protein Drugs in Formulation by Hydrogen/Deuterium Exchange Mass Spectrometry. J. Pharm. Sci. 2016, 105, 3269–3277. [Google Scholar] [CrossRef] [PubMed]
- Zhang, H.-M.; Bou-Assaf, G.M.; Emmett, M.R.; Marshall, A.G. Fast Reversed-Phase Liquid Chromatography to Reduce Back Exchange and Increase Throughput in H/D Exchange Monitored by FT-ICR Mass Spectrometry. J. Am. Soc. Mass Spectrom. 2009, 20, 520–524. [Google Scholar] [CrossRef] [PubMed]
- Udgaonkar, J.B.; Baldwin, R.L. NMR Evidence for an Early Framework Intermediate on the Folding Pathway of Ribonuclease A. Nature 1988, 335, 694–699. [Google Scholar] [CrossRef] [PubMed]
- Jakubek, R.; Handen, J.; White, S.; Asher, S.; Lednev, I. Ultraviolet Resonance Raman Spectroscopic Markers for Protein Structure and Dynamics. Trends Anal. Chem. 2018, 103, 223–229. [Google Scholar] [CrossRef]
- Haris, P.I.; Lee, D.C.; Chapman, D. A Fourier Transform Infrared Investigation of the Structural Differences between Ribonuclease A and Ribonuclease S. Biochim. Biophys. Acta 1986, 874, 255–265. [Google Scholar] [CrossRef]
- Vigano, C.; Smeyers, M.; Raussens, V.; Scheirlinckx, F.; Ruysschaert, J.M.; Goormaghtigh, E. Hydrogen-Deuterium Exchange in Membrane Proteins Monitored by IR Spectroscopy: A New Tool to Resolve Protein Structure and Dynamics. Biopolymers 2004, 74, 19–26. [Google Scholar] [CrossRef]
- Di Nardo, G.; Breitner, M.; Sadeghi, S.J.; Castrignanò, S.; Mei, G.; Di Venere, A.; Nicolai, E.; Allegra, P.; Gilardi, G. Dynamics and Flexibility of Human Aromatase Probed by FTIR and Time Resolved Fluorescence Spectroscopy. PLoS ONE 2013, 8, e82118. [Google Scholar] [CrossRef]
- Goormaghtigh, E.; Vigneron, L.; Scarborough, G.A.; Ruysschaert, J.M. Tertiary Conformational Changes of the Neurospora Crassa Plasma Membrane H(+)-ATPase Monitored by Hydrogen/Deuterium Exchange Kinetics. A Fourier Transformed Infrared Spectroscopy Approach. J. Biol. Chem. 1994, 269, 27409–27413. [Google Scholar] [CrossRef]
- Raussens, V.; Ruysschaert, J.M.; Goormaghtigh, E. Fourier Transform Infrared Spectroscopy Study of the Secondary Structure of the Gastric H+,K+-ATPase and of Its Membrane-Associated Proteolytic Peptides. J. Biol. Chem. 1997, 272, 262–270. [Google Scholar] [CrossRef]
- Scheirlinckx, F.; Raussens, V.; Ruysschaert, J.-M.; Goormaghtigh, E. Conformational Changes in Gastric H+/K+-ATPase Monitored by Difference Fourier-Transform Infrared Spectroscopy and Hydrogen/Deuterium Exchange. Biochem. J. 2004, 382, 121–129. [Google Scholar] [CrossRef]
- Sonveaux, N.; Shapiro, A.B.; Goormaghtigh, E.; Ling, V.; Ruysschaert, J.M. Secondary and Tertiary Structure Changes of Reconstituted P-Glycoprotein. A Fourier Transform Attenuated Total Reflection Infrared Spectroscopy Analysis. J. Biol. Chem. 1996, 271, 24617–24624. [Google Scholar] [CrossRef] [PubMed]
- Grimard, V.; Vigano, C.; Margolles, A.; Wattiez, R.; van-Veen, H.W.; Konings, W.N.; Ruysschaert, J.M.; Goormaghtigh, E. Structure and Dynamics of the Membrane-Embedded Domain of LmrA Investigated by Coupling Polarized ATR-FTIR Spectroscopy and (1)H/(2)H Exchange. Biochemistry 2001, 40, 11876–11886. [Google Scholar] [CrossRef] [PubMed]
- Wang, Y.; Boysen, R.I.; Wood, B.R.; Kansiz, M.; McNaughton, D.; Hearn, M.T.W. Determination of the Secondary Structure of Proteins in Different Environments by FTIR-ATR Spectroscopy and PLS Regression. Biopolymers 2008, 89, 895–905. [Google Scholar] [CrossRef] [PubMed]
- Navea, S.; Tauler, R.; de Juan, A. Application of the Local Regression Method Interval Partial Least-Squares to the Elucidation of Protein Secondary Structure. Anal. Biochem. 2005, 336, 231–242. [Google Scholar] [CrossRef] [PubMed]
- Arrondo, J.L.; Muga, A.; Castresana, J.; Goñi, F.M. Quantitative Studies of the Structure of Proteins in Solution by Fourier-Transform Infrared Spectroscopy. Prog. Biophys. Mol. Biol. 1993, 59, 23–56. [Google Scholar] [CrossRef]
- Lee, D.C.; Haris, P.I.; Chapman, D.; Mitchell, R.C. Determination of Protein Secondary Structure Using Factor Analysis of Infrared Spectra. Biochemistry 1990, 29, 9185–9193. [Google Scholar] [CrossRef]
- Gómez-Gil, L.; Schürch, D.; Goormaghtigh, E.; Pérez-Gil, J. Pulmonary Surfactant Protein SP-C Counteracts the Deleterious Effects of Cholesterol on the Activity of Surfactant Films under Physiologically Relevant Compression-Expansion Dynamics. Biophys. J. 2009, 97, 2736–2745. [Google Scholar] [CrossRef]
- Wilcox, K.E.; Blanch, E.W.; Doig, A.J. Determination of Protein Secondary Structure from Infrared Spectra Using Partial Least-Squares Regression. Biochemistry 2016, 55, 3794–3802. [Google Scholar] [CrossRef]
- De Meutter, J.; Goormaghtigh, E. FTIR Imaging of Protein Microarrays for High Throughput Secondary Structure Determination. Anal. Chem. 2021, 93, 3733–3741. [Google Scholar] [CrossRef]
- Derenne, A.; Derfoufi, K.-M.; Cowper, B.; Delporte, C.; Goormaghtigh, E. FTIR Spectroscopy as an Analytical Tool to Compare Glycosylation in Therapeutic Monoclonal Antibodies. Anal. Chim. Acta 2020, 1112, 62–71. [Google Scholar] [CrossRef]
- Derenne, A.; Vandersleyen, O.; Goormaghtigh, E. Lipid Quantification Method Using FTIR Spectroscopy Applied on Cancer Cell Extracts. Biochim. Biophys. Acta 2014, 1841, 1200–1209. [Google Scholar] [CrossRef]
- Dreissig, I.; Machill, S.; Salzer, R.; Krafft, C. Quantification of Brain Lipids by FTIR Spectroscopy and Partial Least Squares Regression. Spectrochim. Acta A 2009, 71, 2069–2075. [Google Scholar] [CrossRef] [PubMed]
- Pastrana, B.; Meuse, C.W. Two-Dimensional Correlation and Two-Dimensional Co-Distribution Spectroscopies of Proteins. In Encyclopedia of Analytical Chemistry; Wiley: Hoboken, NJ, USA, 2022. [Google Scholar]
- Pastrana, B.; Nieves, S.; Li, W.; Liu, X.; Dimitrov, D.S. Developability Assessment of an Isolated CH2 Immunoglobulin Domain. Anal. Chem. 2021, 93, 1342–1351. [Google Scholar] [CrossRef]
- Pastrana, B.; Culyba, E.; Nieves, S.; Sazinsky, S.L.; Canto, E.I.; Noda, I. Streamlined Multi-Attribute Assessment of an Array of Clinical-Stage Antibodies: Relationship Between Degradation and Stability. Appl. Spectrosc. 2024, in press. [Google Scholar] [CrossRef] [PubMed]
- Tamm, L.K.; Tatulian, S.A. Infrared Spectroscopy of Proteins and Peptides in Lipid Bilayer. Q. Rev. Biophys. 1997, 30, 365–429. [Google Scholar] [CrossRef] [PubMed]
- Krimm, S.; Bandekar, J. Vibrational Spectroscopy and Conformation of Peptides, Polypeptides and Proteins. Adv. Prot. Chem. 1986, 38, 181–364. [Google Scholar]
- Tiernan, H.; Byrne, B.; Kazarian, S.G. ATR-FTIR Spectroscopy and Spectroscopic Imaging for the Analysis of Biopharmaceuticals. Spectrochim. Acta-Part A Mol. Biomol. Spectrosc. 2020, 241, 118636. [Google Scholar] [CrossRef]
- Boulet-Audet, M.; Byrne, B.; Kazarian, S.G. High-Throughput Thermal Stability Analysis of a Monoclonal Antibody by Attenuated Total Reflection FT-IR Spectroscopic Imaging. Anal. Chem. 2014, 86, 9786–9793. [Google Scholar] [CrossRef]
- De Meutter, J.; Goormaghtigh, E. A Convenient Protein Library for Spectroscopic Calibrations. Comput. Struct. Biotechnol. J. 2020, 18, 1864–1876. [Google Scholar] [CrossRef]
- Ye, X.; Hu, Y.; Qiu, H.; Li, N. Probe Capsid Structure Stability and Dynamics of Adeno-Associated Virus as an Important Viral Vector for Gene Therapy by Hydrogen-Deuterium Exchange-Mass Spectrometry. Protein Sci. 2024, 33, e5074. [Google Scholar] [CrossRef]
- Hollecker, M.; Vincent, M.; Gallay, J.; Ruysschaert, J.M.; Goormaghtigh, E. Insight into the Factors Influencing the Backbone Dynamics of Three Homologous Proteins, Dendrotoxins I and K, and BPTI: FTIR and Time-Resolved Fluorescence Investigations. Biochemistry 2002, 41, 15267–15276. [Google Scholar] [CrossRef]
- Raussens, V.; Narayanaswami, V.; Goormaghtigh, E.; Ryan, R.O.; Ruysschaert, J.M. Hydrogen/Deuterium Exchange Kinetics of Apolipophorin-III in Lipid-Free and Phospholipid-Bound States. An Analysis by Fourier Transform Infrared Spectroscopy. J. Biol. Chem. 1996, 271, 23089–23095. [Google Scholar] [CrossRef] [PubMed]
- De Meutter, J.; Goormaghtigh, E. Evaluation of Protein Secondary Structure from FTIR Spectra Improved after Partial Deuteration. Eur. Biophys. J. 2021, 50, 613–628. [Google Scholar] [CrossRef] [PubMed]
- Barth, A. Infrared Spectroscopy of Proteins. Biochim. Biophys. Acta 2007, 1767, 1073–1101. [Google Scholar] [CrossRef]
- Rahmelow, K.; Hubner, W.; Ackermann, T. Infrared Absorbances of Protein Side Chains. Anal. Biochem. 1998, 257, 1–11. [Google Scholar] [CrossRef] [PubMed]
- Chirgadze, Y.N.; Fedorov, O.V.; Trushina, N.P. Estimation of Amino Acid Residue Side-Chain Absorption in the Infrared Spectra of Protein Solutions in Heavy Water. Biopolymers 1975, 14, 679–694. [Google Scholar] [CrossRef] [PubMed]
- Raussens, V.; Ruysschaert, J.M.; Goormaghtigh, E. Analysis of H-1/H-2 Exchange Kinetics Using Model Infrared Spectra. Appl. Spectrosc. 2004, 58, 68–82. [Google Scholar] [CrossRef]
- Goormaghtigh, E. FTIR Data Processing and Analysis Tools. Adv. Biomed. Spectrosc. 2009, 2, 104–128. [Google Scholar]
- Goormaghtigh, E.; De-Jongh, H.H.; Ruysschaert, J.M. Relevance of Protein Thin Films Prepared for Attenuated Total Reflection Fourier Transform Infrared Spectroscopy: Significance of the PH. Appl. Spectrosc. 1996, 50, 1519–1527. [Google Scholar] [CrossRef]
- Downer, N.W.; Bruchman, T.J.; Hazzard, J.H. Infrared Spectroscopic Study of Photoreceptor Membrane and Purple Membrane. Protein Secondary Structure and Hydrogen Deuterium Exchange. J. Biol. Chem. 1986, 261, 3640–3647. [Google Scholar] [CrossRef]
- Haris, P.I.; Coke, M.; Chapman, D. Fourier Transform Infrared Spectroscopic Investigation of Rhodopsin Structure and Its Comparison with Bacteriorhodopsin. Biochim. Biophys. Acta 1989, 995, 160–167. [Google Scholar] [CrossRef] [PubMed]
- Haris, P.I.; Chapman, D.; Benga, G. A Fourier-Transform Infrared Spectroscopic Investigation of the Hydrogen-Deuterium Exchange and Secondary Structure of the 28-KDa Channel-Forming Integral Membrane Protein (CHIP28). Eur. J. Biochem. 1995, 233, 659–664. [Google Scholar] [CrossRef] [PubMed]
- Kleffel, B.; Garavito, R.M.; Baumeister, W.; Rosenbusch, J.P. Secondary Structure of a Channel-Forming Protein: Porin from E. Coli Outer Membranes. EMBO J. 1985, 4, 1589–1592. [Google Scholar] [CrossRef] [PubMed]
- Pastrana, B.; Mautone, A.J.; Mendelsohn, R. Fourier Transform Infrared Studies of Secondary Structure and Orientation of Pulmonary Surfactant SP-C and Its Effect on the Dynamic Surface Properties of Phospholipids. Biochemistry 1991, 30, 10058–10064. [Google Scholar] [CrossRef] [PubMed]
- de Jongh, H.H.; Goormaghtigh, E.; Ruysschaert, J.M.; de-Jongh, H.H. Amide-Proton Exchange of Water-Soluble Proteins of Different Structural Classes Studied at the Submolecular Level by Infrared Spectroscopy. Biochemistry 1997, 36, 13603–13610. [Google Scholar] [CrossRef]
- Tuchsen, E.; Hayes, J.M.; Ramaprasad, S.; Copie, V.; Woodward, C. Solvent Exchange of Buried Water and Hydrogen Exchange of Peptide NH Groups Hydrogen Bonded to Buried Waters in Bovine Pancreatic Trypsin Inhibitor. Biochemistry 1987, 26, 5163–5172. [Google Scholar] [CrossRef]
- Englander, S.W.; Mayne, L. The Nature of Protein Folding Pathways. Proc. Natl. Acad. Sci. USA 2014, 111, 15873–15880. [Google Scholar] [CrossRef]
- Englander, S.W.; Kallenbach, N.R. Hydrogen Exchange and Structural Dynamics of Proteins and Nucleic Acids. Q. Rev. Biophys. 1983, 16, 521–655. [Google Scholar] [CrossRef]
- Skinner, J.J.; Lim, W.K.; Bédard, S.; Black, B.E.; Englander, S.W. Protein Hydrogen Exchange: Testing Current Models. Protein Sci. 2012, 21, 987–995. [Google Scholar] [CrossRef]
- Skinner, J.J.; Lim, W.K.; Bédard, S.; Black, B.E.; Englander, S.W. Protein Dynamics Viewed by Hydrogen Exchange. Protein Sci. 2012, 21, 996–1005. [Google Scholar] [CrossRef]
- Neehaul, Y.; Kriegel, S.; Barquera, B.; Hellwig, P. Functional Studies on Membrane Proteins by Means of H/D Exchange in Infrared: Structural Changes in Na + NQR from V. Cholerae in the Presence of Lipids. Methods Mol. Biol. 2017, 1635, 247–257. [Google Scholar] [CrossRef] [PubMed]
- Iloro, I.; Narváez, D.; Guillén, N.; Camacho, C.M.; Guillén, L.; Cora, E.; Pastrana-Ríos, B. The Kinetics of the Hydrogen/Deuterium Exchange of Epidermal Growth Factor Receptor Ligands. Biophys. J. 2008, 94, 4041–4055. [Google Scholar] [CrossRef] [PubMed]
- Grdadolnik, J.; Maréchal, Y. Hydrogen-Deuterium Exchange in Bovine Serum Albumin Protein Monitored by Fourier Transform Infrared Spectroscopy, Part I: Structural Studies. Appl. Spectrosc. 2005, 59, 1347–1356. [Google Scholar] [CrossRef] [PubMed]
- Meskers, S.; Ruysschaert, J.M.; Goormaghtigh, E. Hydrogen-Deuterium Exchange of Streptavidin and Its Complex with Biotin Studied by 2D-Attenuated Total Reflection Fourier Transform Infrared Spectroscopy. J. Am. Chem. Soc. 1999, 121, 5115–5122. [Google Scholar] [CrossRef]
- Schinkel, J.E.; Downer, N.W.; Rupley, J.A. Hydrogen Exchange of Lysozyme Powders. Hydration Dependence of Internal Motions. Biochemistry 1985, 24, 352–366. [Google Scholar] [CrossRef]
- Careri, G.; Gratton, E.; Yang, P.H.; Rupley, J.A. Correlation of IR Spectroscopic, Heat Capacity, Diamagnetic Susceptibility and Enzymatic Measurements on Lysozyme Powder. Nature 1980, 284, 572–573. [Google Scholar] [CrossRef]
- Fang, R.; Obeidat, W.; Pikal, M.J.; Bogner, R.H. Evaluation of Predictors of Protein Relative Stability Obtained by Solid-State Hydrogen/Deuterium Exchange Monitored by FTIR. Pharm. Res. 2020, 37, 168. [Google Scholar] [CrossRef]
- De Meutter, J.; Derfoufi, M.K.; Goormaghtigh, E. Analysis of Protein Microarrays by FTIR Imaging. Biomed. Spectrosc. Imaging 2016, 5, 145–154. [Google Scholar] [CrossRef]
- De Meutter, J.; Vandenameele, J.; Matagne, A.; Goormaghtigh, E. Infrared Imaging of High Density Protein Arrays. Analyst 2017, 142, 1371–1380. [Google Scholar] [CrossRef]
- De Meutter, J.; Goormaghtigh, E. Searching for a Better Match between Protein Secondary Structure Definitions and Protein FTIR Spectra. Anal. Chem. 2021, 93, 1561–1568. [Google Scholar] [CrossRef]
- Knox, D.G.; Rosenberg, A. Fluctuations of Protein Structure as Expressed in the Distribution of Hydrogen Exchange Rate Constants. Biopolymers 1980, 19, 1049–1068. [Google Scholar] [CrossRef] [PubMed]
- Gregory, R.B.; Lumry, R. Hydrogen-Exchange Evidence for Distinct Structural Classes in Globular Proteins. Biopolymers 1985, 24, 301–326. [Google Scholar] [CrossRef] [PubMed]
- Provencher, S.W. CONTIN: A General Purpose Constrained Regularization Program for Inverting Noisy Linear Algebraic and Integral Equations. Comput. Phys. Commun. 1982, 27, 229–242. [Google Scholar] [CrossRef]
- Provencher, S.W.; Dovi, V.G. Direct Analysis of Continuous Relaxation Spectra. J. Biochem. Biophys. Methods 1979, 1, 313–318. [Google Scholar] [CrossRef]


Disclaimer/Publisher’s Note: The statements, opinions and data contained in all publications are solely those of the individual author(s) and contributor(s) and not of MDPI and/or the editor(s). MDPI and/or the editor(s) disclaim responsibility for any injury to people or property resulting from any ideas, methods, instructions or products referred to in the content. |
© 2024 by the authors. Licensee MDPI, Basel, Switzerland. This article is an open access article distributed under the terms and conditions of the Creative Commons Attribution (CC BY) license (https://creativecommons.org/licenses/by/4.0/).
Share and Cite
De Meutter, J.; Goormaghtigh, E. Protein Microarrays for High Throughput Hydrogen/Deuterium Exchange Monitored by FTIR Imaging. Int. J. Mol. Sci. 2024, 25, 9989. https://doi.org/10.3390/ijms25189989
De Meutter J, Goormaghtigh E. Protein Microarrays for High Throughput Hydrogen/Deuterium Exchange Monitored by FTIR Imaging. International Journal of Molecular Sciences. 2024; 25(18):9989. https://doi.org/10.3390/ijms25189989
Chicago/Turabian StyleDe Meutter, Joëlle, and Erik Goormaghtigh. 2024. "Protein Microarrays for High Throughput Hydrogen/Deuterium Exchange Monitored by FTIR Imaging" International Journal of Molecular Sciences 25, no. 18: 9989. https://doi.org/10.3390/ijms25189989