Article

Teosinte-Derived Advanced Backcross Population Harbors Genomic Regions for Grain Yield Attributing Traits in Maize

1
ICAR-Indian Institute of Maize Research, Ludhiana 141004, India
2
ICAR-Indian Agricultural Research Institute Regional Station, Karnal 132001, India
*
Author to whom correspondence should be addressed.
Int. J. Mol. Sci. 2024, 25(19), 10300; https://doi.org/10.3390/ijms251910300
Submission received: 4 September 2024 / Revised: 18 September 2024 / Accepted: 20 September 2024 / Published: 25 September 2024
(This article belongs to the Special Issue Molecular Genetics and Breeding Mechanisms in Crops: 2nd Edition)

Abstract

:
Maize is a highly versatile crop holding significant importance in global food, feed and nutritional security. Grain yield is a complex trait and difficult to improve without targeting the improvement of grain yield attributing traits, which are relatively less complex in nature. Hence, considering the erosion in genetic diversity, there is an urgent need to use wild relatives for genetic diversification and unravel the genomic regions for grain yield attributing traits in maize. Thus, the current study aimed to identify quantitative trait loci (QTLs) linked with grain yield and yield attributing traits. Two BC2F2 populations developed from the cross of LM13 with Zea parviglumis (population 1) and LM14 with Zea parviglumis (population 2) were genotyped and phenotyped in field conditions in the kharif season. BC2F2:3 lines in both populations were phenotyped again for grain yield and attributing traits in the spring season. In total, three QTLs each for ear height (EH), two QTLs for flag leaf length (FLL) and one QTL each for ear diameter (ED), plant height, flag leaf length (FLL), flag leaf width and 100 kernel-weight were identified in population 1. In population 2, two QTLs for kernel row per ear (KRPE) and one QTL for FLL were detected in. QTLs for EH, FLL and KPRE showed consistency across seasons. Among the identified QTLs, six QTLs were found to be co-localized near identified genomic regions in previous studies, validating their potential in contributing to trait expression. The identified QTLs can be utilized for marker assisted selection, transferring favorable alleles from wild relatives in modern maize.

1. Introduction

Maize is one of the most important and widely adapted cereal crops after rice and wheat in the world and the main source of food, feed, fodder, starch, biofuel and industrial applications [1,2,3]. Consequently, due to its diverse uses, the maize demand will further increase in the future. Therefore, to meet the demand in a changing climate scenario, improving yield under diverse ecologies should be the focus of maize researchers [4,5]. Yield is a complex trait and needs continuous breeding efforts for its improvement. Yield is an outcome of contribution of numerous yield attributing traits; hence, to optimize the yield expression, genetic manipulation of yield attributing traits is an effective way to enhance the yield [6].
Genetic diversity in the breeding germplasm is the key to improvement of grain yield and resistance/tolerance against biotic and abiotic stresses. Landraces, unadapted germplasm and wild species have enormous untapped genetic diversity for such traits and hence should be regularly utilized for genetic diversification in maize breeding programs [7]. Teosinte, commonly known as Z. mays ssp. parviglumis, is one of the progenitors of cultivated maize and possesses huge genetic diversity [1,8]. Pasztor and Borsos (1990) [9] and Srinivasan and Brewbaker (1999) [10] reported the genetic variability in teosinte for grain yield, yield attributing traits, disease resistance and insect pest tolerance.
The polygenic nature of yield and its associated traits necessitates its genetic dissection through quantitative trait loci (QTLs) analysis for subsequent use of QTLs in marker assisted selection. Tanksley and Nelson [11] introduced the Advanced Backcross Quantitative Trait Locus (AB-QTL) analysis in 1996 for identifying and transferring beneficial alleles from donor lines (wild or unadapted germplasm) into the elite cultivars. This technique allows for rapid development of improved lines that possess genomes nearly identical to the elite recurrent parent, as well as near isogenic lines containing the desired QTLs. The resulting improved lines can then be effectively used as donors or parents in maize breeding [12].
AB-QTL analysis has been successfully used in various crops like tomato, rice, maize, cotton, wheat and barley for identification of QTLs and transfer of favorable alleles from wild species into elite lines [13,14,15]. Hence, the present study aimed to utilize Z. parviglumis to develop two different BC2F2 and BC2F2:3 mapping populations, their evaluation in different seasons/environments and identification of genomic regions for grain yield and yield attributing traits. This study is expected to establish a foundation of utilization of pre-breeding populations in Indian maize breeding programs for genetic dissection of grain yield and component traits.

2. Results

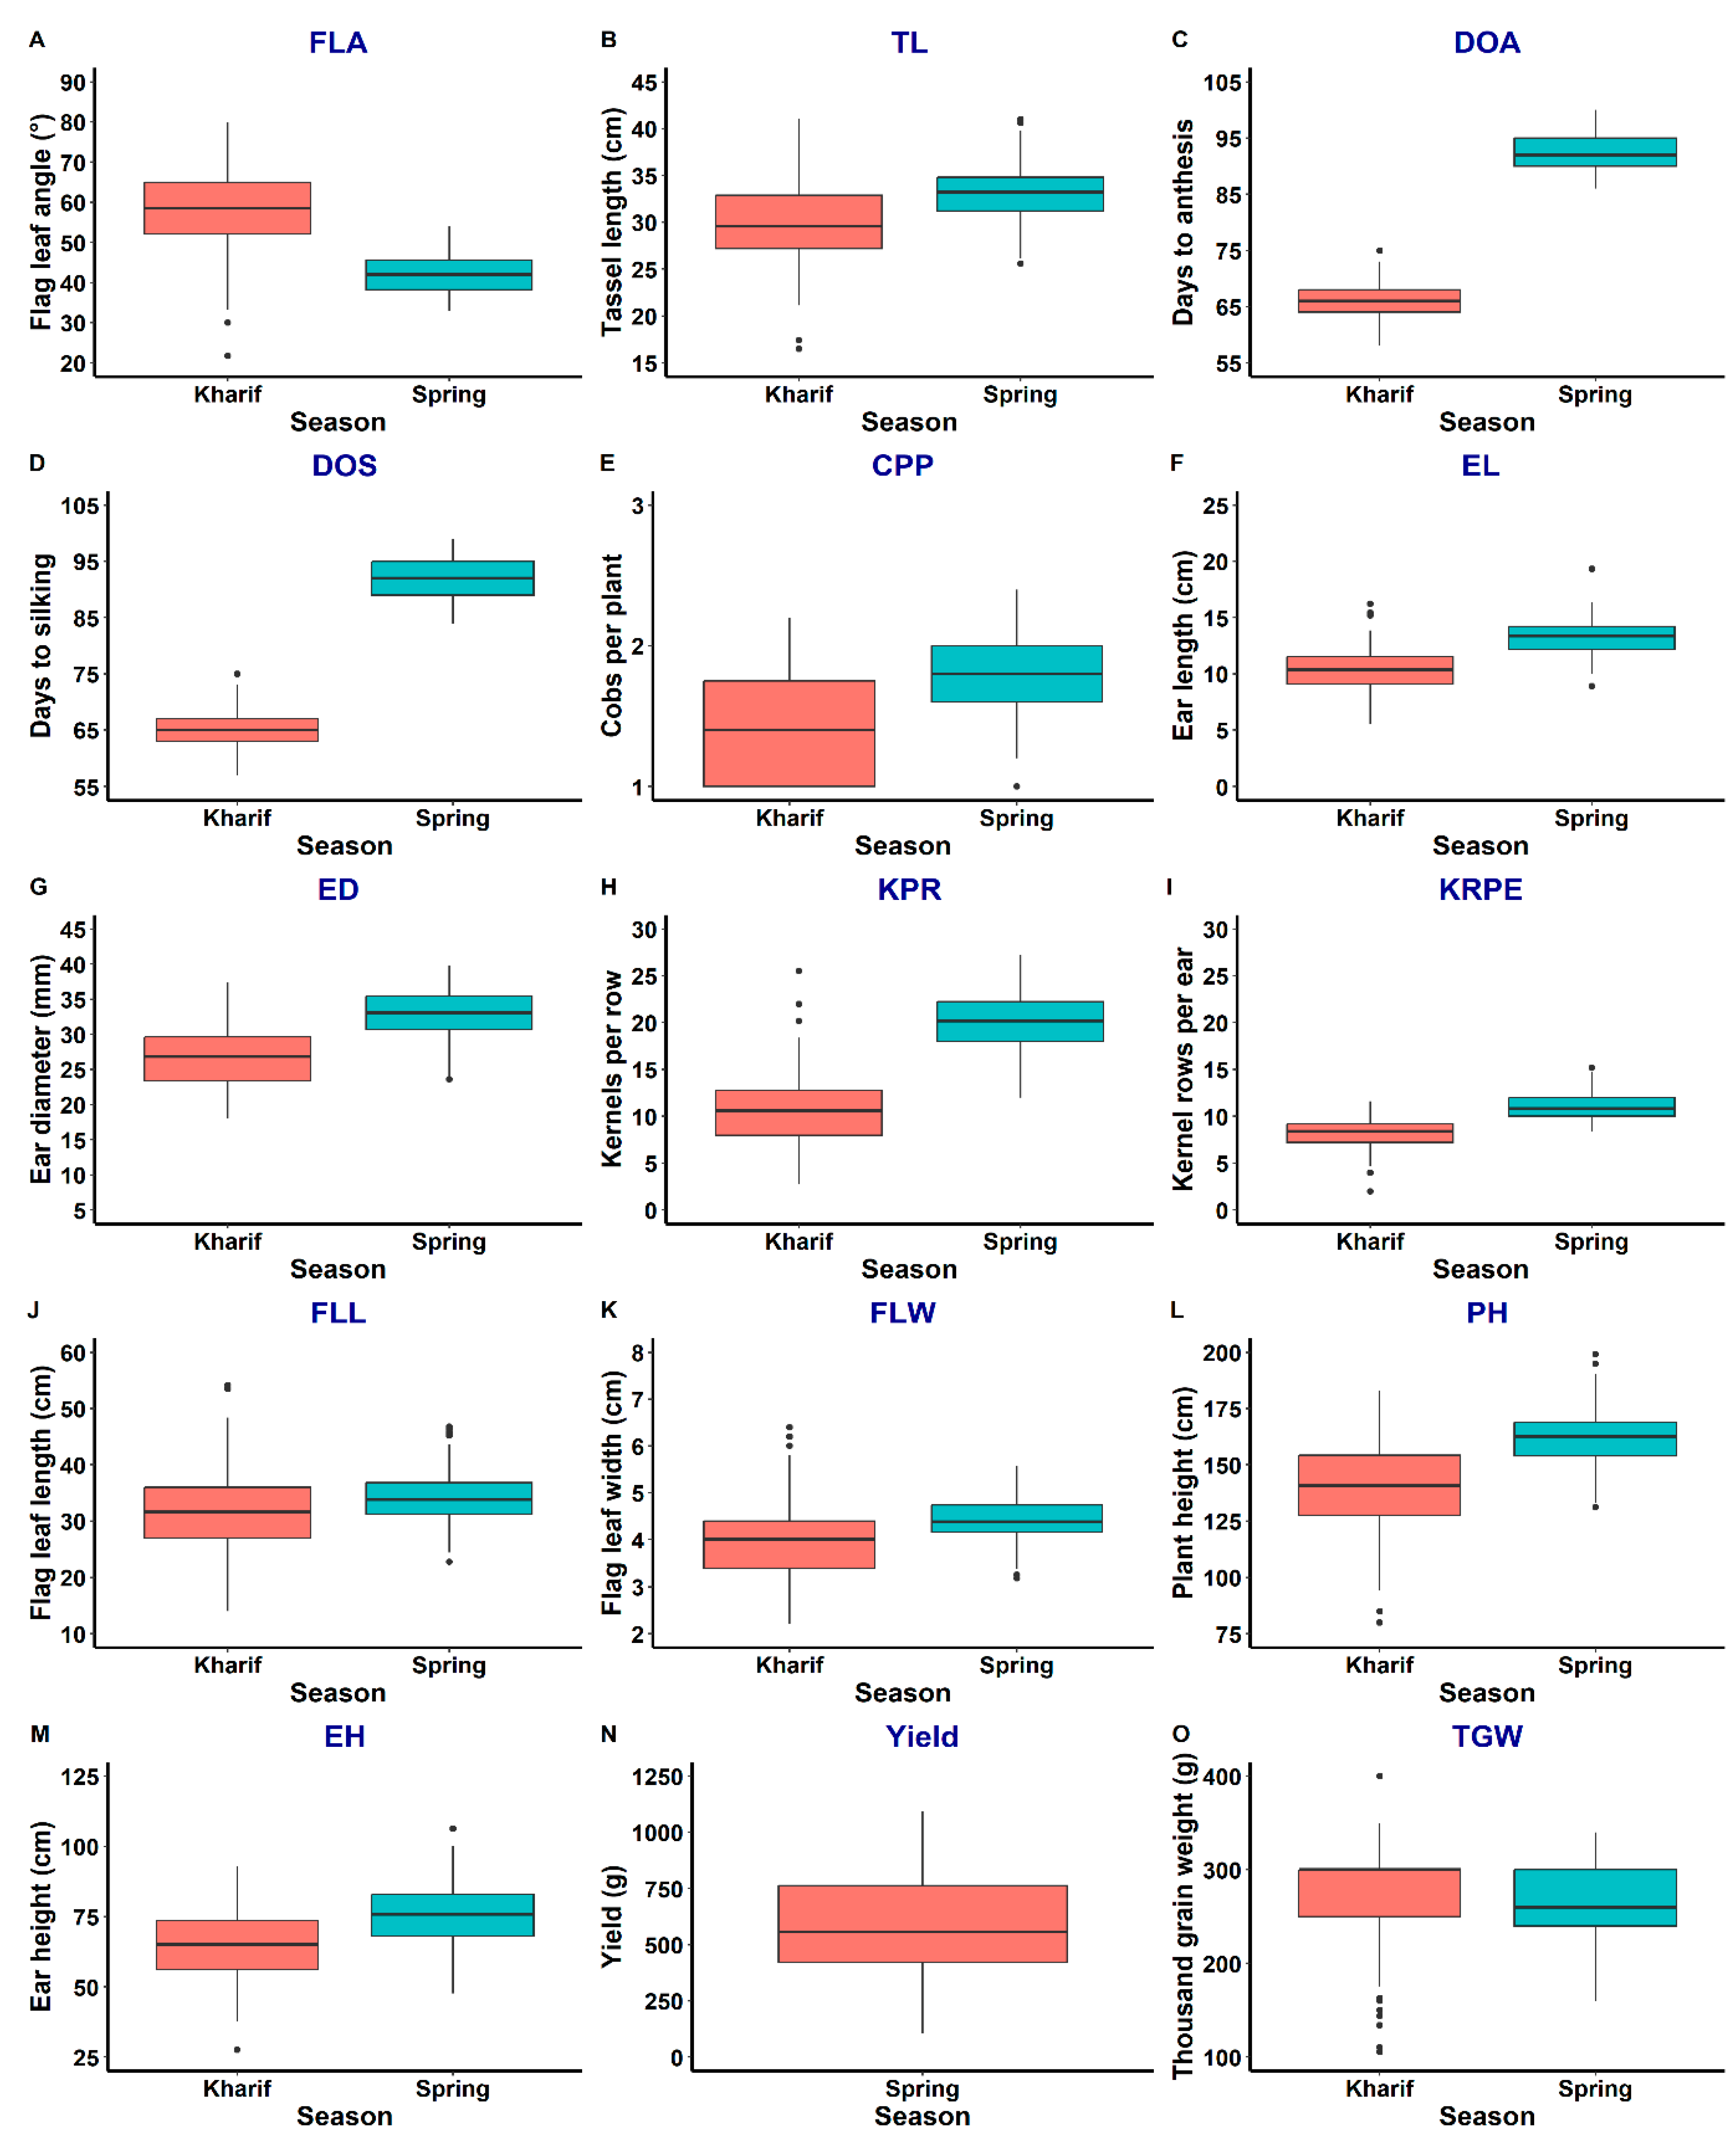
2.1. Evaluation of BC2F2 Population

Traits measured in both populations (population 1 and population 2) showed different ranges of variation under the normal environment (natural conditions) in the kharif and spring seasons (Figure 1, Figure 2 and Figure S1). Spring has relatively lower temperatures during early growth (expanding the duration of spring crops); however, in later growth stages, the environmental factors are more or less similar to kharif. Population 1 showed a relatively greater range of variation for traits such as FLA, TL, CPP, ED, FLL, FLW and PH in kharif than spring. Similarly, population 2 showed greater variation for FLA, TL, DTA, EL, ED, KPR, PH, EH and 100 kW in kharif than spring. For GY, population 1 showed a larger range of variation in comparison to GY in population 2 in spring. A total of 57 significant correlations were detected in population 1 in kharif (Supplementary Materials Table S1). TL showed consistently significant and highly positive correlations with traits EL, ED, KPR, KRPE, FLL, FLW, PH, EH and 100 kW, whereas DTA showed positive correlation with DTS and significant negative correlation with CPP, EL, KPR, KRPE and FLW. Similarly, the trait EL had significant positive correlations with ED, KPR, KRPE, FLL, FLW, PH, EH and 100 kW. The associations of PH were significantly positive with almost all the traits except FLA, DTA and DTS. Similarly, 100 kW had significant and positive associations with TL, EL, ED, KPR, KRPE, PH and EH under kharif environments. In contrast, a total of 44 significant associations were observed for population 1 during spring (Supplementary Materials Table S2). GY showed significant positive correlation with EL, ED, KPR, KRPE, PH, EH and 100 kW and negative correlation with traits DTA and DTS. The 100 kW showed consistently significant and highly positive correlations with TL, ED, KR, KRPE, FLL, FLW and GY, whereas DTA showed positive correlation with DTS, PH and EH and negative correlation with ED, KPR, KRPE and GY.
A total of 43 significant associations were observed in population 2 during kharif, of which TL showed positive correlation with EL, KPR, KRPE, FLL, PH and 100 kW (Supplementary Materials Table S3). DTA is significantly negatively correlated with ED, KPR, KRPE and FLW and positively correlated with only DTS. EL was found to be positively correlated with TL, ED, KPR, KRPE, FLL, FLW, PH, EH and 100 kW, while PH showed positive correlation with TL, EL, ED, KPR, KRPE, FLL, FLW and EH. The 100 kW was found to be positively correlated with TL, EL, ED, KPR and KRPE. In contrast, only 14 significant trait correlations were found in population 2 during spring (Supplementary Materials Table S4). GY was found to be positively correlated with EL, KRPE and 100 kW, while TL and DTA showed positive correlation with FLL and DTS, respectively. EL was significantly and positively correlated with ED, KPR and GY, while PH was positively correlated with only EH (Section 2.1).

2.2. QTL Identification

A total of 8 QTLs were identified to be significantly associated with six grain yield related traits in population 1, while three QTLs were identified in population 2 in this study. The identified QTLs were located on chromosomes 2, 4, 5, 9 and 10.

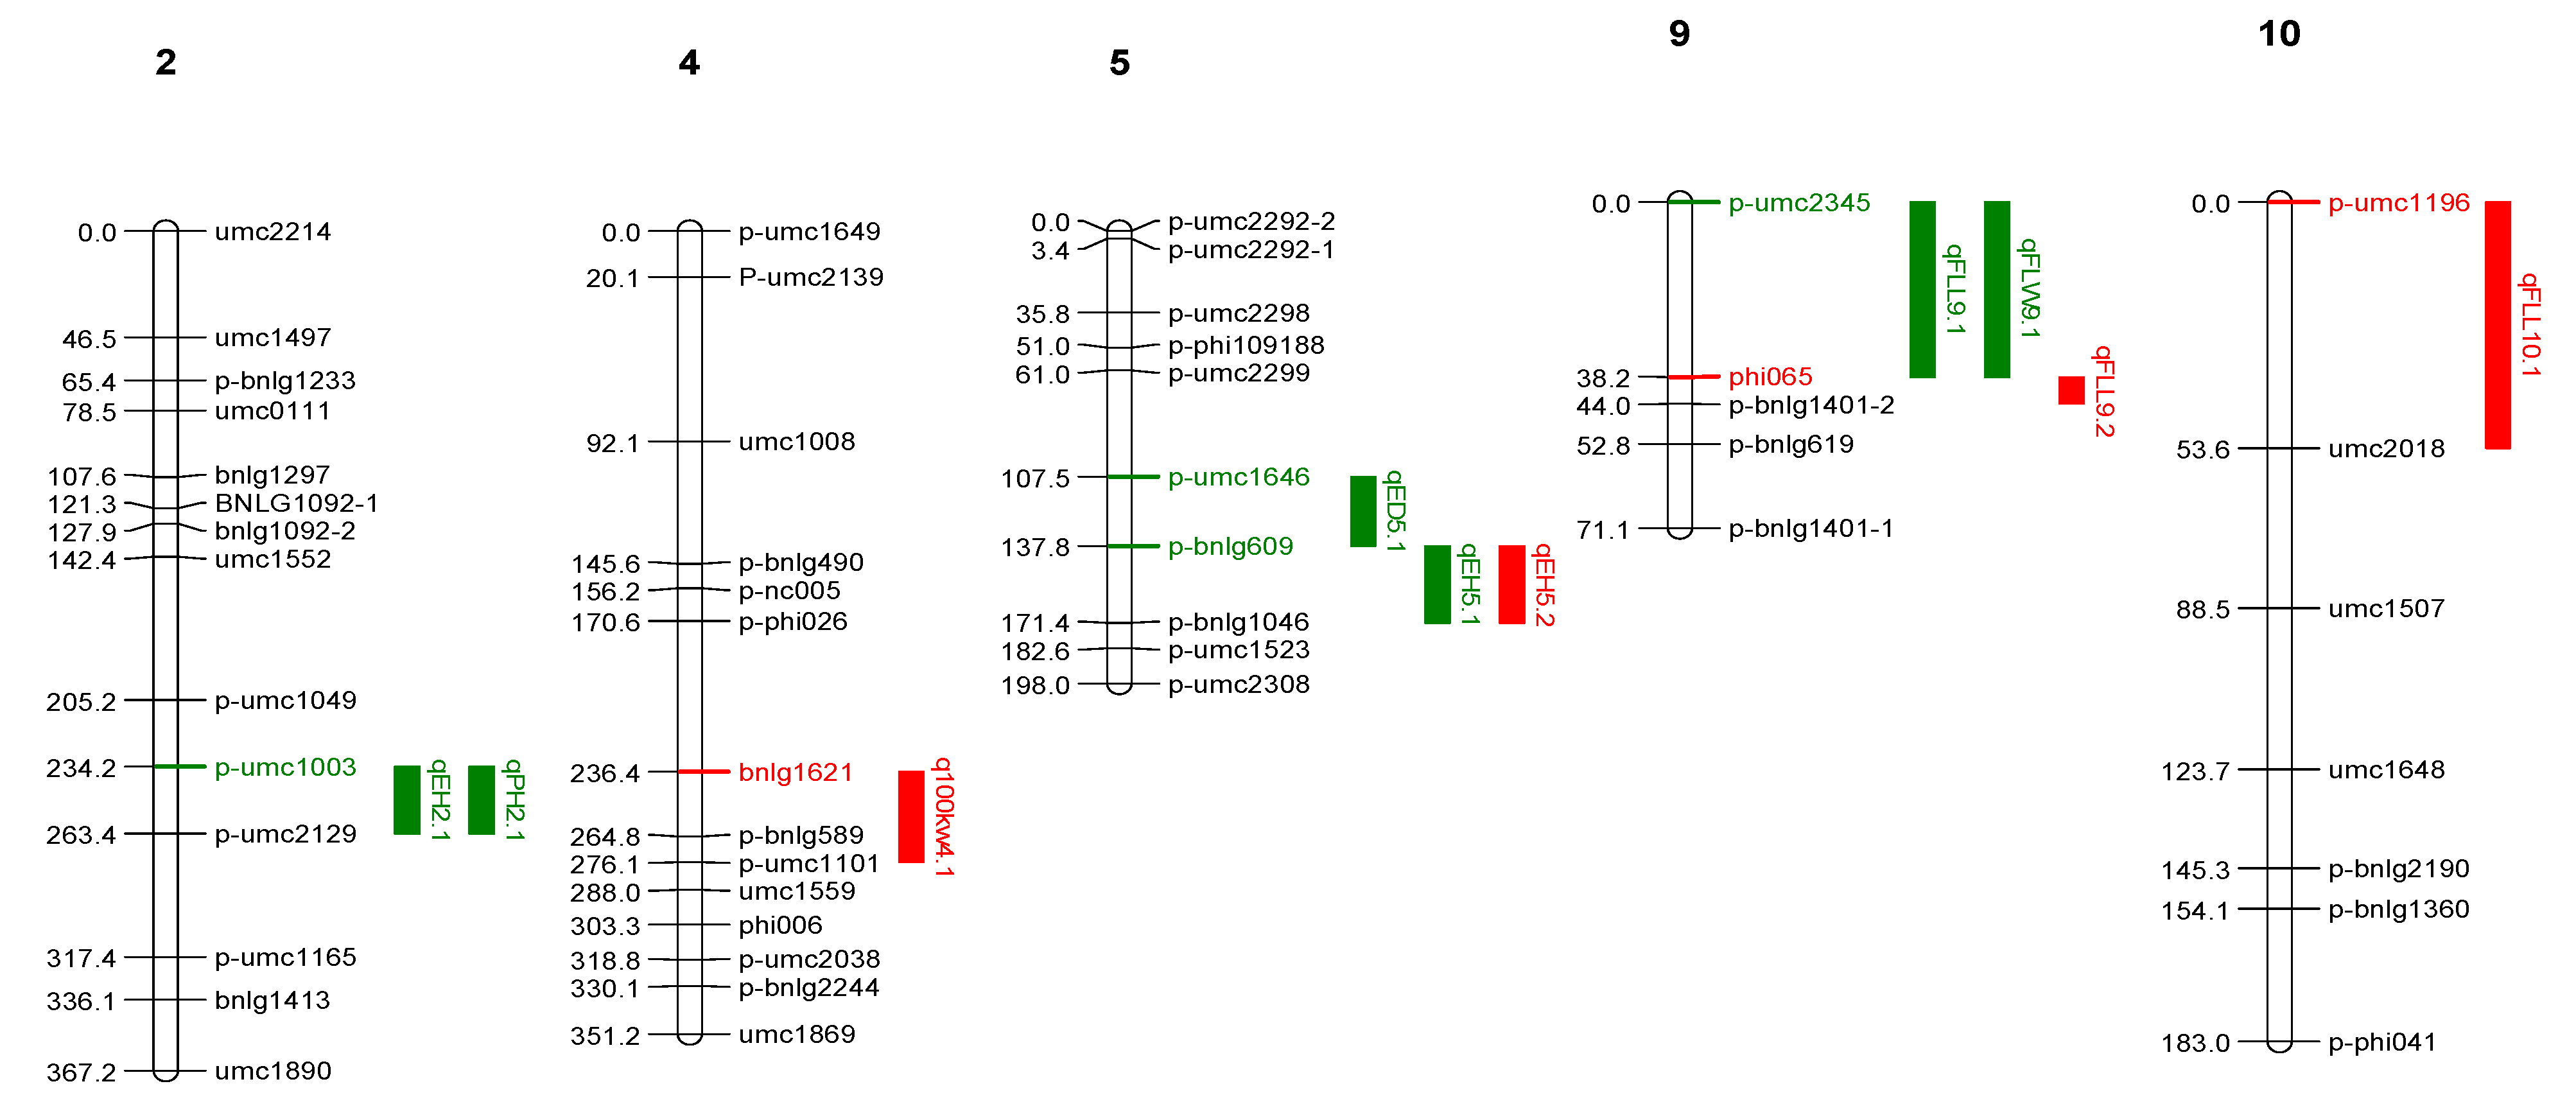
2.2.1. QTLs Identified from LM 13 × Z. parviglumis Derived BC2F2 Families (Population 1)

During kharif 2020, a total of six QTLs, including two QTLs each for ear height (qEH2.1 and qEH5.1) and one each for ear diameter (qED5.1), plant height (qPH2.1), flag leaf length (qFL9.1) and flag leaf width (qFLW9.1), were identified in population 1 (Table 1, Figure 3). The LOD value and phenotypic coefficient of variation (PVE) for identified QTLs ranged from 3.82 to 6.40 and 11.50 to 17.60, respectively. Two QTLs for ear height (qEH2.1 and qEH5.1) were located on chromosomes 2 and 5 with a PVE of 17.6 and 13.4 and LOD value of 6.4 and 4.74, respectively. Similarly, four QTLs were identified for three traits, namely 100 kernel weight (q100kw4.1), ear height (qEH5.2) and flag leaf length (qFLL9.2 and qFLL10.1) on chromosomes 4, 5, 9 and 10 during spring 2021 in the same population. These QTLs had LOD and PVE values in the range of 3.68–4.82 and 10.80–13.90, respectively. Two QTLs, namely qFLL9.1 for flag leaf length and qEH5.1 for plant height, were consistently detected in both seasons.

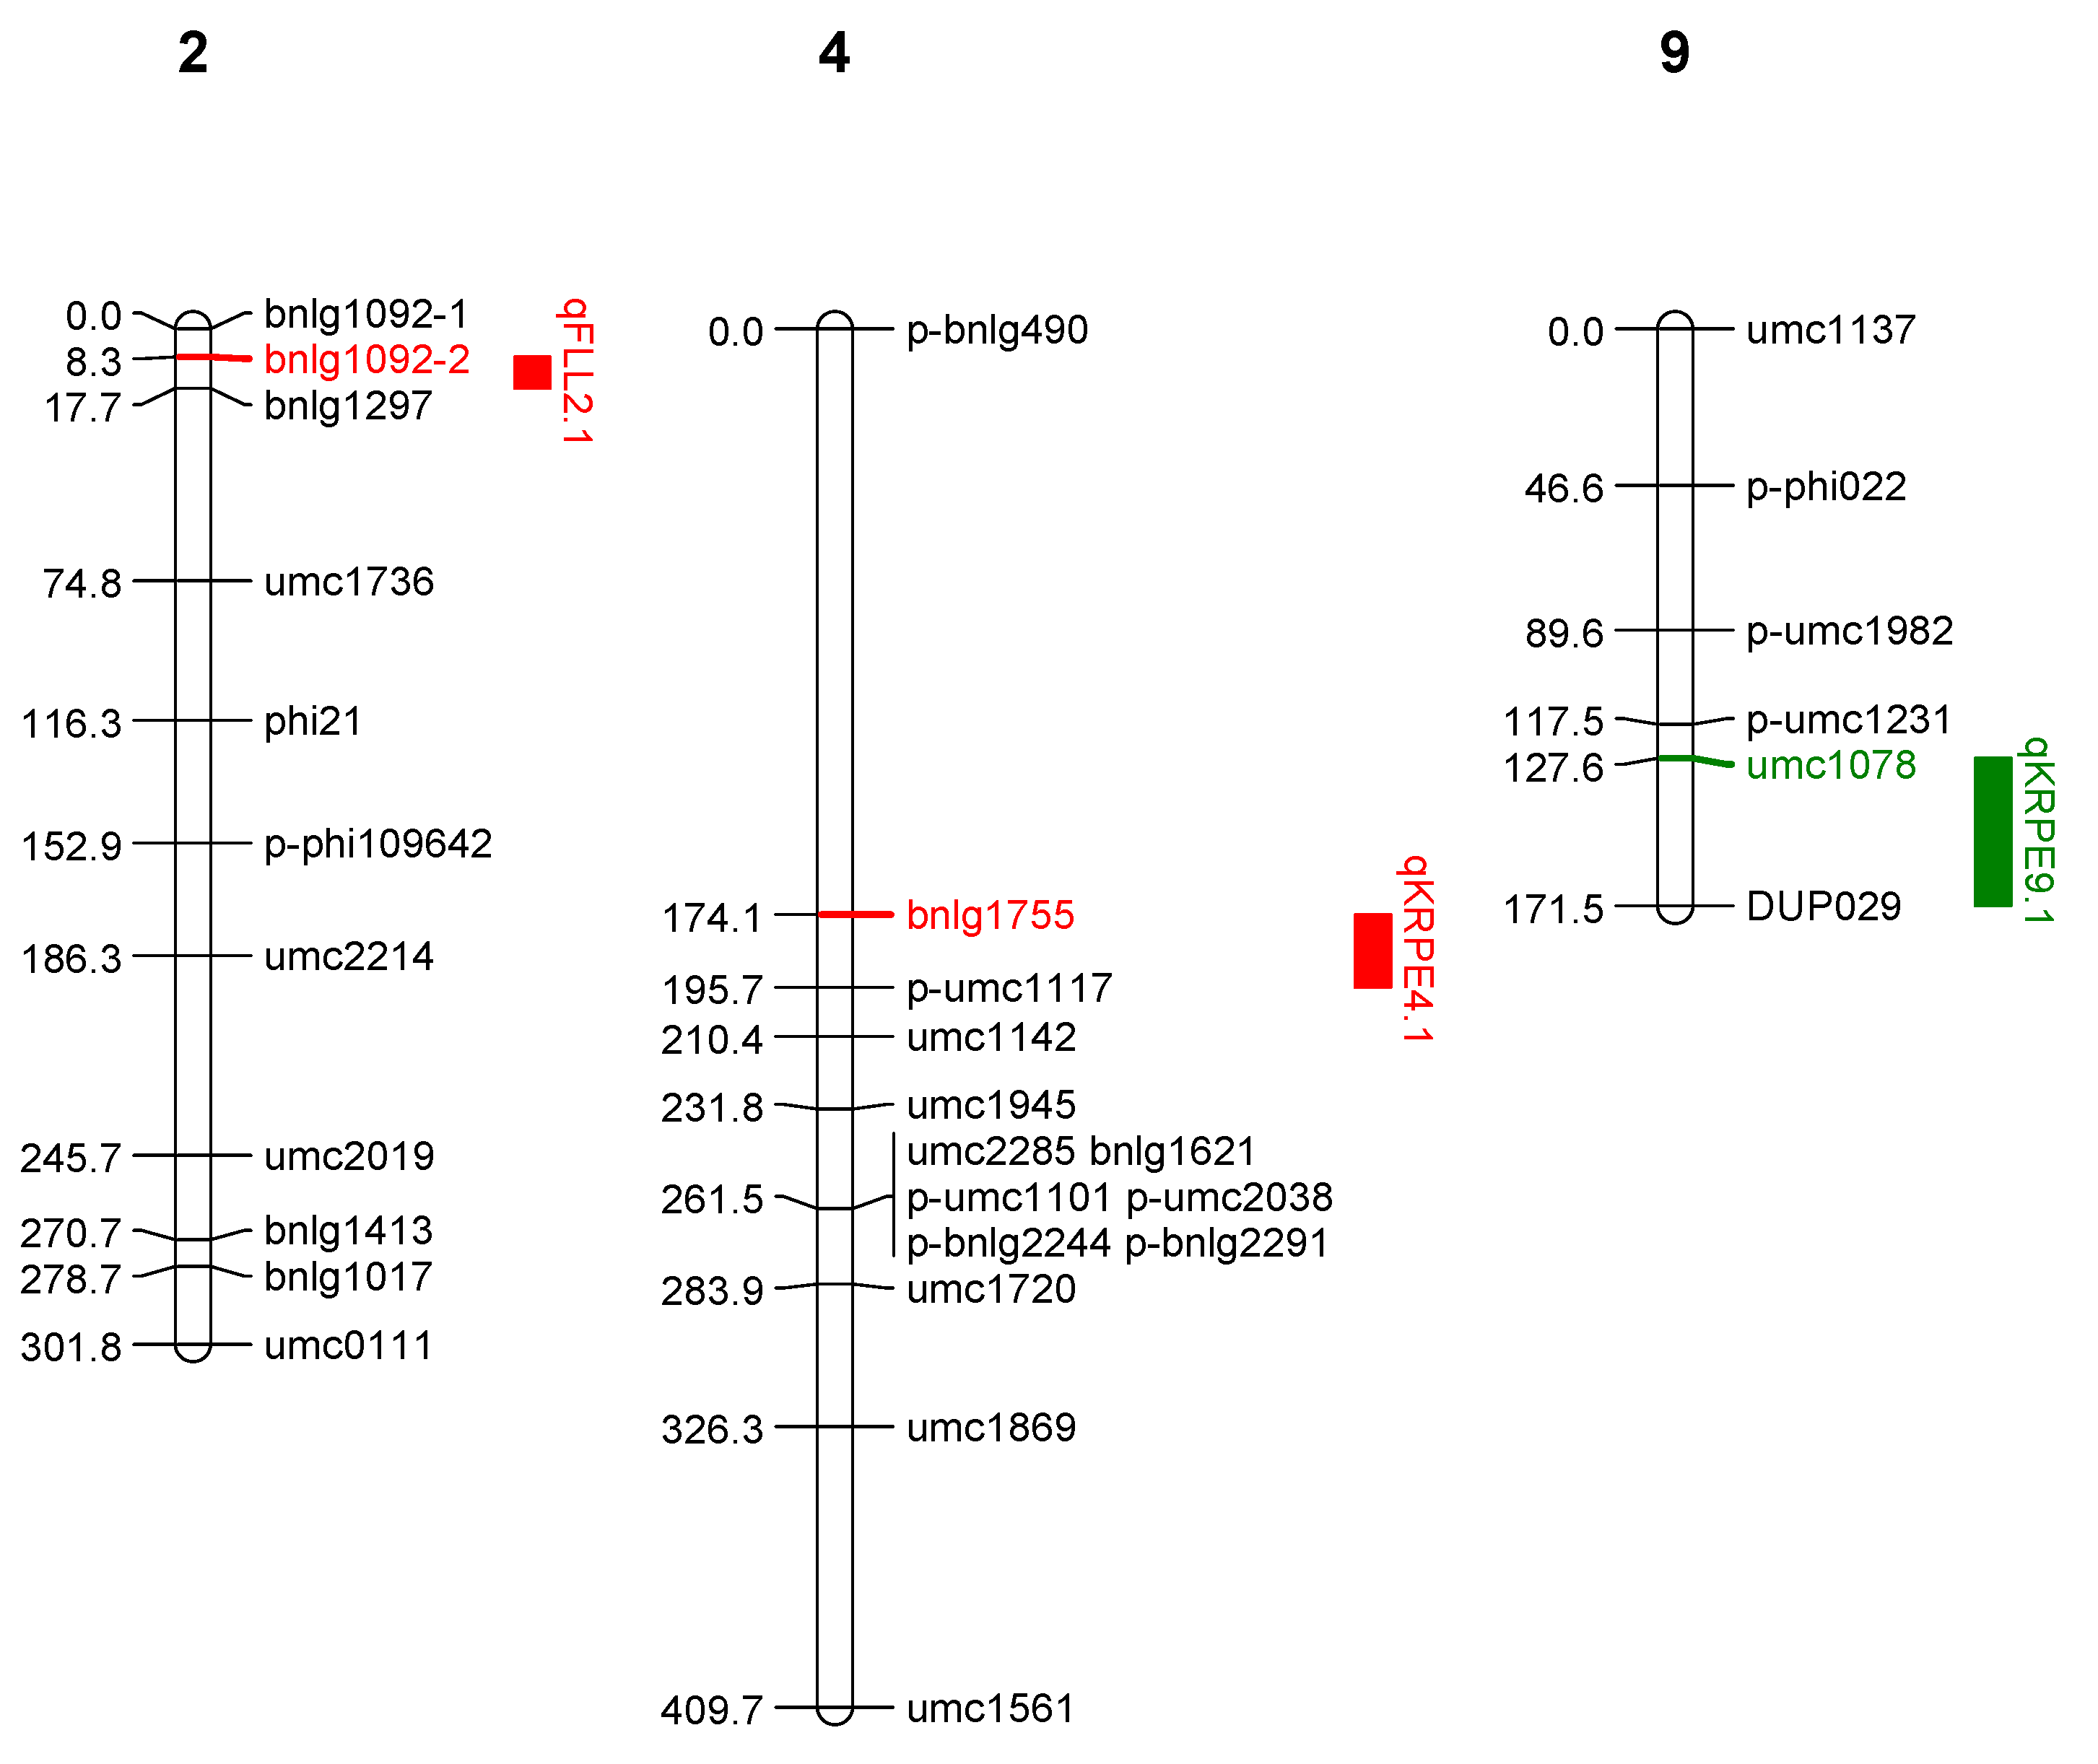
2.2.2. QTLs Identified from LM 14 × Z. parviglumis Derived BC2F2 Families (Population 2)

Likewise, in population 2, one QTL (qKRPE9.1) for kernel rows per ear was mapped on chromosome 9, with a LOD of 3.70 and a PVE of 13.70 during kharif 2020 (Table 2, Figure 4). Similarly, two QTLs were identified for flag leaf length (qFLL2.1) and kernel rows per ear (qKRPE4.1) on chromosomes 2 and 4 during spring 2021. QTLs for flag leaf lengths i.e., qFLL9.1 and qFLL2.1, were identified in both the populations but on different chromosomes, i.e., 9 and 2, respectively. Similarly, QTLs for kernel rows per ear, i.e., qKRPE9.1 and qKRPE4.1, were detected in both seasons but on different chromosomes, i.e., 9 and 4, respectively.

3. Discussion

3.1. Comparison of QTLs Detected in Both BC2F2 Populations

In both population 1 and population 2, ten and three QTLs were detected, respectively, for the six grain yield related component traits. Out of a total of 13 QTLs, only one QTL for flag leaf length (accounting for ~11.5% PVE) was detected in both the populations but located on different chromosomes. This indicates the governance of flag leaf length by different clusters of genes located in different chromosomes, and such QTLs are of genotype specific nature as favorable alleles are contributed by Z. parviglumis and LM 14. Such genotype specific QTLs have been detected previously in maize based studies [5]. The remaining 12 QTLs were specific to population 1, and two QTLs were specific to population 2. Such population specific detection of QTLs is quite common as evident from previous studies [16]. In population 1, the QTLs for flag leaf length (qFLL 9.1 and qFLL9.2) were detected in both the seasons that are located on chromosome 9 (p-umc2345 and phi065) and with a PVE of 12% and hence classify as consistent or stable QTLs. Such stable QTLs are of high interest to plant breeders, as leaves are a primary source for photosynthesis for overall plant growth [5]. Similarly, the QTLs for ear height (qEH 5.1 and qEH 5.2) were also identified as stable QTLs and hold significant importance for the development of genotypes with low ear placement, best suited for high planting density [17]. Interestingly, in population 1 evaluated in kharif 2020, QTLs for EH (qEH2.1) and PH (qPH2.1) were found to be co-located with p-umc2129 as the flanking common marker on chromosome 2, indicating the pleiotropic or correlated nature of such overlapping QTL regions. Detection of such consistent QTLs indicates relatively higher heritability of these traits, indicating a low effect of environment on expression. The trait correlation analysis indicated significant positive correlation between PH and EH in population 1 (Supplementary Materials Table S1) and corroborates with the findings of Fei et al., 2022 [18].
Likewise, QTLs for ED (qED5.1) and EH (qEH5.1) on chromosome 5 also overlapped and had p-bnlg609 as a common flanking marker and hence can be considered pleiotropic loci. The trait correlation analysis showed significant positive association between ED and EH and agrees with previous findings [19]. Similarly, QTLs for FLL (qFLL9.1) and FLW (qFLW9.1) on chromosome 9 overlapped due to significant positive correlation between FLL and FLW (Supplementary Materials Table S1). High positive correlations of traits are quite common for the co-located QTLs [20]. The highest number of QTLs were identified in population 1, possibly due to relatively larger variation captured for the phenotypic traits (Figure 4). Most of the QTLs identified in the present study are novel, possibly due to limited studies on the use of wild species for genetic mapping of grain yield and component traits. QTL detection inconsistency across two populations (where one of the parents is common) results from different genetic backgrounds, environmental factors or the selection process. However, in the current study, both BC2F2 populations were evaluated in the same location in two environments/seasons, and an almost similar set of polymorphic markers was used for genotyping both populations. Moreno-Gonzalez (1993) [21] demonstrated through a simulation study that the efficiency of different generations in predicting marker-associated QTL effects by multiple regression varies. Beavis et al. (1994) [22] proposed that variation in QTL detection between two F3 derived backcrossed lines might be attributed, in part, to the genetic background. The identified QTLs can be used in the genomic prediction models for grain yield contributing traits, resulting in better selection accuracy and achieving higher genetic gains for grain yield.

3.2. Comparison of QTLs Detected in Both BC2F2 Populations and Other Studies in Maize

Because of differences in mapping populations (parents and progeny type), as well as a paucity of common loci and environments, direct comparisons of QTL mapping results across studies are difficult. One important consideration for QTL detection is the degree to which QTL location and effects from one population are observed in other populations or subsamples of the same population. Inconsistent detection of QTLs across studies may be the result of sampling variation, genetic heterogeneity of the phenotype and other factors [22,23,24]. Although there are some studies in maize where common QTLs in similar genomic regions or neighboring regions on the same chromosome across populations for various traits were reported [25,26], the comparison of QTL data across different studies in maize provides clues on shared genomic regions, unraveling the genetic background effects or environmental effect [27]. Such QTLs identified across studies can be used for meta-QTL analysis to identify overlapping but consistent genomic regions, which can further be explored to mine candidate genes for particular traits.
Similar to our study, Adhikari et al., 2021 [28] identified QTLs for ear diameter and kernel rows per ear in BC1F5 population derived from the cross of maize inbred line DI-103 with Z. parviglumis. Similarly, QTLs for ED were reported in F2:3, and RIL population in maize [29,30,31,32] carried out QTL analysis using F2 and F2:3 populations and detected three QTLs for ear length. Similarly, Sa et al. (2021) [33] used RIL population (cross of Mo17 and KW7) to identify a QTL for ear length on chromosome 6. Hence, it is a great challenge to identify consistent QTLs across studies in different genetic backgrounds and environments, making QTL validation a daunting task; however, meta-QTL analysis is a promising approach for utilizing the existing QTL mapping studies [18,34].

4. Materials and Methods

4.1. Population Development

Two mapping populations were developed through the cross of maize inbred lines- LM 13 and LM 14 with Z. parviglumis (maize wild species). The F1 plants from each cross were backcrossed two times to LM13 and LM 14 to develop BC2F1 generation. BC2F1 plants were selfed to produce 155 BC2F2 individuals (population 1; based on LM 13) and 156 BC2F2 individuals (population 2; based on LM 14), respectively. Furthermore, BC2F2 plants were selfed to produce BC2F3 families in both populations (Figure 5).

4.2. Phenotypic Trait Evaluation

Both BC2F2 populations (population 1 and 2) were evaluated in one-row plots during kharif 2020, at Ladhowal farm of ICAR-IIMR, Ludhiana. Standard cultivation management practices were used. Both the populations were evaluated for 15 traits, viz., Flag Leaf Angle (FLA), Tassel Length (TL), Days to Anthesis (DTA), Days to Silking (DTS), Cobs per Plant (CPP), Ear Length (EL), Ear Diameter (ED), Kernels per row (KPR), Kernel rows per Ear (KRPE), Flag Leaf Length (FLL), Flag leaf width (FLW), Plant Height (PH), Ear Height (EH), Grain Yield (GY) and 100 kernel weight (100 kW). As the population is segregated, the phenotypic data were collected from individual plants in BC2F2, and yield attributing traits (EL, ED, KPR, KRPE, 100 kW) were recorded on selfed plant, as it was necessary to generate the BC2F3 families. BC2F3 populations (population 1 and population 2) were evaluated for above mentioned traits and grain yield (in open pollination conditions) during spring 2021 and the data were collected on five random plants.

4.3. Correlation and Box Plot Analysis

The correlation coefficients among the grain yield and its component traits were calculated, and box plots were generated using the agricolae package (ggplot2) of R software Version 4.4.1.

4.4. Linkage Map Construction and QTLs Mapping

A total of 180 and 162 SSR markers were used to screen populations 1 and 2, respectively. Based on the polymorphism, 102 and 77 markers were used to construct the linkage maps for population 1 (Figure 3, Supplementary Materials Table S5) and population 2 (Figure 4, Supplementary Materials Table S6), respectively. The linkage maps covered 10 chromosomes with a total length of 2524.8 cM and 2139.4 cM, with an average interval of 24.75 cM and 27.78 cM, respectively. The linkage map was constructed using ICI QTL mapping software v4.1. Further, QTLs were mapped using the QGENE 4.4.0 after selecting 1000 permutations. The negative additive effect indicates that the QTL allele was contributed from the donor parent while positive value indicates the QTL allele is from the recurrent parent.

5. Conclusions

This study resulted in the development of pre-breeding populations, linkage map construction and identification of genomic regions for grain yield and yield attributing traits. The co-localization of QTLs (with close and common flanking markers) for yield attributing traits due to their strong associations provides the opportunity for their simultaneous improvement. Such co-located QTLs for same or different traits can be targeted for marked assisted introgression in elite maize germplasm. The identification of QTLs for yield-related traits conferred by wild relatives in the modern maize background will enrich genetic diversity in the germplasm. Furthermore, other QTLs identified for grain yield related traits were positioned from their linked markers, indicating the need for identifying close markers through fine mapping of such genomic regions. Moreover, such mapping populations in advanced generation (RILs) can be further evaluated to validate the identified QTLs.

Supplementary Materials

The supporting information can be downloaded at: https://www.mdpi.com/article/10.3390/ijms251910300/s1.

Author Contributions

Conceptualization, P.K.; methodology, P.K.; software, M.C.; formal analysis, M.C.; investigation, P.K. and B.K.; resources, P.K. and P.K.B.; data curation, A.S. and N.L.; writing—original draft preparation, P.K. and S.S.; writing—review and editing, M.C.D., B.B., S.K.A. and S.B.S.; visualization, B.S.J. All authors have read and agreed to the published version of the manuscript.

Funding

The first author is thankful to SERB for providing the financial support as per the grant number: EEQ/2018/001394 to conduct the above research work and also thankful to ICAR-IIMR, Ludhiana for support in carrying out the research.

Institutional Review Board Statement

Not applicable.

Informed Consent Statement

Not applicable.

Data Availability Statement

Data are contained within the article and Supplementary Materials.

Conflicts of Interest

The authors declare no conflicts of interest.

References

  1. Choudhary, M.; Singh, A.; Gupta, M.; Rakshit, S. Enabling technologies for utilization of maize as a bioenergy feedstock. Biofuels Bioprod. Biorefin. 2019, 14, 402–416. [Google Scholar] [CrossRef]
  2. Choudhary, M.; Kumar, P.; Kaswan, S.; Jat, S.L. Harnessing the tillering ability of Zea mays ssp. parviglumis in fodder maize breeding. Indian J. Agric. Sci. 2020, 90, 2317–2322. [Google Scholar]
  3. Joshi, A.; Adhikari, S.; Singh, N.K.; Jaiswal, J.P.; Pant, U.; Singh, R.P.; Pandey, D. Prospecting quantitative trait loci for maydis leaf blight (MLB) resistance using a population of teosinte introgressed maize (Zea mays ssp. mays) and in silico identification of candidate MLB resistance genes. J. Phytopathol. 2023, 171, 118–131. [Google Scholar]
  4. Keimeso, Z.; Abakemal, D.; Gebreselassie, W. Heterosis and combining ability of highland adapted maize (Zea mays L.) DH lines for desirable agronomic traits. Afr. J. Plant Sci. 2020, 14, 121–133. [Google Scholar]
  5. Adhikari, S.; Joshi, A.; Kumar, A.; Singh, N.K.; Jaiswal, J.P.; Jeena, A.S.; Pant, U. Developing genetic resources and genetic analysis of plant architecture-related traits in teosinte-introgressed maize popultions. Plant Genet. Resour. 2022, 20, 145–155. [Google Scholar] [CrossRef]
  6. Ramstein, G.P.; Larsson, S.J.; Cook, J.P.; Edwards, J.W.; Ersoz, E.S.; Flint-Garcia, S.; Gardner, C.A.; Holland, J.B.; Lorenz, A.J.; McMullen, M.D.; et al. Dominance effects and functional enrichments improve prediction of agronomic traits in hybrid maize. Genetics 2020, 215, 215–230. [Google Scholar] [CrossRef]
  7. Kumar, A.; Singh, N.K.; Adhikari, S.; Joshi, A. Morphological and molecular characterization of teosinte derived maize population. Indian J. Genet. 2019, 79, 670–677. [Google Scholar] [CrossRef]
  8. Kumar, A.; Singh, N.K.; Jeena, A.S.; Jaiswal, J.P.; Verma, S.S. Evaluation of teosinte derived maize lines for drought tolerance. Plant Genet. Resour. 2020, 33, 60–67. [Google Scholar] [CrossRef]
  9. Pasztor, K.; Borsos, O. Inheritance and chemical composition in inbred maize (Zea mays L.) 9 teosinte (Zea mays subsp. mexicana (Schrader) Iltis) hybrids. Novenytermeles 1990, 39, 193–213. [Google Scholar]
  10. Srinivasan, G.; Brewbaker, J.L. Genetic analysis of hybrids between maize and perennial teosinte. II: Ear traits. Maydica 1999, 44, 371–384. [Google Scholar]
  11. Tanksley, S.D.; Nelson, J.C. Advanced backcross QTL analysis: A method for the simultaneous discovery and transfer of valuable QTLs from unadapted germplasm into elite breeding lines. Theor. Appl. Genet. 1996, 92, 191–203. [Google Scholar] [CrossRef] [PubMed]
  12. Xie, X.B.; Song, M.H.; Jin, F.X.; Ahn, S.N.; Suh, J.P.; Hwang, H.G.; McCouch, S.R. Fine mapping of a grain weight quantitative trait locus on rice chromosome 8 using near-isogenic lines derived from a cross between Oryza sativa and Oryza rufipogon. Theor. Appl. Genet. 2007, 113, 885–894. [Google Scholar] [CrossRef] [PubMed]
  13. Wang, B.; Chee, P.W. Application of advanced backcross quantitative trait locus (QTL) analysis in crop improvement. J. Plant Breed. Crop Sci. 2010, 2, 221–232. [Google Scholar]
  14. Sun, Z.; Yin, X.; Ding, J.; Yu, D.; Hu, M.; Sun, X.; Tan, Y.; Sheng, X.; Liu, L.; Mo, Y.; et al. QTL analysis and dissection of panicle components in rice using advanced backcross populations derived from Oryza sativa cultivars HR1128 and ‘Nipponbare’. PLoS ONE 2017, 12, e0175692. [Google Scholar] [CrossRef] [PubMed]
  15. Sayed, M.A.; Ali, M.B.; Bakry, B.A.; El-Sadek, A.N.; Léon, J. Advanced backcross-quantitative trait loci mapping of grain yield, heading date, and their stability parameters in barley across multienvironmental trials in Egypt. Plant Breed. 2021, 140, 1042–1057. [Google Scholar] [CrossRef]
  16. Liu, R.; Meng, Q.; Zheng, F.; Kong, L.; Yuan, J.; Lübberstedt, T. Genetic mapping of QTL for maize leaf width combining RIL and IF2 populations. PLoS ONE 2017, 12, e0189441. [Google Scholar] [CrossRef]
  17. Li, X.; Zhou, Z.; Ding, J.; Wu, Y.; Zhou, B.; Wang, R.; Ma, J.; Wang, S.; Zhang, X.; Xia, Z.; et al. Combined linkage and association mapping reveals QTL and candidate genes for plant and ear height in maize. Front. Plant Sci. 2016, 7, 833. [Google Scholar] [CrossRef]
  18. Fei, J.; Lu, J.; Jiang, Q.; Liu, Z.; Yao, D.; Qu, J.; Ma, Y. Maize plant architecture trait QTL mapping and candidate gene identification based on multiple environments and double populations. BMC Plant Biol. 2022, 22, 110. [Google Scholar] [CrossRef]
  19. Choi, J.K.; Sa, K.J.; Park, D.H.; Lim, S.E.; Ryu, S.H.; Park, J.Y.; Park, K.J.; Rhee, H.I.; Lee, M.; Lee, J.K. Construction of genetic linkage map and identification of QTLs related to agronomic traits in DH population of maize (Zea mays L.) using SSR markers. Genes Genom. 2019, 41, 667–678. [Google Scholar] [CrossRef]
  20. Swamy, B.M.; Kaladhar, K.; Shobha Rani, N.; Prasad, G.S.V.; Viraktamath, B.C.; Reddy, G.A.; Sarla, N. QTL analysis for grain quality traits in 2 BC2F2 populations derived from crosses between Oryza sativa cv Swarna and 2 accessions of O. nivara. J. Hered. 2012, 103, 442–452. [Google Scholar] [CrossRef]
  21. Moreno-Gonzalez, J. Estimates of marker-associated QTL effects in Monte Carlo backcross generations using multiple regression. Theor. Appl. Genet. 1993, 85, 423–434. [Google Scholar] [CrossRef] [PubMed]
  22. Beavis, W.D.; Smith, O.S.; Grant, D.M.; Fincher, R.R. Identification of quantitative trait loci using a small sample of top crossed and F4 progeny from maize. Crop Sci. 1994, 34, 882–896. [Google Scholar] [CrossRef]
  23. Beavis, W.D.; Grant, D.; Albertsen, M.; Fincher, R. Quantitative trait loci for plant height in four maize populations and their associations with qualitative genetic loci. Theor. Appl. Genet. 1991, 83, 141–145. [Google Scholar] [CrossRef] [PubMed]
  24. Lee, M. DNA markers and plant breeding programs. Adv. Agron. 1995, 55, 265–344. [Google Scholar]
  25. Koester, R.P.; Sisco, P.H.; Stuber, C.W. Identification of quantitative trait loci controlling days to flowering and plant height in two near isogenic lines of maize. Crop Sci. 1993, 33, 1209–1216. [Google Scholar] [CrossRef]
  26. Tang, H.; Yan, J.B.; Huang, Y.Q.; Zheng, Y.L.; Li, J.S. QTL mapping of five agronomic traits in maize. Acta. Genet. Sin. 2005, 32, 203–209. [Google Scholar]
  27. Li, Y.L.; Niu, S.Z.; Dong, Y.B.; Cui, D.Q.; Wang, Y.Z.; Liu, Y.Y.; Wei, M.G. Identification of trait-improving quantitative trait loci for grain yield components from a dent corn inbred line in an advanced backcross BC 2 F 2 population and comparison with its F 2: 3 population in popcorn. Theor. Appl. Genet. 2007, 115, 129–140. [Google Scholar] [CrossRef]
  28. Adhikari, S.; Joshi, A.; Kumar, A.; Singh, K.N.; Jaiswal, P.J.; Jeena, S.A.; Pant, U. Identification of QTLs for yield and contributing traits in maize-teosinte derived bils under diseased-stressed and control conditions. Genetika 2021, 53, 951–972. [Google Scholar] [CrossRef]
  29. Su, C.F.; Wang, W.; Gong, S.L.; Zuo, J.H.; Li, S.J.; Xu, S.Z. High density linkage map construction and mapping of yield trait QTLs in maize (Zea mays) using the genotyping-by-sequencing (GBS) technology. Front. Plant Sci. 2017, 8, 706. [Google Scholar] [CrossRef]
  30. Zhao, Y.M.; Su, C.F. Mapping quantitative trait loci for yield-related traits and predicting candidate genes for grain weight in maize. Sci. Rep. 2019, 9, 16112. [Google Scholar] [CrossRef]
  31. Jiang, F.Y.; Liu, L.; Li, Z.W.; Bi, Y.Q.; Yin, X.F.; Guo, R.J.; Wang, J.; Zhang, Y.D.; Shaw, R.K.; Fan, X.F. Identification of candidate QTLs and genes for ear diameter by multi-parent population in maize. Genes 2023, 14, 1305. [Google Scholar] [CrossRef] [PubMed]
  32. Mei, X.P.; Dong, E.F.; Liang, Q.Y.; Bai, Y.; Nan, J.; Yang, Y.; Cai, Y.L. Identification of QTL for fasciated ear related traits in maize. Crop Sci. 2021, 61, 1184–1193. [Google Scholar] [CrossRef]
  33. Sa, K.J.; Choi, I.Y.; Park, J.Y.; Choi, J.K.; Ryu, S.H.; Lee, J.K. Mapping of QTL for agronomic traits using high-density SNPs with an RIL population in maize. Genes Genom. 2021, 43, 1403–1411. [Google Scholar] [CrossRef] [PubMed]
  34. Gupta, M.; Choudhary, M.; Singh, A.; Sheoran, S.; Kumar, H.; Singla, D.; Rakshit, S. Meta-QTL analysis for mining of candidate genes and constitutive gene network development for viral disease resistance in maize (Zea mays L.). Crop J. 2023, 11, 511–522. [Google Scholar] [CrossRef]
Figure 1. Box plot of variation for the traits under study in population 1 for kharif and spring seasons.
Ijms 25 10300 g001
Figure 2. Box plot of variation for the traits under study in population 2 for kharif and spring seasons.
Ijms 25 10300 g002
Figure 3. Linkage map with identified QTLs in population 1, green color (kharif season) and red color (spring season).
Ijms 25 10300 g003
Figure 4. Linkage map with identified QTL in population 2, green color (kharif season) and red color (spring season).
Ijms 25 10300 g004
Figure 5. Flow chart for development of advanced backcross populations.
Ijms 25 10300 g005
Table 1. QTLs reported from BC2F2 (LM 13 × Z. parviglumis) population for yield and contributing traits.
S. No.TraitsChr.QTLsLODR2 (%)Linked MarkersAdd. Effect
Kharif 2020
1Ear Diameter5qED5.13.8212.10p-umc1646 & p-bnlg6093.44
2Ear Height2qEH2.16.4017.60p-umc1003 & p-umc2129−12.45
5qEH5.14.7413.40p-bnlg609 & p-bnlg104619.17
3Plant Height2qPH2.14.3012.20p-umc1049 & p-umc2129−17.49
4Flag leaf length9qFLL9.14.3812.40p-umc2345 & phi065−9.56
5Flag leaf width9qFLW9.14.0511.50p-umc2345 & phi065−0.33
Spring 2021
6100 kernel weight4q100kw4.14.4812.90bnlg1621 & p-umc11011.77
7Ear height5qEH5.24.8213.90p-umc609 & p-bnlg10468.62
8Flag leaf length9qFLL9.24.1312.00phi065 & p-bnlg1401-210.92
10qFLL10.13.6810.80umc1196 & umc2018−3.00
Table 2. QTLs reported from BC2F2 (LM 14 × Z. parviglumis) population for yield and contributing traits.
S. No.TraitsChr.QTLsLODR2 (%)Linked MarkersAdd. Effect
Kharif 2020
1Kernel rows per ear9qKRPE9.13.7013.70umc1078 & DUP029 −8.33
Spring 2021
2Flag leaf length2qFLL2.13.6410.30bnlg1092-2 & bnlg12972.61
3Kernel rows per ear4qKRPE4.15.0914.60bnlg1755 & pumc11177.80
Disclaimer/Publisher’s Note: The statements, opinions and data contained in all publications are solely those of the individual author(s) and contributor(s) and not of MDPI and/or the editor(s). MDPI and/or the editor(s) disclaim responsibility for any injury to people or property resulting from any ideas, methods, instructions or products referred to in the content.

