Communication

Application of H2N-Fe3O4 Nanoparticles for Prostate Cancer Magnetic Resonance Imaging in an Animal Model

1
The Henryk Niewodniczanski Institute of Nuclear Physics Polish Academy of Sciences, Radzikowskiego 152, 31-342 Krakow, Poland
2
Department of Chemistry, Chinese Culture University, Taipei 11114, Taiwan
3
Division of Medical Physics, Department of Oncology, University of Alberta, 8303 112 St. NW, Edmonton, AB T6G 2T4, Canada
*
Author to whom correspondence should be addressed.
Int. J. Mol. Sci. 2024, 25(19), 10334; https://doi.org/10.3390/ijms251910334
Submission received: 22 August 2024 / Revised: 23 September 2024 / Accepted: 24 September 2024 / Published: 26 September 2024
(This article belongs to the Section Molecular Oncology)

Abstract

:
This paper presents the efficacy of a contrast agent based on H2N-Fe3O4 nanoparticles for the detection of prostate cancer in an animal model using a preclinical 9.4 T MRI system. The relaxivities r1 and r2 of the nanoparticles were 6.31 mM−1s−1 and 8.33 mM−1s−1, respectively. Nanoparticles injected in a concentration of 2 mg Fe/mL decreased the tumor-relative T1 relaxation across all animals from 100 to 76 ± 26, 85 ± 27, 89 ± 20, and 97 ± 16 12 min 1 h, 2 h, and 24 h post injection, respectively. The corresponding T1 decrease in muscle tissues was 90 ± 20, 94 ± 23, 99 ± 12, and 99 ± 14. The relative T2 changes in the tumor were 82 ± 17, 89 ± 19, 97 ± 14, and 99 ± 8 12 min, 1 h, 2 h, and 24 h post injection, respectively, while, for muscle tissues, these values were 95 ± 11, 95 ± 8, 97 ± 6, and 95 ± 10 at the corresponding time points. The differences in the relative T1 and T2 were only significant 12 min after injection (p < 0.05), although a decrease was visible at each time point, but it was statistically insignificant (p > 0.05). The results showed the potential application of H2N-Fe3O4 nanoparticles as contrast agents for enhanced prostate cancer MRI.

1. Introduction;

Prostate cancer (PC) is a curable disease if diagnosed early; however, if undetected, it can spread aggressively and has few early symptoms, leading to late diagnosis and, hence, problematic outcomes [1]. Therefore, early diagnosis and timely efficient treatment are essential for effective cancer management. Currently, the established standard for PC diagnosis involves prostate-specific antigen testing and digital rectal examination [2]. However, these diagnostic methods often lead to overdiagnosis and overtreatment [3], given that only a small percentage of these cancers metastasize, and approximately 3% of them result in fatalities [3,4,5,6,7]. While transrectal ultrasonography, computed tomography (CT), positron emission tomography (PET) [8], and magnetic resonance imaging (MRI) [9,10,11] are utilized for PC diagnosis and staging, their limited value stems from their low sensitivity (CT, US), specificity (PET), tumor contrast (CT), and image resolution (PET) in detecting tumor tissues and lymph node metastases [12]. These methods, in particular MRI, providing superior soft-tissue contrast, are enhanced using contrast agents [13]. MRI contrast agents are mostly based on gadolinium [14] or iron oxide [15], and their r1 and r2 relaxivities decrease with an increasing magnetic field. This fact should be taken into account when considering translation from a high preclinical field (7 T and above) to clinical studies (3 T and below) [16].
Superparamagnetic iron oxide nanoparticles (SPIONSs) are commonly used in MRI as T2 contrast agents mostly due to their high r2 relaxivity and low toxicity [15]. Most SPIONSs are 3 to 30 nm in size [17] and can be coated with biocompatible materials, which can further reduce the overall toxicity [18]. SPIONSs can be functionalized with antibodies or peptides, allowing binding to specific targets, providing a high specificity. They can be modified to alter their size, shape, and coating properties. For example, Tse et al. conjugated iron oxide nanoparticles (NPs) with the J591 antibody for targeting the prostate-specific membrane antigen (PSMA), showing enhanced contrast accumulation in prostate cancer in preclinical MRI [19]; meanwhile, Zhu et al. showed similar results with polypeptide-labeled SPIONSs [20]. Targeted SPIONSs enhance some tumors, but not all prostate tumors express PSMAs [17].
While SPIONSs predominantly reduce the T2 relaxation time, causing the so-called “negative” tumor contrast in T2-weigthed images, Gd-based contrasts reduce mostly T1, providing positive contrast in T1-weighted MRI [21]. The NPs are internalized by macrophages and excreted by the kidneys. Their impact on the cancer image contrast depends on the size, concentration, and type of NPs, as well the magnetic field strength [22]. NPs are applied naked or synthesized with vehicles such as peptides [23] or specific antibodies [24] for targeted delivery. Clinically approved MRI contrast agents, such as Gd-DTPA, have an r1 relaxivity of 4.79 mM−1s−1 and an r2 of 5.14 mM−1s−1 at 1.5T and an r1 of 4.05 mM−1s−1 and an r2 of 5.09 mM−1s−1 at 3 T [25]. A study by Fan Pu et al. showed the gadolinium-based contrast agent relaxivities r1 and r2 to be 18.6 mM−1s−1 and 94 mM−1s−1, respectively, at 7T [26]. Hagberg et al. carried out a similar study with Gd-based NPs at 9.4 T and found the r1 and r2 to be 18 mM−1 s−1 and 21.6 mM−1s−1 [27]. To increase specificity, NPs are often synthesized with lipids or other delivery vehicles, which impact the relaxivity. For example, the r1 relaxivity of Gd-CP027 bound to albumin was found to be 48 mM−1·s−1at 0.5 T, 31 mM−1s−1 at 1.5 T, and 9.4 mM−1s−1 at 9.4 T, allowing one to generate a visible signal change at a local concentration of about 0.1 mM [28]. Studies of SPIONSs at 7 T showed r1 and r2 of 3.4 mM−1s−1 and 60 mM−1s−1, respectively [22], while other groups reported the r1 and r2 values to be 5.6 mM−1s−1 and 72 mM−1s−1 at 9.4 T [29]. A much higher relaxivity was shown for NPs composed of paramagnetic Dy3+ and Gd3+ (T2 and T1 contrast agents, respectively) [30], with relaxivities of r1 = 20.2 mM–1s–1 and r2 = 32.3 mM–1s–1 at clinical 3 T and r1 = 9.4 mM–1s–1 and r2 = 144.7 mM–1s–1 at 9.4 T [27]. The summary of the r1 and r2 values of the selected NPs is provided in Table 1, while detailed data on the various NPs are presented by Pellico et al. [31].
The incorporation of nitrogen into iron- or gadolinium-based contrast agents has shown to alter their magnetic properties, improving their performance as MRI contrast agents [33,34]. SPIONSs can be doped with nitrogen during synthesis, which modifies their electronic structure and increases their effective magnetic moment, leading to improved MRI contrast. Additionally, nitrogen-doped SPIONSs may exhibit improved biocompatibility and stability compared to their undoped counterparts [35]. Nitrogen can also stabilize gadolinium ions and enhance the biocompatibility of gadolinium-based contrast agents; it also affects their pharmacokinetics and biodistribution. Nitrogen-containing ligands are commonly used to incorporate gadolinium ions into contrast agents. These ligands are designed to form stable complexes with gadolinium ions, allowing for their controlled release and the enhancement of contrast in MR images [33]. Furthermore, recent studies showed that the integration of H2N with Fe3O4 NPs led to higher relaxation rates (R1 = 1/T1) than conventional Fe3O4-based nanoparticles. This provided high in vitro biocompatibility [30]. H2N-Fe3O4 NPs were also used as magnetic carriers for nucleotides and enzyme manipulation through electrostatic interactions due to their positively charged surface [35,36,37,38].
While the synthesis method and analysis of H2N-Fe3O4 NPs have already been provided by Shieh et al. [37], this paper reports the application of H2N-Fe3O4 NPs for the enhanced detection of prostate cancer in a nude mouse model using a preclinical MRI system operating at 9.4 T. The results showed that the NPs enabled the improved detection of prostate cancer in the animal model compared to previous studies.

2. Results

The images of the NPs obtained with the TEM revealed that the diameter of the H2N-Fe3O4 NPs was around 7.4 nm (Figure 1). Figure 2A shows the hydrodynamic diameter of the H2N-Fe3O4 NPs, which is around 17 nm. The surface charge of the H2N-Fe3O4 NPs was +20.8 mV (Figure 2B).
Figure 3 shows the T1-weighted MRI of a mouse with PC pre injection (A) and 12 min (B), 1 h (C), 2 h (D), and 24 h post injection (E) of H2N-Fe3O4 NPs at a concentration of 2 mgFe/mL.
Figure 4 shows the T2-weighted MRI of a mouse with PC pre injection (A) and 12 min (B), 1 h (C), 2 h (D), and 24 h post injection (E) of H2N-Fe3O4 NPs at a concentration of 2 mgFe/mL.
Because the T1 and T2 relaxation values varied between the animals prior to injection, we normalized the changes by calculating the relative change (RC) as follows:
RC =   T ¯ 1 , 2 t   T ¯ 1 , 2 0 × 100 ,
where T ¯ 1 , 2 0 and T ¯ 1 , 2 t are the averaged T1 and T2 relaxation times across all animals at times 0 and t, respectively. The RC was calculated for both the PC and muscles.
Figure 5 shows the RC values over all the animals for T1 and T2 within the tumor and muscles before, 12 min, 1 h, 2 h, and 24 h after the injection.
Figure 5 shows the changes in the T1 and T2 RC values due to contrast accumulation in the tumor and muscles across all animals. The T1 RC (Figure 5A) of the tumor decreased from 100 to 76 ± 26 (p = 0.038), 85 ± 27 (p = 0.12), and 89 ± 20 (p = 0.078) 12 min, 1 h, and 2 h post injection, respectively, across all the animals. The muscle tissues exhibited decreases to 90 ± 20 (p = 0.15), 94 ± 23 (p = 0.27), and 99 ± 12 (p = 0.44) 12 min, 1 h, and 2 h post injection, respectively, and were not significant (p > 0.05). After 24 h, the T1 of both the tumor and muscles returned to the pre-injection value (97 ± 16 (p = 0.14) and 100 ± 14 (p = 0.46), respectively).
Figure 5B shows the T2 RC value changes in the tumor and muscles. The T2 RC of the tumor decreased from 100 to 82 ± 17 (p = 0.028), 89 ± 19 (p = 0.12), and 97 ± 14 (p = 0.30) 12 min, 1 h, and 2 h post injection, respectively, across all the animals. The muscle tissues exhibited decreases to 95 ± 11 (p = 0.059), 95 ± 8 (p = 0.75), and 98 ± 6 (p = 0.17) 12 min, 1 h, and 2 h post injection, respectively, and were not significant (p > 0.05). After 24 h, the T2 RC of both tumor and muscles returned to the pre-injection value (99 ± 8 (p = 0.46) and 95 ± 10 (p = 0.12), respectively).
The changes in the tumor T1 and T2 RC values were only significant (p < 0.05) 12 min after the injection.

3. Discussion

The obtained results showed a significant reduction in the T1 RC within the prostate tumor due to the administration of the H2N-Fe3O4 NP contrast agent 12 min post injection. The tumor T1 RC decreased from 100 to 76 (p < 0.05), and a decrease from 100 to 90 (p > 0.05) was observed in the muscle tissue, while the T2 tumor RC decreased from 100 to 82 (p < 0.05), with muscle tissue decreasing from 100 to 95 (p > 0.05). The changes in the RC times within the muscle tissue were less pronounced than those observed in the tumor region. The difference suggests a higher accumulation of the contrast agent in the tumor than in the muscle tissue. These findings show the efficacy of the H2N-Fe3O4 NP contrast agent, demonstrating its pronounced impact on both tumor and muscle tissues, with a notably greater effect observed on the tumor tissue.
As the applied NPs were non-selective, they accumulated in both the tumor and muscles. However, the decrease in the RC in the tumor was higher at each time point after their administration due to the enhanced permeability and retention (EPR) effect of the tumor. The relaxation values returned to the pre-injection values 24 h post injection in the tumor and muscles due to wash out. The toxicity profile of the H2N-Fe3O4 NP contrast agents had been investigated in prior studies and had been found to be low [32], showing potential as a safe contrast agent. A capping agent (glycine) may contribute to the enhanced biocompatibility and suitability of Fe3O4 for biomedical applications [32].
The greatest differences in the RC relaxation times and, hence, in the accumulation of nanoparticles in tumor and muscles are visible 12 min after administration. This is likely related to a more extensive vasculature within the tumor than in the muscles.
The accurate delineation of the prostate cancer boundary is of utmost importance for successful treatment [38]. To achieve sufficient contrast enhancement, most of the current contrast agents used for cancer imaging include gadolinium-based agents [13,39]. While these agents are widely utilized, they do not always provide optimal contrast enhancement for prostate cancer detection, as rapid renal clearance reduces their diagnostic capability. However, their accumulation may be further enhanced by conjugating NPs with other vehicles such as antibodies, providing potential to increase the diagnostic capabilities of prostate cancer MRI. An alternative to Gd-based NPs are SPIONSs due to their low toxicity. Furthermore, macrophages in cancerous tissues, e.g., prostate cancer, are able to internalize SPIOs, leading to their accumulation and, consequently, the desired decrease in signal in T2-weighted magnetic resonance (MR) images. Various coatings (e.g., dextran) and hydrodynamic diameters (30-3000nm) of iron oxide NPs have been investigated as MRI contrast agent for many cancers. Their r1 vary from 10 to 15 mM−1s−1 and their r2 from 30 to 89 mM−1s−1 at 1.5T [40]. The relaxivities r1 and r2 of the H2N-Fe3O4 NPs were shown to be 6.3 mM−1s−1 and 8.33 mM−1s−1 at 9.4 T [37], with a significantly lower r2 than Resovit® at 9.4 T. Kader et al. [15] investigated the application of ferumoxytol (iron oxide coated with carboxylmethyl-dextran) with a core size of 3 nm to 12 nm for prostate cancer detection using a xenograft mouse model. A significant decrease in signal intensity between the pre- and 24 h post- contrast images (n = 14; p < 0.001) was detected [15]. In human studies, ferumoxtran-10 (with dextran coating) was used to detect prostate cancer metastases in lymph nodes. MRI was performed before and 24 h after the intravenous injection of 2.6 mg/kg of ferumoxtran-10 in patients with presurgical prostate cancer who underwent lymph node resection or biopsy. The ferumoxtran-10-enhanced MR images identified all patients with nodal metastases [41,42].
The efficacy of NPs in prostate cancer detection, Gd- or iron-based, may be improved by constructing contrast agents that target PSMA using peptides and antigens [19,20,43,44]. Studies in preclinical models have shown a reduction in the T2 signal from 2 h to 12 h after the injection of the targeted contrast agents [19,45].

4. Materials and Methods

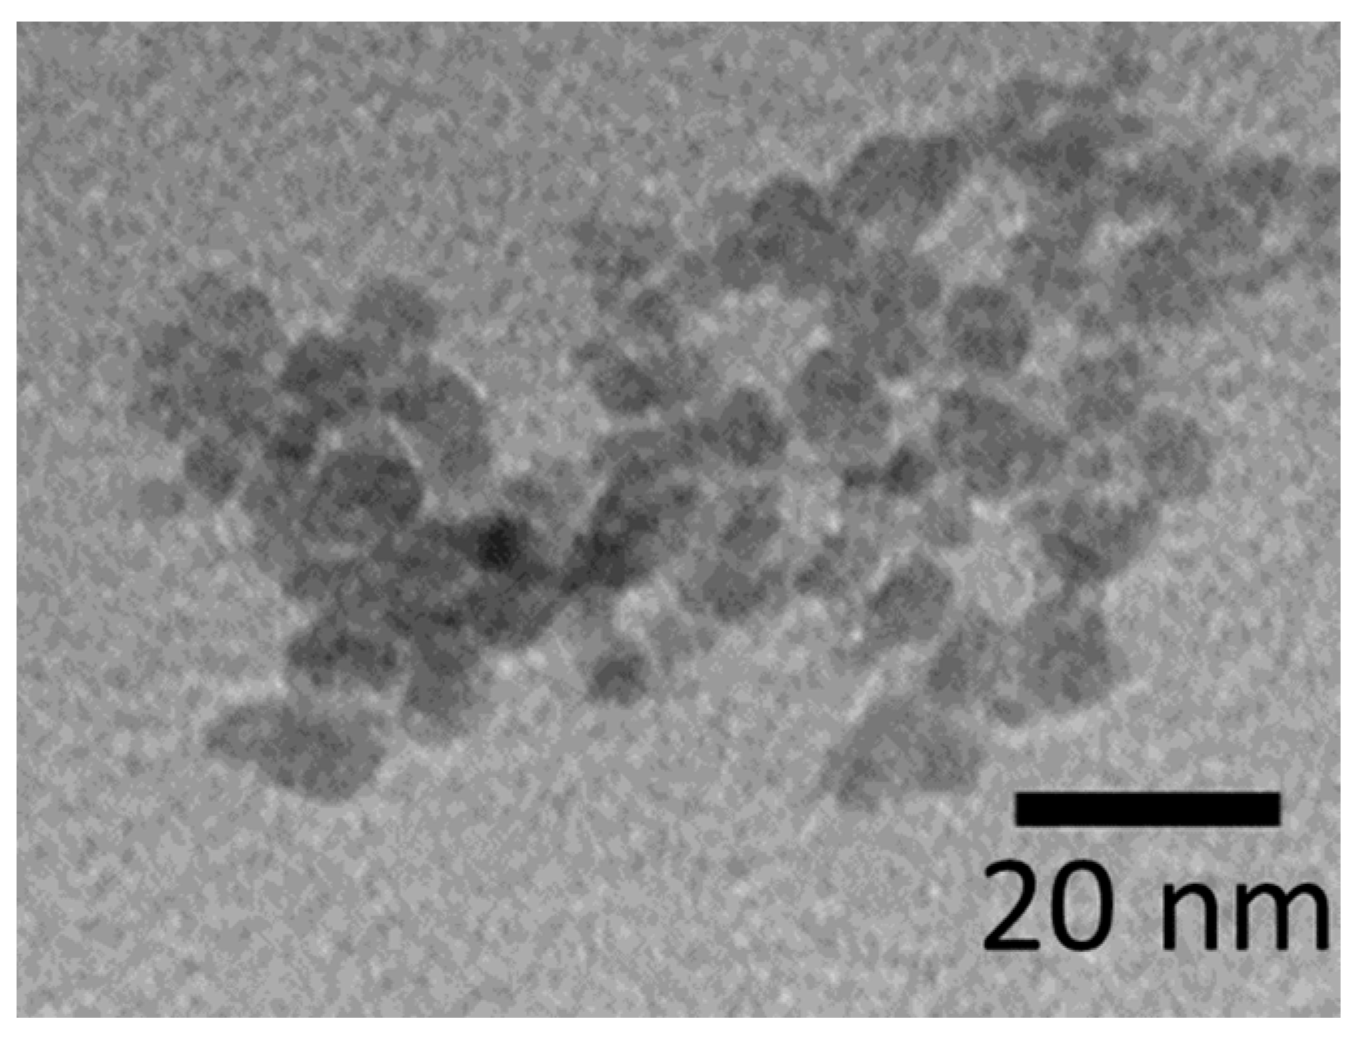
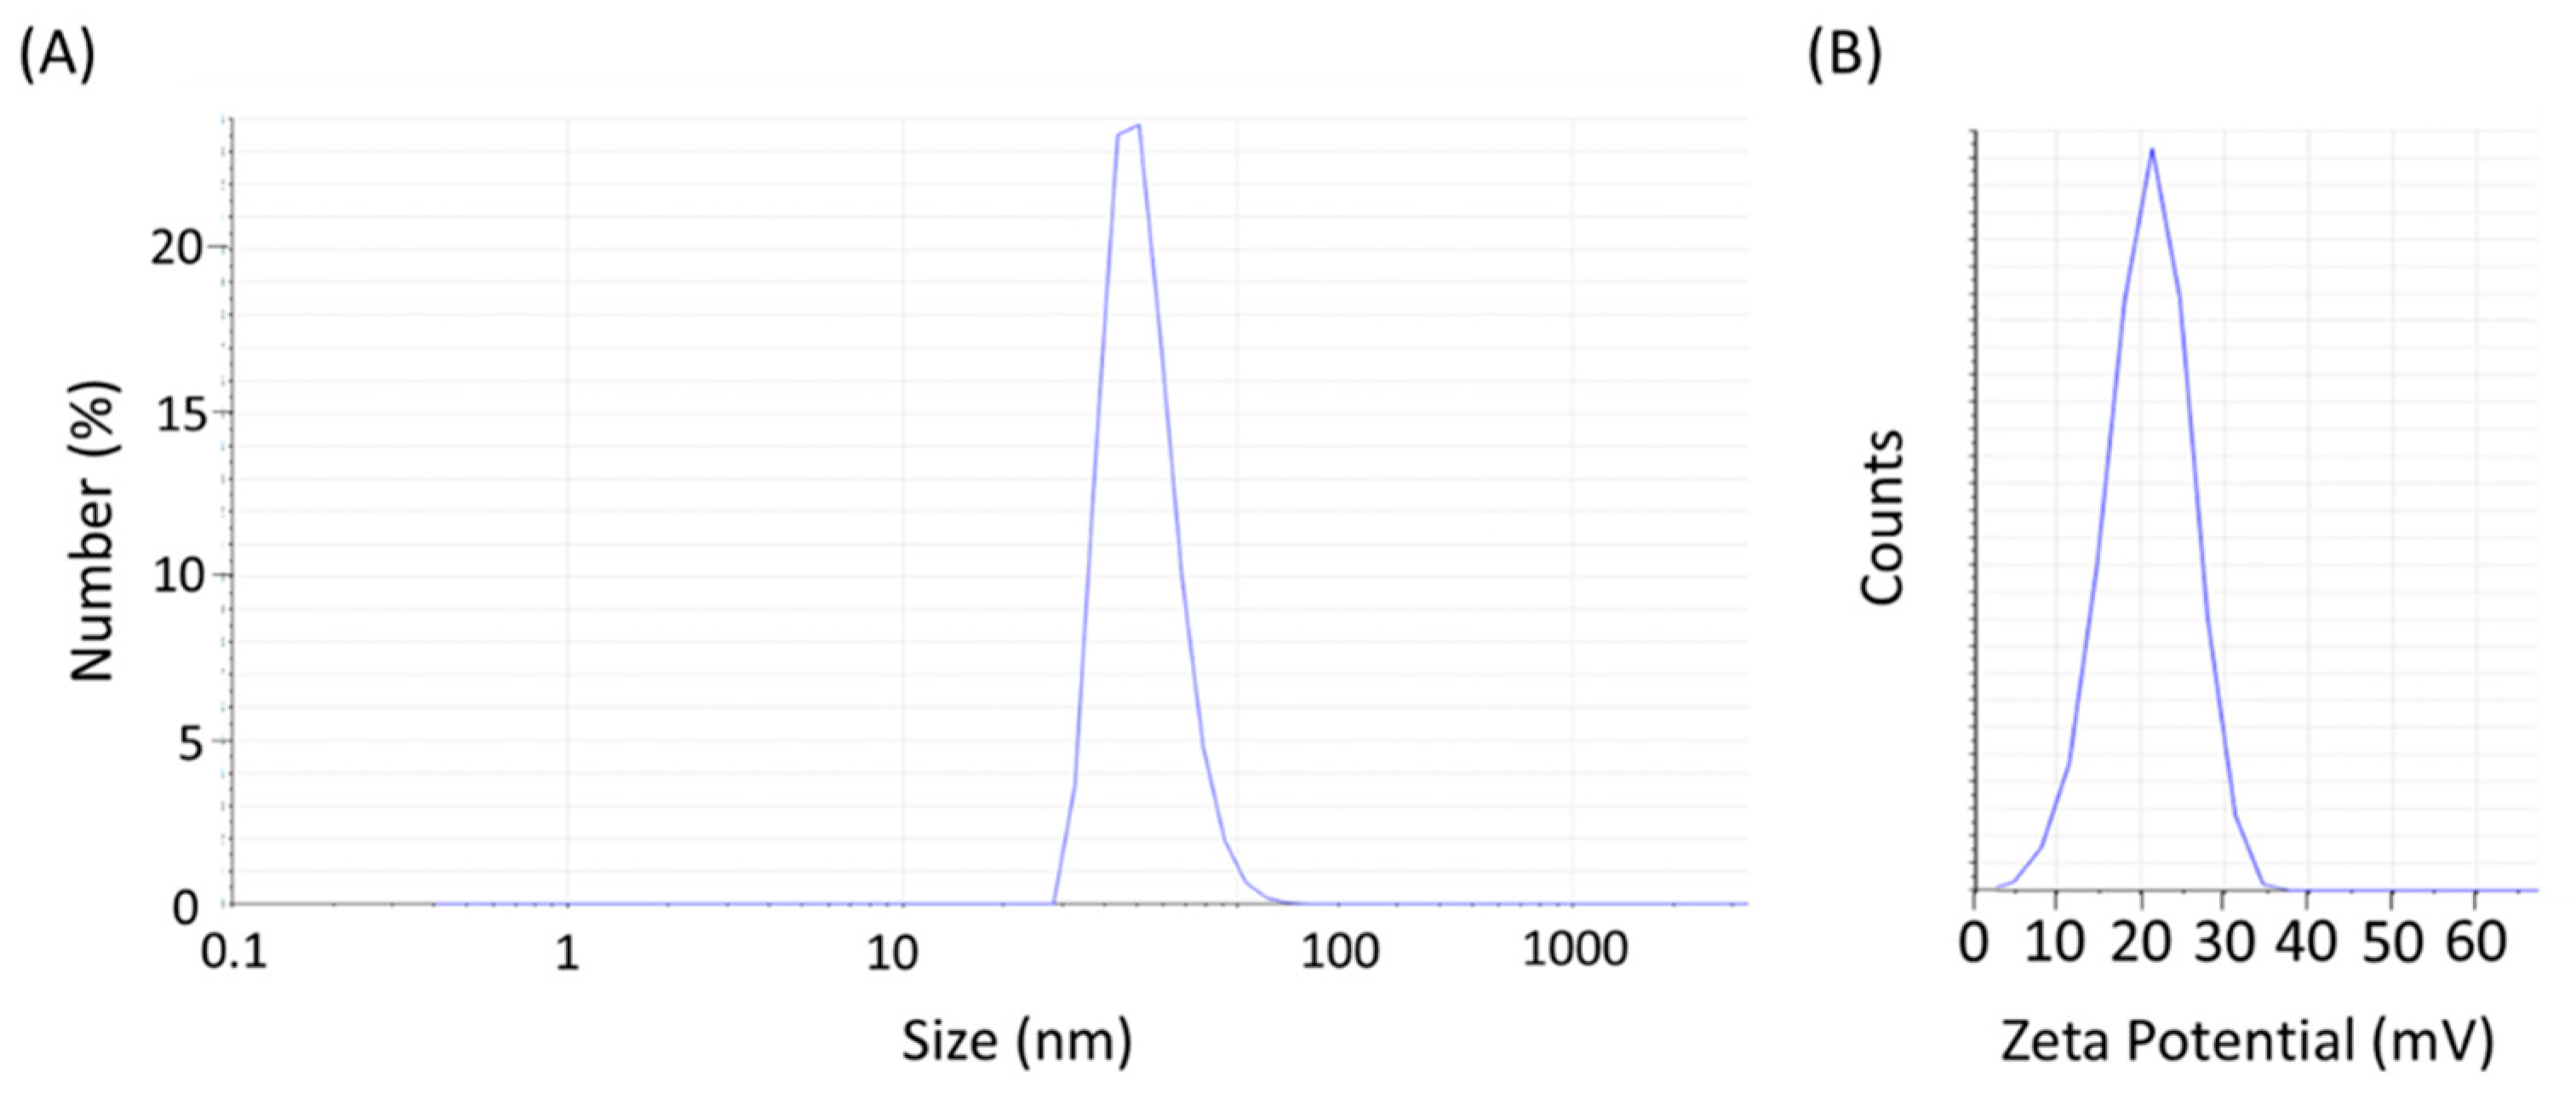
4.1. Synthesis of H2N-Fe3O4 Nanoparticles

A co-precipitation process, using covalently bound alginates, was applied to synthesize H2N-Fe3O4 NPs. Details for the synthesis of H2N-Fe3O4 NPs were provided by Shieh et al. [32]. Briefly, to synthesize H2N-Fe3O4 NPs, 2.0 M FeCl2 (2.0 mL) and 1.0 M FeCl3 (8.0 mL) were mixed with glycine. After 5 min of stirring, a 5 M NaOH solution was gradually added until the solution changed color from yellow to black. The resulting precipitates were collected using a permanent magnet and treated with 3.5 g of glycine dissolved in 30 mL of deionized water, followed by 20 min of sonication. Post sonication, deionized water and acetone were added, and the solution was centrifuged at 10,000 rpm for 10 min. The final precipitates were redispersed in deionized water to obtain a solution of H2N-Fe3O4 NPs, and their iron ion concentration was analyzed with an inductively coupled plasma atomic emission spectroscopy system (CP-AES, Thermo-Element XR, Fisher Scientific Inc., Waltham, MA, USA). A transmission electron microscope (TEM, JEM-1200EX, JOL Ltd., Tokyo, Japan) was used for NP imaging. The zeta potential and hydrodynamic diameter were measured using dynamic light scattering (DLS, ZS90, Malvern Panalytical, Malvern, UK). An illustration depicting an NP is shown in Figure 6.

4.2. Animal Model

Six five-week-old male athymic nude mice (Crl: Nu(NCr)-Foxn1nu; CR Strain code: 490, Charles River) were inoculated subcutaneously on their flank with a suspension of 3 × 10⁶ PC3 cells in 50:50 Matrigel (Fisher Scientific, Poznań, Poland) and RPMI-1640 media supplemented with 10% fetal bovine serum and 1% antibiotics/antimycotics. Once the tumors reached a size of about 5 mm in diameter (~3 weeks), the animals were injected via the tail vein with the contrast agent and imaged with MRI. Previous studies showed a very low toxicity for H2N-Fe3O4 NPs [37]. The authors showed that kidney cell viability remained unchanged at dosages from 0.125 to 8 mM after 4 h of exposure. In vitro hemolysis using human blood showed only mild hemolysis (1.3 g/dL) detected at a 0.1 M iron concentration, which is much higher than that required for MR contrast enhancement [32]. The animal experiment was approved by the local Animal Care Committee (permit no. 87/2023).

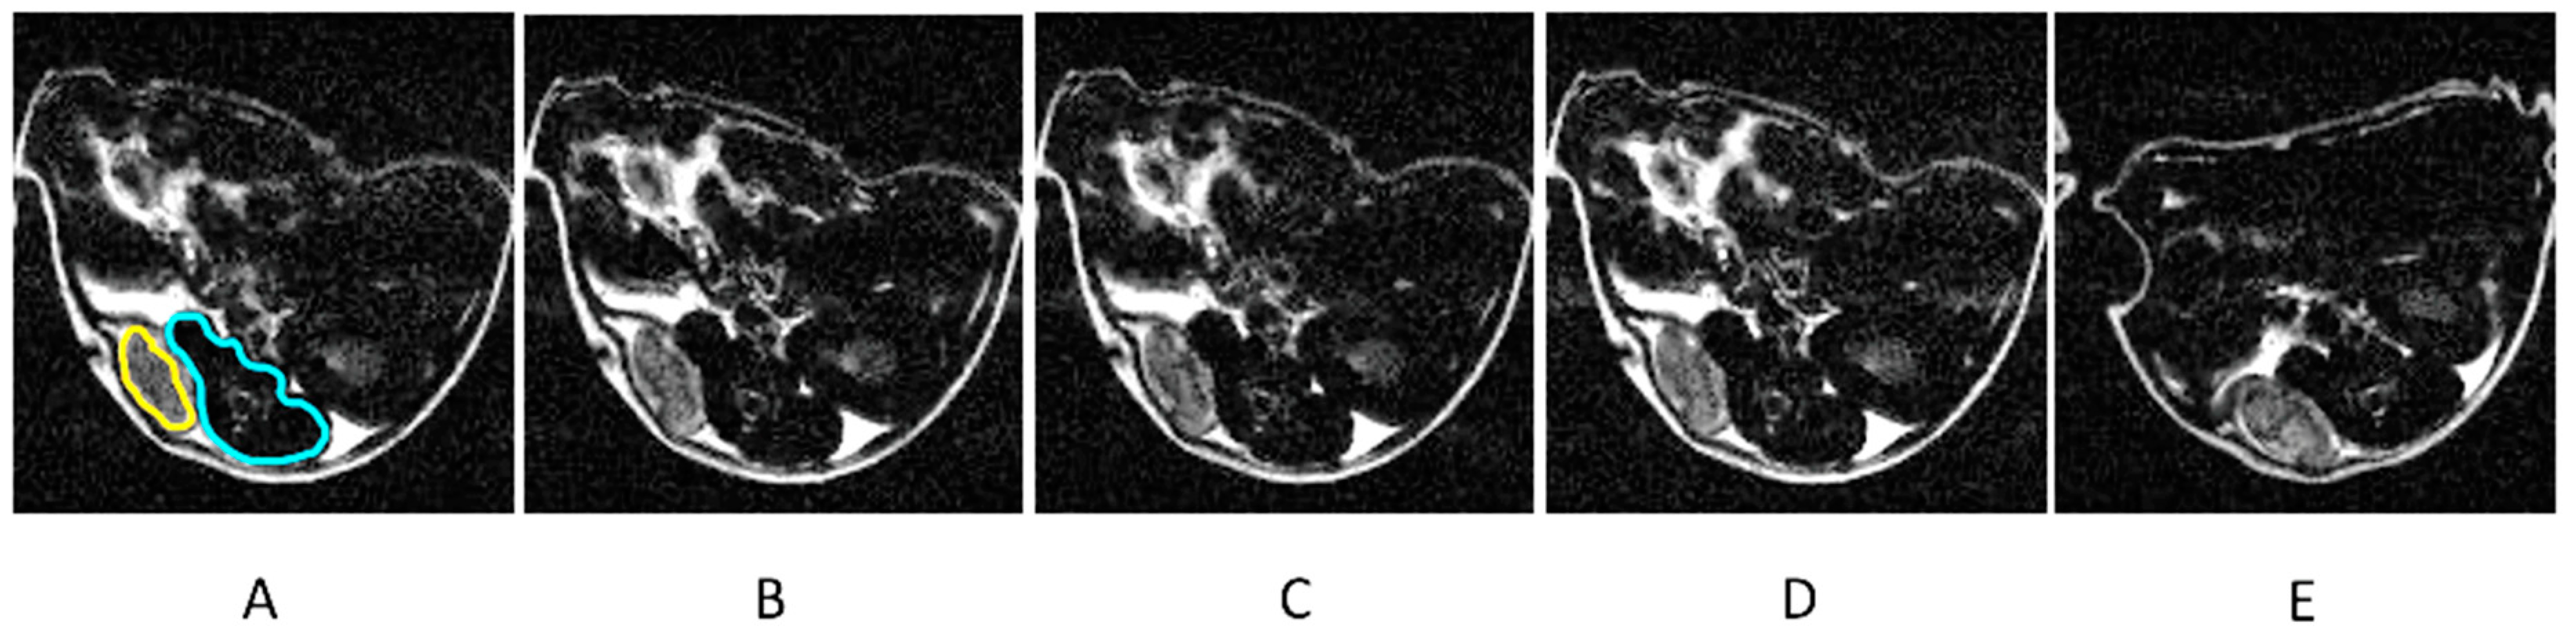
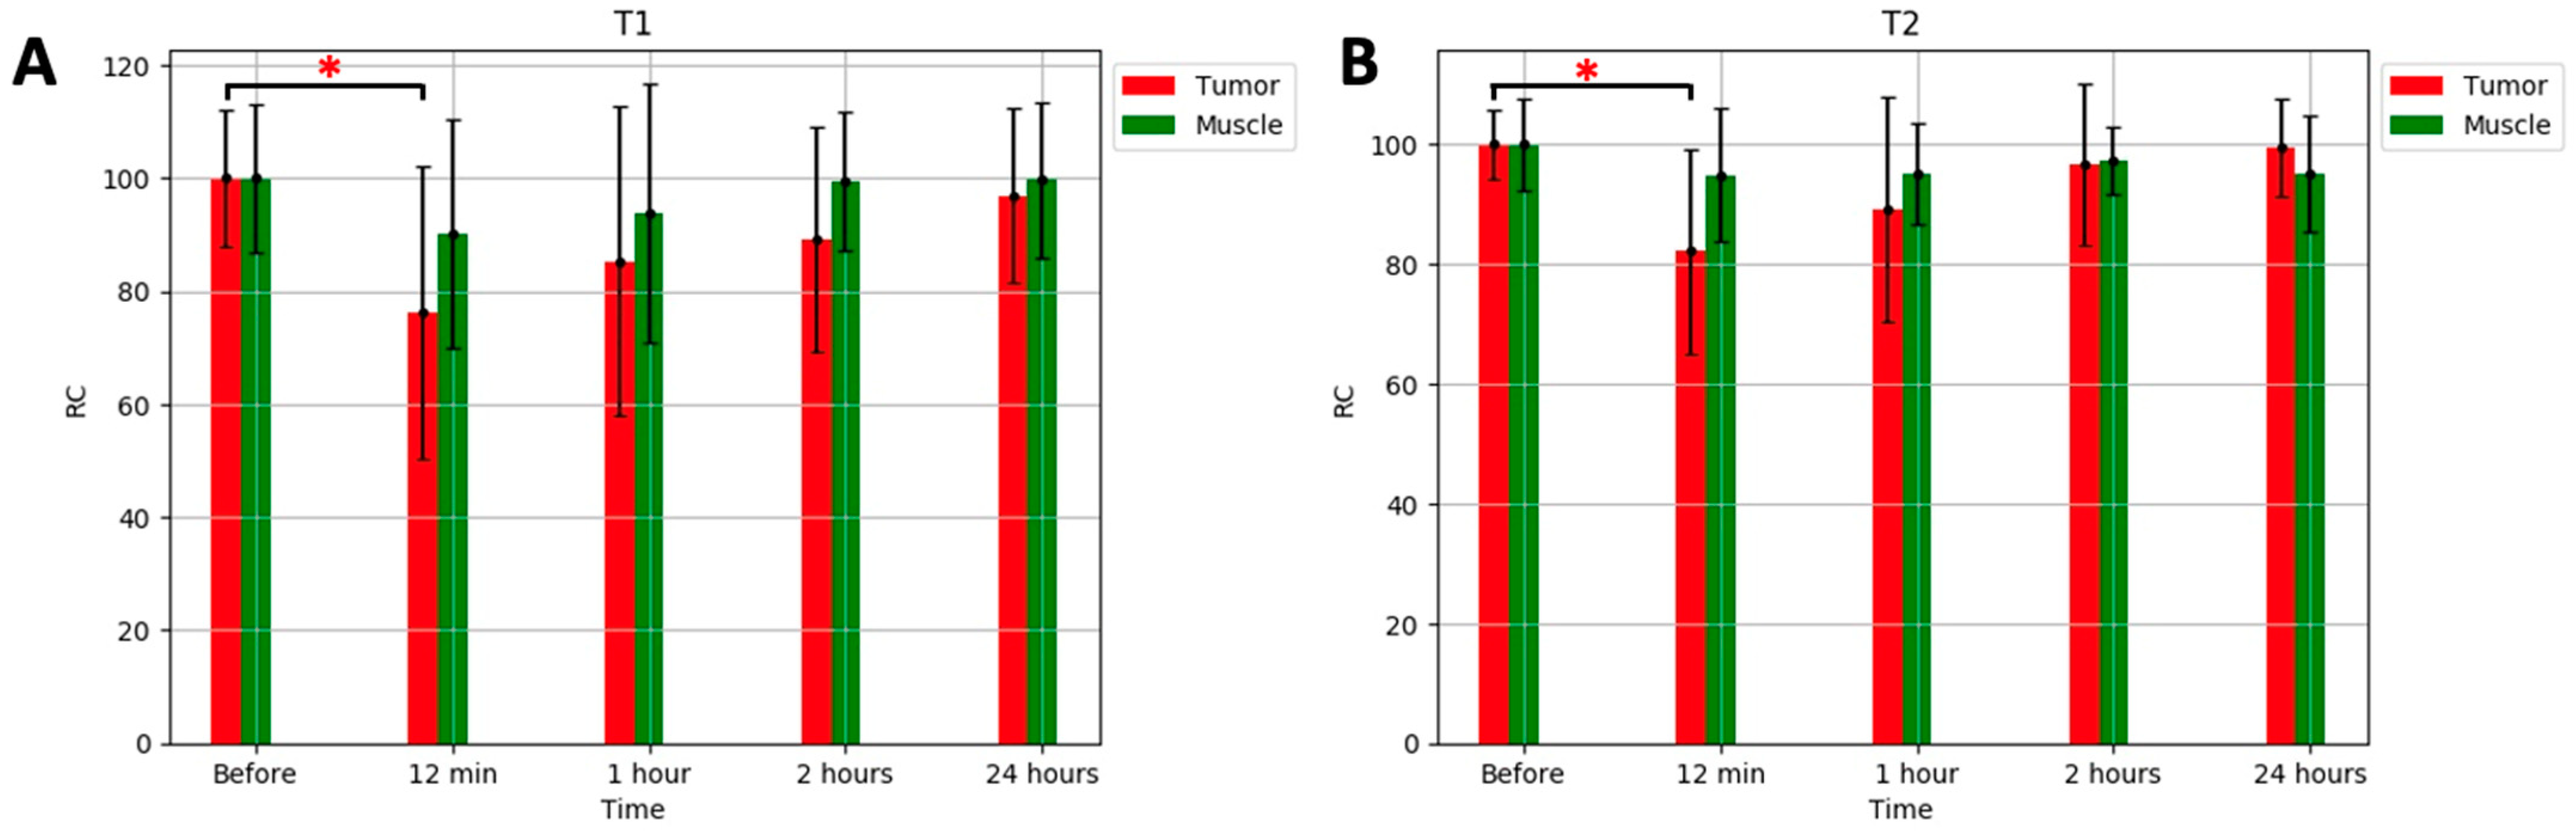
4.3. MRI Experiments

An MRI system equipped with a 9.4 T 21 cm bore magnet (Bruker, Ettlingen, Germany) was used for the in vivo MRI experiments. A 35 mm diameter volume radio frequency coil was positioned over the animal body to encompass the region of interest (ROI), including the tumor. Imaging sessions were conducted before the injection and 12 min, 1 h, 2 h, and 24 h after the injection of 0.25 mL of the H2N-Fe3O4 NP contrast agent with a concentration of 2mg/mL of iron. T1- and T2- weighted images were collected at each time point.
For the MRI scans, the animals were anesthetized with isoflurane (1.5–2% in 30% oxygen) administered through a nose cone, and they were placed in a cradle positioned within the center of the bore of the magnet. The animals were kept normothermic using a circulating water blanket, and their pulse sequences were triggered with respiration.
For the T1- and T2-weighted images, inversion recovery with steady-state free precession (IR FISP) and multi-slice multi-echo (MSME) pulse sequences were used. For the T2-weighted images, the following pulse sequence parameters were used: 1 mm slice thickness, TE 5 ms, TR 5000 ms, NA 1, 32 echoes, 10 slices, matrix size 128 × 128, and FOV 2.56 cm × 3.0 cm. A single exponential fitting of the echoes was used for the calculation of the T2 relaxation times (Bruker, Ettlingen, Germany). For the T1 measurements, the IR FISP sequence parameters were the following: TE 1.5 ms, TR 3ms, NA 8, FA 60 deg, number of segments 1, 30 frames, 1 slice, matrix size 128 × 128, FOV 2.56 cm × 3.0 cm, and slice thickness 1 mm. All the results of the changes in the RC relaxation times were processed using a standard analysis of variance (ANOVA); p < 0.05 was considered statistically significant.

5. Conclusions

The H2N-Fe3O4-based MRI contrast agent significantly reduced both the T1 and T2 relaxation times in the animal model of PC. These findings show its potential to enhance the imaging contrast for prostate tumors. The observed reductions in the relaxation times highlight the effectiveness of the contrast agent in enhancing tumor detection. The decreases in the T1 and T2 times within the muscle tissue were less pronounced than in the tumor region, implying a higher concentration of the contrast agent within the tumor volume. The findings show that the presented H2N-Fe3O4-based contrast agent effectively reduced both the T1 and T2 relaxation times, presenting a promising avenue for improving the accuracy and efficiency of prostate tumor imaging in preclinical applications, as there is a pressing need for an improved PC staging method which enables the more accurate detection of potentially cancerous cells. The lack of a targeting moiety and the lower r1 and r2 of the NH2-Fe3O4 used in our study compared to the most commonly used contrast agents, such as Resovit®, may explain the relatively small changes in the relaxation time of the tumor. Further contrast studies, followed by targeting and clinical applications may allow early tumor detection, enabling curative interventions.

Author Contributions

Conceptualization, B.B., B.T. and D.M.; methodology, D.M., B.B., B.T. and K.J.; software, D.M.; formal analysis, K.J., B.B. and D.M.; investigation, B.B.; data curation, K.J. and D.M.; writing—original draft preparation, B.T., D.M., F.-Y.C. and B.B.; writing—review and editing, B.T., D.M., B.B. and F.-Y.C.; and visualization, D.M., B.T., B.B. and F.-Y.C. All authors have read and agreed to the published version of the manuscript.

Funding

This work was funded by the following grants from the National Science Center, Poland: Harmonia 2018/30/M/NZ5/00844.

Institutional Review Board Statement

The animal study protocol was approved the II Local Ethics Committee, Krakow, Poland (protocol code 87/2023, date of approval 6 April 2023).

Data Availability Statement

Data is contained within the article.

Conflicts of Interest

The authors declare no conflict of interest.

References

  1. Rebello, R.J.; Oing, C.; Knudsen, K.E.; Loeb, S.; Johnson, D.C.; Reiter, R.E.; Gillessen, S.; Van der Kwast, T.; Bristow, R.G. Prostate cancer. Nat. Rev. Dis. Primers 2021, 7, 9. [Google Scholar] [CrossRef] [PubMed]
  2. Catalona, W.J.; Richie, J.P.; Ahmann, F.R.; Hudson, M.L.A.; Scardino, P.T.; Flanigan, R.C.; DeKernion, J.B.; Ratliff, T.L.; Kavoussi, L.R.; Dalkin, B.L.; et al. Comparison of digital rectal examination and serum prostate specific antigen in the early detection of prostate cancer: Results of a multicenter clinical trial of 6630 men. J. Urol. 2017, 197, 200–207. [Google Scholar] [CrossRef] [PubMed]
  3. Klotz, L. Active surveillance with selective delayed intervention using PSA doubling time for good risk prostate cancer. Eur. Urol. 2005, 47, 16–21. [Google Scholar] [CrossRef] [PubMed]
  4. Carter, H.B.; Partin, A.W.; Brawer, M.K.; Albertsen, P.C.; Chan, P.T.; Scardino, P.T.; Kupelian, J.M.; Thompson, I.M.; Carroll, P.; Ries, G.; et al. Detection of life-threatening prostate cancer with prostate-specific antigen velocity during a window of curability. J. Natl. Cancer Inst. 2006, 98, 1521–1527. [Google Scholar] [CrossRef]
  5. Carter, H.B. Prostate cancers in men with low PSA levels—Must we find them? N. Engl. J. Med. 2004, 350, 2292–2294. [Google Scholar] [CrossRef]
  6. Welch, H.G.; Elmore, J.G.; Brown, M.L. Prostate-specific antigen levels in the United States: Implications of various definitions for abnormal. J. Natl. Cancer Inst. 2005, 97, 1132–1137. [Google Scholar] [CrossRef]
  7. Stephenson, R.A.; Stanford, J.L. Population-based prostate cancer trends in the United States: Patterns of change in the era of prostate-specific antigen. World J. Urol. 1997, 15, 331–335. [Google Scholar] [CrossRef]
  8. Schmid, D.T.; Klass, T.M. Fluorocholine PET/CT in patients with prostate cancer: Initial experience. Radiology 2005, 235, 623–628. [Google Scholar] [CrossRef]
  9. Kurhanewicz, J.; Vigneron, D.B.; Zufall, P.E.; Coakley, J.J.; Males, T.P.; Swanson, A.P.; Nelson, M.P.; Carroll, P.R.; Hricak, J.K.; James, J.K. Combined magnetic resonance imaging and spectroscopic imaging approach to molecular imaging of prostate cancer. J. Magn. Reson. Imaging 2002, 16, 451–463. [Google Scholar] [CrossRef]
  10. Hricak, H.; James, J.K.; Scardino, P.T.; Karakiewicz, J.F.; Hricak, H.; Taneja, S.S.; Zelefsky, M.J.; Hricak, H. Carcinoma of the prostate gland: MR imaging with pelvic phased-array coils versus integrated endorectal—Pelvic phased-array coils. Radiology 1994, 193, 703–709. [Google Scholar] [CrossRef]
  11. Schnall, M.D.; Malley, P.C.; Connelly, J.S.; Beaver, B.J.; Reiger, S.B.; Rubens, M.L.; Scardino, P.T. Prostate: MR imaging with an endorectal surface coil. Radiology 1989, 172, 570–574. [Google Scholar] [CrossRef] [PubMed]
  12. Hanks, G.E.; Rosenthal, S.A.; Rengan, R.; Lawton, C.A.F.; Dicker, A.P.; Mauer, A.M.; Zietman, A.; Lawton, C.A.F.; Dicker, A.P.; Roach, M.; et al. Comparison of pathologic and clinical evaluation of lymph nodes in prostate cancer: Implications of RTOG data for patient management and trial design and stratification. Int. J. Radiat. Oncol. Biol. Phys. 1992, 23, 293–298. [Google Scholar] [CrossRef] [PubMed]
  13. Xiao, Y.-D.; Paudel, R.; Liu, J.; Ma, C.; Zhang, Z.-S.; Zhou, S.-K. MRI contrast agents: Classification and application (Review). Int. J. Mol. Med. 2016, 38, 1319–1326. [Google Scholar] [CrossRef] [PubMed]
  14. Ibrahim, M.; Hazhirkarzar, B.; Dublin, A.B. Gadolinium Magnetic Resonance Imaging; StatPearls Publishing: Treasure Island, FL, USA, 2024. [Google Scholar]
  15. Kader, A.; Mangarova, D.B.; Moeckel, J.; Brangsch, J.; Adams, L.C.; Zhao, J.; Reimann, C.; Saatz, J.; Traub, H.; Buchholz, R.; et al. Iron Oxide Nanoparticles for Visualization of Prostate Cancer in MRI. Cancers 2022, 14, 2909. [Google Scholar] [CrossRef]
  16. Dash, T.; Blasiak, B.; Tomanek, B.; Banerjee, A.; Trudel, S.; Latta, P.; van Veggel, F. Colloidally Stable Monodisperse Fe Nanoparticles as T2 Contrast Agents for High-Field Clinical and Preclinical Magnetic Resonance Imaging. ACS Appl. Nano Mater. 2021, 4, 1235–1242. [Google Scholar] [CrossRef]
  17. Nagesh, P.K.; Johnson, N.R.; Boya, V.K.N.; Chowdhury, P.; Othman, S.F.; Khalilzad-Sharghi, V.; Hafeez, B.B.; Ganju, A.; Khan, S.; Behrman, S.W.; et al. PSMA targeted docetaxel-loaded superparamagnetic iron oxide nanoparticles for prostate cancer. Colloids Surf. B Biointerfaces 2016, 144, 8–20. [Google Scholar] [CrossRef]
  18. Singh, N.; Jenkins, G.J.; Asadi, R.; Doak, S.H. Potential toxicity of superparamagnetic iron oxide nanoparticles (SPION). Nano Rev. 2010, 1, 5358. [Google Scholar] [CrossRef]
  19. Tse, B.W.; Cowin, G.J.; Soekmadji, C.; Jovanovic, L.; Vasireddy, R.S.; Pedersen, J.S.; Ling, M.T.; Khatri, A.; Liu, T.; Thierry, B. PSMA-targeting iron oxide magnetic nanoparticles enhance MRI of preclinical prostate cancer. Nanomedicine 2014, 10, 375–386. [Google Scholar] [CrossRef]
  20. Zhu, Y.; Sun, Y.; Chen, Y.; Liu, W.; Jiang, J.; Guan, W.; Duan, Y. In Vivo Molecular MRI Imaging of Prostate Cancer by Targeting PSMA with Nanoparticles. Int. J. Mol. Sci. 2015, 16, 9573–9587. [Google Scholar] [CrossRef]
  21. Zhao, S.; Yu, X.; Qian, Y.; Chen, W.; Shen, J. Multifunctional magnetic iron oxide nanoparticles: An advanced platform for cancer theranostics. Theranostics 2020, 10, 6278–6309. [Google Scholar] [CrossRef]
  22. Wei, H.; Bruns, O.; Kaul, M.; Hansen, E.; Barch, M.; Wiśniowska, A.; Chen, O.; Chen, Y.; Li, N.; Okada, S.; et al. Exceedingly small iron oxide nanoparticles as positive MRI contrast agents. Proc. Natl. Acad. Sci. USA 2017, 114, 2325–2330. [Google Scholar] [CrossRef] [PubMed]
  23. Nitin, N.; LaConte, L.E.W.; Zurkiya, O.; Hu, X.; Bao, G. Functionalization and peptide-based delivery of magnetic nanoparticles as an intracellular MRI contrast agent. J. Biol. Inorg. Chem. 2004, 9, 706–712. [Google Scholar] [CrossRef] [PubMed]
  24. Artemov, D.; Mori, N.; Okollie, B.; Bhujwalla, Z.M. Molecular magnetic resonance imaging with targeted contrast agents. J. Cell. Biochem. 2003, 90, 518–524. [Google Scholar] [CrossRef] [PubMed]
  25. Sasaki, M.; Takatsu, Y.; Noguchi, T.; Ohkawa, S.; Yoshioka, H.; Ohsawa, I.; Nakamura, T.; Shimizu, Y.; Yanagisawa, T.; Nakamura, T.; et al. Enhancement effects and relaxivities of gadolinium-DTPA at 1.5 versus 3 Tesla: A phantom study. Magn. Reson. Med. Sci. 2005, 4, 145–149. [Google Scholar] [CrossRef]
  26. Pu, F.; Salarian, M.; Xue, S.; Qiao, J.; Feng, J.; Tan, S.; Yang, J.J. Prostate-specific membrane antigen targeted protein contrast agents for molecular imaging of prostate cancer by MRI. Nanoscale 2016, 8, 12668–12682. [Google Scholar] [CrossRef]
  27. Hagberg, E.; Scheffler, K. Effect of r1 and r2 relaxivity of gadolinium-based contrast agents on the T1-weighted MR signal at increasing magnetic field strengths. CMMI 2013, 8, 456–465. [Google Scholar] [CrossRef]
  28. Caravan, P.; Ellison, J.J.; McMurry, T.J.; Lauffer, R.B. Zinc-sensitive MRI contrast agent detects differential release of Zn(II) ions from the healthy vs. malignant mouse prostate. Chem. Soc. Rev. 2006, 35, 512–523. [Google Scholar]
  29. Ta, H.; Li, Z.; Wu, Y.; Cowin, G.; Zhang, S.; Yago, A.; Xu, Z. Effects of magnetic field strength and particle aggregation on relaxivity of ultra-small dual contrast iron oxide nanoparticles. Mater. Res. Express 2017, 4, 116105. [Google Scholar] [CrossRef]
  30. Dash, T.; Blasiak, B.; Tomanek, B.; Latta, P.; van Veggel, F. Target-Specific Magnetic Resonance Imaging of Human Prostate Adenocarcinoma Using NaDyF4–NaGdF4 Core–Shell Nanoparticles. ACS Appl. Mater. Interfaces 2021, 13, 24345–24355. [Google Scholar] [CrossRef]
  31. Pellico, J.; Ellis, C.M.; Davis, J.J. Nanoparticle-Based Paramagnetic Contrast Agents for Magnetic Resonance Imaging. Contrast Media Mol. Imaging 2019, 2019, 1845637. [Google Scholar] [CrossRef]
  32. Shieh, D.-B.; Cheng, F.Y.; Su, C.H.; Yeh, C.S.; Wu, M.T.; Wu, Y.N.; Tsai, C.Y.; Wu, C.L.; Chen, D.H.; Chou, C.H. Aqueous dispersions of magnetite nanoparticles with NH3+ surfaces for magnetic manipulations of biomolecules and MRI contrast agents. Biomaterials 2005, 26, 7183–7191. [Google Scholar] [CrossRef]
  33. Luo, Q.; Liu, J.; Ma, Q.; Xu, S.; Wang, L. Single-Atom Gd Nanoprobes for Self-Confirmative MRI with Robust Stability. Small 2023, 19, 23. [Google Scholar] [CrossRef] [PubMed]
  34. Stankiewicz, A.; MacDonald, D.; Blasiak, B.; Kasparek, A.; Tomanek, B.; Cheng, F.; Kruk, D. 1H Spin-Lattice Relaxation Processes in Soultions of H2N-Fe3O4 Nanoparticles: Insights from NMR Relaxometry. J. Phys. Chem. B 2024, 128, 1520–6106. [Google Scholar] [CrossRef] [PubMed]
  35. Jeon, M.; Halbert, M.V.; Stephen, Z.R.; Zhang, M. Iron Oxide Nanoparticles as T 1 Contrast Agents for Magnetic Resonance Imaging: Fundamentals, Challenges, Applications, and Prospectives. Adv. Mater. 2021, 33, 1906539. [Google Scholar] [CrossRef] [PubMed]
  36. Iglesias, J.E.; Schleicher, R.L.; Laguna, S.; Billot, B.; Schaefer, P.; McKaig, B.; Goldstein, J.N.; Sheth, K.N.; Rosen, M.S.; Kimberly, W.T. Quantitative Brain Morphometry of Portable Low-Field-Strength MRI Using Super-Resolution Machine Learning. Radiology 2022, 306, e220522. [Google Scholar] [CrossRef]
  37. Arnold, T.C.; Tu, D.; Okar, S.V.; Nair, G.; By, S.; Kawatra, K.D.; Robert-Fitzgerald, T.E.; Desiderio, L.M.; Schindler, M.K.; Shinohara, R.T.; et al. Sensitivity of portable low-field magnetic resonance imaging for multiple sclerosis lesions. Neuroimage Clin. 2022, 35, 103101. [Google Scholar] [CrossRef]
  38. Beaton, L.; Bandula, S.; Gaze, M.N.; Sharma, R.A. How rapid advances in imaging are defining the future of precision radiation oncology. Br. J. Cancer 2019, 120, 779–790. [Google Scholar] [CrossRef]
  39. Li, X.; Sun, Y.; Ma, L.; Liu, G.; Wang, Z. The Renal Clearable Magnetic Resonance Imaging Contrast Agents: State of the Art and Recent Advances. Molecules 2020, 25, 5072. [Google Scholar] [CrossRef]
  40. Corot, C.; Robert, P.; Idée, J.M.; Port, M. Recent advances in iron oxide nanocrystal technology for medical imaging. Adv. Drug Deliv. Rev. 2006, 58, 1471–1504. [Google Scholar] [CrossRef]
  41. Harisinghani, M.G.; Barentsz, J.; Hahn, P.F.; Deserno, W.M.; Tabatabaei, S.; van de Kaa, C.H.; de la Rosette, J.; Weissleder, R. Noninvasive Detection of Clinically Occult Lymph-Node Metastases in Prostate Cancer. N. Engl. J. Med. 2003, 348, 2491–2499. [Google Scholar] [CrossRef]
  42. Heesakkers, R.A.; Fütterer, J.J.; Hövels, A.M.; van den Bosch, H.C.; Scheenen, T.W.; Hoogeveen, Y.L.; Barentsz, J.O. Prostate cancer evaluated with ferumoxtran-10-enhanced T2*-weighted MR Imaging at 1.5 and 3.0 T: Early experience. Radiology 2006, 239, 481–487. [Google Scholar] [CrossRef] [PubMed]
  43. Banerjee, S.R.; Ngen, E.J.; Rotz, M.W.; Kakkad, S.; Lisok, A.; Pracitto, R.; Pomper, M.G. Synthesis and Evaluation of GdIII-Based Magnetic Resonance Contrast Agents for Molecular Imaging of Prostate-Specific Membrane Antigen. Angew. Chem. Int. Ed. 2015, 54, 10778–10782. [Google Scholar] [CrossRef] [PubMed]
  44. Ngen, E.J.; Behnam Azad, B.; Boinapally, S.; Lisok, A.; Brummet, M.; Jacob, D.; Banerjee, S.R. MRI Assessment of Prostate-Specific Membrane Antigen (PSMA) Targeting by a PSMA-Targeted Magnetic Nanoparticle: Potential for Image-Guided Therapy. Mol. Pharm. 2019, 16, 2060–2068. [Google Scholar] [CrossRef]
  45. Liu, G.; Gao, J.; Ai, H.; Chen, X. Applications and potential toxicity of magnetic iron oxide nanoparticles. Small 2013, 9, 1533–1545. [Google Scholar] [CrossRef]
Figure 1. Transmission electron microscopy image of the H2N-Fe3O4 NPs.
Ijms 25 10334 g001
Figure 2. (A) Hydrodynamic diameter and (B) zeta potential of the H2N-Fe3O4 nanoparticles.
Ijms 25 10334 g002
Figure 3. T1-weighted MR images of a mouse with prostate cancer before the injection (A) and 12 min (B), 1 h (C), 2 h (D), and 24 h (E) after the injection of the H2N-Fe3O4 NP contrast agent. The regions of interest encompassing the tumor (T) and muscles (M) have been manually selected and marked (in (A) only for clarity) with yellow and blue color, respectively. The post-injection images show increased signals from the tumor 12 min, 1h, and 2h after the injection and a return to the initial value 24 h after the injection. Signals from other organs (e.g., intestines) remain the same at each time point, except for 24 h after the injection due to the repositioning of the animals. The visible changes in the signal intensity due to the contrast injections causing the T1 relaxation decrease in both cancer and muscle tissues are quantified and analyzed below.
Ijms 25 10334 g003
Figure 4. T2-weighted magnetic resonance (MR) images of a mouse with prostate cancer before the injection (A) and 12 min (B), 1h (C), 2h (D), and 24 h (E) after the injection of the H2N-Fe3O4 NP contrast agent. The regions of interest encompassing the tumor (T) and muscles (Ms) have been manually selected and marked (in (A) only for clarity) with yellow and blue color, respectively. The post-injection images show decreased signals from the tumor 12 min, 1 h, and 2 h after the injection and a return to the initial value 24 h after the injection. Signals from other organs (e.g., intestines) remain the same at each time point, except for 24 h after the injection due to the repositioning of the animals. The visible changes in the signal intensity due to the contrast injections causing T2 relaxation decrease are quantified and analyzed below.
Ijms 25 10334 g004
Figure 5. The RC values over 6 animals for the T1 (A) and T2 (B) relative relaxation within the tumor and muscles before, 12 min, 1 h, 2 h, and 24 h after the injection. The data show a statistically significant (p < 0.05) difference (indicated with *) in the relative change (RC) of T1 and T2 12 min after the injection. The decrease 1 h, 2 h, and 24 h after the injection was visible but not statistically significant (p > 0.05).
Ijms 25 10334 g005
Figure 6. A schematic illustration of the H2N-Fe3O4 nanoparticle.
Ijms 25 10334 g006
Table 1. Relaxivities of the nanoparticles described in this text.
Contrast Agentr1 [mM−1s−1]r2 [mM−1s−1]Field Strength [T]Ref.
Gd-CP027 bound to albumin48 0.5[28]
Gd-CP027 bound to albumin31 1.5[28]
Gd-CP027 bound to albumin9.4 9.4[28]
Gd-DTPA4.795.141.5[25]
Gd-DTPA4.055.093[25]
Gadolinium-based18.6947[26]
Gd-based1821.69.4[27]
SPIONS5.6729.4[29]
Dy/Gd20.232.33[30]
Dy/Gd9.4144.79.4[30]
H2N-Fe3O46.318.339.4[32]
H2N-Fe3O46.7733.561.5[32]
Resovit®1.22809.4[32]
Resovit®6.7821.5[32]
Disclaimer/Publisher’s Note: The statements, opinions and data contained in all publications are solely those of the individual author(s) and contributor(s) and not of MDPI and/or the editor(s). MDPI and/or the editor(s) disclaim responsibility for any injury to people or property resulting from any ideas, methods, instructions or products referred to in the content.

