Article

A Novel Prognostic Model of Hepatocellular Carcinoma per Two NAD+ Metabolic Synthesis-Associated Genes

1
Division of Hepatobiliary Surgery, The First Affiliated Hospital of Guangxi Medical University, Nanning 530021, China
2
Key Laboratory of Early Prevention and Treatment for Regional High Frequency Tumor (Guangxi Medical University), Ministry of Education, Nanning 530021, China
3
Guangxi Key Laboratory of Immunology and Metabolism for Liver Diseases, Nanning 530021, China
*
Authors to whom correspondence should be addressed.
These authors contributed equally to this work.
Int. J. Mol. Sci. 2024, 25(19), 10362; https://doi.org/10.3390/ijms251910362
Submission received: 19 August 2024 / Revised: 14 September 2024 / Accepted: 16 September 2024 / Published: 26 September 2024
(This article belongs to the Section Molecular Oncology)

Abstract

:
Hepatocellular carcinoma (HCC) is a formidable challenge to global human health, while recent years have witnessed the important role of NAD+ in tumorigenesis and progression. However, the expression pattern and prognostic value of NAD+ in HCC still remain elusive. Gene expression files and corresponding clinical pathological files associated with HCC were obtained from the Cancer Genome Atlas (TCGA) database, and genes associated with NAD+ were retrieved from the GSEA and differentially analyzed in tumor and normal tissues. A consensus clustering analysis was conducted by breaking down TCGA patients into four distinct groups, while Kaplan–Meier curves were generated to investigate the disparity in clinical pathology and endurance between clusters. A prognostic model based on NAD+-associated genes was established and assessed by combining LASSO-Cox regression, uni- and multi-variate Cox regression, and ROC curve analyses. Investigations were conducted to determine the expression of distinct mRNAs and proteins in both HCC and non-tumor tissues. A novel two-gene signature including poly (ADP-Ribose) polymerase 2 (PARP2) and sirtuin 6 (SIRT6) was obtained through LASSO-Cox regression and was identified to have favorable prognostic performance in HCC patients from TCGA. Analyses of both single and multiple variables showed that the prognostic model was a distinct prognostic factor in the endurance of liver cancer patients in both the training and trial groups. The nomogram also exhibited clinical significance in the prognosis of HCC patients. Immunohistochemistry, qRT-PCR, and Western blotting revealed that HCC samples exhibited higher PARP2 and SIRT6 expression levels than those of normal controls. This study identified a robust prognostic model comprising two NAD+-associated genes using bioinformatic methods, which is accurate in predicting the survival outcome of HCC patients. This model might benefit the early diagnosis of HCC and further facilitate the management of individualized medical service and clinical decision-making.

1. Introduction

HCC is a prevalent malignancy that ranks third in global fatality among cancers [1]. According to WHO statistics, almost over nine hundred thousand people have been diagnosed with HCC [2]. It is a great challenge to cure the disease due to it being highly heterogeneous, readily resistant to chemoradiotherapy, hard to be diagnosed in early stages, progressing rapidly and aggressively, and lacking high-efficient target drugs. In this context, exploring a significant model in the early diagnosis, treatment, and prognosis of HCC is critically important for HCC patients’ survival.
NAD+ and NADH, the primary components of nicotinamide adenine dinucleotide (NAD), are fundamental coregulators in the organism [3] (Figure 1). NAD+ participates in a variety of biological activities, such as energy metabolism, DNA repair, cellular metabolism, and signal transduction. Initial research revealed that NAD+ levels can be a predictor of a range of illnesses, such as degenerative disorders of the central nervous system, cardiovascular illness, and tumors [4]. High levels of energy metabolism are always required to sustain the unlimited growth of tumor cells in tumorigenesis. A previous study reported that CD38 could induce cell cycle arrest by significantly decreasing the NAD+ level in prostate cancer cells, which might be the key mechanism involved in the delay of disease progression [5]. In mammalian cells, the rate-limiting enzyme nicotinamide phosphoribosyltransferase (NAMPT) has a major effect on NAD biosynthesis through the salvage pathway [6]. In addition, NAMPT exhibits abnormal expression in multiple tumor tissues and is predictive for poor prognosis [7,8,9]. Meanwhile, NAMPT inhibitor FK866 is capable of accelerating tumor cell death, concomitantly with reductions in NAMPT expression and the NAD+ level [10]. This study implies that NAMPT inhibitors might be viable options in the treatment of HCC. Collectively, NAD+-related genes might play a significant role in tumorigenesis and progression.
To obtain datasets about clinical information and patient gene expression based on studies, sequencing files associated with HCC were retrieved from TCGA databases. For the TCGA dataset, gene expression files were studied in 32 NAD+-associated protein-coding genes. Our bioinformatics-based study explored the key regulators of NAD+ biosynthesis, which could predict the prognosis of HCC patients. This study aims at providing new strategies and thoughts toward the treatment of HCC.

2. Results

2.1. NAD+-Associated Differentially Expressed Genes (DEGs)

To explore NAD+-associated genes, expression files of 32 NAD+-associated protein-coding genes in the TCGA dataset (tumor, n = 374; normal, n = 50) were extracted and analyzed. We found that 25 genes exhibited differential expression between tumor and normal tissues, including NTE5, QPRT, ACMSD, BST1, NADSYN1, NAMPT, NAPRT, NMNAT1, CD38, NMNAT2, NMNAT3, PARP1, PARP10, PARP12, PARP14, PARP15, PARP16, PARP2, PARP3, PARP4, SARM1, SIRT2, SIRT4, SIRT6, and SIRT7 (Figure 2A). We also found that these DEGs showed abundant correlation networks and protein–protein interaction (PPI) regulatory networks (Figure 2B,C). In addition, gene ontology (GO) enrichment analysis revealed that these 25 DEGs were mainly involved in NAD+ biosynthesis and metabolism (Figure 2D).

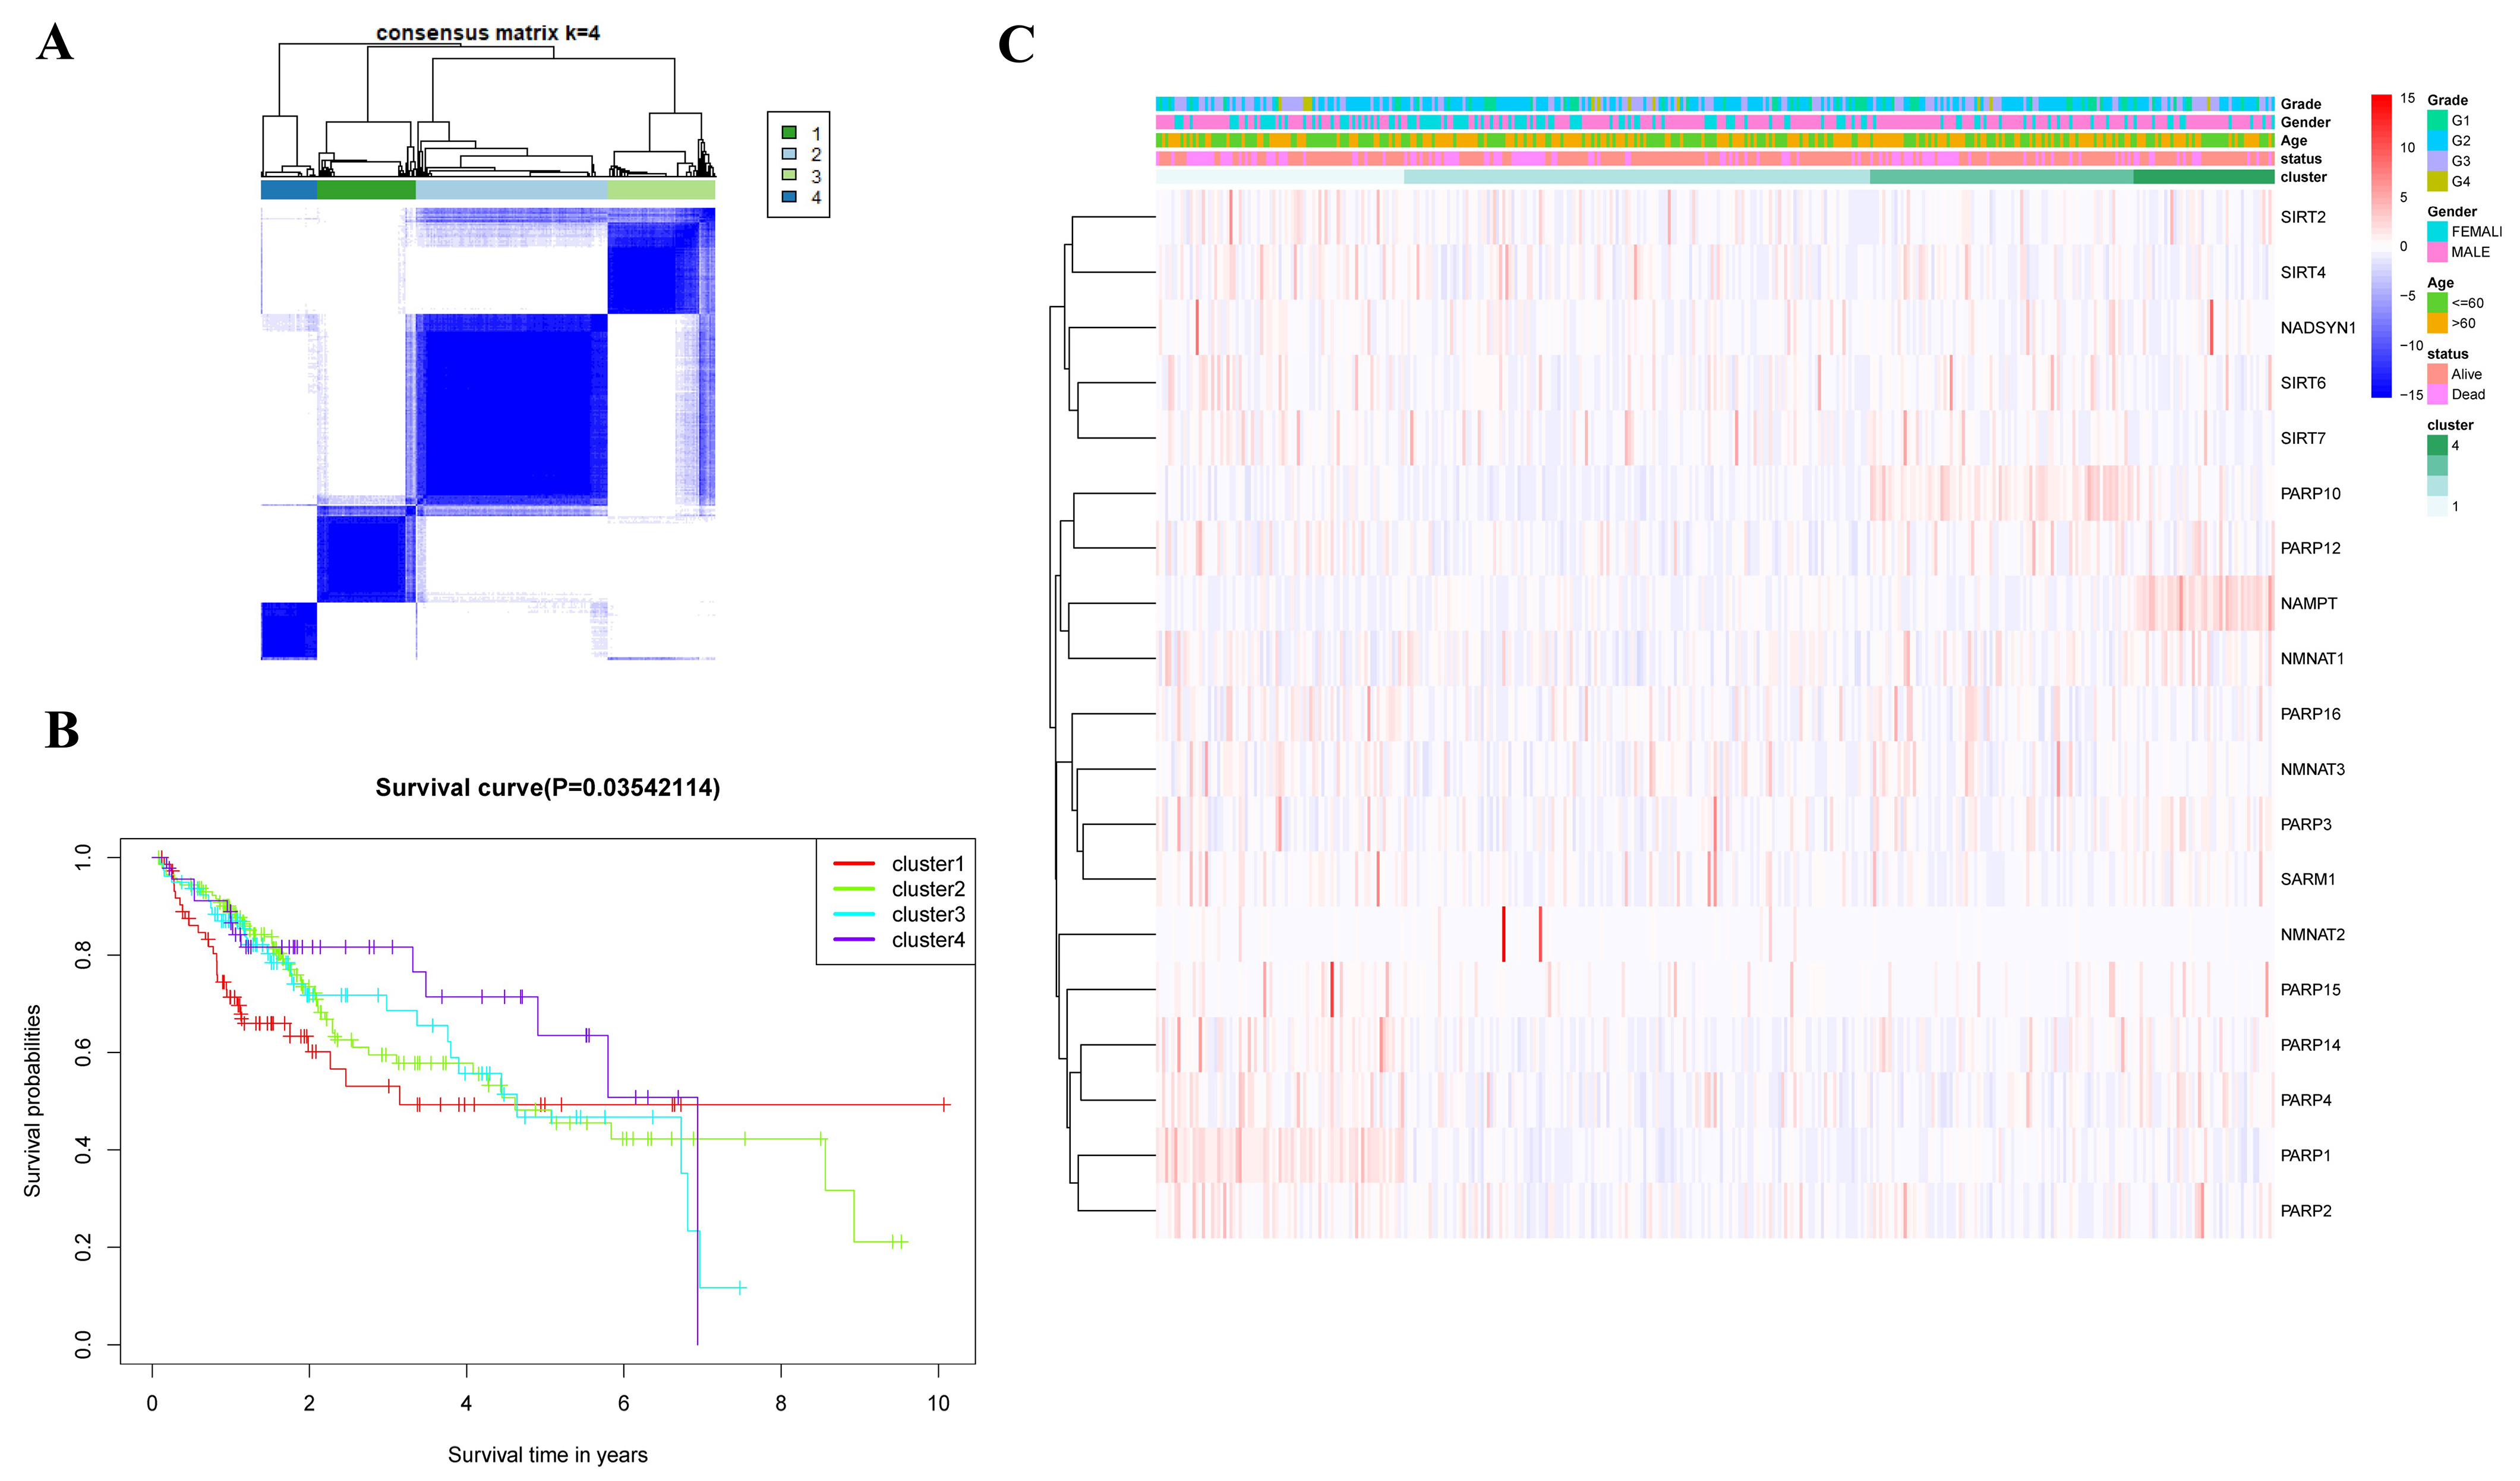
2.2. Consensus Clustering Analysis

Next, we performed consensus clustering analysis in 374 HCC patients from the TCGA database, from clusters (K) from 2 to 9. When K = 4, the intergroup correlation was weak, while the intragroup correlation was strong (Figure 3A). A significant difference was demonstrated across the four clusters in terms of the survival rate as analyzed by the Kaplan–Meier (KM) method (Figure 3B). In contrast, our assay did show significant differences regarding tumor grade, patient age, and gender (Figure 3C).

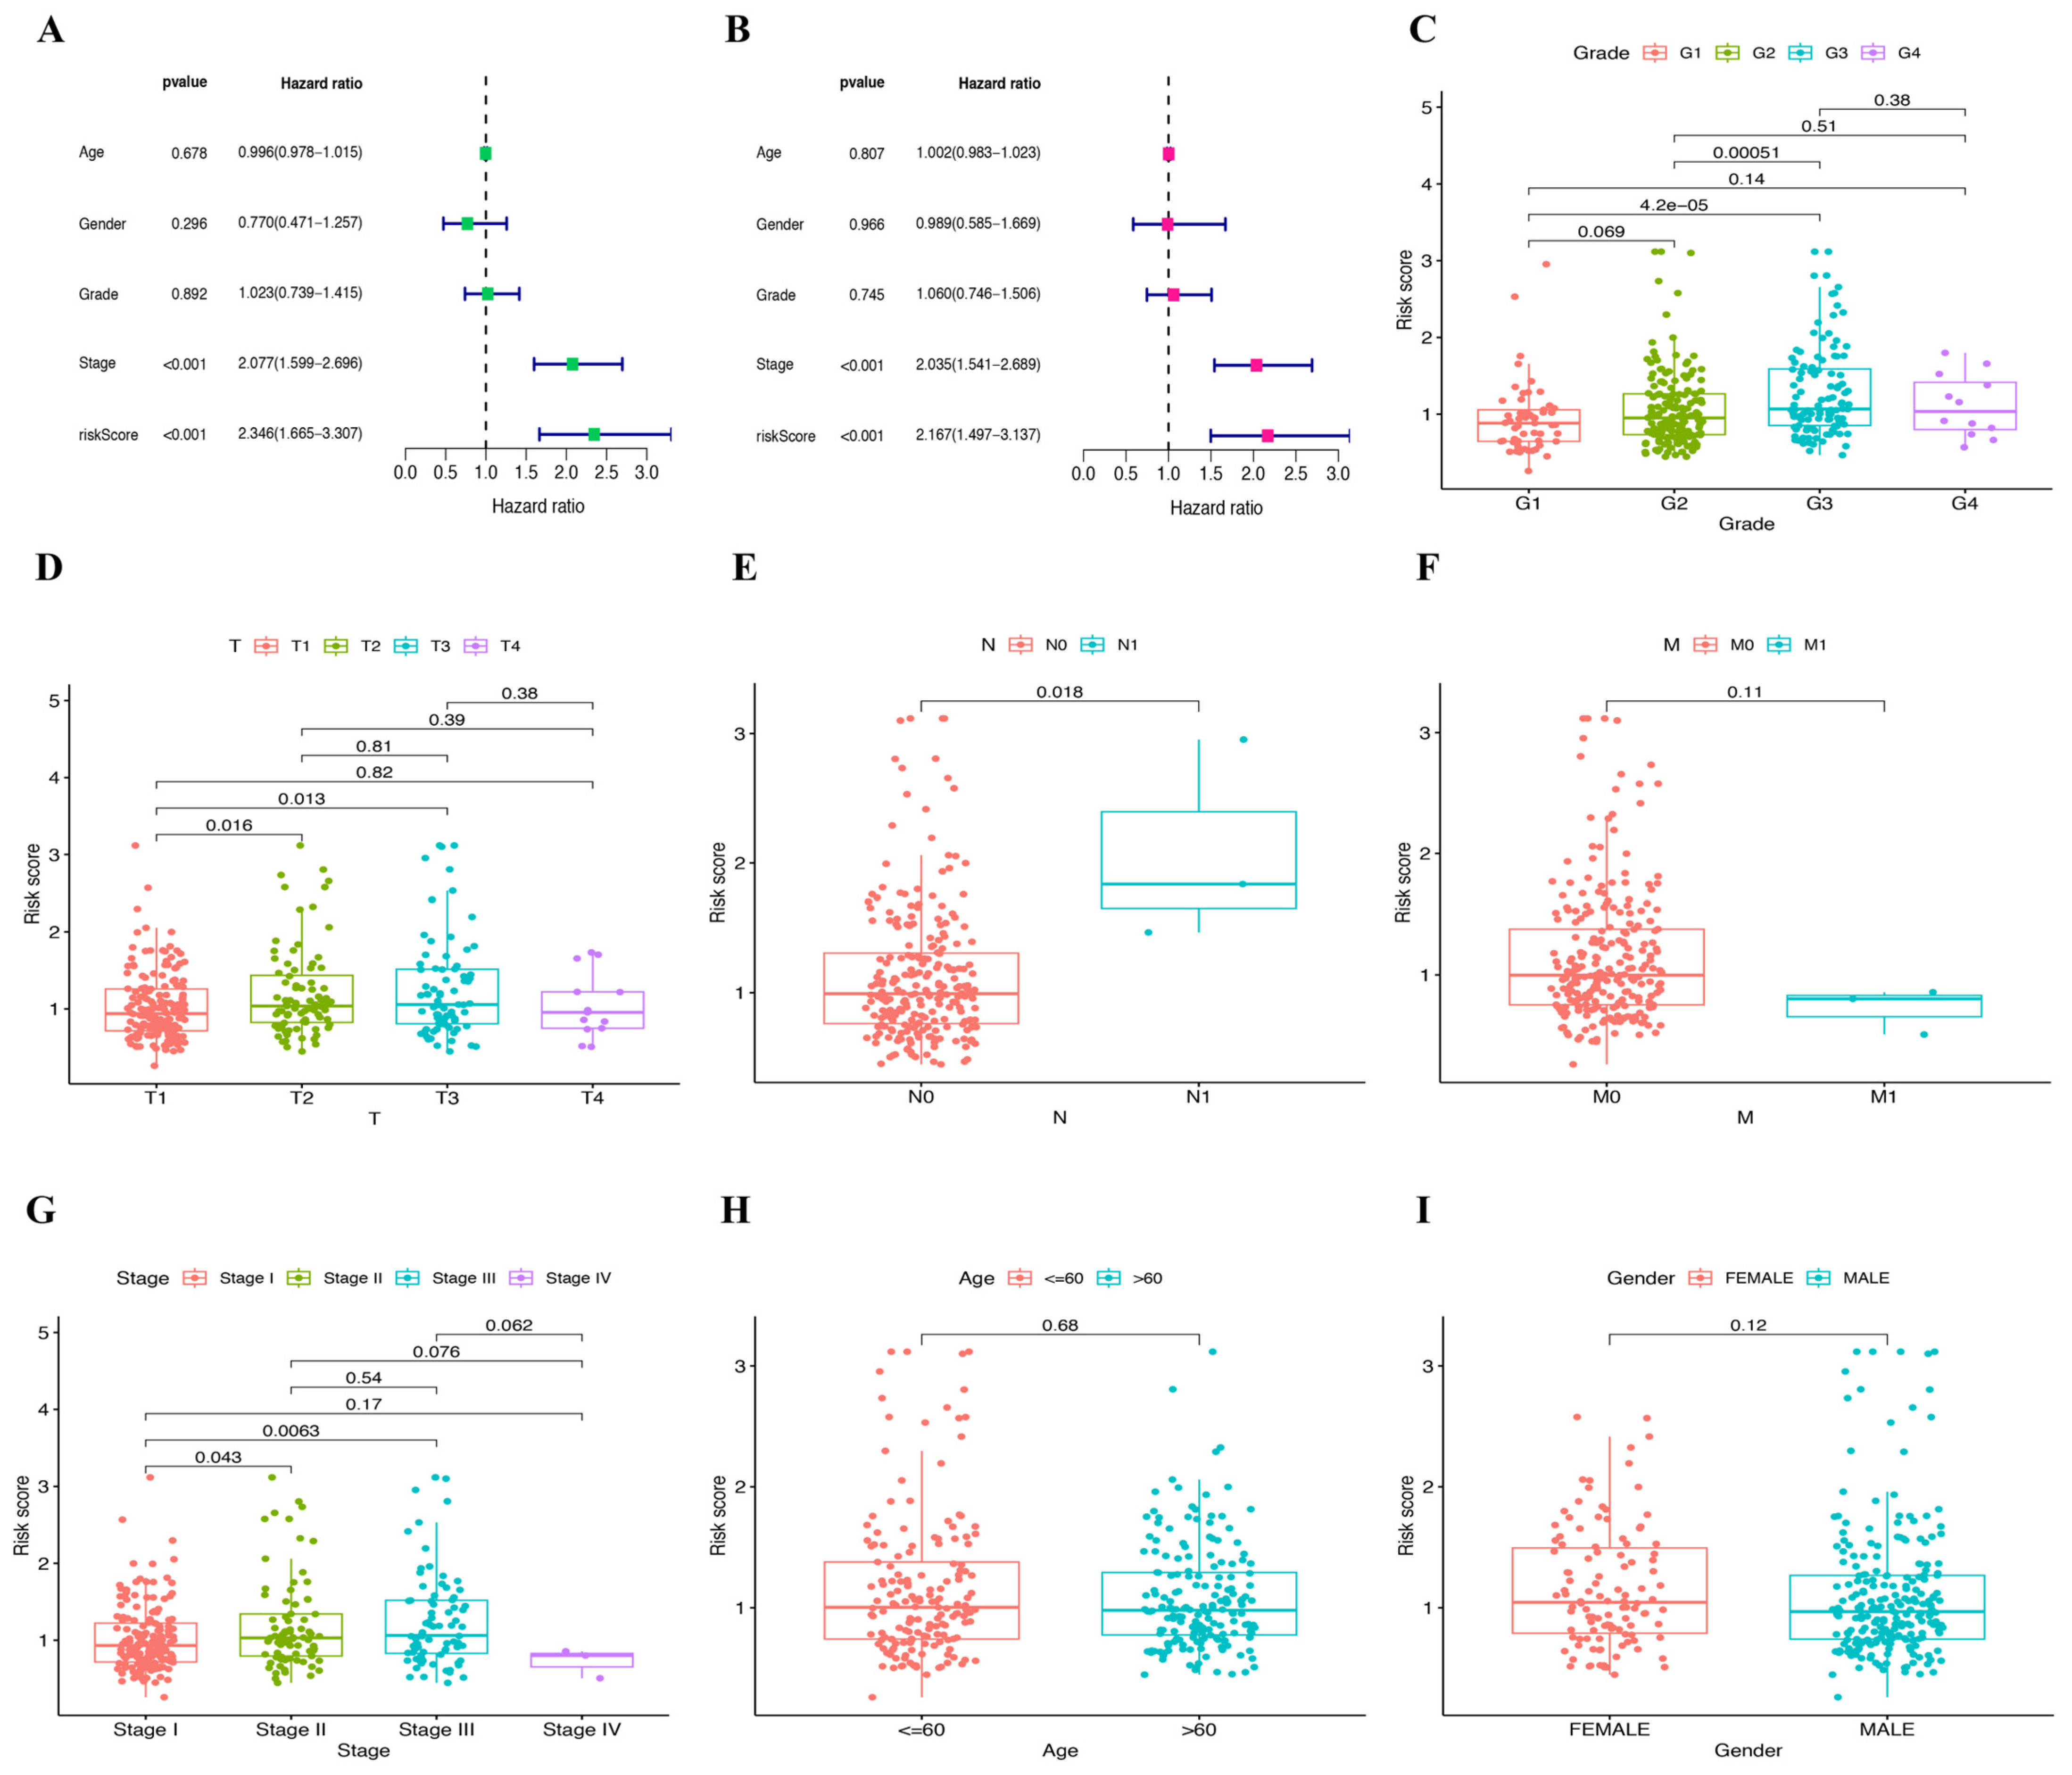
2.3. Establishment and Validation of Prognostic Model

Next, uni-variate Cox regression analysis was performed, and four DEGs were identified to be prognostic for the survival (p < 0.05) of HCC patients, including PARP2, SIRT6, SIRT7, and NADSYN1 (Figure 4A). In addition, Lasso-Cox regression was performed to combine the above genes (Figure 4B,C). A heat map of PARP2 and SIRT6 indicated that these two genes exhibited high risk scores and were further used to establish a prognostic model (Figure 4D). A risk score was correspondingly generated and divided TCGA cancer patients into high- and low-risk groups based on the median risk value (Figure 4E,F). Survival analysis revealed that the patients of the high-risk group survived for a shorter amount of time and were more prone to death than the patients of the low-risk group (Figure 4G), suggesting that higher risk scores were indicative of shorter survival times. Furthermore, principal component analysis (PCA) was performed and proved that the two groups of patients were well distinguished (Figure 4H). To further examine the relationship between risk score and immune cell infiltration, we performed ssGSEA analysis, and the data revealed the characteristics of high-risk and low-risk groups, and 23 immune cell types indicated that the risk score was correlated with immune response. In comparison to the high-risk group, a marked increase in the activation of B cells, CD8 T cells, and dendritic cells was observed in the low-risk group (Figure 4I). Based on the GSEA analysis of GO, Kyoto Encyclopedia of Genes and Genomes (KEGG), we found that compared to the low-risk group, at least five KEGG pathways were significantly enriched in the high-risk group, which include the cell cycle, DNA replication, ECM receptor interaction, Homologous recombination, and Neuroactive ligand receptor interaction (Figure 5A,C). The GSEA analysis of GO also showed that pathways such as Cell division, Immunoglobulin production, Organelle fission, Immunoglobulin complex, and circulating Immunoglobulin complex were enriched in the high-risk group but not in the low-risk group (Figure 5B,D). Moreover, uni-variate Cox regression analysis showed that the risk score was prognostic for poor survival in patients from TCGA (HR = 2.346, p < 0.001) (Figure 6A). Multi-variate Cox regression analysis demonstrated that the risk score was an independent risk factor for the survival outcome of patients from TCGA (HR = 2.167, p < 0.001) (Figure 6B). Finally, related graphs were generated to show the correlation between the risk score and clinical features of patients from TCGA-HCC (Figure 6C–I).

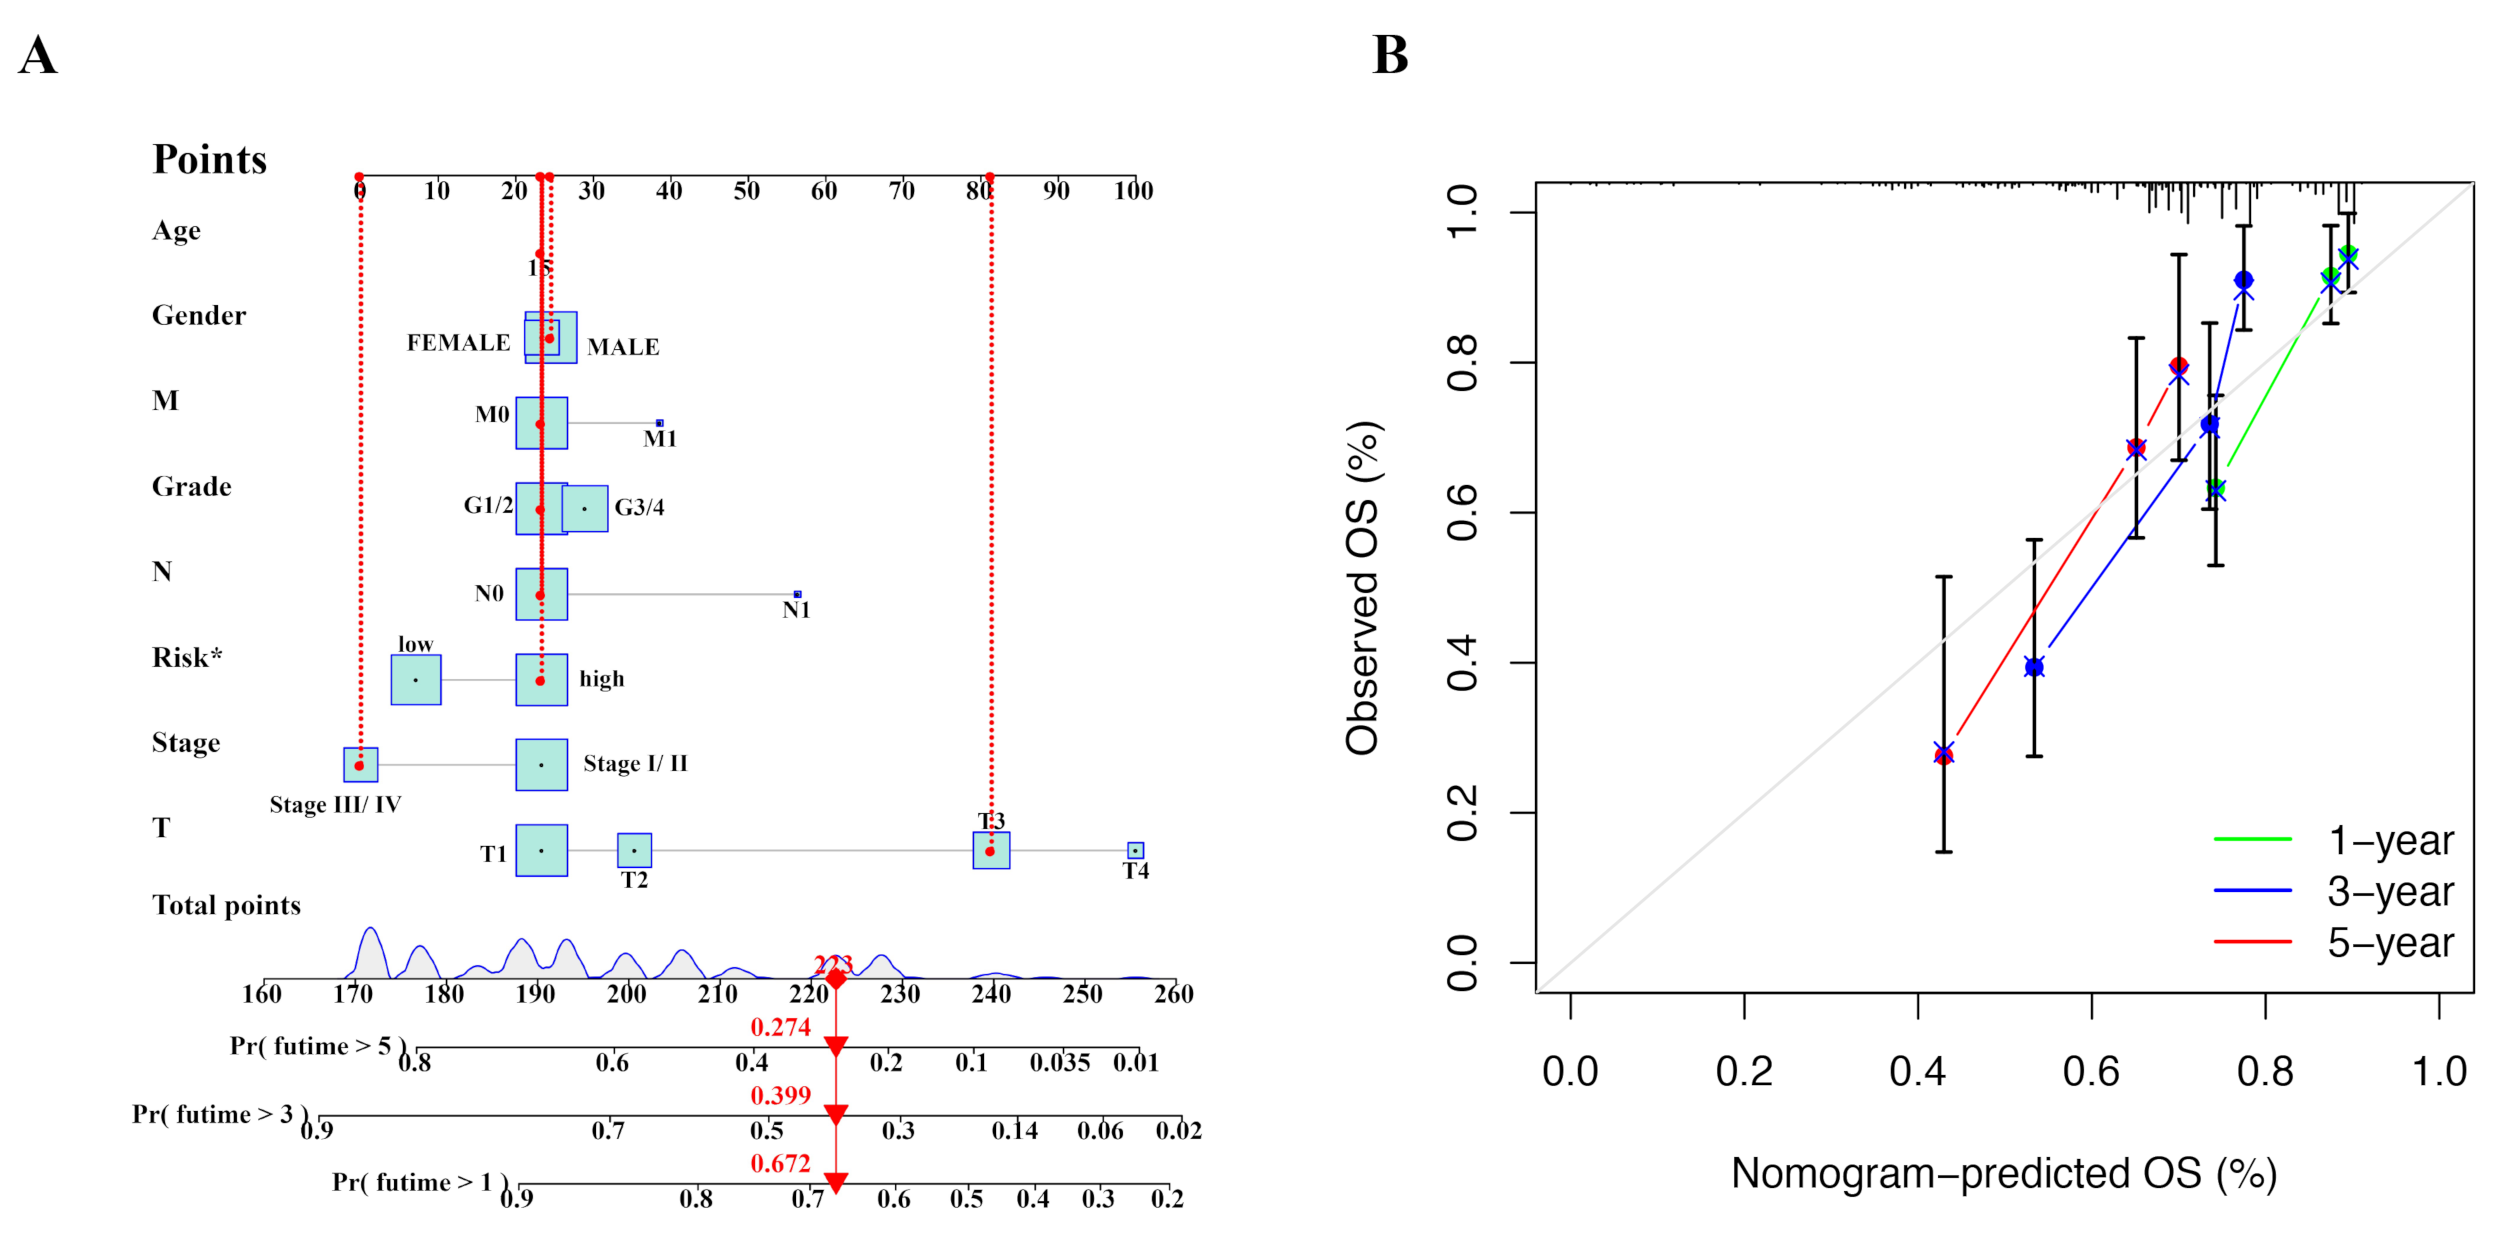
2.4. Nomogram Was Constructed to Predict Prognosis of HCC Patients

The nomogram was constructed to predict the 1-, 3-, and 5-year prognosis of HCC patients using data from TCGA (Figure 7A). The diagonal line at 45 degrees signifies an ideal predictive model, and the calibration plot obtained suggests that the nomogram performed effectively (Figure 7B).

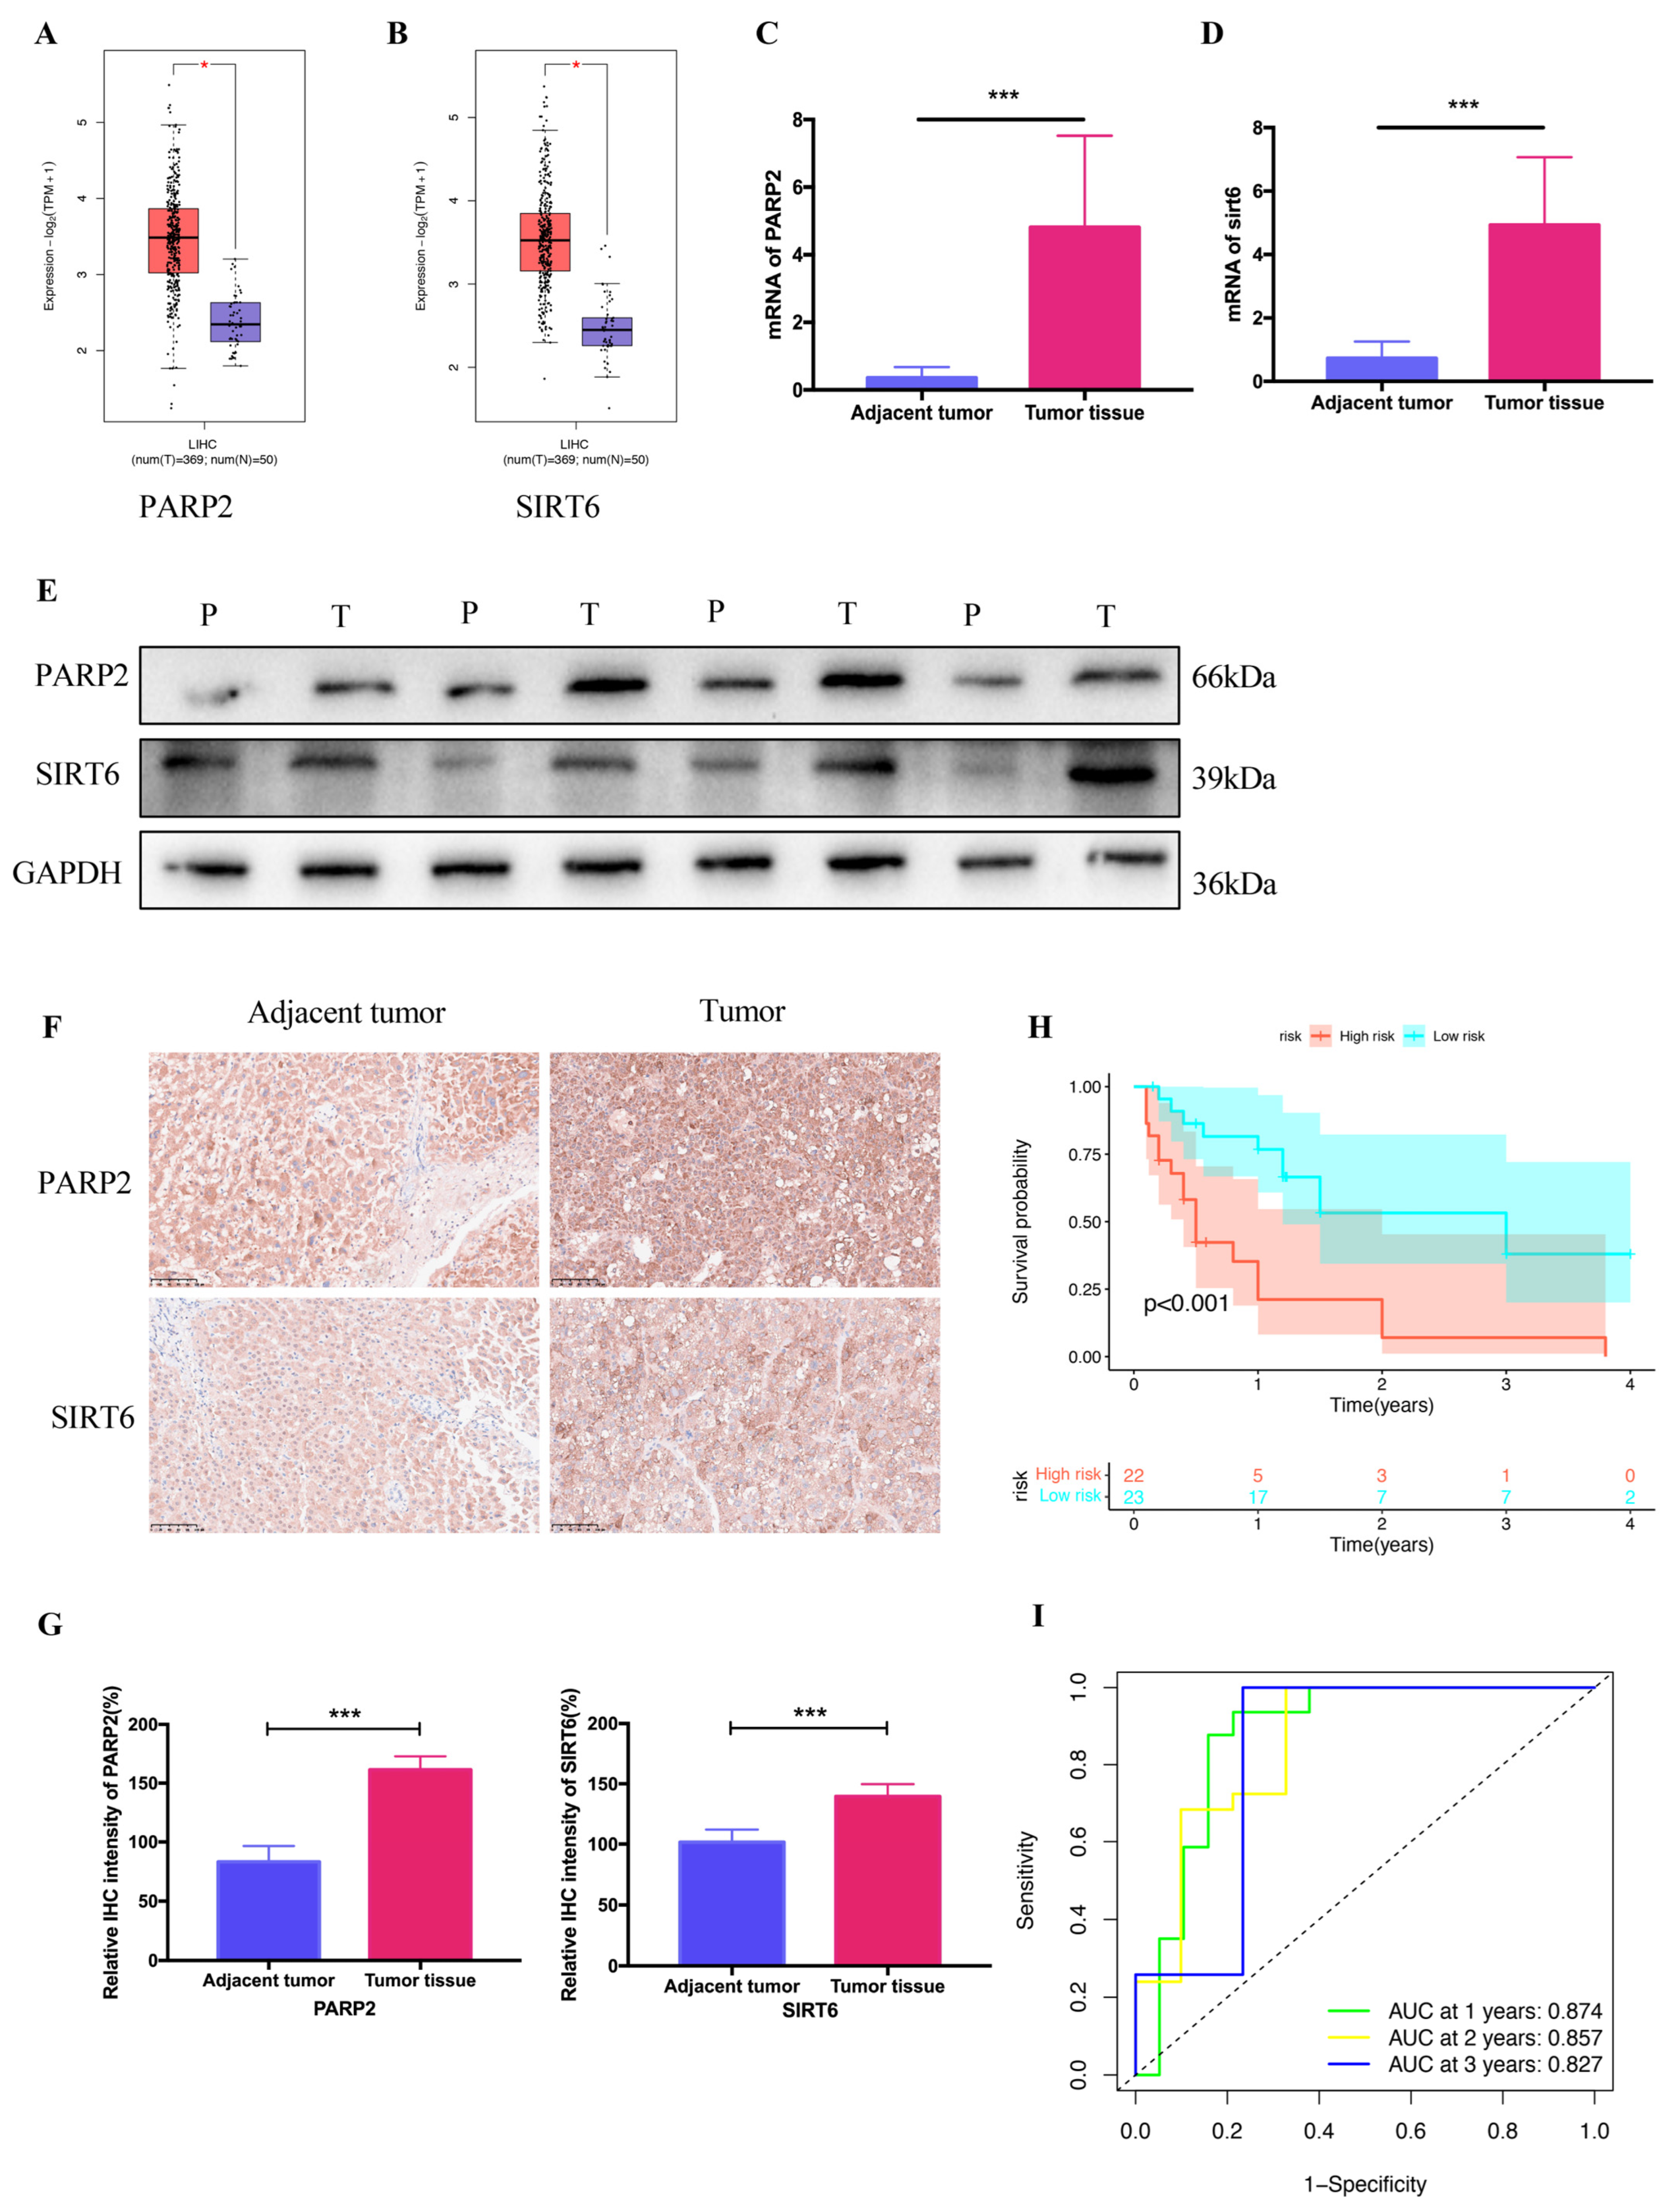
2.5. Verification of Clinical Tissue Samples

Based on Gene Expression Profiling Interactive Analysis 2.0 (GEPIA2.0), PARP2 and SIRT6 were significantly upregulated in HCC tissues compared to those in non-tumor tissues (Figure 8A,B). Consistent with the results in GEPIA2.0, the mRNA expression of PARP2 and SIRT6 was significantly increased in HCC tissues compared to that in non-tumor tissues (Figure 8C,D). In addition, the protein levels of PARP2 and SIRT6 were also increased in HCC tissues (Figure 8E–G). An analysis of survival showed that the duration of life for those in the high-risk group was shorter than for those in the low-risk group (Figure 8H). The AUC values of the 1-, 2-, and 3-year ROC curves at 0.874, 0.857, and 0.827, respectively, indicate the model’s potential to be a prognostic agent (Figure 8I).

3. Discussion

Biochemically, NAD+ is known to be associated with tumorigenesis. However, the mechanism by which NAD+ regulates HCC remains unclear. In this study, we found that among the 32 NAD+-associated genes retrieved from GSEA, 25 genes show differential expression in tumor and normal tissues based on the data from TCGA. Consensus clustering analysis divided TCGA patients into four clusters with distinct differences in the survival rate. We also identified that two NAD+-associated genes, PARP2 and SIRT6, are significantly prognostic for the survival (p < 0.05) of HCC patients via uni-variate and LASSO-Cox regression analyses. In HCC tissues, the mRNA and protein levels of PARP2 and SIRT6 were significantly higher than those of non-tumor tissues (p < 0.001). Thus, a prognostic model was established, as well as a nomogram combining the risk score, patient age, gender, and tumor grade, both of which merit reliability in clinical prognosis.
NAD+ biosynthesis is achieved mainly via the de novo synthesis pathway and salvage pathway [11]. With the collaboration of NAD+-consuming enzymes, such as sirtuins, PARPs, CD38, and CD157, NAD+ can be catalyzed into NaM and ADP-Ribose. In recent years, tumor research has become a major area of focus due to the abnormal production and utilization of NAD+. Recent studies reported that NAD+ has dual effects on tumorigenesis. Low levels of NAD+ trigger the reactive oxygen species (ROS)-dependent degradation of 15-hydroxyprostaglandin dehydrogenase, an identified tumor suppressor enzyme, thereby advancing the cellular epithelial–mesenchymal transition (EMT), which is considered the driver of tumor initiation and metastasis [12]. On the other hand, high levels of NAD+ potentiate glycolysis to increase cancer cell proliferation and improve survival, demonstrating its potential role in tumorigenesis as a risk factor [13]. Primary HCC is a common tumor worldwide and a common cause of cancer death [14]. Solute carrier family 25 member 20 (SLC25A51) is a mammalian mitochondrial NAD+ transporter. Research showed that glucose metabolism reprogramming including oxidative phosphorylation and glycolysis contribute to growth and metastasis by SLC25A51 in HCC cells [15]. Mitochondrial Ca2+ uniporter (MCU) may impede the NAD+/SIRT3/SOD2 pathway, thereby stimulating ROS production in HCC cells [16]. It is difficult to cure primary HCC due to difficulties in early diagnosis and treatment. Therefore, developing a novel prognostic model is conducive to formulating an individualized and precise treatment strategy.
PARP2 is a member of the poly (ADP-Ribose) polymerase family that was first discovered in embryonic fibroblasts of PARP1-deficient mice [17]. It has promotive effects on gastric cancer cell migration and spread, which can be reversed by upstream miR-128 [18]. The lncPTTG3P/miR-383/PARP2 axis was reported to play a part in cancer cell invasion and migration in HCC [19]. PARPi alone, including PARP1 and PARP2, or combined with radiotherapy contributed to HCC treatment, particularly for HBV-associated HCC [20]. Studies suggested that PARP2 is a proto-oncogene under the regulation of multiple upstream non-coding RNAs. Nuclear members of the sirtuin family of NAD+-dependent deacetylases, sirtuin 6/7 (SIRT6/7), are known as sirtuin 6/7. In the heterochromatin region, SIRT6 is found to possess deacetylase and ADP-ribosyl transferase activities. The role of SIRT6 in tumorigenesis and development remains controversial, although it can act as an oncogene in breast cancer [21,22], prostate cancer [23,24], HCC [25], and diffuse large B-cell lymphoma by inducing cancer cell proliferation, metastasis, and chemoresistance [26]. In contrast, SIRT6 can suppress aerobic glycolysis in tumor cells to inhibit cell growth and the cancerization of embryonic fibroblasts [27]. By means of the JAK2/STAT3 signaling pathway, SIRT6 can inhibit tumor cell growth by inducing apoptosis and diminishing oxidative stress [28,29,30]. Some studies point to the complexity of SIRT6’s biological role in tumorigenesis. Here, we found that SIRT6 being differentially expressed in HCC tissues suggests that it might be associated with a poor prognosis in HCC patients.
Nevertheless, there are still some limitations. For example, the quality and quantity of publicly available samples may affect the authenticity of this study, and the expression of the model genes requires to be further validated by experiments. In the present, there exist a variety of traditional treatments, including radiofrequency ablation, transcatheter arterial chemoembolization, selective internal radiation therapy, etc. Therefore, the prognostic model in this study only provides a new idea for clinical treatment. If it needs to be applied in clinical treatment, a larger number of clinical samples need to be included for verification. Additionally, the results are not compared to established predictors, which is something we need to improve in future work.

4. Materials and Methods

4.1. Tissue Samples

This study was approved by the Clinical Research Ethics Committee of the First Affiliated Hospital of Guangxi Medical University. This study used surgically removed HCC tissue (n = 32) and matched adjacent tumor tissue (n = 32) that were stored in liquid nitrogen or fixed in 10% formalin solution, which were then dehydrated and embedded in paraffin for preservation.

4.2. Data Sources

Sequencing data of HCC and paired clinical data were retrieved from TCGA “https://www.cancer.gov/tcga (accessed on 28 May 2024)”. All data are publicly available, and there are no competing interests or copyright issues.

4.3. Screening of DEGs Associated with NAD+

NAD+-associated genes were retrieved by GSEA. The package “limma” was used to screen out the DEGs between cancer tissues and normal tissues from TCGA, and the package “igraph” was adopted to visualize associations between the DEGs in a heat map. The GeneMANIA online tool was applied to construct a PPI network [31]. The GO plot package was utilized to look for significant GO entries of the DEGs.

4.4. Establishment and Validation of Prognostic Model

A uni-variate Cox regression model was built to look for prognostic genes for survival in TCGA patients using the R package “survival” (p < 0.2). A LASSO-Cox regression model was adopted to establish a prognostic model based on the genes. A model-based risk score was correspondingly generated. Grouping each patient in TCGA into high- and low-risk groups was conducted by scoring them on the median value. The two groups’ KM curves were plotted. The ssGSEA method was applied to the TCGA-HCC samples to evaluate the distribution of 23 immune cell types. A correlation between the risk score and clinical characteristics, including patient age, gender, and tumor grade, was visualized by column charts. Uni- and multi-variate Cox regression models were constructed to assess whether the risk score is an independent risk factor for the prognosis of HCC patients. A nomogram was plotted using the package “rms”, while the calibration and ROC curves were used to determine the dependability of the nomogram.

4.5. Immunohistochemistry (IHC)

After two hours in an oven at 60 °C, the sections fixed with paraffin were dewaxed in xylene for 10 min. Different concentrations of alcohol (100%, 95%, 80%, 75%, 50%) were used for hydration treatment, and the sections were placed in a pressure cooker for 15 min following EDTA antigen repair solution (C1038, Solarbio, Beijing, China). Endogenous catalase was removed and washed with PBS for 5 min 3 times, following the incubation with primary antibodies (PARP2, Proteintech, Chicago, IL, USA, 1:200; SIRT6, Proteintech, Chicago, IL, USA, 1:200) overnight in a wet box at 4 °C. On the second day, the slides were incubated with secondary antibody for 45 min at 37 °C, following DAB (ZLI-9018, Zsbio, Beijing, China) staining and nucleus counterstaining with hematoxylin (C0107, Beyotime, Shanghai, China).

4.6. Reverse Transcription Quantitative Polymerase Chain Reaction (RT-qPCR)

Total RNA was isolated from HCC and paracancer tissues for cDNA generation. Real-time PCR was then performed (PARP2: forward primer: TAC ACC AGG ATT CCG CAT GAC, reverse primer: TGG GTG TTC TGG GCT TTG TAG; SIRT6: forward primer: ATG TGC CAA GTG TAA GAC GCA, reverse primer: CTT GCC TTA GCC ACG GTG C). All procedures were carried out in accordance with the manufacturer’s instructions. The amplified thermal cycle parameters were as follows: 95 °C for 3 min, followed by 39 cycles of 95 °C for 10 s, 60 °C for 30 s, then 95 °C for 5 s, melt curve 65 °C to 95 °C, and increment 0.5 °C.

4.7. Western Blotting

Proteins from liver cancer tissues and paracancer tissues were collected in protein lysate buffer and subjected to Western blot assay with antibodies against PARP2 (Proteintech, Chicago, IL, USA, 1:2000) and SIRT6 (Proteintech, Chicago, IL, USA, 1:2000). The imprinting was visualized with ECL detection (SQ201, YAMEI, Shanghai, China), and an imaging system (SYNGENE, San Diego, CA, USA) was used to capture the chemiluminescence signal.

5. Conclusions

In conclusion, this is the first study that generates a prognostic model for HCC based on the genes associated with NAD+ synthesis and metabolism. The model contains two NAD+-related genes and shows potential prognostic capability in HCC. Thus, this study enriches the molecular mechanisms involved in the regulation of HCC and provides potential diagnostic biomarkers for HCC. Nevertheless, future studies regarding the biological functions of NAD+-related genes in HCC cells are needed, despite the limitation in the authenticity of the quality and quantity of publicly available samples.

Author Contributions

L.D. and S.L. conducted the formal analysis and wrote the initial draft of the manuscript, with project administration being handled by G.Y. and S.H. L.D., S.L. and L.M. then executed software analysis. Data curation was conducted by L.D., M.Z. and G.F., while experiment execution was carried out by L.D., M.Z. and G.F. S.H. and G.Y. both contributed to the composition of this article. Funding was procured from G.Y. and S.H. All authors have read and agreed to the published version of the manuscript.

Funding

This work was supported in part by the National Natural Science Foundation of China (82160500); Natural Science Foundation of Guangxi (2022GXNSFAA035642); The 111 Project (D17011); Advanced Innovation Teams and Xinghu Scholars Program of Guangxi Medical University.

Institutional Review Board Statement

This study was conducted in accordance with the Declaration of Helsinki and approved by the First Affiliated Hospital of Guangxi Medical University (2024-E465-01).

Informed Consent Statement

Informed consent was obtained from all subjects involved in this study.

Data Availability Statement

The data presented in this study are available on request from the corresponding author.

Acknowledgments

We are grateful to all patients and their families who support our research from the First Affiliated Hospital of Guangxi Medical University. We thank Yanhong Zhang from Comparative Oncology Laboratory, Schools of Veterinary Medicine and Medicine, University of California at Davis, for her critical intellectual revision.

Conflicts of Interest

The authors declare no conflicts of interest in relation to this research, indicating that this study was conducted without any commercial or financial relationships that could be perceived as potential conflicts of interest.

Abbreviations

DEGsDifferentially expressed genes
EMTEpithelial–mesenchymal transition
GEPIA2.0Gene expression profiling interactive analysis 2.0
GOGene ontology
HCCHepatocellular carcinoma
IHCImmunohistochemistry
KEGGKyoto encyclopedia of genes and genomes
KMKaplan–Meier
MCUMitochondrial Ca2+ uniporter
NADNicotinamide adenine dinucleotide
NAMPTNicotinamide phosphoribosyltransferase
PARP2Poly (ADP-Ribose) polymerase 2
PCAPrincipal component analysis
PPIProtein–protein interaction
ROSReactive oxygen species
RT-qPCRReverse transcription quantitative polymerase chain reaction
SIRT6 Sirtuin 6
SIRT6/7Sirtuin 6/7
SLC25A51Solute carrier family 25 member 20
TCGAThe cancer genome atlas

References

  1. Sung, H.; Ferlay, J.; Siegel, R.L.; Laversanne, M.; Soerjomataram, I.; Jemal, A.; Bray, F. Global cancer statistics 2020: GLOBOCAN estimates of incidence and mortality worldwide for 36 Cancers in 185 countries. CA A Cancer J. Clin. 2021, 71, 209–249. [Google Scholar] [CrossRef] [PubMed]
  2. Vogel, A.; Meyer, T.; Sapisochin, G.; Salem, R.; Saborowski, A. Hepatocellular Carcinoma. Lancet 2022, 400, 1345–1362. [Google Scholar] [CrossRef] [PubMed]
  3. Abdellatif, M.; Sedej, S.; Kroemer, G. NAD(+) Metabolism in Cardiac Health, Aging, and Disease. Circulation 2021, 144, 1795–1817. [Google Scholar] [CrossRef] [PubMed]
  4. Katsyuba, E.; Romani, M.; Hofer, D.; Auwerx, J. NAD+ homeostasis in health and disease. Nat. Metab. 2020, 2, 9–31. [Google Scholar] [CrossRef]
  5. Chmielewski, J.P.; Bowlby, S.C.; Wheeler, F.B.; Shi, L.; Sui, G.; Davis, A.L.; Howard, T.D.; D’Agostino, R.B., Jr.; Miller, L.D.; Sirintrapun, S.J.; et al. CD38 Inhibits Prostate Cancer Metabolism and Proliferation by Reducing Cellular NAD(+) Pools. Mol. Cancer Res. 2018, 16, 1687–1700. [Google Scholar] [CrossRef]
  6. Xie, N.; Zhang, L.; Gao, W.; Huang, C.; Huber, P.E.; Zhou, X.; Li, C.; Shen, G.; Zou, B. NAD(+) metabolism: Pathophysiologic mechanisms and therapeutic potential. Signal Transduct. Target. Ther. 2020, 5, 227. [Google Scholar] [CrossRef]
  7. Guo, L.; Wu, Q.; Ma, Z.; Yuan, M.; Zhao, S. Identification of immune-related genes that predict prognosis and risk of bladder cancer-bioinformatics analysis of TCGA database. Aging 2021, 13, 19352–19374. [Google Scholar] [CrossRef]
  8. Quan, Q.; Xiong, X.; Wu, S.; Yu, M. Identification of Autophagy-Related Prognostic Signature and Analysis of Immune Cell Infiltration in Low-Grade Gliomas. Biomed. Res. Int. 2021, 2021, 7918693. [Google Scholar] [CrossRef]
  9. Lucena-Cacace, A.; Otero-Albiol, D.; Jimenez-Garcia, M.P.; Peinado-Serrano, J.; Carnero, A. NAMPT overexpression induces cancer stemness and defines a novel tumor signature for glioma prognosis. Oncotarget 2017, 8, 99514–99530. [Google Scholar] [CrossRef]
  10. Zhang, B.; Shi, D.; Zhang, X.; Liang, G.; Liu, W.; Qiao, S. FK866 inhibits the epithelial-mesenchymal transition of hepatocarcinoma MHCC97-H cells. Oncol. Lett. 2018, 16, 7231–7238. [Google Scholar] [CrossRef]
  11. Yaku, K.; Okabe, K.; Nakagawa, T. NAD metabolism: Implications in aging and longevity. Ageing Res. Rev. 2018, 47, 1–17. [Google Scholar] [CrossRef] [PubMed]
  12. Wang, W.; Hu, Y.; Wang, X.; Wang, Q.; Deng, H. ROS-Mediated 15-Hydroxyprostaglandin Dehydrogenase Degradation via Cysteine Oxidation Promotes NAD+-Mediated Epithelial-Mesenchymal Transition. Cell Chem. Biol. 2018, 25, 255–261.e254. [Google Scholar] [CrossRef] [PubMed]
  13. Amjad, S.; Nisar, S.; Bhat, A.A.; Shah, A.R.; Frenneaux, M.P.; Fakhro, K.; Haris, M.; Reddy, R.; Patay, Z.; Baur, J.; et al. Role of NAD(+) in regulating cellular and metabolic signaling pathways. Mol. Metab. 2021, 49, 101195. [Google Scholar] [CrossRef] [PubMed]
  14. McGlynn, K.A.; Petrick, J.L.; El-Serag, H.B. Epidemiology of Hepatocellular Carcinoma. Hepatology 2021, 73 (Suppl. 1), 4–13. [Google Scholar] [CrossRef] [PubMed]
  15. Bai, L.; Yang, Z.-X.; Ma, P.-F.; Liu, J.-S.; Wang, D.-S.; Yu, H.-C. Overexpression of SLC25A51 promotes hepatocellular carcinoma progression by driving aerobic glycolysis through activation of SIRT5. Free Radic. Biol. Med. 2022, 182, 11–22. [Google Scholar] [CrossRef]
  16. Ren, T.; Zhang, H.; Wang, J.; Zhu, J.; Jin, M.; Wu, Y.; Guo, X.; Ji, L.; Huang, Q.; Zhang, H.; et al. MCU-dependent mitochondrial Ca2+ inhibits NAD+/SIRT3/SOD2 pathway to promote ROS production and metastasis of HCC cells. Oncogene 2017, 36, 5897–5909. [Google Scholar] [CrossRef]
  17. Chen, Q.; Kassab, M.A.; Dantzer, F.; Yu, X. PARP2 mediates branched poly ADP-ribosylation in response to DNA damage. Nat. Commun. 2018, 9, 3233. [Google Scholar] [CrossRef]
  18. Zuo, H.; Yang, D.; Yang, Q.; Tang, H.; Fu, Y.X.; Wan, Y. Differential regulation of breast cancer bone metastasis by PARP1 and PARP2. Nat. Commun. 2020, 11, 1578. [Google Scholar] [CrossRef]
  19. Zhou, Q.; Zhang, W.; Wang, Z.; Liu, S. Long non-coding RNA PTTG3P functions as an oncogene by sponging miR-383 and up-regulating CCND1 and PARP2 in hepatocellular carcinoma. BMC Cancer 2019, 19, 731. [Google Scholar] [CrossRef]
  20. Gerossier, L.; Dubois, A.; Paturel, A.; Fares, N.; Cohen, D.; Merle, P.; Lachuer, J.; Wierinckx, A.; Saintigny, P.; Bancel, B.; et al. PARP inhibitors and radiation potentiate liver cell death in vitro. Do hepatocellular carcinomas have an achilles’ heel? Clin. Res. Hepatol. Gastroenterol. 2021, 45, 101553. [Google Scholar] [CrossRef]
  21. Khongkow, M.; Olmos, Y.; Gong, C.; Gomes, A.R.; Monteiro, L.J.; Yagüe, E.; Cavaco, T.B.; Khongkow, P.; Man, E.P.S.; Laohasinnarong, S.; et al. SIRT6 modulates paclitaxel and epirubicin resistance and survival in breast cancer. Carcinogenesis 2013, 34, 1476–1486. [Google Scholar] [CrossRef] [PubMed]
  22. Andreani, C.; Bartolacci, C.; Persico, G.; Casciaro, F.; Amatori, S.; Fanelli, M.; Giorgio, M.; Galie, M.; Tomassoni, D.; Wang, J.; et al. SIRT6 promotes metastasis and relapse in HER2-positive breast cancer. Sci. Rep. 2023, 13, 22000. [Google Scholar] [CrossRef] [PubMed]
  23. Liu, Y.; Xie, Q.R.; Wang, B.; Shao, J.; Zhang, T.; Liu, T.; Huang, G.; Xia, W. Inhibition of SIRT6 in prostate cancer reduces cell viability and increases sensitivity to chemotherapeutics. Protein Cell 2013, 4, 702–710. [Google Scholar] [CrossRef] [PubMed]
  24. Han, Q.; Xie, Q.R.; Li, F.; Cheng, Y.; Wu, T.; Zhang, Y.; Lu, X.; Wong, A.S.T.; Sha, J.; Xia, W. Targeted inhibition of SIRT6 via engineered exosomes impairs tumorigenesis and metastasis in prostate cancer. Theranostics 2021, 11, 6526–6541. [Google Scholar] [CrossRef]
  25. Han, L.L.; Jia, L.; Wu, F.; Huang, C. Sirtuin6 (SIRT6) Promotes the EMT of Hepatocellular Carcinoma by Stimulating Autophagic Degradation of E-Cadherin. Mol. Cancer Res. 2019, 17, 2267–2280. [Google Scholar] [CrossRef]
  26. Yang, J.; Li, Y.; Zhang, Y.; Fang, X.; Chen, N.; Zhou, X.; Wang, X. Sirt6 promotes tumorigenesis and drug resistance of diffuse large B-cell lymphoma by mediating PI3K/Akt signaling. J. Exp. Clin. Cancer Res. 2020, 39, 142. [Google Scholar] [CrossRef]
  27. Sebastian, C.; Zwaans, B.M.; Silberman, D.M.; Gymrek, M.; Goren, A.; Zhong, L.; Ram, O.; Truelove, J.; Guimaraes, A.R.; Toiber, D.; et al. The histone deacetylase SIRT6 is a tumor suppressor that controls cancer metabolism. Cell 2012, 151, 1185–1199. [Google Scholar] [CrossRef]
  28. Zhou, J.; Wu, A.; Yu, X.; Zhu, J.; Dai, H. SIRT6 inhibits growth of gastric cancer by inhibiting JAK2/STAT3 pathway. Oncol. Rep. 2017, 38, 1059–1066. [Google Scholar] [CrossRef]
  29. Li, N.; Mao, D.; Cao, Y.; Li, H.; Ren, F.; Li, K. Downregulation of SIRT6 by miR-34c-5p is associated with poor prognosis and promotes colon cancer proliferation through inhibiting apoptosis via the JAK2/STAT3 signaling pathway. Int. J. Oncol. 2018, 52, 1515–1527. [Google Scholar] [CrossRef]
  30. Xiang, J.; Zhang, N.; Sun, H.; Su, L.; Zhang, C.; Xu, H.; Feng, J.; Wang, M.; Chen, J.; Liu, L.; et al. Disruption of SIRT7 Increases the Efficacy of Checkpoint Inhibitor via MEF2D Regulation of Programmed Cell Death 1 Ligand 1 in Hepatocellular Carcinoma Cells. Gastroenterology 2020, 158, 664–678.e24. [Google Scholar] [CrossRef]
  31. Franz, M.; Rodriguez, H.; Lopes, C.; Zuberi, K.; Montojo, J.; Bader, G.D.; Morris, Q. GeneMANIA update 2018. Nucleic Acids Res. 2018, 46, W60–W64. [Google Scholar] [CrossRef]
Figure 1. The structures of NAD+ and NADH.
Ijms 25 10362 g001
Figure 2. Expression of 32 NAD+-related genes in hepatocellular carcinoma and their correlation, as well as biological regulation of interacted proteins. (A) Heat map of expression difference in NAD+-related genes. (B) Heat map of correlation between DEGs. (C) PPI network map of DEGs. (D) DEGs involved in biological regulation of related proteins.
Ijms 25 10362 g002
Figure 3. The consensus clustering analysis of the NAD+ regulators. (A) The most appropriate selection with clustering stability when k = 4 was used. (B) The overall survival rates of different clusters were different. (C) Heat maps of the relationship between different clusters and clinicopathology.
Ijms 25 10362 g003
Figure 4. The risk model of the NAD+ regulatory factor was constructed based on TCGA hepatocellular carcinoma (HCC) data. (A) With p < 0.2 as the standard, 4 genes related to OS were screened by uni-variate regression analysis. (B) Target genes were screened as prognostic models by LASSO. (C) Cross-validation is intended to adjust parameter selection in LASSO regression. (D) A heat map of the relationship between the risk score and 2 genes. (E) HCC patient distribution based on the risk score. (F) HCC patient survival status (a dotted line is used to identify patients with high or low risk scores). (G) A Kaplan–Meier plot was used to compare OS between the high- and low-risk groups. (H) A PCA diagram based on the risk score. (I) The ssGSEA method was applied to the HCC samples to evaluate the distribution of 23 immune cell types. * p < 0.05,** p < 0.01, *** p < 0.001.
Ijms 25 10362 g004
Figure 5. GESA analysis based on GO and KEGG. (A) The top 5 most significantly enriched KEGG pathways in the high-risk group. (B) The top 5 most significantly enriched GO terms in the high-risk group. (C) The top 5 most significantly enriched KEGG pathways in the low-risk group. (D) The top 5 most significantly enriched GO terms in the low-risk group.
Ijms 25 10362 g005
Figure 6. Uni-variate and multi-variate regression analyses were used to assess the prognostic value of risk scores in TCGA. (A,B) Uni-variate and multi-variate regression analyses in TCGA. (CI) The correlation between the risk score and clinical features of patients from TCGA.
Ijms 25 10362 g006
Figure 7. Nomogram for evaluating prognosis. (A) Nomogram was applied to assess prognosis of HCC patients in TCGA. (B) Calibration curve for predicting 1-, 3-, and 5-year prognosis of HCC patients.
Ijms 25 10362 g007
Figure 8. Verification of clinical tissue samples. (A,B) Expression of PARP2 and SIRT6 in HCC tissues and non-tumor tissues analyzed by GEPIA2.0. (C,D) RT-qPCR analysis of PARP2 and SIRT6 in HCC and non-tumor tissues. (E) Protein level of PARP2 and SIRT6 in HCC and non-tumor tissues. (F) Characteristic pictures of PARP2 and SIRT6 in HCC and adjacent tumor. (G) Statistical diagram of F. (H) Survival analysis between patients in high-risk and low-risk group. (I) ROC curve was used to evaluate predictive effectiveness. All data are shown as mean ± standard deviation. *** p < 0.001.
Ijms 25 10362 g008
Disclaimer/Publisher’s Note: The statements, opinions and data contained in all publications are solely those of the individual author(s) and contributor(s) and not of MDPI and/or the editor(s). MDPI and/or the editor(s) disclaim responsibility for any injury to people or property resulting from any ideas, methods, instructions or products referred to in the content.

