Article

Genome-Wide Analysis Elucidates the Roles of AhLBD Genes in Different Abiotic Stresses and Growth and Development Stages in the Peanut (Arachis hypogea L.)

Institute of Cotton Research, Shanxi Agricultural University, Yuncheng 044000, China
*
Authors to whom correspondence should be addressed.
Int. J. Mol. Sci. 2024, 25(19), 10561; https://doi.org/10.3390/ijms251910561
Submission received: 13 July 2024 / Revised: 21 September 2024 / Accepted: 24 September 2024 / Published: 30 September 2024
(This article belongs to the Section Molecular Plant Sciences)

Abstract

:
The lateral organ boundaries domain (LBD) genes, as the plant-specific transcription factor family, play a crucial role in controlling plant architecture and stress tolerance. However, the functions of AhLBD genes in the peanut plant (Arachis hypogea L.) remain unclear. In this study, 73 AhLBDs were identified in the peanut plant and divided into three groups by phylogenetic tree analysis. Gene structure and conserved protein motif analysis supported the evolutionary conservation of AhLBDs. Tandem and segment duplications contributed to the expansion of AhLBDs. The evolutionary relationship analysis of LBD gene family between A. hypogaea and four other species indicated that the peanut plant had a close relationship with the soybean plant. AhLBDs played a very important role in response to growth and development as well as abiotic stress. Furthermore, gene expression profiling and real-time quantitative qRT-PCR analysis showed that AhLBD16, AhLBD33, AhLBD67, and AhLBD72 were candidate genes for salt stress, while AhLBD24, AhLBD33, AhLBD35, AhLBD52, AhLBD67, and AhLBD71 were candidate genes for drought stress. Our subcellular localization experiment revealed that AhLBD24, AhLBD33, AhLBD67, and AhLBD71 were located in the nucleus. Heterologous overexpression of AhLBD33 and AhLBD67 in Arabidopsis significantly enhanced tolerance to salt stress. Our results provide a theoretical basis and candidate genes for studying the molecular mechanism for abiotic stress in the peanut plant.

1. Introduction

The peanut plant (A. hypogaea L.) belongs to the genus peanut of the subfamily papilionidae of Leguminosae, which is an allotetraploid crop (2n = 4x = 40) [1,2]. Cultivated peanut is a major oilseed crop and a cash crop that is widely cultivated worldwide [3]. China is one of the largest peanut producers in the world, with a planting area of more than 4.6 million hm2 and a pod yield of more than 17 million tons, accounting for 40% of the total global output. This ranks China as the first in the world for peanut production [4]. As one of the main oil crops in China, peanut plays an increasingly prominent role in developing agricultural production and increasing the supply of agricultural products. According to statistics, the area of saline–alkali land, arid land, and semi-arid land in China exceeds 30 million hm2, accounting for a fourth of China’s cultivated land. However, less than 20% of the land has been reclaimed and utilized [5]. Therefore, improving the land utilization rate of saline–alkali land, arid land, and semi-arid land has positive effects on promoting agricultural development and ensuring the safety of important agricultural products in China. With the rapid development of contemporary biotechnology, high-throughput sequencing technology has become increasingly sophisticated and perfected. The complete genome sequencing of peanut diploid ancestors [6] and tetraploid cultivars [3,7,8] has been completed one after another, which provides an important foundation for the further mining of stress resistance-related functional genes in the peanut plant.
Transcription factors (TFs) play a very important role in a plant’s developmental processes and environmental stress responses by regulating downstream gene expression [9]. The Lateral Organ Boundaries Domain (LBD) gene family, also called the AS2/LOB, is one class of plant-specific transcription factors [10]. LBD proteins are comprised of a relatively conserved N-terminal region and a variable C-terminal region [11]. The N-terminal region includes an LOB domain that comprises a zinc finger-like motif (CX2CX6CX3C) for DNA-binding activity, a GAS block (Gly-Ala-Ser) sequence, and a leucine-zipper-like coiled-coil motif (LX6LX3LX6L), which presumably participate in protein dimerization [12,13]. The LOB structural domain and the variable C terminus together form the expression structure of LBD genes [14]. According to the specific protein sequences of the LOB domain in the N-terminus, the LBD family can be divided into two classes (Class I and Class II). Class I members consist of conserved zinc finger-like motifs, GAS blocks, and leucine-zipper-like coiled-coil motifs, while Class II members only have leucine-zipper-like domains [12,15,16].
The first LBD gene was identified in Arabidopsis [12], and LBDs were initially proved to regulate plant growth and development processes [17,18,19]. However, extensive studies have shown that LBDs also play an important role in hormone response [20,21,22], metabolic regulation [23,24], disease resistance [25], and heading stage [26], etc. Arabidopsis, as a model plant, has received the most in-depth studies on the functions of LBD genes, and at least 25 AtLBD genes have been cloned and functionally characterized [27,28,29,30]. Previous studies have shown that AtLBD13, AtLBD16, and AtLBD29 are related with root development [30,31]. Silencing of the fusarium oxysporum susceptibility gene AtLBD20 has been observed to enhance resistance to the pathogen [32]. AtLBD29 has been observed to participate in auxin signaling, which inhibits fiber wall thickening [33]. Loss of function in AtLBD36 has been found to result in shorter references and the downward curving of lateral organs such as flowers [34]. AtLBD37 has been observed to be involved in anthocyanin biosynthesis and metabolic regulation [35]. Alongside this, OsIG1 has been observed to participate in the development of floral organs and megagametophytes in rice [36], while OsLBD37 has been found to be involved in the regulation of nitrogen metabolism [37]. Moreover, the wheat LBD gene TaMOR can increase root architecture and increase yield in crop plants [38]. Some studies have also reported that LBD genes are involved in responses to different abiotic stresses. In soybean, the expression of GmLBD12 was found to be induced by drought, salt, cold weather, and hormones [39]. In potato, the expression of StLBD2-6 and StLBD3-5 in the stem was found to be induced under drought stress [40].
Until now, studies have been conducted to detect the LBD gene family in other plants, such as the 44 LBD genes found in maize; 31 in rice; 34 in barley; 47 in Pinus massoniana; 55 in Moso bamboo; and 53 in sweet potato plants, respectively [41,42,43,44,45,46]. At present, the systematic investigation of the LBD gene family has not yet been performed in the peanut plant. To better understand the dynamics of LBD gene evolution in peanut plants, we used bioinformatic methods to identify the AhLBD family genes. The evolutionary relationship, chromosome distribution, gene structure, conserved motifs, and collinearity relationship with other species were also performed for AhLBDs. Furthermore, the functional diversification, expression pattern in various tissues, and different responses to salt and drought stresses were systematically analyzed. Our study is essential to understanding the evolution and diversity of peanut LBD genes and their potential role in plant growth and stress responses. It provides new insights to help improve our understanding of the the function and regulation of homologous genes in the peanut plant’s development, and it also provides a foundation for future functional research.

2. Results

2.1. Identification of LBD Family Genes in Peanut

A total of 73 LBD family genes were named from AhLBD1 to AhLBD73 based on their chromosomal positions in A. hypogaea. All 73 genes encoded proteins ranging from 137 (AhLBD66) to 918 (AhLBD1) amino acids. The Predicted protein isoelectric points (pI) of AhLBDs ranged from 4.78 (AhLBD60) to 9.34 (AhLBD72), and their molecular weights (MWs) ranged from 15.05 kD (AhLBD66) to 102.02 kD (AhLBD1). The hydrophilicity of all AhLBD proteins ranged from −0.73 (AhLBD29) to −0.05 (AhLBD50). Additionally, all AhLBD proteins were predicted to be located in the nucleus (see Table S1).

2.2. Phylogenetic Analysis of AhLBDs in Peanut and Arabidopsis

To investigate the evolutionary connection between the LBD gene family of A. hypogaea and A. thaliana, we reconstructed a phylogenetic tree of LBD protein sequences (see Figure 1). A total of 73 AhLBDs and 43 AtLBDs were classified into three groups based on the phylogenetic tree results and named Group I, II, III, respectively. There were 6 AhLBDs and 18 AtLBDs in Group I. Group II contained 18 AhLBDs and 6 AtLBDs. While 49 AhLBDs and 19 AtLBDs were divided into Group III. Except for the first group, in which the number of AtLBDs in Arabidopsis was greater than that of AhLBDs in the peanut plant, the number of AtLBDs in the other two groups was lower than that of AhLBDs.

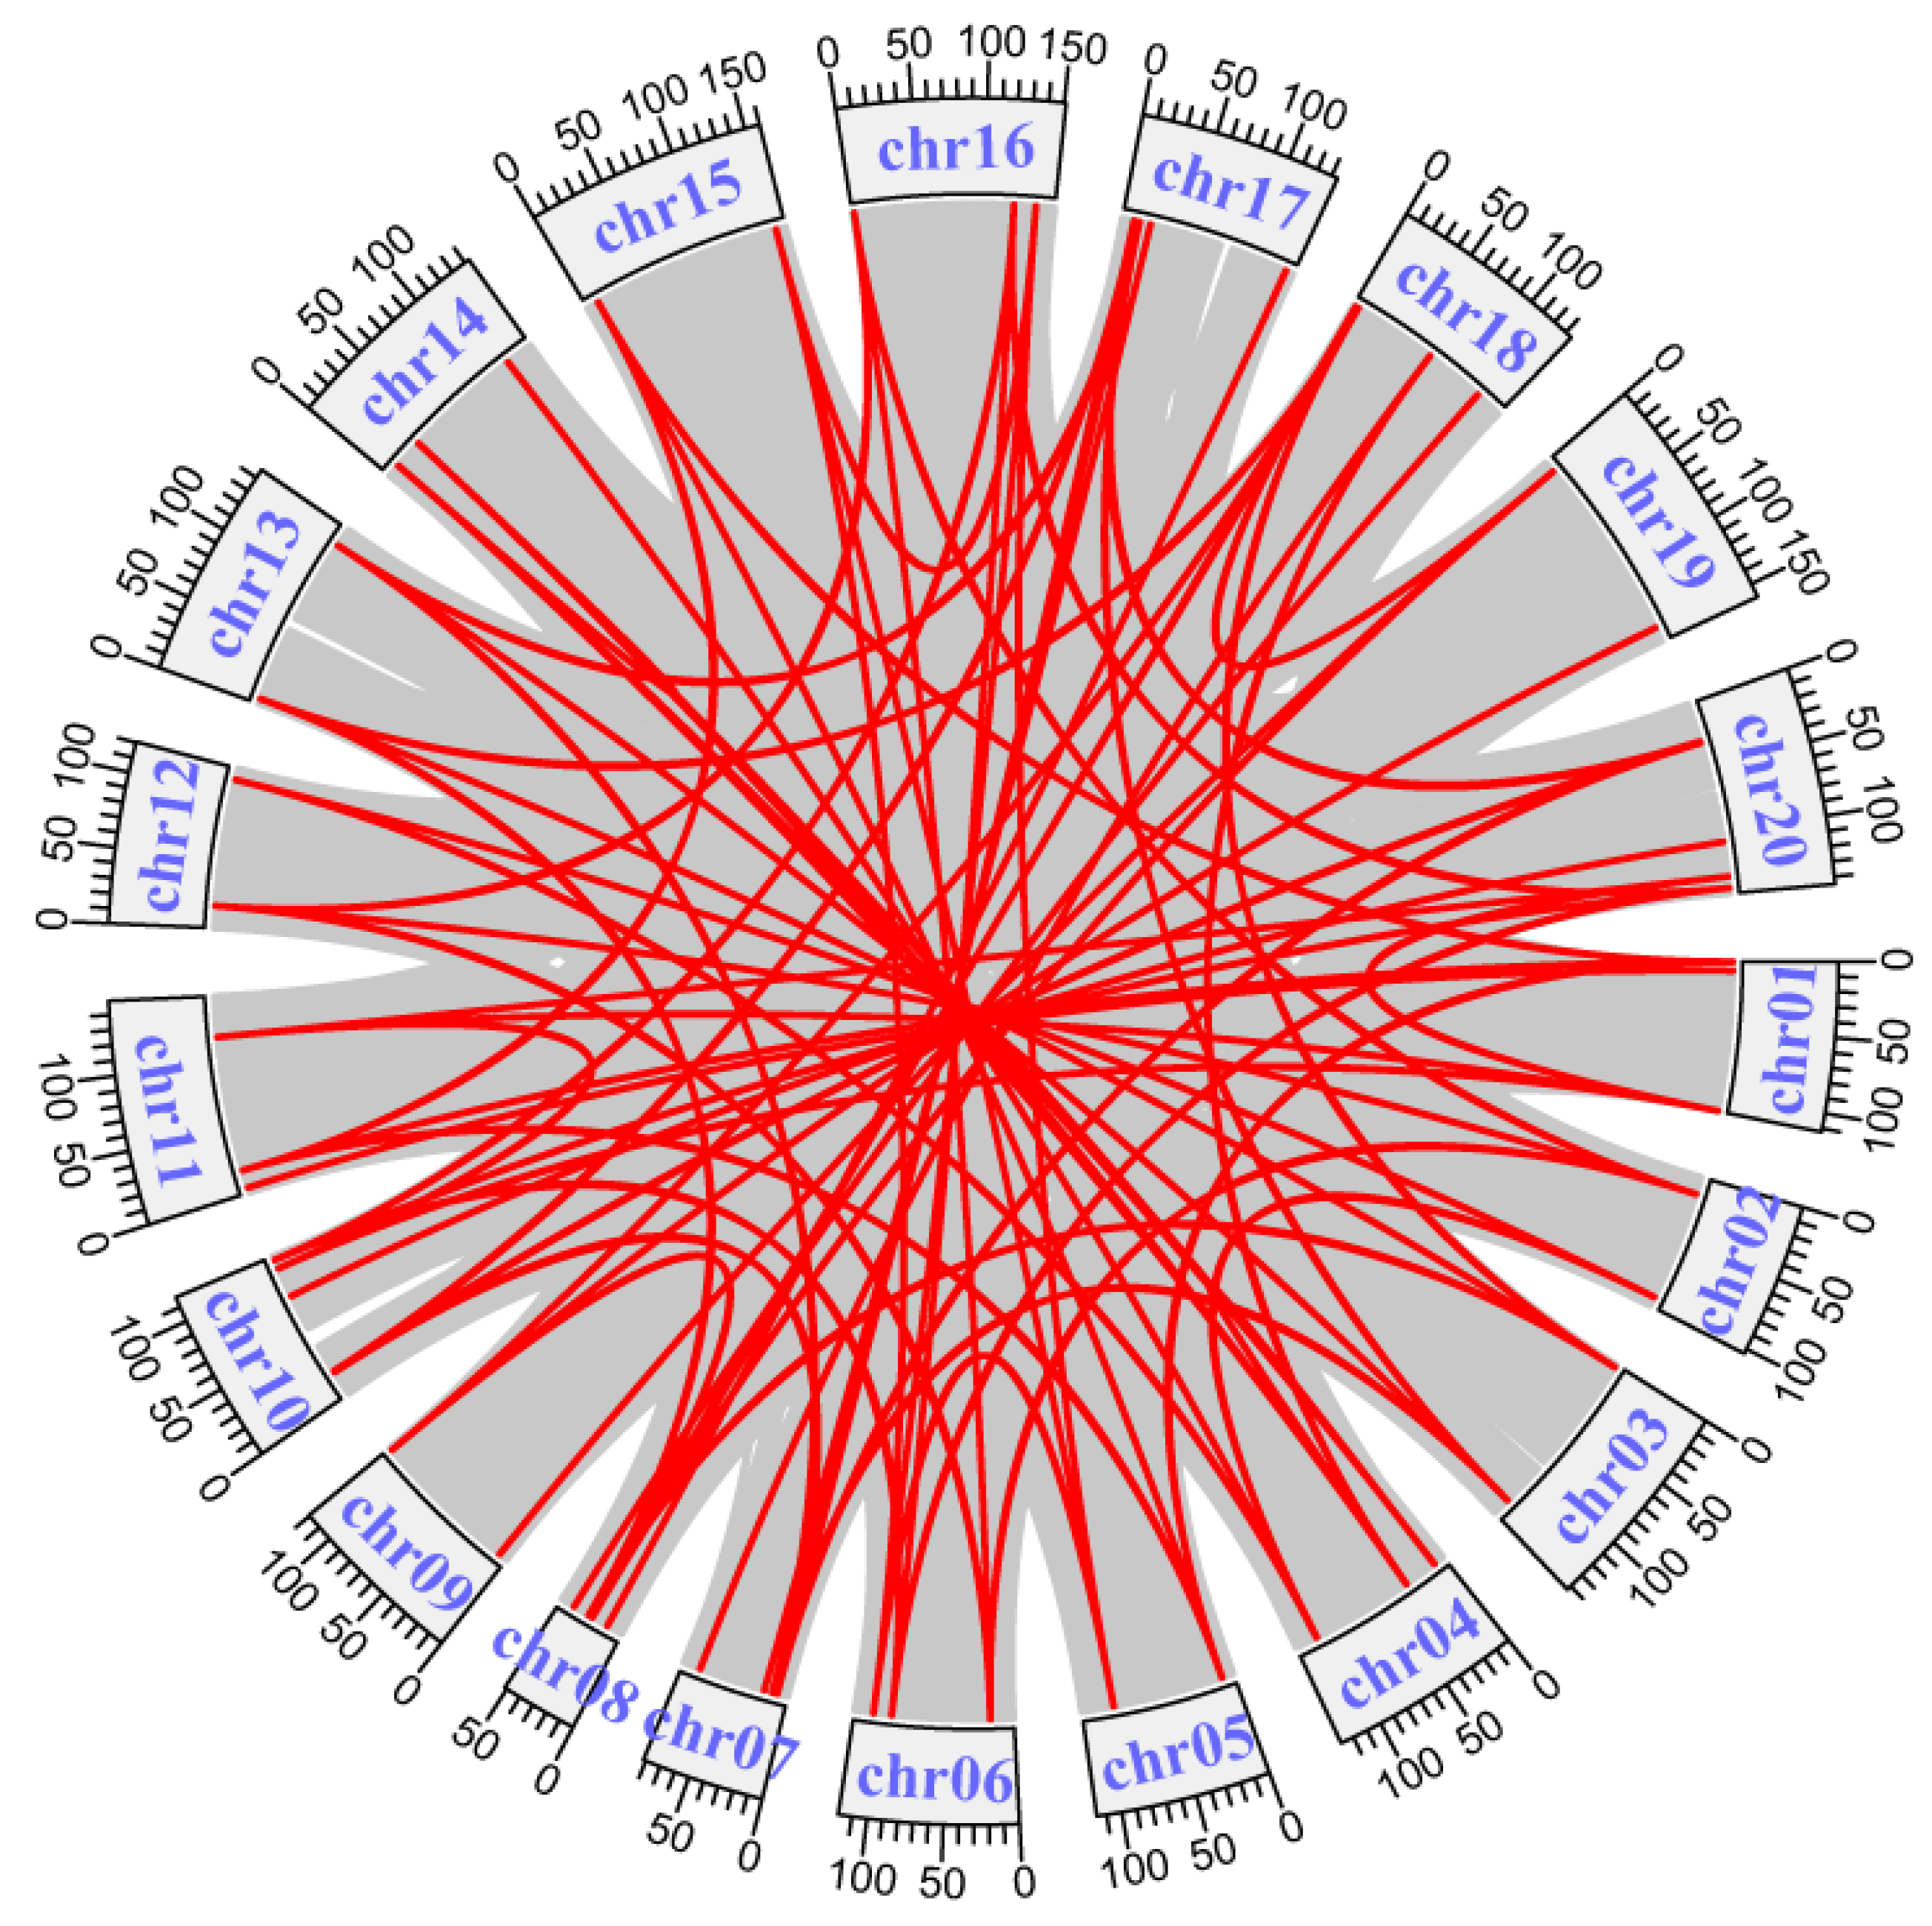
2.3. Chromosomal Distribution and Gene Duplication Analysis of AhLBDs

Based on the genome databases data, chromosomal maps of AhLBDs were also constructed (see Figure 2). The AhLBD genes were distributed on all chromosomes of A. hypogaea. The distribution of AhLBDs in the A subgenome (36 genes) was similar from those in the B subgenome (37 genes). The maximum number of AhLBD genes was 6 in chr07 and chr17. A total of 5 AhLBDs were distributed on chr01, chr14 and chr18, 6 chromosomes contained 4 AhLBD genes, and 6 chromosomes contained 2 AhLBDs, respectively. Only chr08 contained 3 AhLBD genes. Among these, there were only 2 tandem duplication gene pairs, named AhLBD1–AhLBD2 in chr01, and AhLBD43–AhLBD44 in chr12, which were substantially close to each other on their chromosomes, and they were also clustered together on the phylogenetic tree.
By collinearity analysis, there were 78 duplicate gene pairs within AhLBDs, which were distributed on different chromosomes (see Figure 3), indicating the occurrence of tandem duplication and segment duplication during the expansion of AhLBD genes.

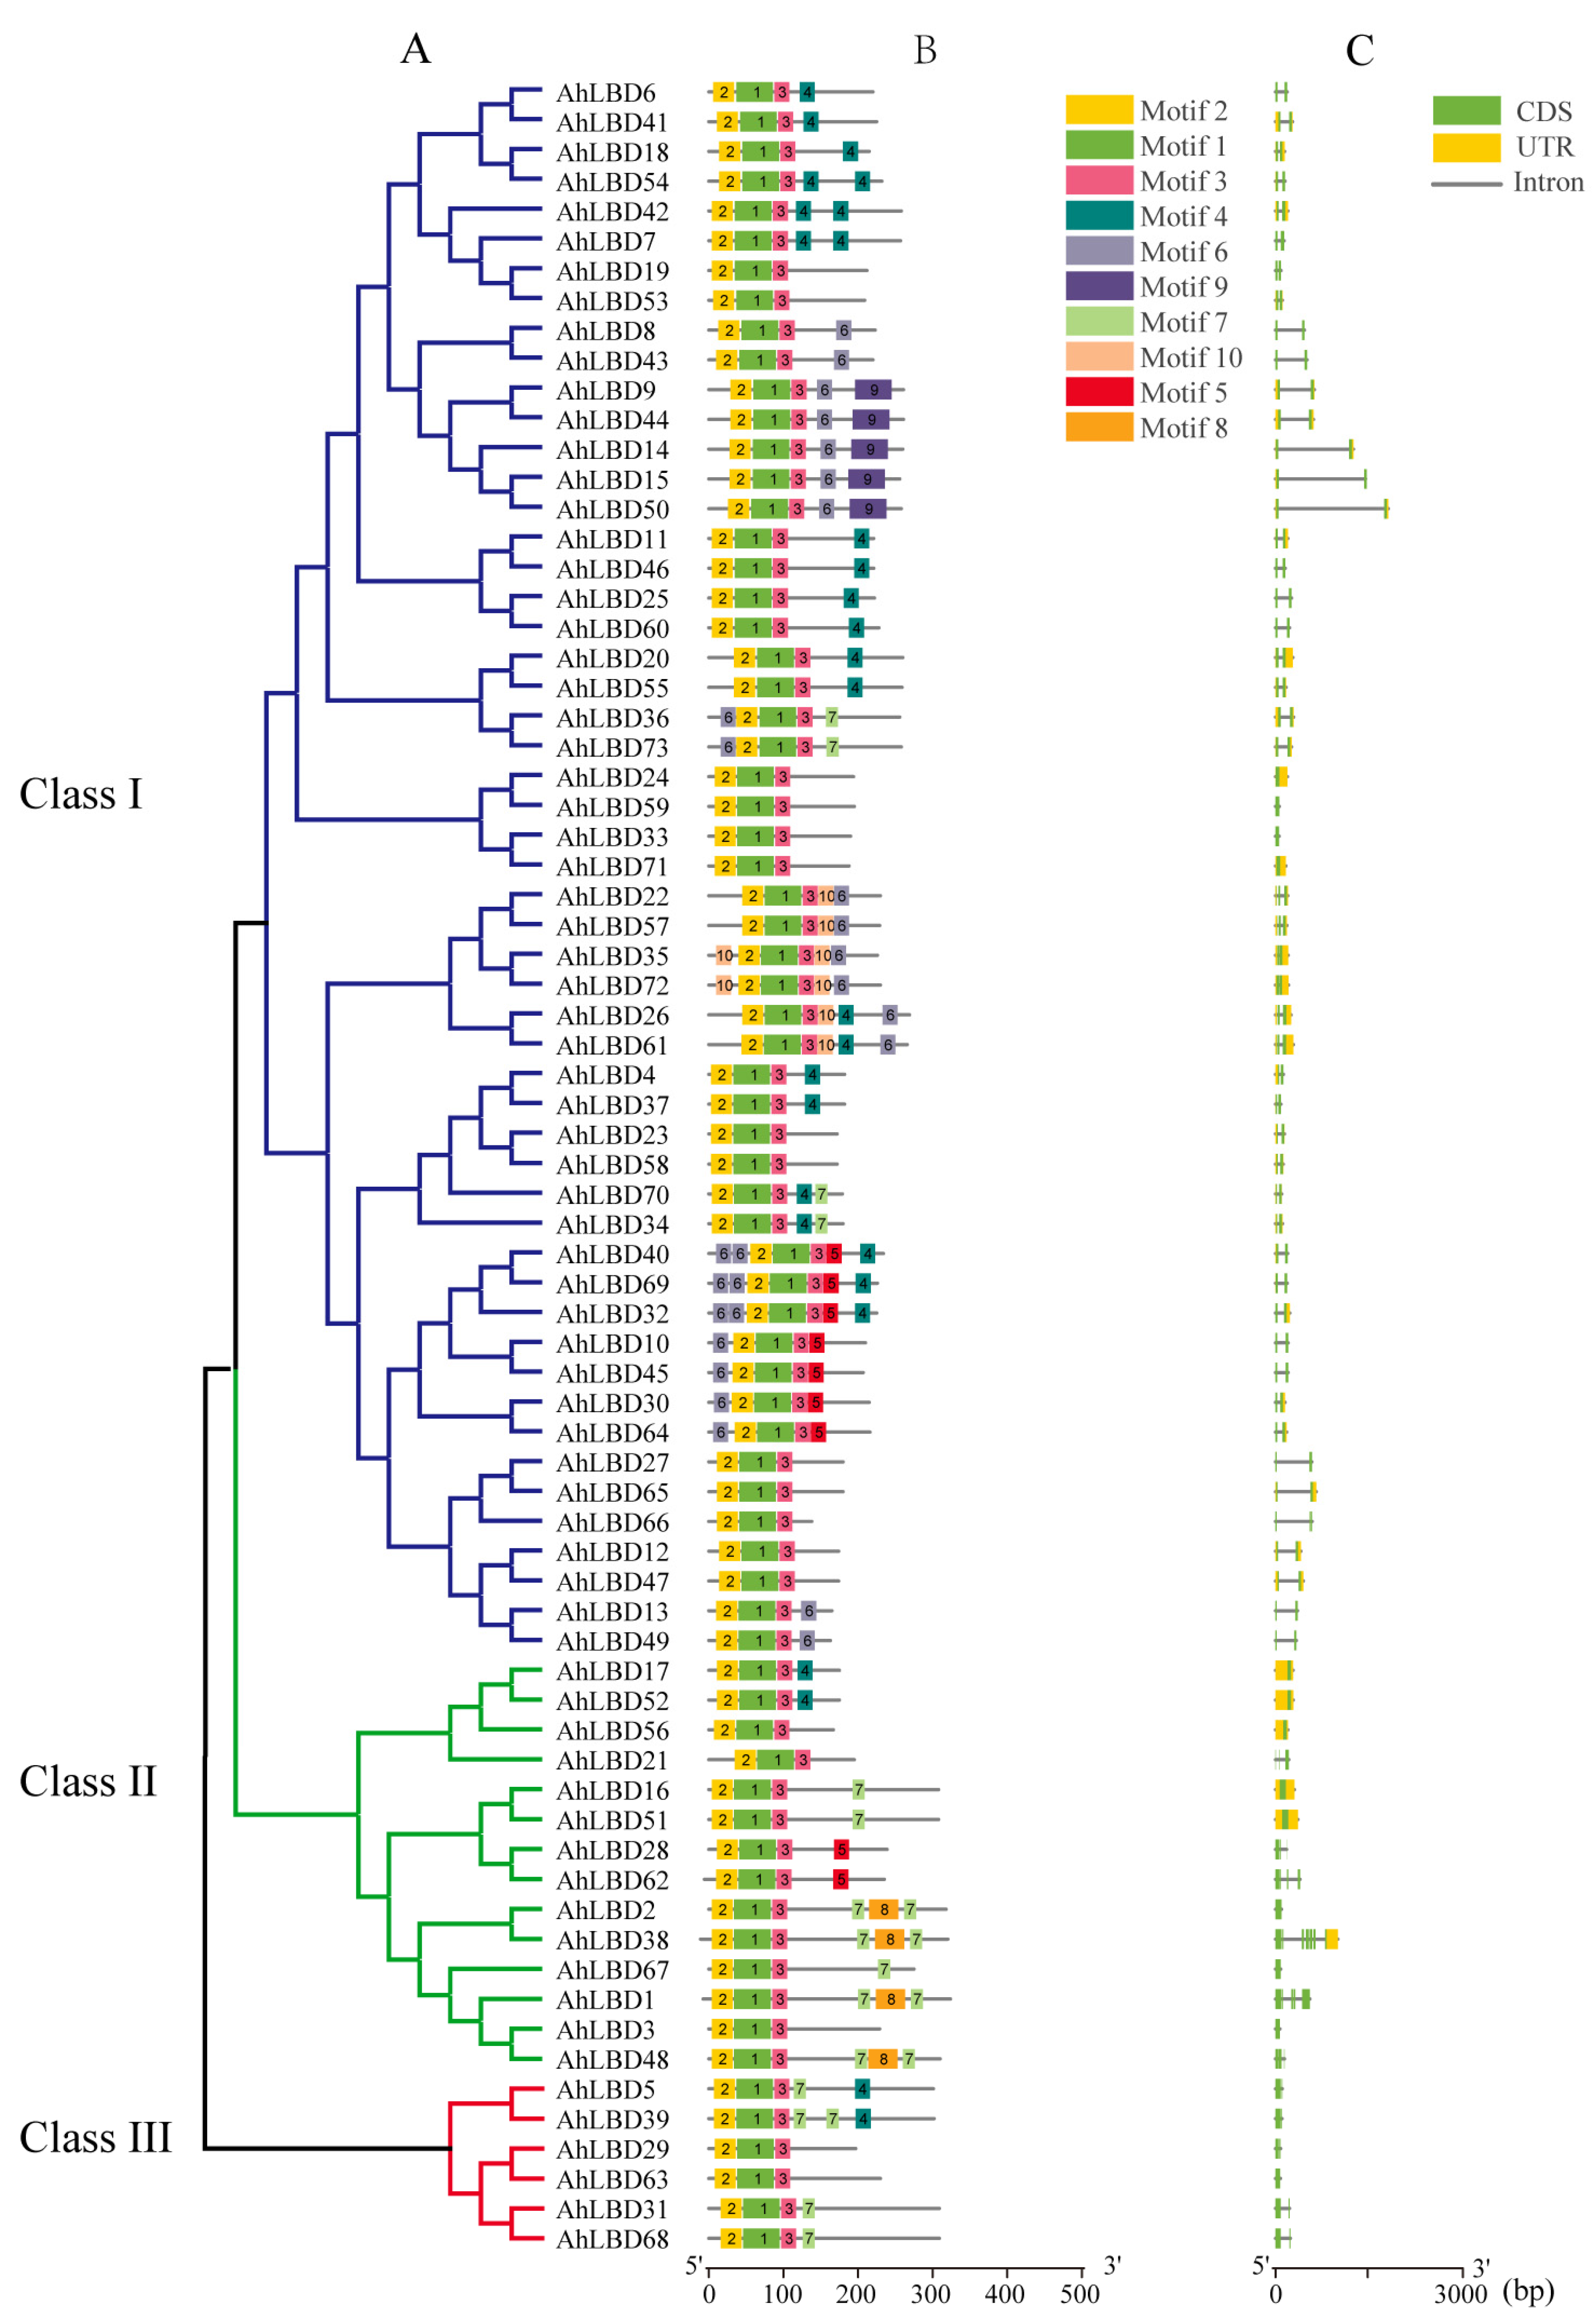
2.4. Gene Structure and Conserved Protein Motifs Analysis of AhLBDs

To better understand the evolutionary relationships of AhLBD family genes, the conserved protein motifs and gene structure of AhLBDs were analyzed (see Figure 4). Three classes were divided according to the phylogenetic tree of AhLBDs. Class I contained the most AhLBD genes (53), Class II contained 14 AhLBDs while there were only 6 AhLBDs in Class III.
The conserved motif analysis of AhLBD protein sequences was performed using the MEME online tool, and 10 conserved motifs were predicted. It was found that different AhLBD proteins had certain differences in the number and distribution of motifs (see Figure 4A,B). Each gene contained 3 to 7 motifs, and all AhLBD proteins contained conserved LOB domains Motif2 and Motif3. The N-terminus of AhLBD proteins was highly conserved, and most AhLBD proteins contained Motif2 and Motif3 near the N-terminus.
To further understand the structural diversity of AhLBD genes, the composition of exons/introns in the full-length cDNA of AhLBD genes and their corresponding genomic DNA sequences were analyzed (see Figure 4C). The number of introns in AhLBD genes ranged from 0 to 7, and genes clustered together usually had similar numbers of introns or exon lengths. A total of 12 AhLBD genes without introns were detected, of which 4 were from Class I and 8 were from Class II. Except for AhLBD1 with 4 introns, AhLBD62 with 5 introns, and AhLBD38 with 7 introns, the other genes had only 1–2 introns.

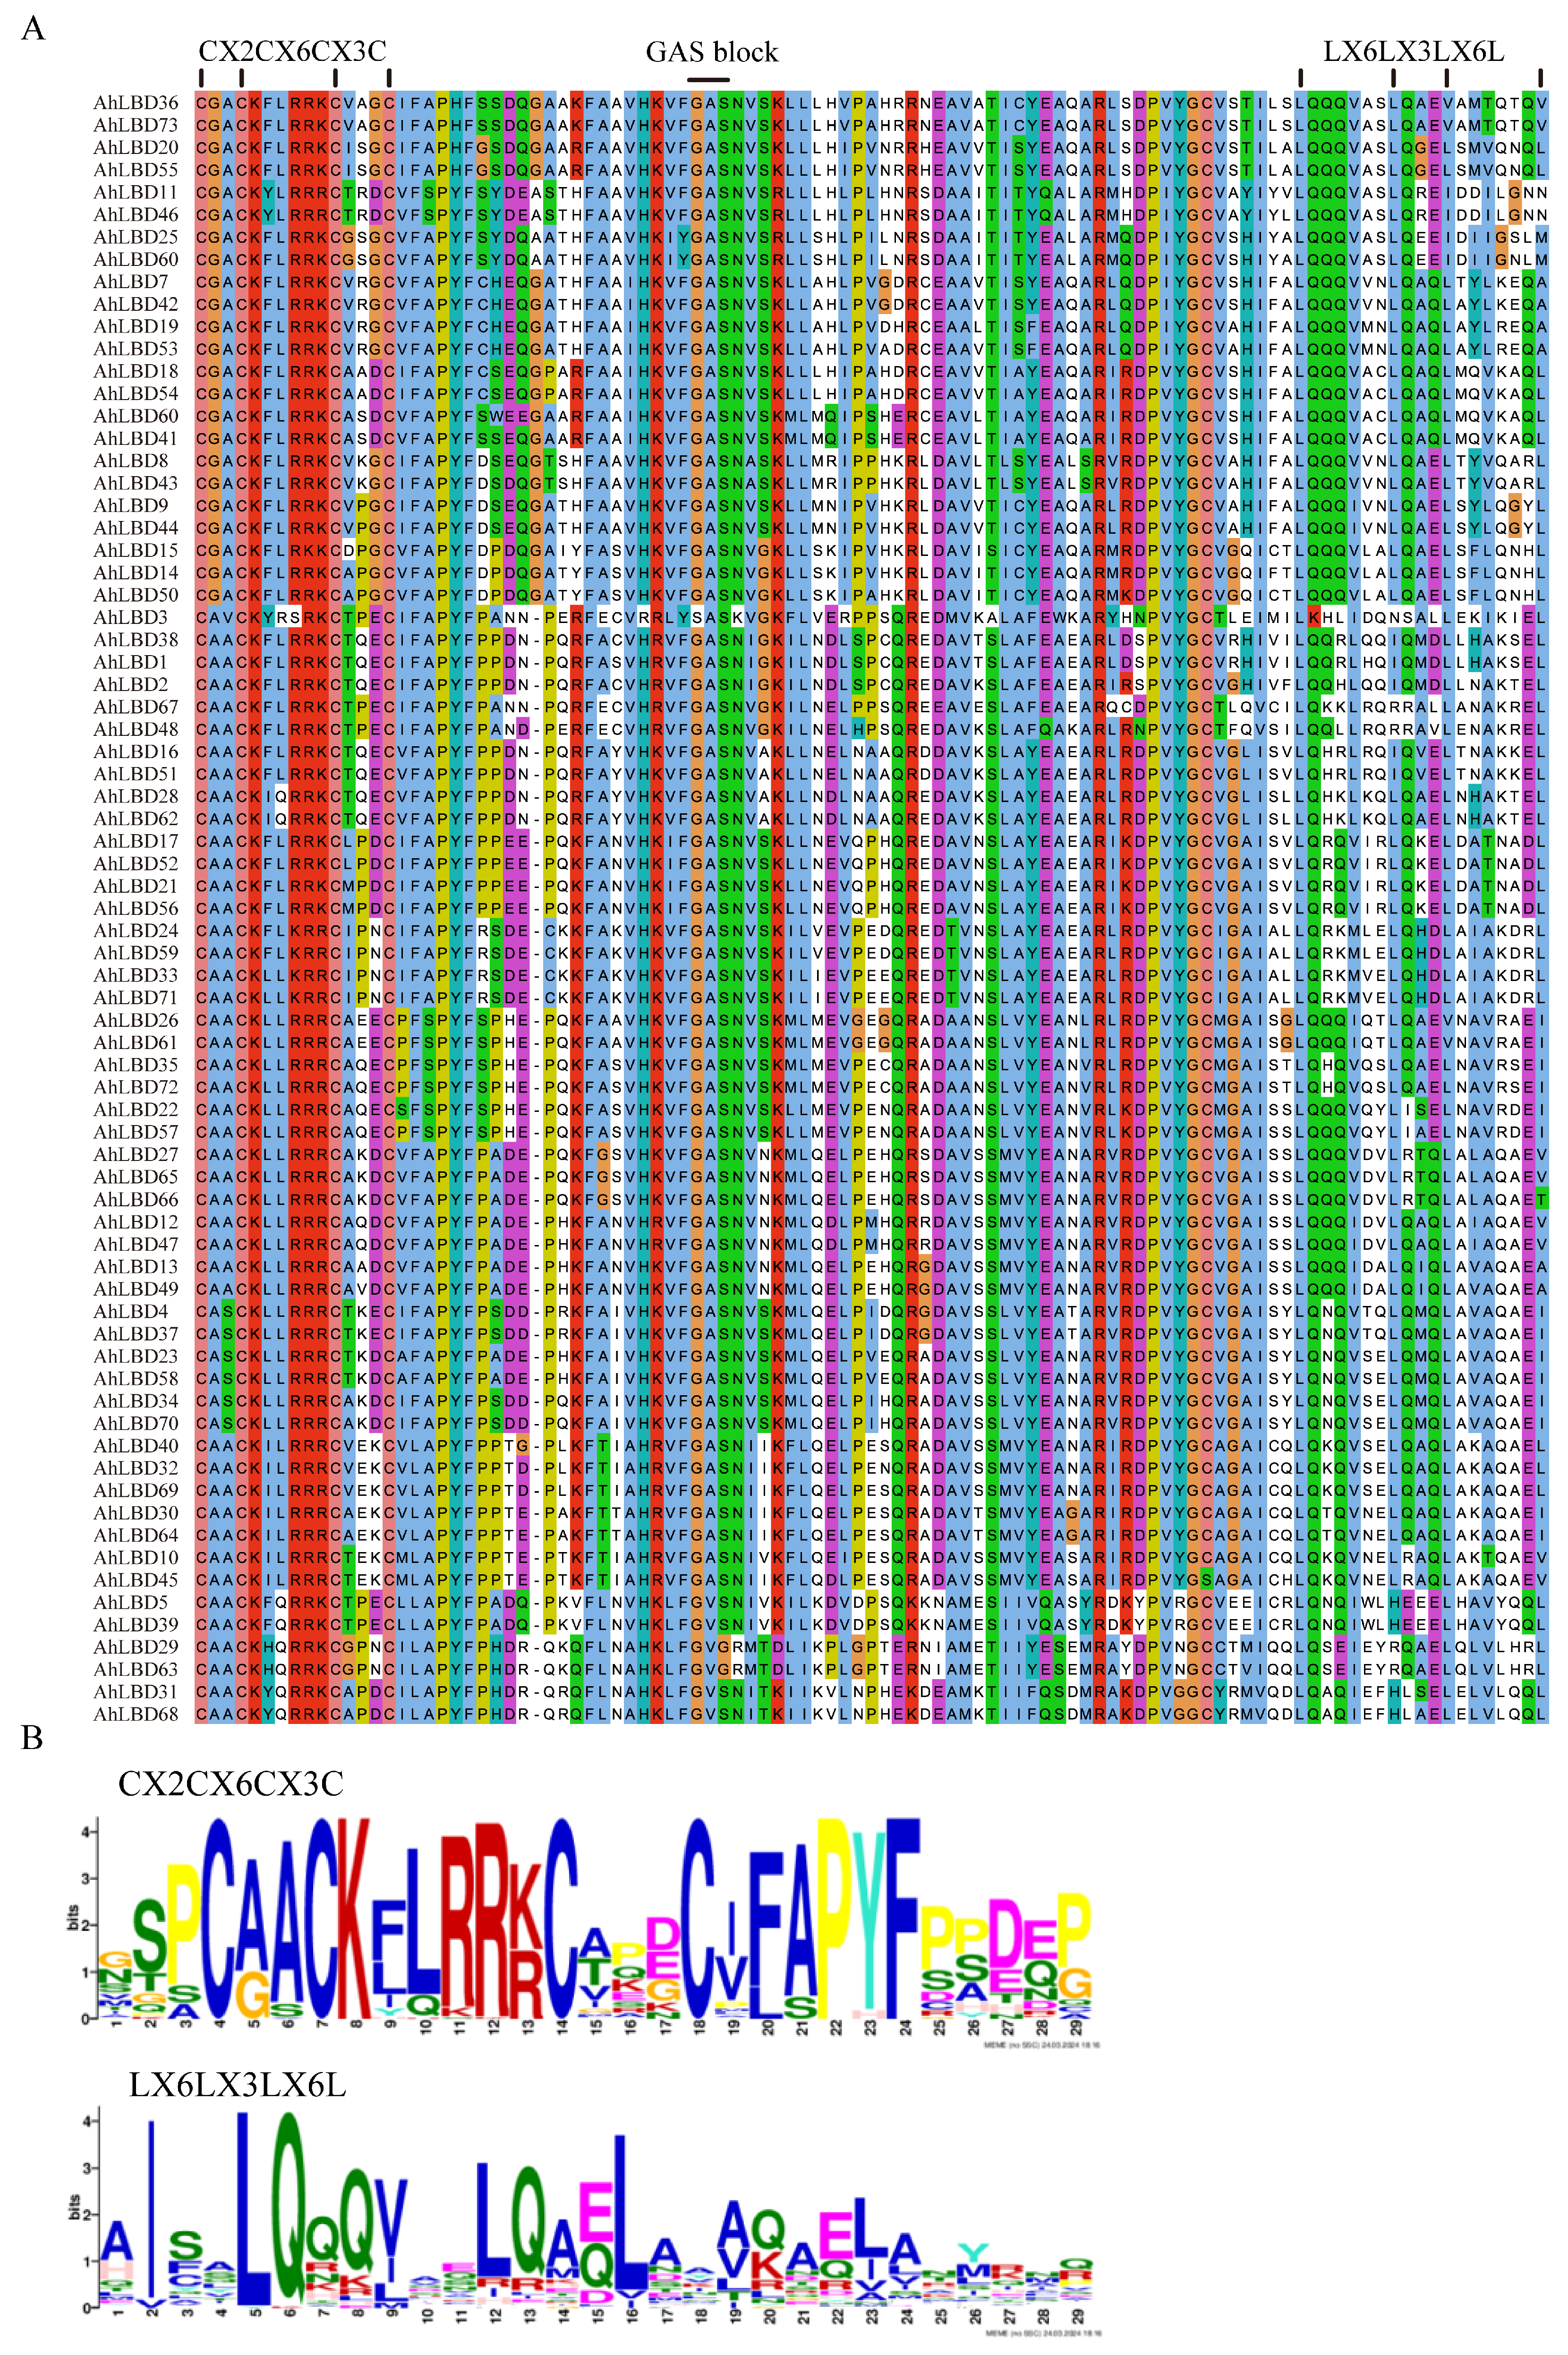
2.5. Conserved Sequence Alignment of AhLBDs

Multiple sequence alignment for 73 AhLBD proteins was performed using ClustalW. The analysis showed that all LBD proteins had a LOB region of approximately 100 amino acids at the N-terminus, which was highly conserved (see Figure 5A). All proteins contained a CX2CX6CX3C domain. A total of 26 AhLBDs contained a leucine zipper-like domain (LX6LX3LX6L) in Class I and Class II (see Figure 5B), but this domain was not present in Class III, indicating that Class III differs from Class I and Class II in biological function.

2.6. Analysis of Cis-Acting Elements in the Promoter Regions of AhLBDs

The cis-acting elements of genes provide strong evidence to support stress responses or tissue-specific expression behaviors in different environments [47]. This study identified all 73 cis-regulatory elements in the AhLBDs’ promoter region (see Figure 6). The types of cis-regulatory elements mainly include three types, including stress-related, hormone response, and growth and development. The results showed that the distribution and type of cis-acting elements in different subgroups of AhLBDs were highly consistent with their gene structure and evolutionary analysis (see Figure 4 and Figure 5). Moreover, AhLBD members in the same subgroup were more similar.
In this study, a total of 11 types of cis-acting elements were analyzed. Abscisic acid (ABA) and gibberellin belong to phytohormones response elements. It was found that 60 genes contained 1 to 13 abscisic acid response elements, and 36 genes contained 1 to 3 gibberellin elements (see Figure 6B). All genes consisted of light elements, of which 15 AhLBDs contained more than 20 light elements.
Meristem expression elements were detected in 25 AhLBDs, and zein metabolism elements were detected in 20 AhLBDs. Elements related to abiotic stress response include anaerobic inducible elements, defense stress elements, drought inducible elements, low temperature elements, MeJA response elements, and salicylic acid cis-elements. Among them, 58 AhLBDs contained anaerobic inducible elements, 28 AhLBDs contained defense stress elements, 19 AhLBDs contained drought-induced functional elements, 18 AhLBDs contained low temperature elements, 44 AhLBDs contained MeJA response elements, and 43 AhLBDs contained salicylic acid elements (see Figure 6B). The above results indicated that the peanut plant’s AhLBD gene family played a very important role in response to growth and development, abiotic stress response, and plant hormone response. In addition, AhLBD genes may have different functions due to the different cis-elements in its promoter region.

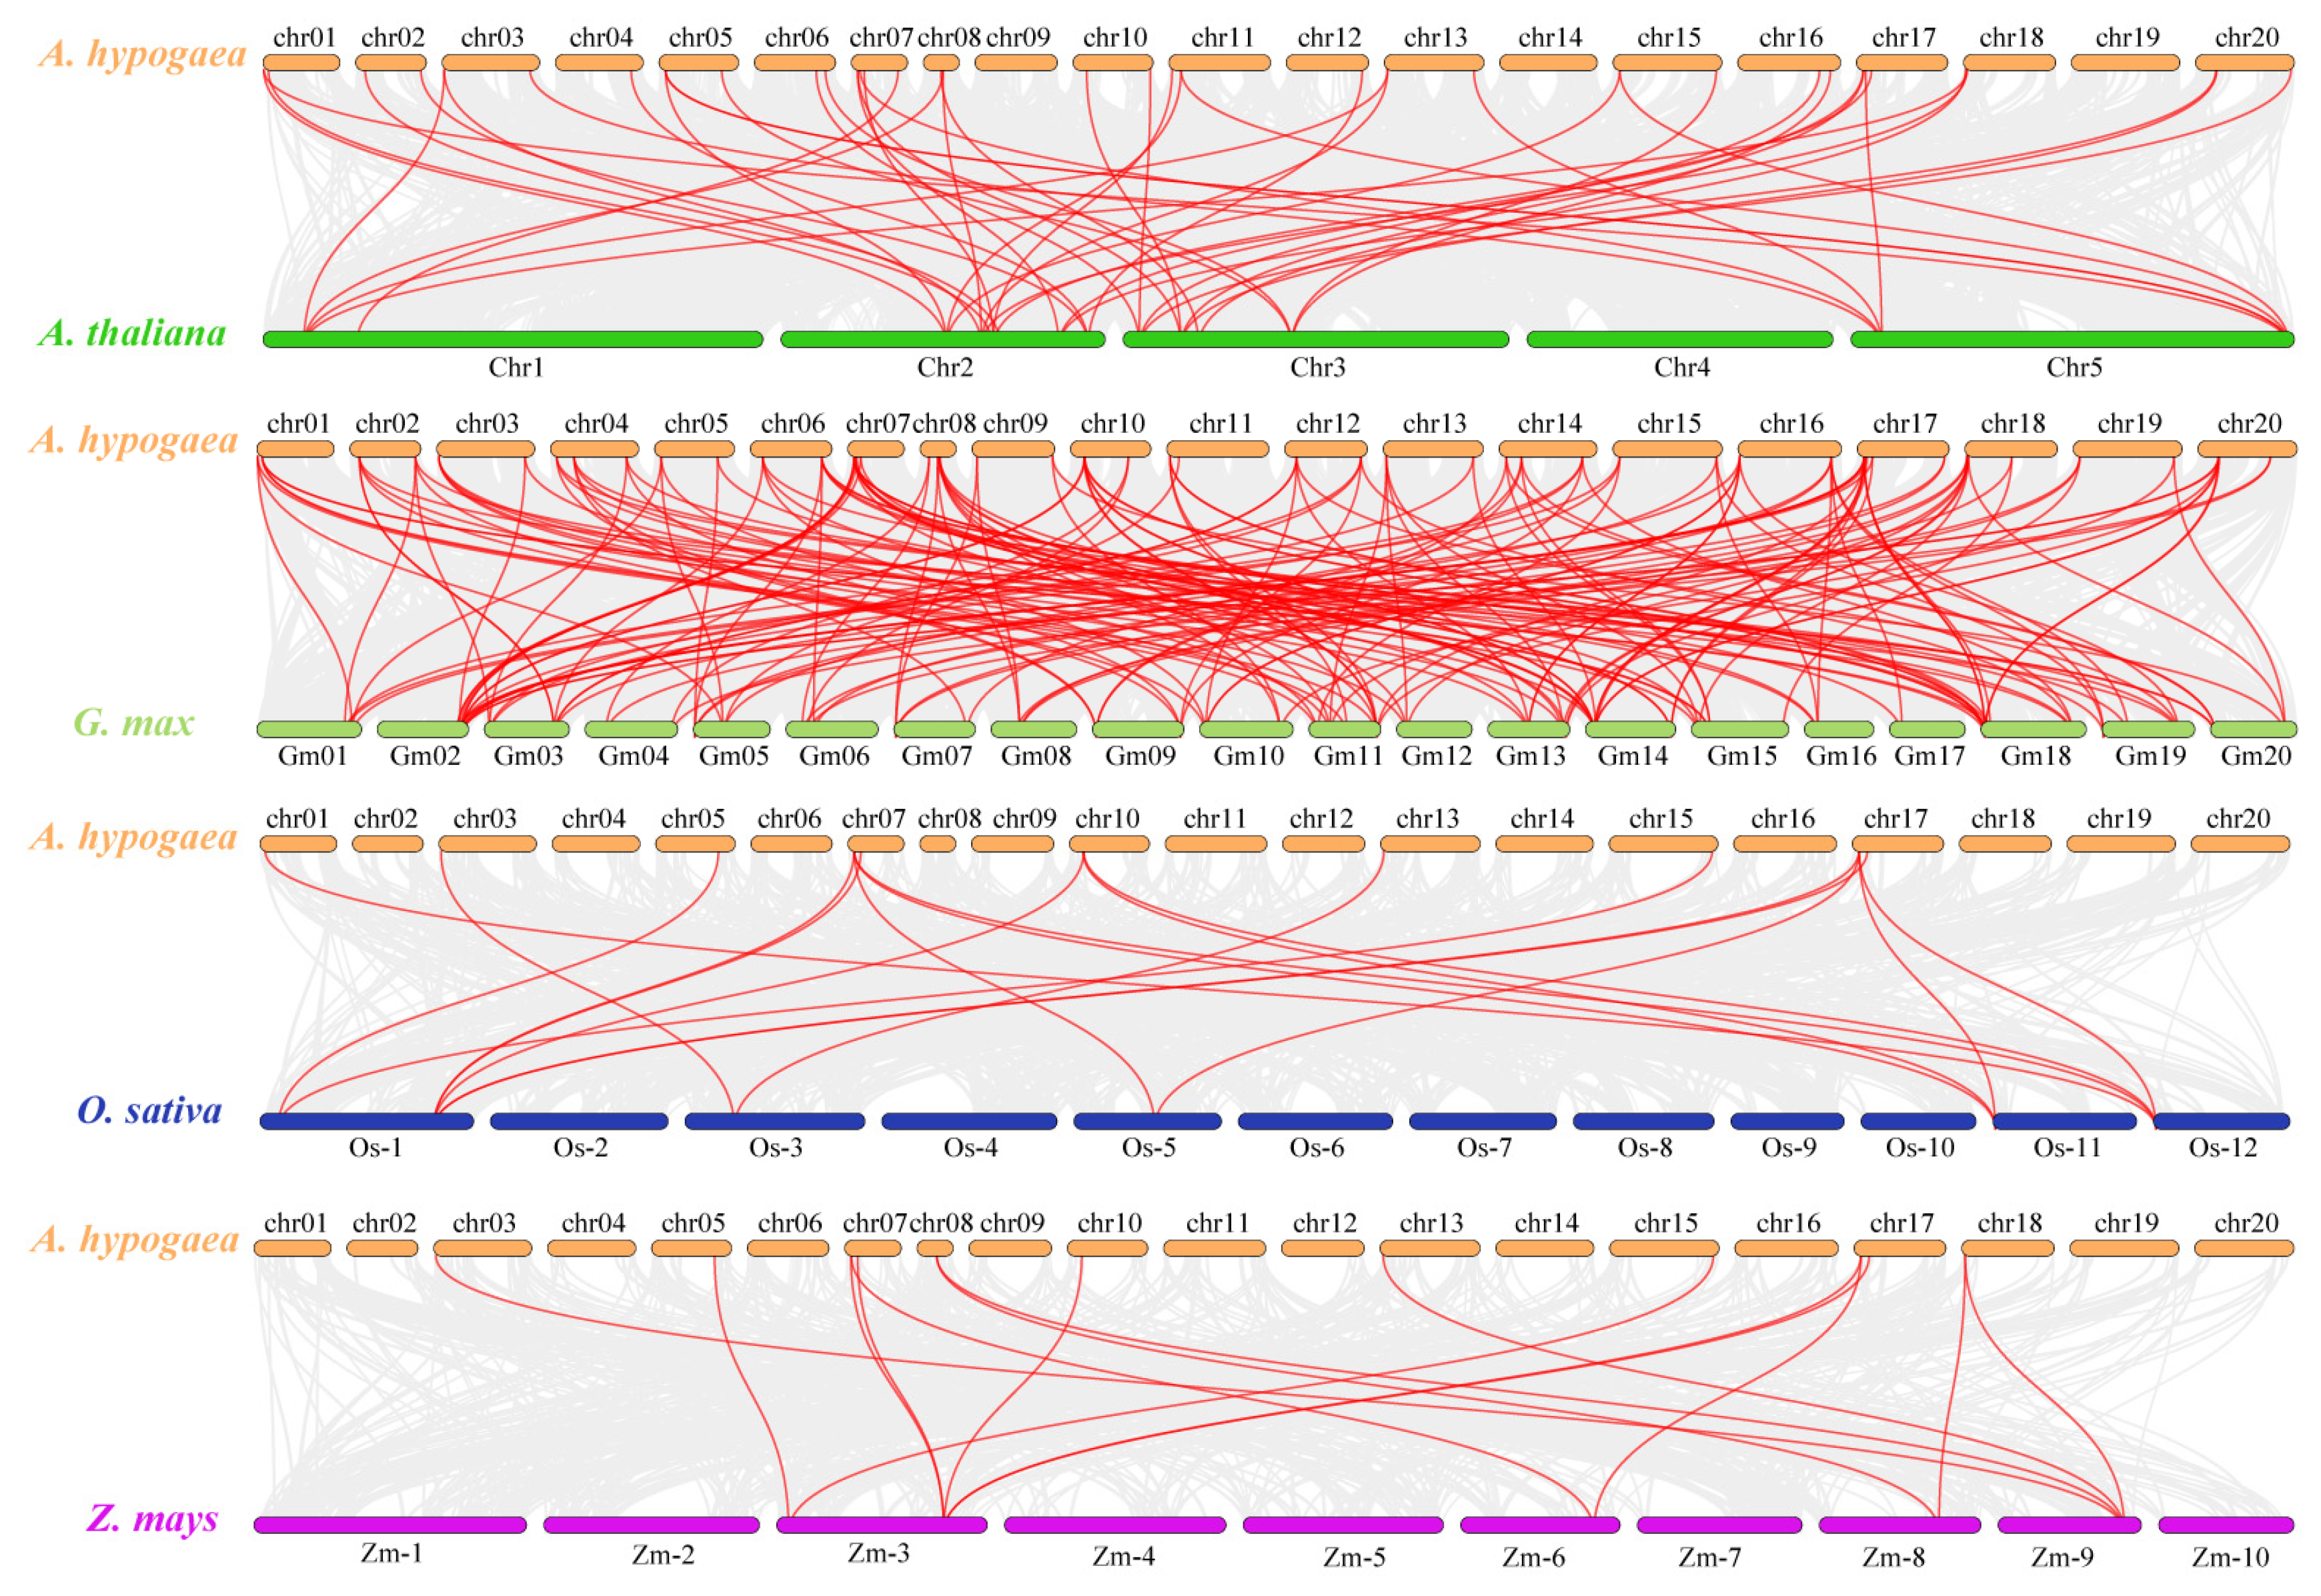
2.7. Evolutionary Analysis of LBDs between A. hypogaea and Other Species

In order to further explore the evolutionary relationship of the LBD gene family with A. hypogaea and other species, collinearity analyses of LBDs between A. hypogaea and LBD genes of other species was conducted (see Figure 7), including two dicotyledons (Arabidopsis and soybean) and two monocotyledons (rice and maize). As shown in Figure 7, there were 174 and 47 collinear genes between peanut and soybean and Arabidopsis, respectively as well as 18 and 15 collinear genes between peanut and rice and maize, respectively. These results showed that the evolutionary relationship of AhLBD genes with dicotyledonous plants was closer than that with monocotyledonous plants, especially that between peanut and soybean plants.

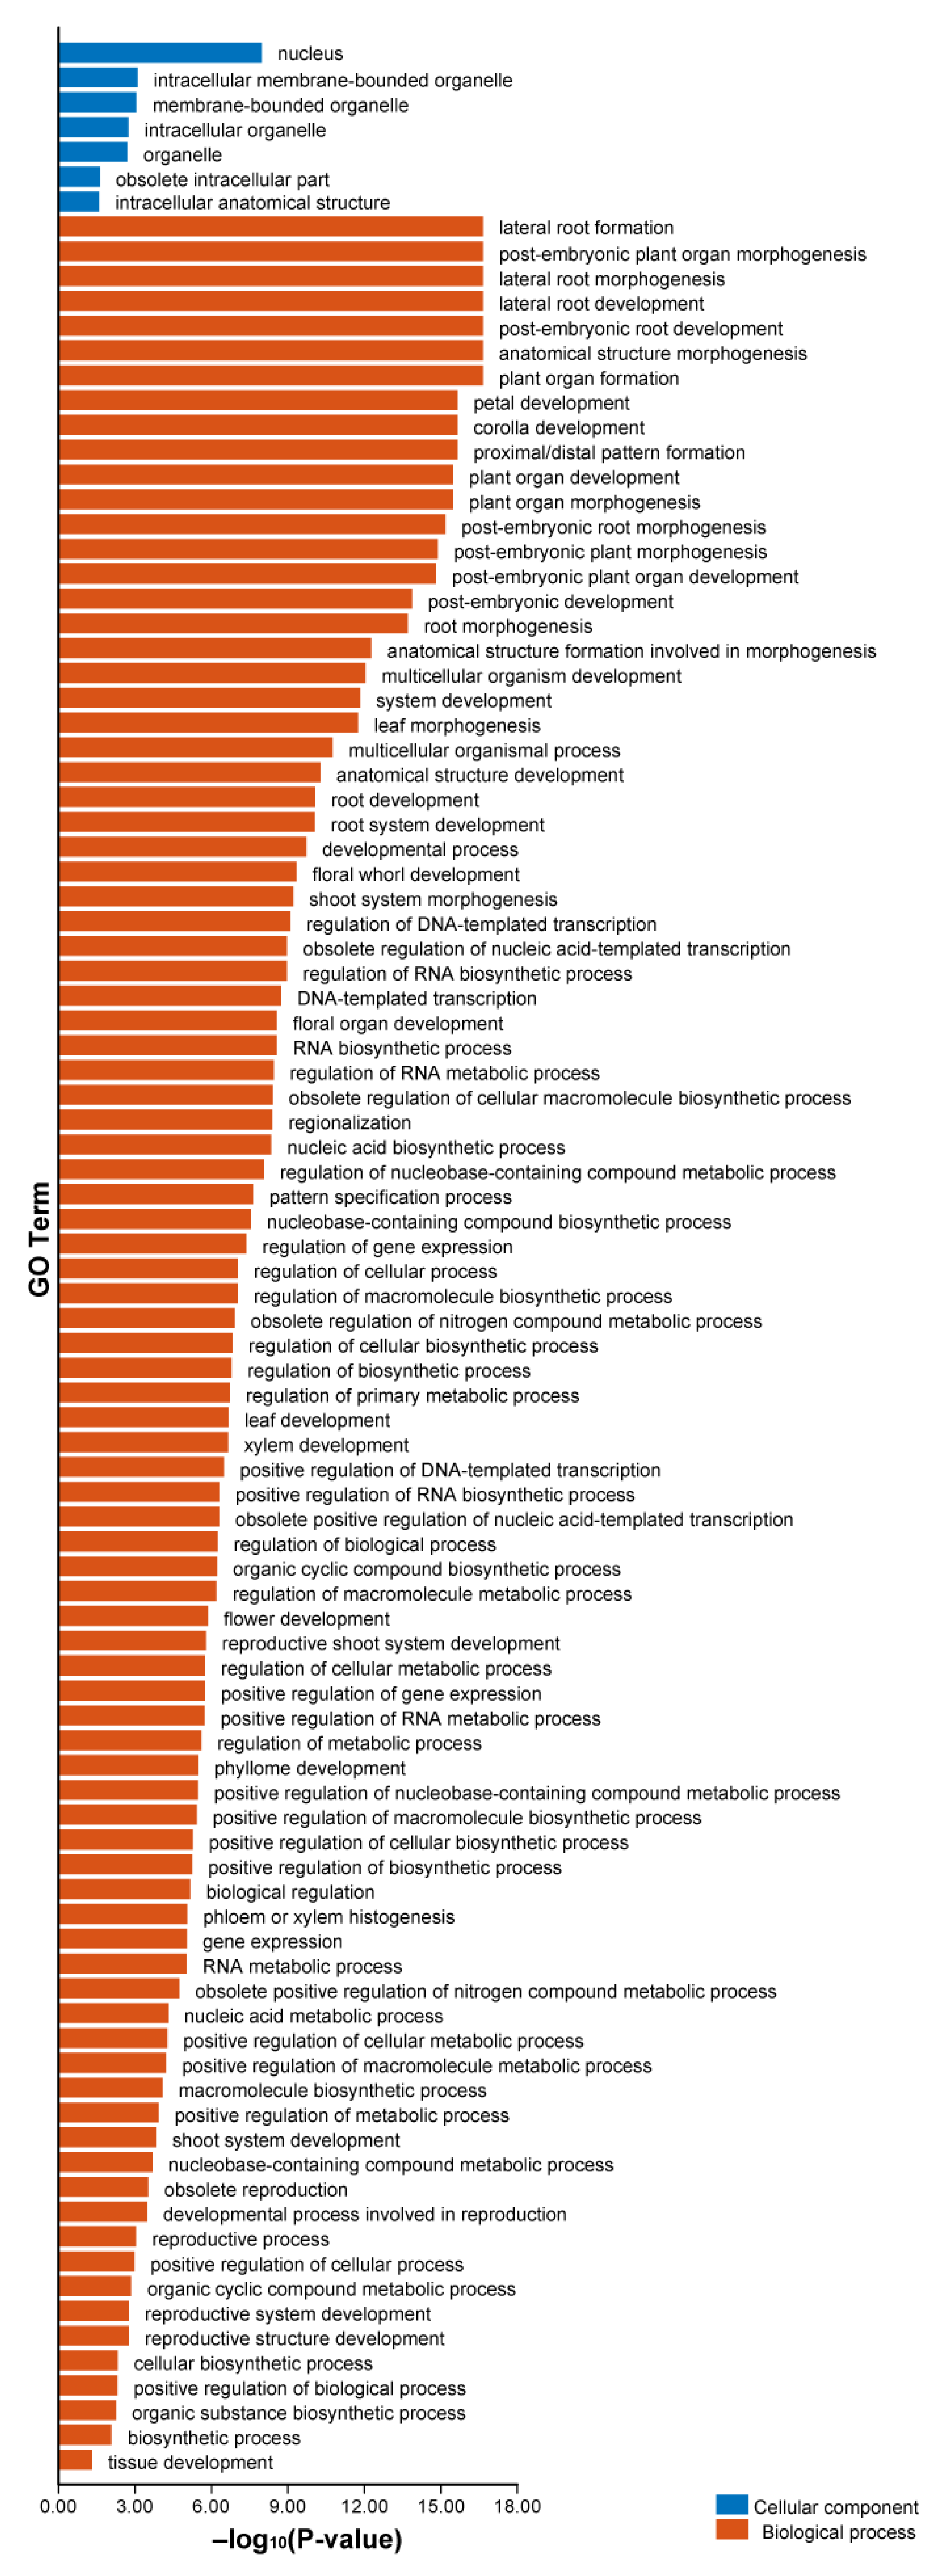
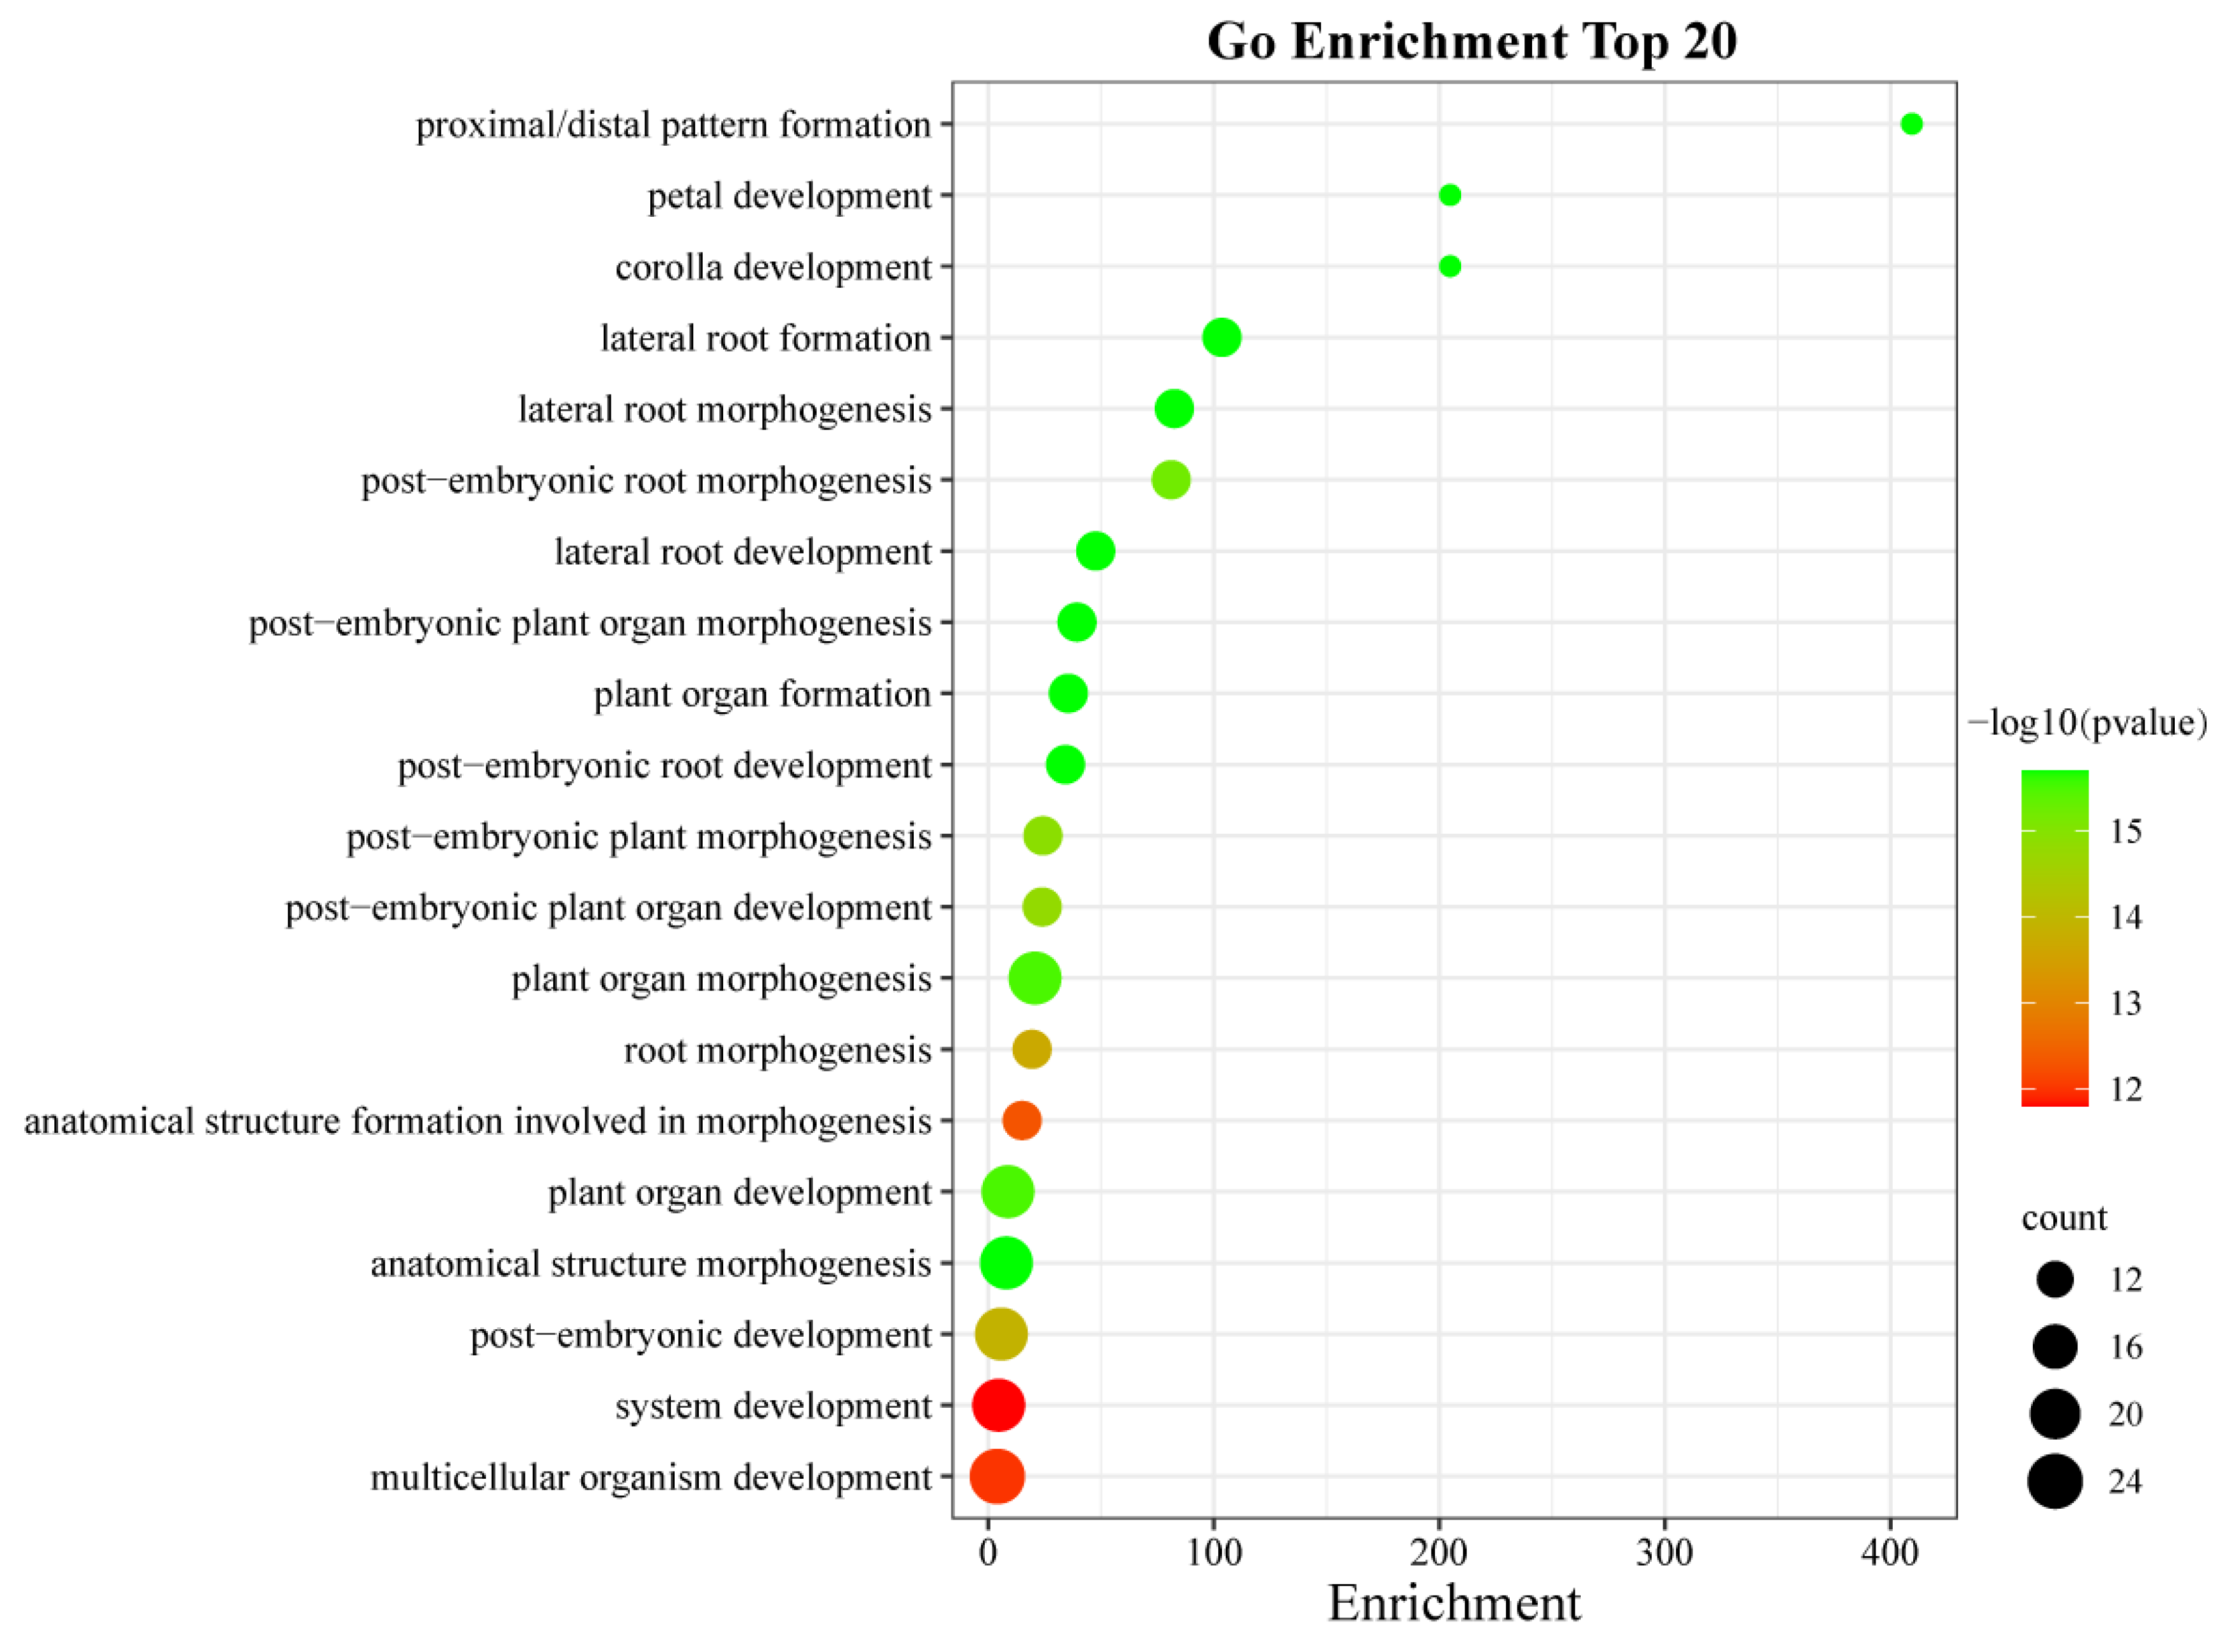
2.8. GO Enrichment Analysis of AhLBDs

In order to predict the biological functions of AhLBDs, we performed Gene Ontology (GO) annotation analysis for all 73 AhLBD proteins, revealing that they may participate in a range of cellular components and biological processes (see Figure 8).
The results showed that all AhLBD proteins were assigned a total of 98 GO terms, most of them belong to biological processes, and many proteins were enriched in this category. In the biological processes category, the most highly enriched types were related to lateral root formation, post-embryonic plant organ morphogenesis, lateral root morphogenesis, lateral root development, post-embryonic root development, anatomical structure morphogenesis, and plant organ formation. There were 22 AhLBD proteins that can participate in anatomical structure morphogenesis, and 13 identical AhLBD proteins that can participate in other biological processes mentioned above. Under the cellular component category, the most highly enriched categories were related to the composition of nucleus, of which 19 AhLBD proteins were involved in this component.
In addition, the analysis of the top 20 GO terms were shown in Figure 9, the results showed that the strongest enrichment and the highest enrichment factor (409.5) were observed in proximal/distal pattern formation, followed by petal development and corolla development, of which the enrichment factor for both was 204.8. In addition, the largest number of genes in GO terms was associated with multicellular organism development.

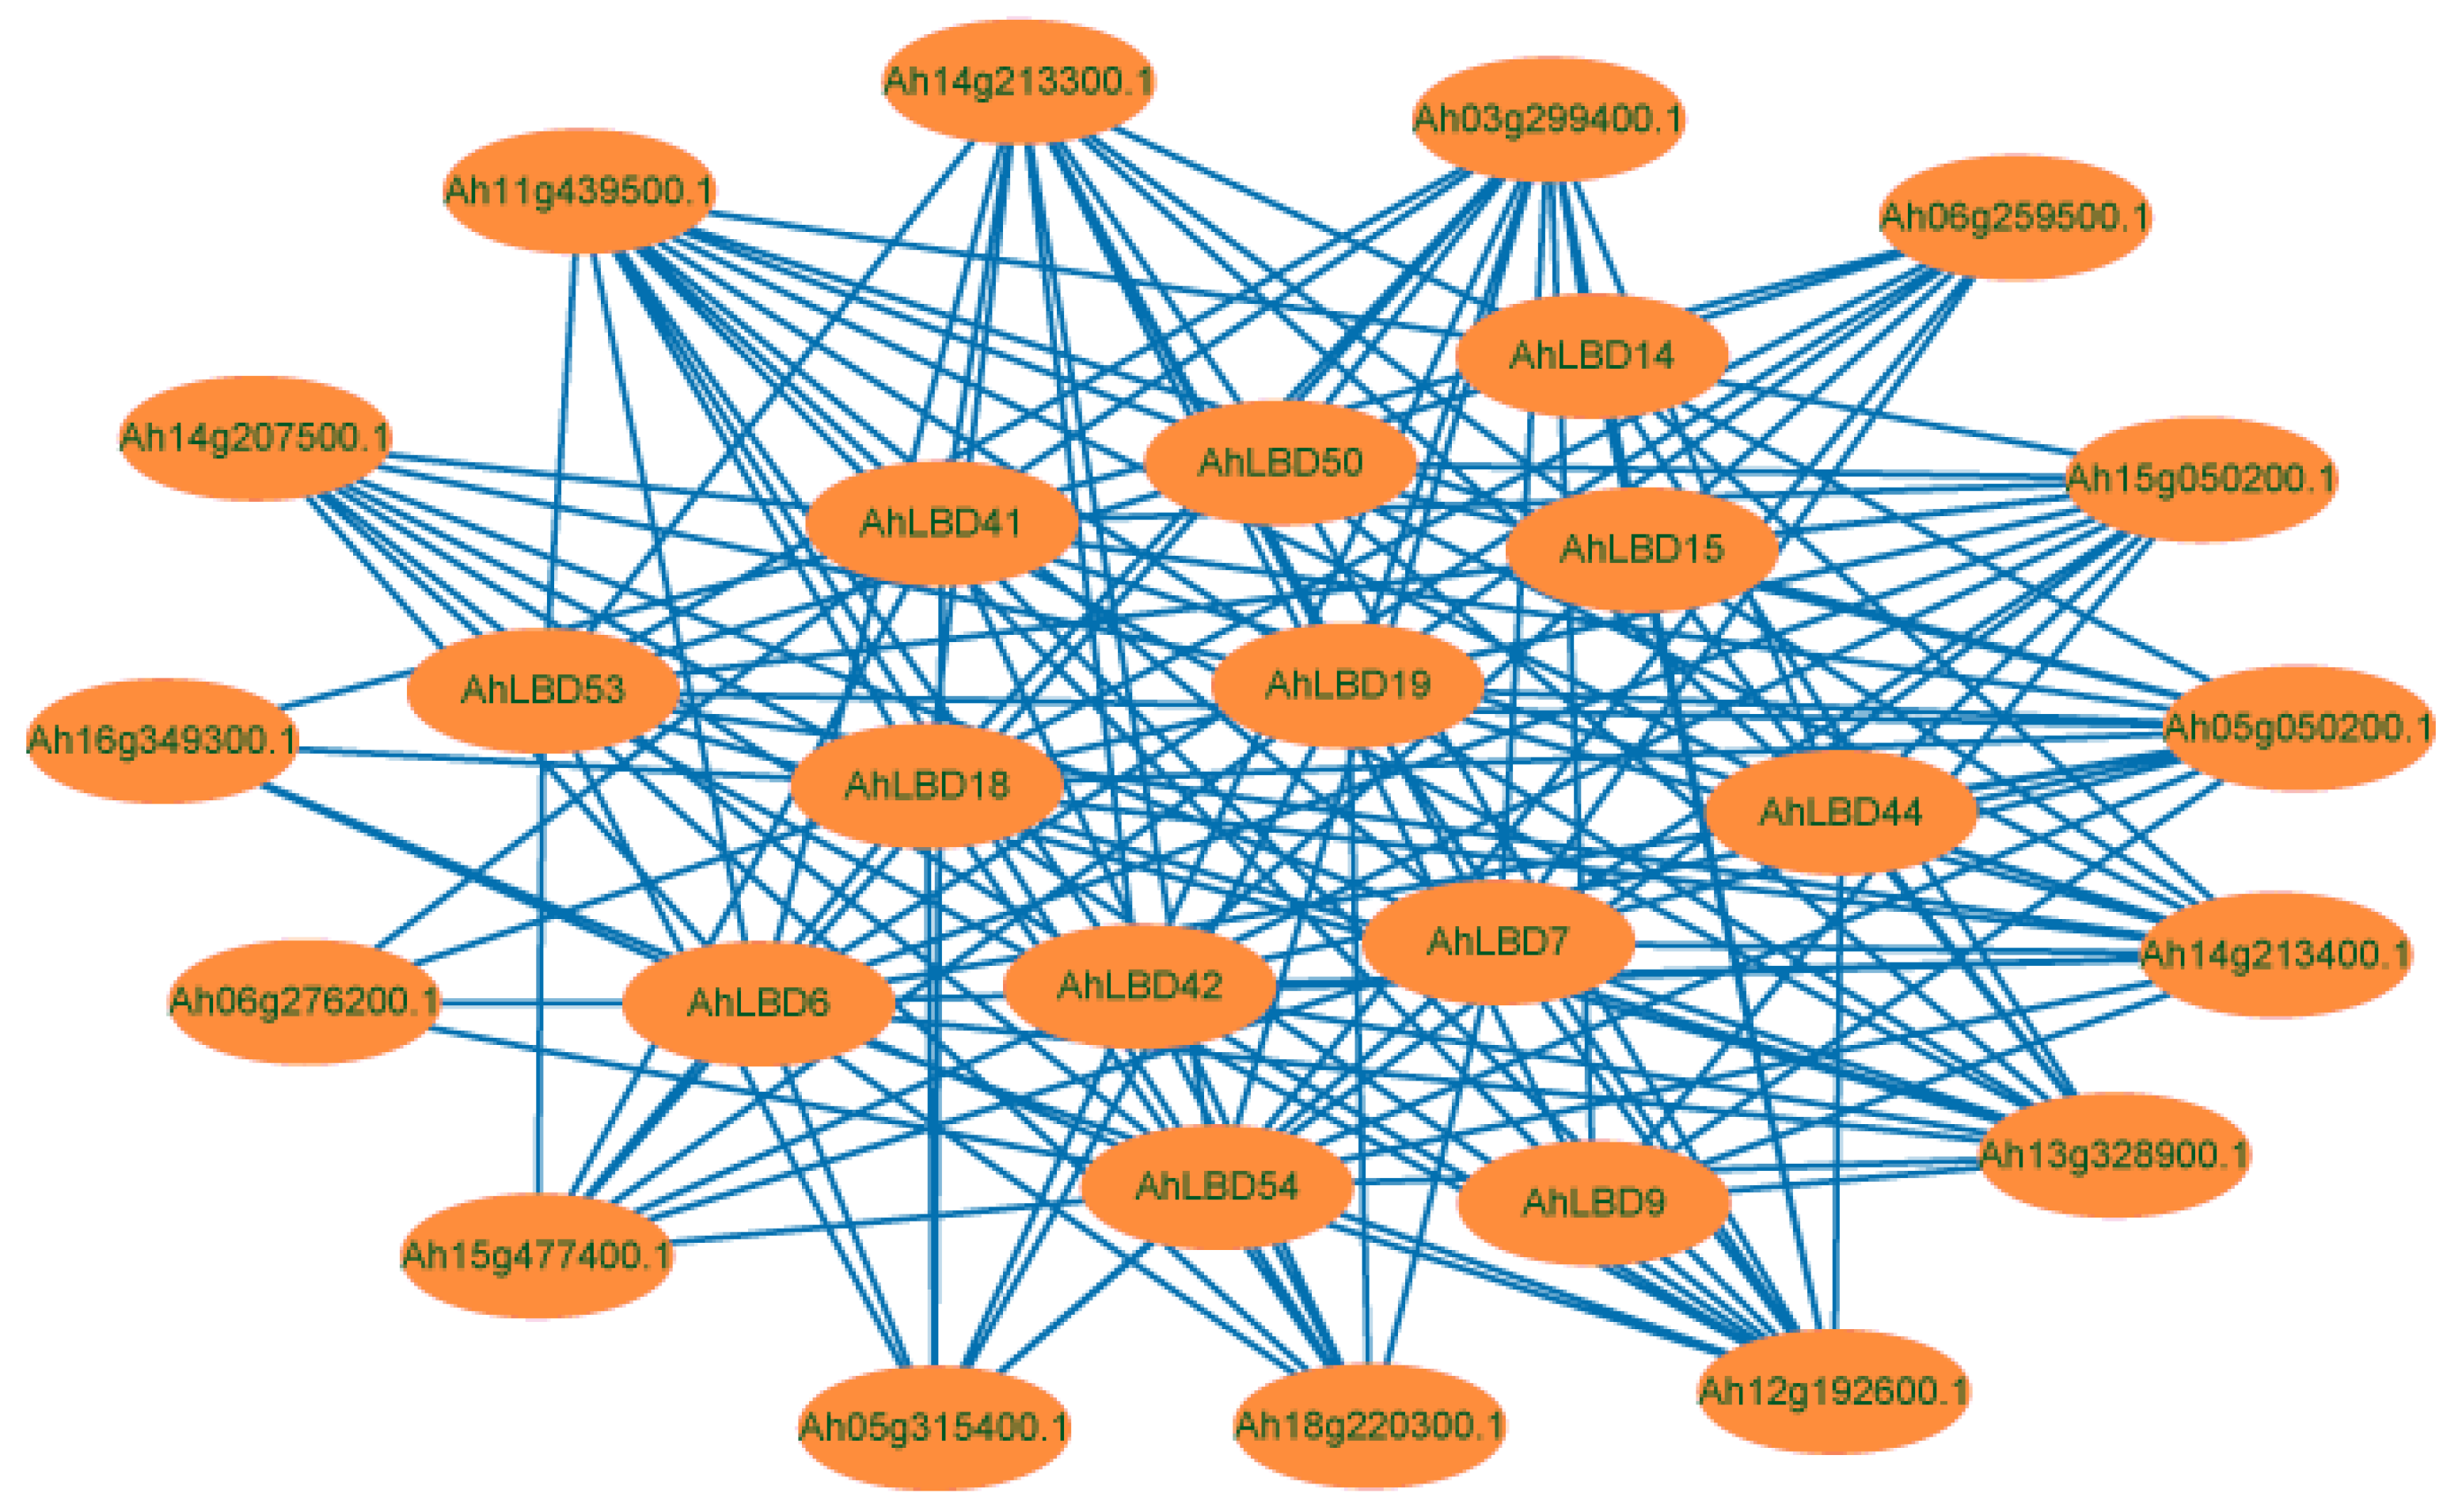
2.9. Interaction Network Analysis of AhLBDs in Peanut Plants

To further determine which proteins may interact with AhLBD proteins, we downloaded the Arabidopsis protein interaction network file from the STRING database and used it as the basis for predicting AhLBD-interacting proteins (see Figure 10). The AhLBD protein with other proteins interaction network consisted of 152 nodes, each of which communicated with other nodes. The AhLBD6, AhLBD18, AhLBD41, and AhLBD54 proteins interacted directly with 15 auxin response factors (Ah03g299400.1, Ah05g050200.1, Ah05g315400.1, Ah06g259500.1, Ah06g276200.1, Ah11g439500.1, Ah12g192600.1, Ah13g328900.1, Ah14g207500.1, Ah14g213300.1, Ah14g213400.1, Ah15g050200.1, Ah15g477400.1, Ah16g349300.1, and Ah18g220300.1), and the annotation information of auxin response factors were detailed in Table S2. The AhLBD7, AhLBD19, AhLBD42, and AhLBD53 proteins each interacted directly with 13 auxin response factors (Ah03g299400.1, Ah05g050200.1, Ah05g315400.1, Ah06g259500.1, Ah11g439500.1, Ah12g192600.1, Ah13g328900.1, Ah14g207500.1, Ah14g213300.1, Ah14g213400.1, Ah15g050200.1, Ah15g477400.1, and Ah18g220300.1). Alongside this, the AhLBD9, AhLBD14, AhLBD15, AhLBD44, and AhLBD50 proteins interacted directly with 8 auxin response factors, respectively (Ah03g299400.1, Ah05g050200.1, Ah11g439500.1, Ah12g192600.1, Ah13g328900.1, Ah14g213400.1, Ah14g213300.1, and Ah15g050200.1). However, there was no direct interaction between AhLBD proteins. Protein interaction network analysis only predicted the potential interacting proteins of AhLBD family genes, and protein interaction experiments were still needed for verification.

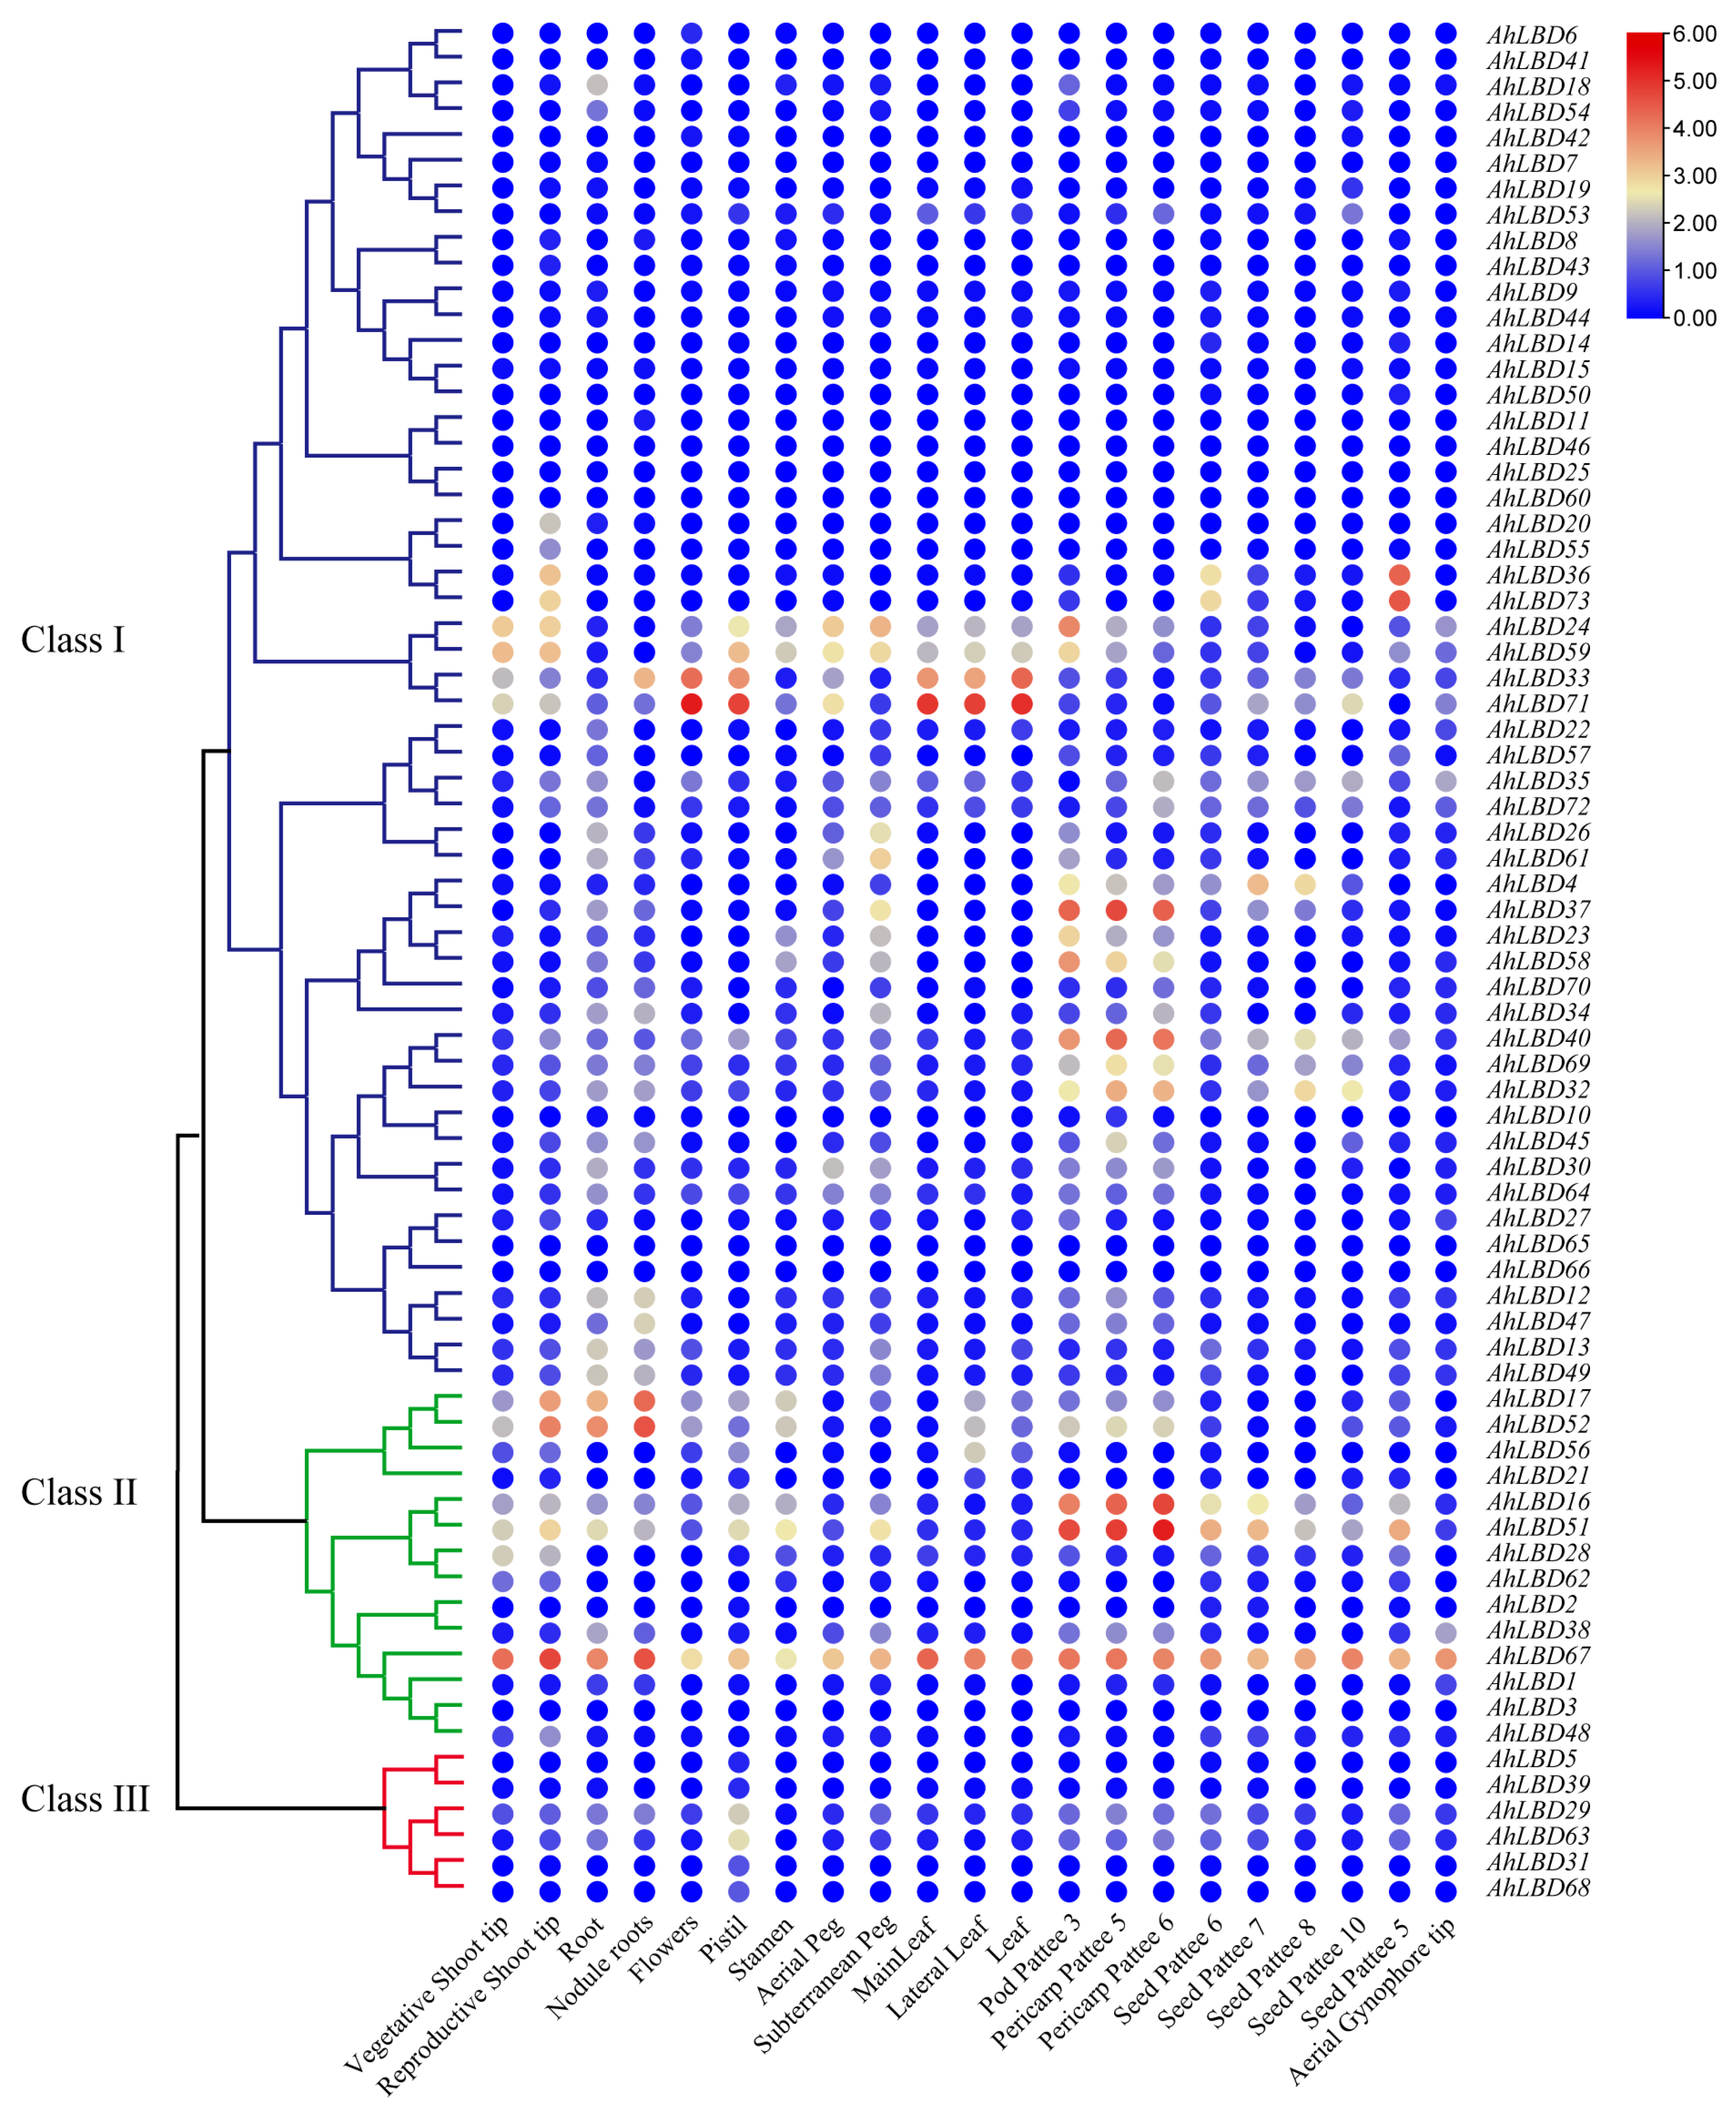
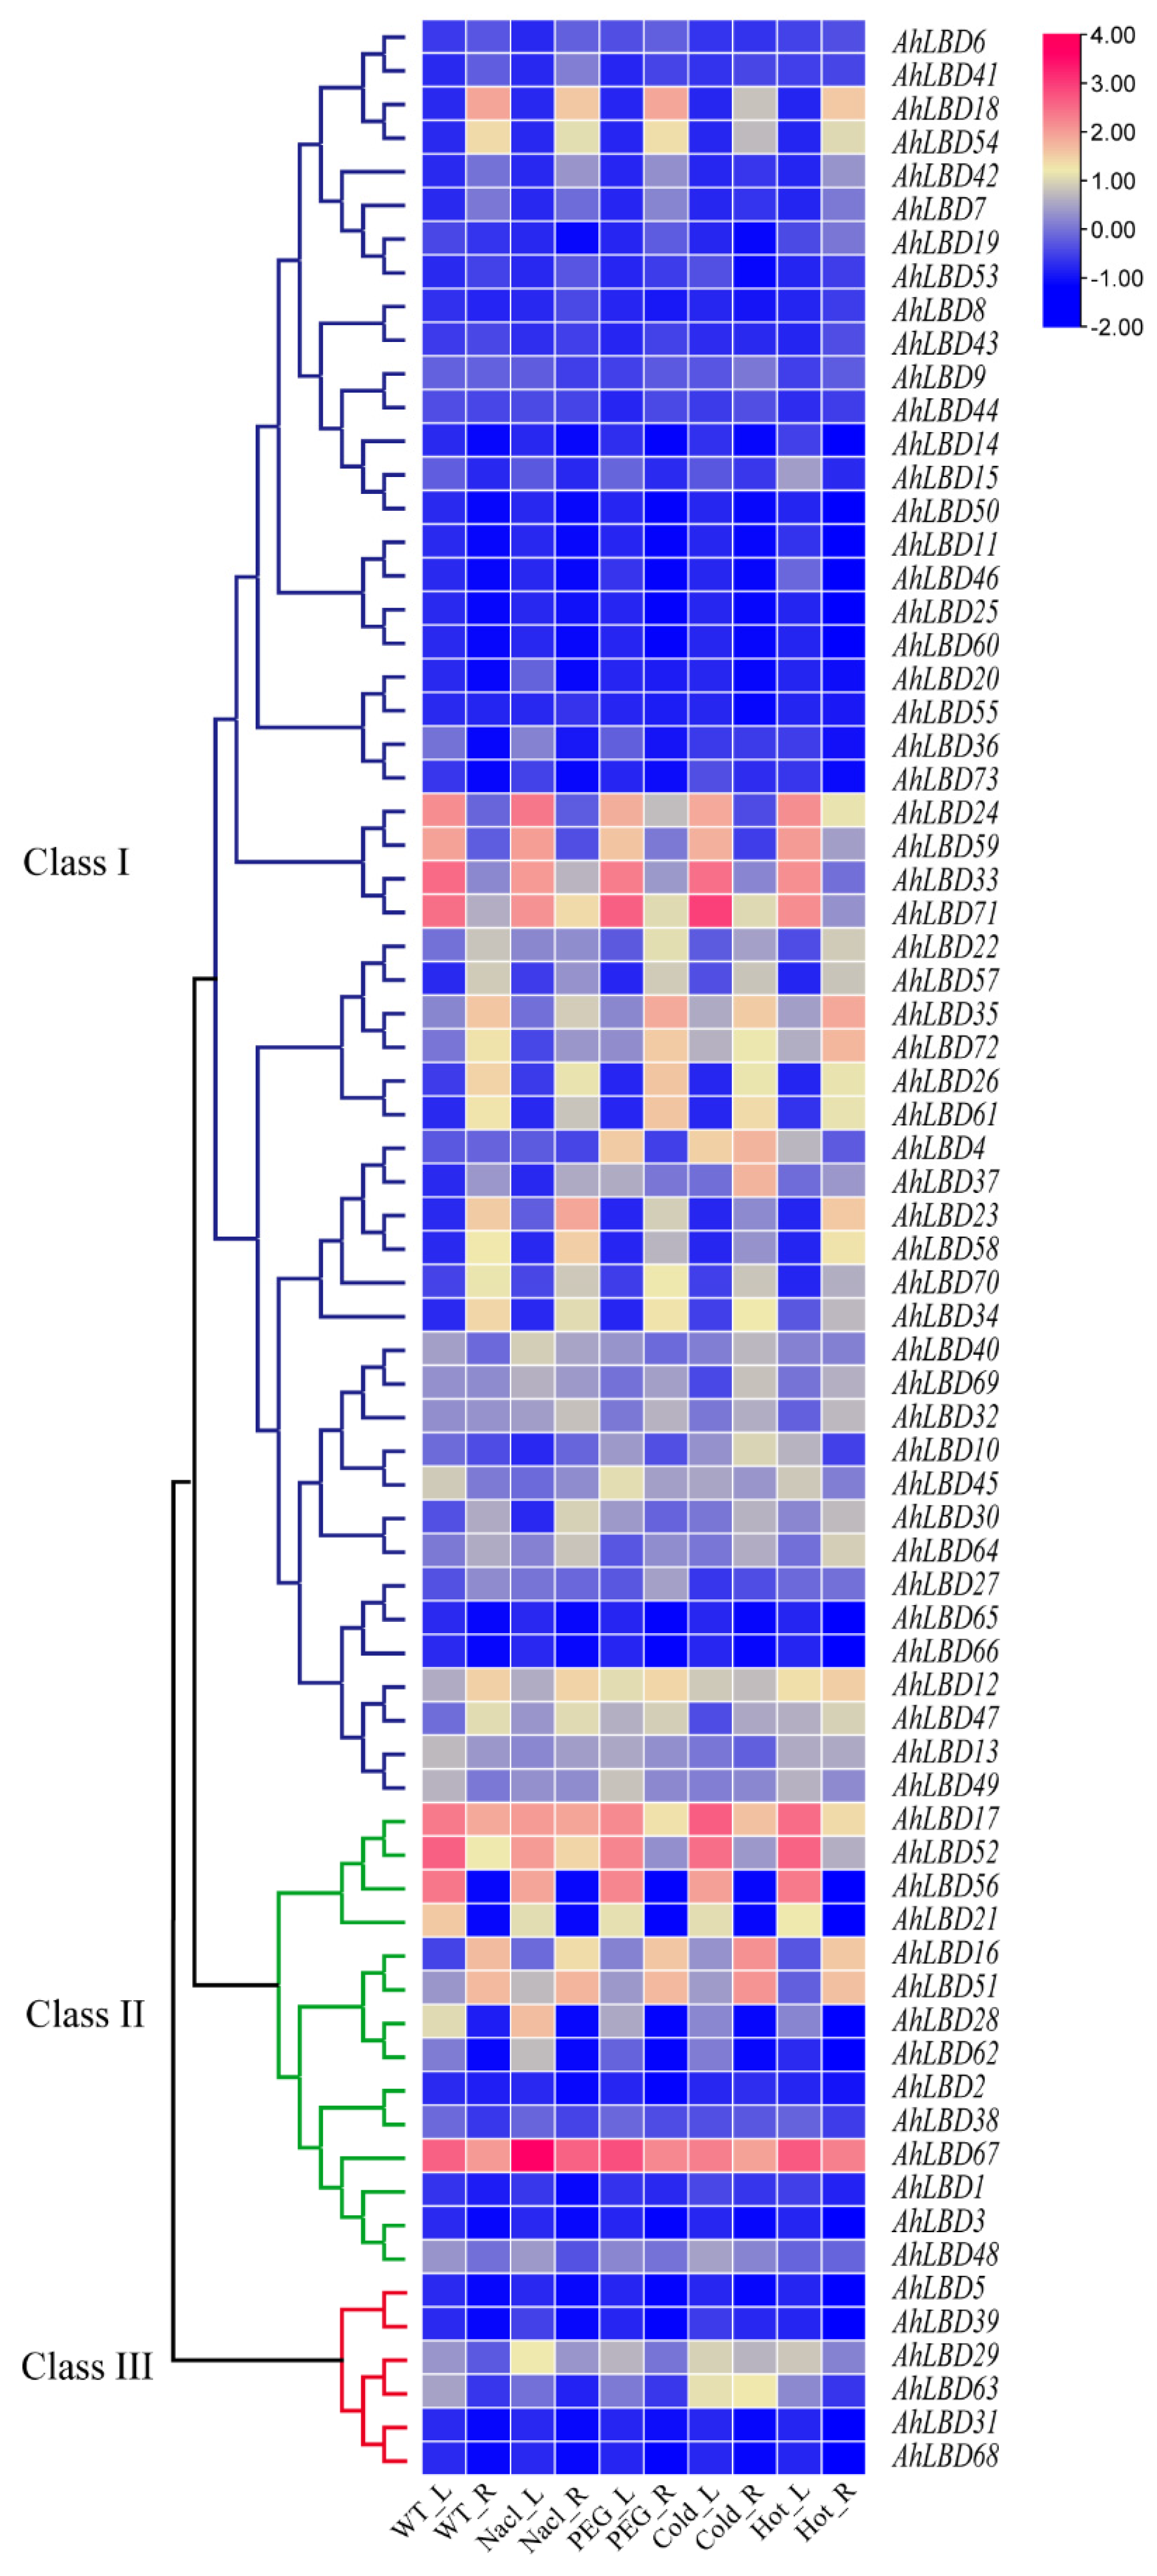
2.10. Expression Profiles of AhLBDs in Different Developmental Stages and Abiotic Stress

To further determine which AhLBD genes potentially function in different tissues, the expression profile of 73 AhLBD members were investigated by using transcriptome data with 21 tissues and organ samples at different developmental stages of A. hypogaea (Tifrunner) (accession: PRJNA291488). The heat map shows the expression of AhLBD genes in different tissues and organs (see Figure 11). The results showed that this family of genes has constitutive, tissue-specific, and low expression patterns, indicating that there is significant diversity in the expression profile of the AhLBD gene family. From the transcriptome heatmap, we eliminated 41 AhLBD genes in the three groups whose FPKM values were almost zero in any tissue or organ.
The traits related to root development included root and nodule roots. The expression levels of AhLBD67, AhLBD52, and AhLBD17 were relatively high in the root (see Figure 11). The traits related to stem development included the vegetative shoot tip. The expression level of AhLBD67 in the stem was much higher than other genes. The traits related to leaf development included MainLeaf, lateral leaf, and leaf. AhLBD71 had the highest expression level in leaves, followed by AhLBD67 and AhLBD33, which also had higher expression levels in leaves. AhLBD71 had the highest expression levels in flowers and pistil, while AhLBD51 and AhLBD67 had higher expression levels in stamen. The expression level of AhLBD51 was much higher in pericarp patee 5 and pericarp pattee 6 than in other genes. Among seed pattee 5, seed pattee 6, seed pattee 7, seed pattee 8, and seed pattee 10, AhLBD67 had the highest expression level. From the expression analysis of the above 21 organs, AhLBD67 had the highest expression level in 11 tissues and organs, including root, nodule roots, vegetative shoot tip, aerial peg, seed pattee 5, seed pattee 6, seed pattee 7, seed pattee 8, and seed pattee 10, indicating that AhLBD67 plays an important role in root, stem, and seed development. Alongside this, AhLBD71 had the highest expression levels in flowers, pistil, MainLeaf, lateral leaf, and leaf, indicating that AhLBD71 might play an important role in reproductive organs and leaves.
The expression level of AhLBD genes under cold (4 °C), heat (37 °C), salt (2% NaCl), and drought (20% PEG6000) stress for 24 h treatment were also detected (see Figure 12). The results showed that some AhLBD members were related to the regulation of abiotic stress, and different genes showed different expression trends. It was mainly concentrated in Class I and Class II for the four abiotic stresses. In addition, the expression of 31 out of all 73 AhLBDs were not detected under any abiotic stress.
Under salt stress, the expression levels of AhLBD67 in roots and leaves were similar and much higher than other genes (see Figure 12). Under drought stress, the expression levels of AhLBD67 in roots and leaves were similar and higher than other genes. AhLBD71, AhLBD33, AhLBD52, and AhLBD17 were expressed much more in roots than in leaves, while AhLBD56 was expressed at 0 in roots but higher in leaves. After high temperature treatment, the expression of AhLBD67 was the highest in roots and leaves, and the expression of AhLBD35 and AhLBD72 was relatively high in roots; AhLBD52, AhLBD17, AhLBD56, AhLBD71, AhLBD24, AhLBD33, and AhLBD59 gene expression was relatively high in leaves. After cold treatment, AhLBD71 had the highest expression level in leaves, followed by AhLBD17, AhLBD52, AhLBD33, and AhLBD67. In roots, AhLBD16, AhLBD51, and AhLBD67 had higher expression levels. In conclusion, AhLBD67, AhLBD71, and AhLBD16 may play an important role in abiotic stress.

2.11. qRT-PCR Identification of 12 Selected AhLBDs in Different Tissues

In order to prove the reliability of the RNA sequencing data, 12 genes with significantly different expression levels during the development period were further selected for qRT-PCR verification (see Figure 13). The expression analysis results of the tested AhLBDs in different tissues were basically consistent with the RNA sequencing data. The expression level of AhLBD12/17/52 genes in roots were significantly higher than that in other tissues. And AhLBD24/59/67/72 genes had significantly higher expression in stems. Alongside this, the expression level of AhLBD33/35/71 were significantly higher in flowers, and AhLBD51 gene had the higher expression in leafs and seed1, while the expression level of AhLBD16 was significantly higher in seed1.

2.12. qRT-PCR Analysis of 12 AhLBDs under Salt and Drought Stresses in Peanut Plants

To further confirm the expression levels of AhLBDs under salt and drought stress, the peanut variety “Qinghua 6” was treated with NaCl and PEG, respectively, and qRT-PCR analysis of 12 AhLBDs was performed (see Figure 14).
Under salt stress, the expression levels of AhLBD12/16/33/52/67/71 genes increased compared with 0 h, while AhLBD17/24/35/51/59/72 decreased compared with 0 h, respectively (see Figure 14A). Among the genes with increased expression, the expression level of AhLBD12/52/71 was the highest at 12 h, respectively, while that of AhLBD16/33/67 were the highest at 24 h. The expression level of AhLBD12/16/33/52/67 increased significantly at 12 h compared with 0 h, and that of AhLBD16/33/67 increased significantly at 24 h. Among the genes whose expression decreased, AhLBD24/51/59/72 genes had the lowest expression level at 3 h, while AhLBD17/35 genes had the lowest expression level at 6 h.
Under drought stress, the expression levels of seven genes (AhLBD24/33/35/59/67/71/72) increased, while the expression levels of five genes (AhLBD12/16/17/51/52) decreased compared with 0 h (see Figure 14B). Among the genes with increased expression, AhLBD59/72 had the highest expression level at 3 h, AhLBD24/33/67/71 had the highest expression level at 12 h, and AhLBD35 had the highest expression level at 24 h. Their expression levels were all significantly increased compared with 0 h. Among the genes with reduced expression, AhLBD51 had the lowest expression at 3 h, AhLBD12/17 had the lowest expression at 6 h, and AhLBD16/52 had the lowest expression at 24 h. In addition, the expression of AhLBD17 at 6 h was significantly lower than that at 0 h, while the expression level of AhLBD16/52 had significantly reduced at 24 h.

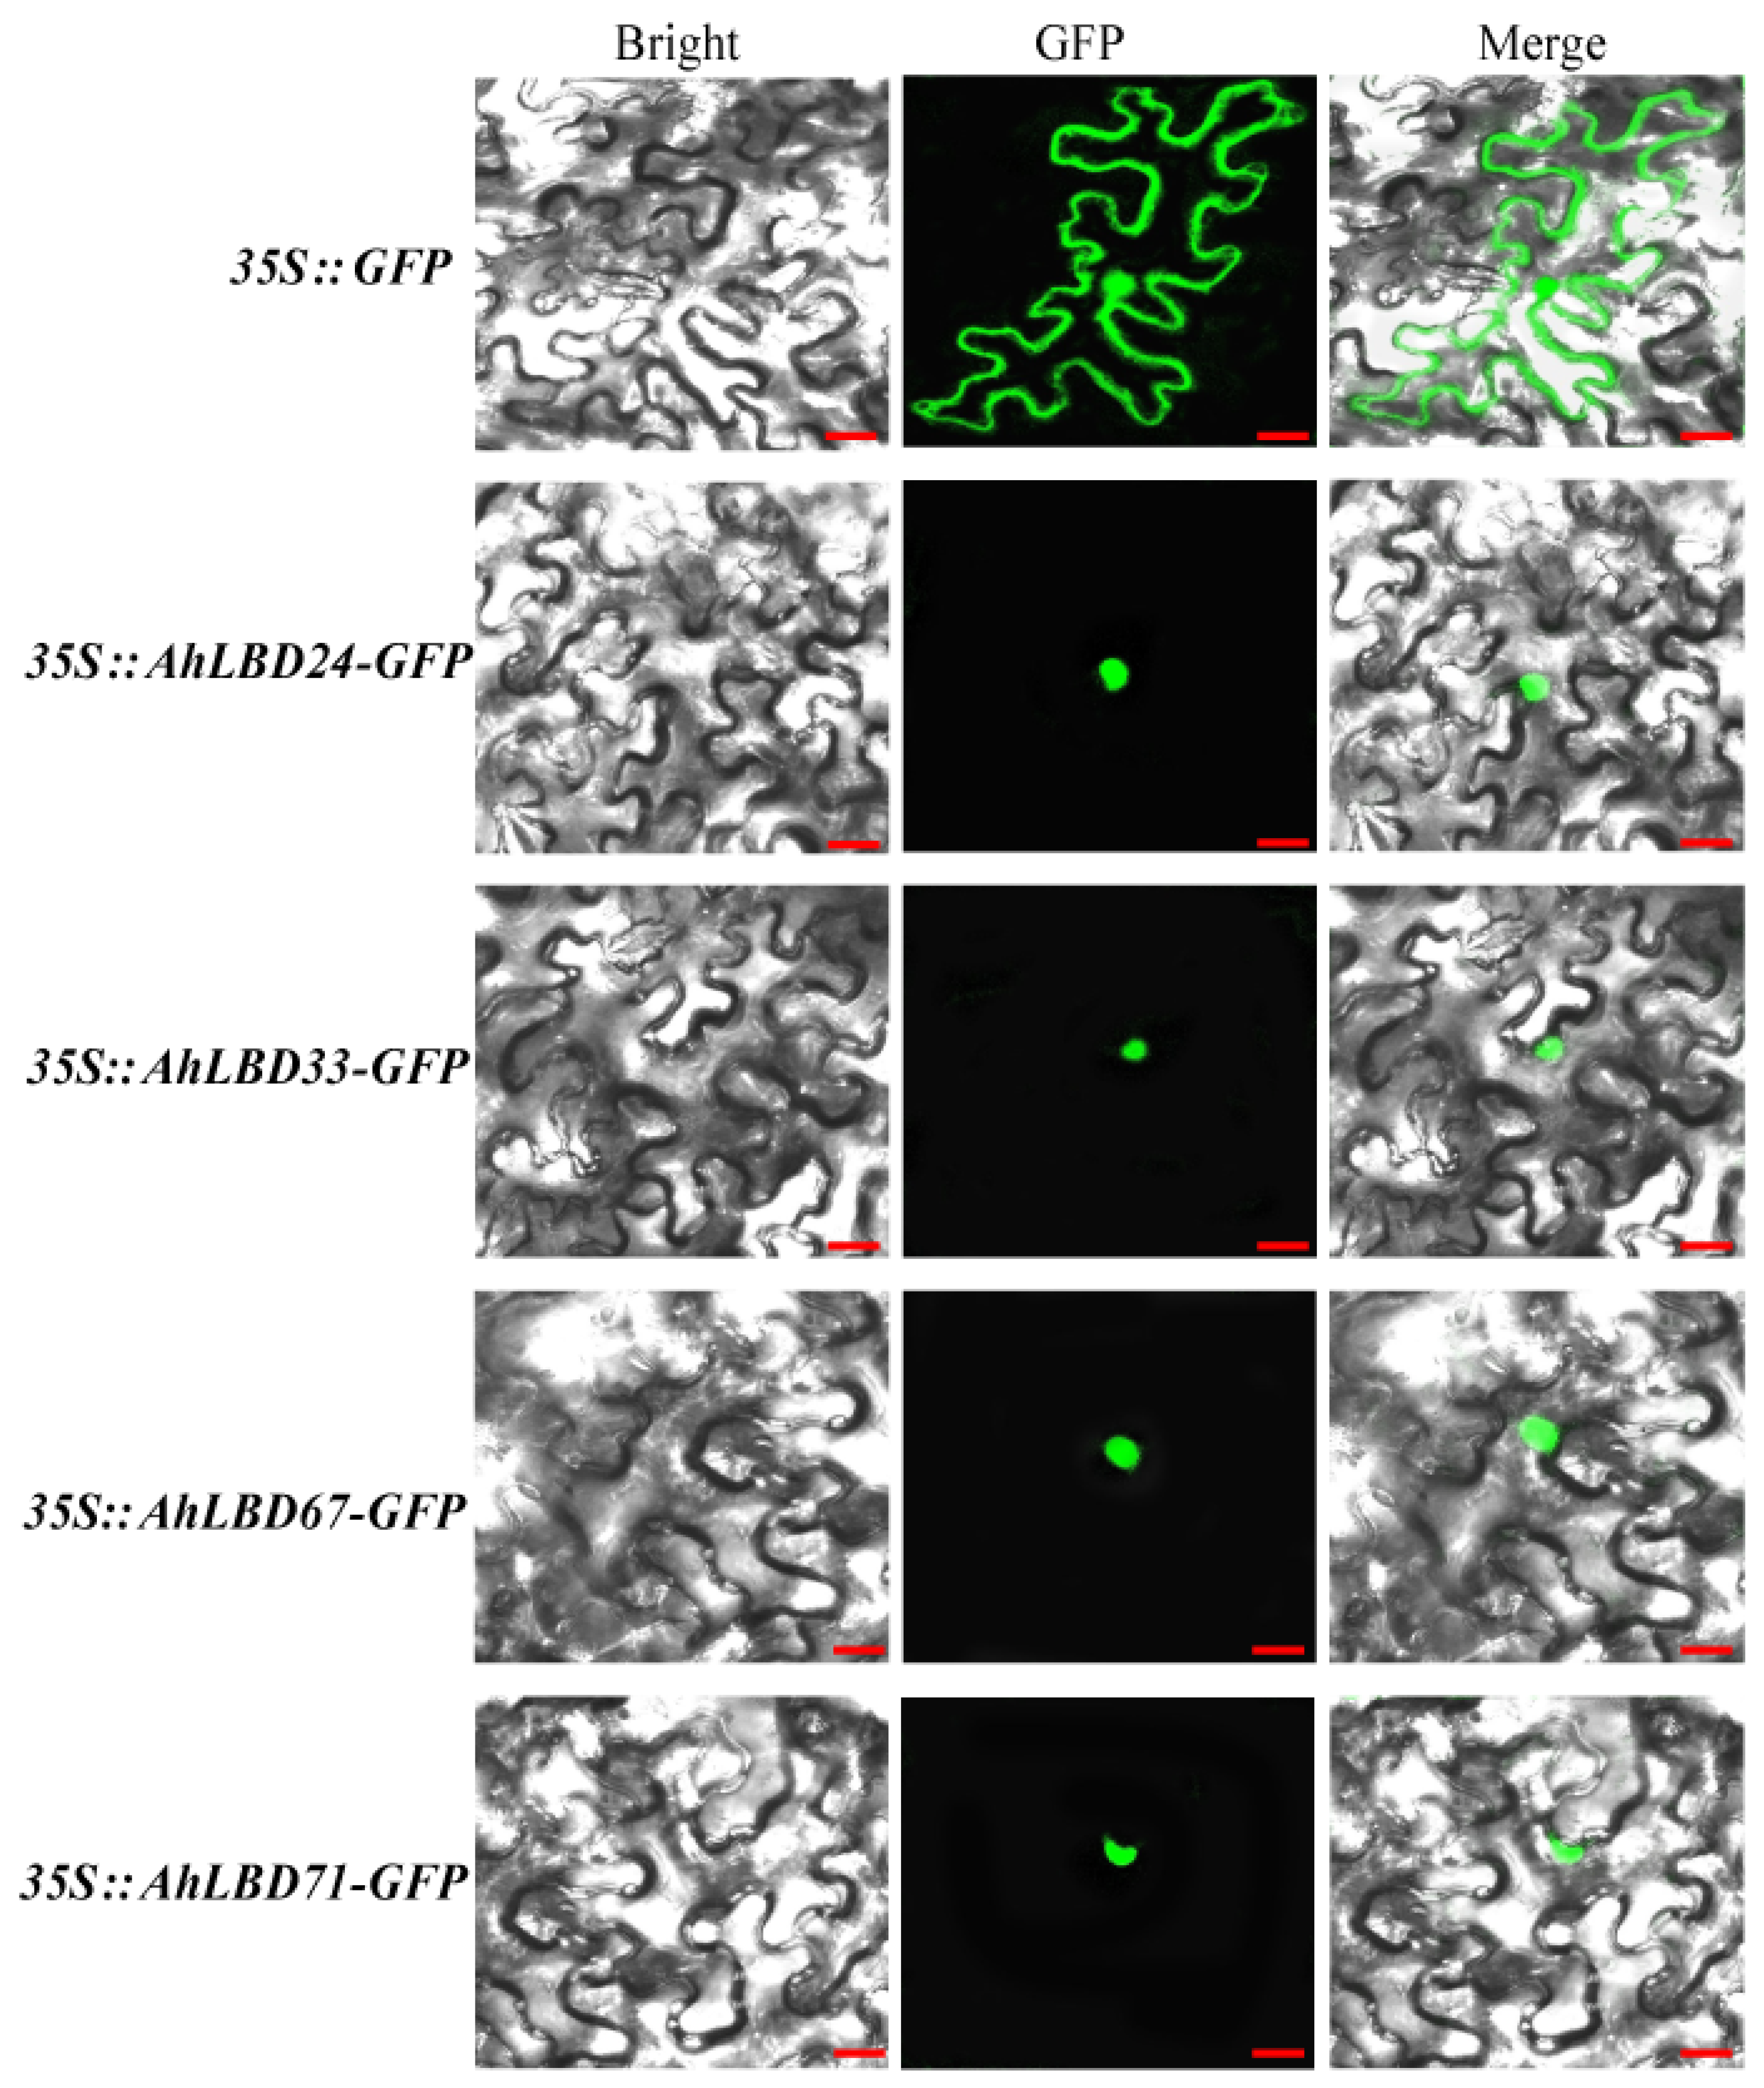
2.13. Subcellular Localization Analysis of Four AhLBDs

As we know, the localization of a protein in a cell is closely related to its function. To explore the function of AhLBD24, AhLBD33, AhLBD67, and AhLBD71, the full-length coding sequences of the above four genes were cloned into the pRI101-35S-GFP vector and transiently transformed in Nicotiana benthamiana leaves. The subcellular localization results showed that the fusion proteins AhLBD24-GFP, AhLBD33-GFP, AhLBD67-GFP, and AhLBD7-GFP were all detected in the nucleus (see Figure 15). This suggested that the four genes function in the nucleus, which is consistent with subcellular localization prediction results (see Table S1).

2.14. Overexpression of AhLBD33 and AhLBD67 in Arabidopsis thaliana and Salt Stress Test

To further verify the functions of AhLBD33 and AhLBD67 genes, three overexpressed Arabidopsis T3 generation homozygous lines were selected for salt stress experiments (see Figure 16). The results showed that under 200 mM NaCl stress treatment, the main root lengths of AhHDZ33 overexpression lines OE1 and OE6 were 3.48 cm and 3.42 cm, respectively, which were significantly longer than WT (2.74 cm). Moreover, the main root length of the OE2 line was 3.55 cm, which was significantly longer than the WT.
In addition, under salt stress treatment, the main root length of AhLBD67 overexpression line OE3 was 3.11cm, which was significantly longer than WT (2.57 cm). Moreover, the main root lengths of OE2 and OE6 lines were 3.34 cm and 3.35 cm, respectively, which were significantly longer than that of the WT by even larger margins.
The above results show that the salt tolerance of Arabidopsis overexpressing AhLBD33 and AhLBD67 was significantly enhanced, indicating that AhLBD33 and AhLBD67 play an important role in the salt tolerance of peanut plants.

3. Discussion

3.1. Comparison of Phylogenetic Relationships between the Peanut Plant LBD Family Genes and Other Species

The LBD protein family is a plant-specific transcription factor that plays an important role in plant growth and development and stress. However, no systematic study of LBD genes has been conducted in peanut plants. In this study, a total of 73 members were identified from the whole genome of the tetraploid peanut cultivar (Tifrunner). Compared with the number of LBD members reported in Arabidopsis thaliana (34) [35], soybean plants (92) [39], corn (44) [41], rice (31) [42], barley (34) [43], Pinus Massoniana (47) [44], Mosobamboo (55) [45], and sweet potato plants (53) [46], peanut plants have the largest number of family members. Combining the analysis of the number of LBD family genes and genome size of each species, we found that there was no correlation between the number of LBD family members and genome size in different species. Moreover, phylogenetic tree analysis showed that the AhLBD gene family was divided into three groups, of which the first group had 53 LBD members, accounting for 72.6%, which was different from other species such as Arabidopsis (see Figure 4). In addition, studies have shown that gene family expansion mainly depends on tandem, fragment and whole genome replication forms [48]. Combined with the analysis of LBD gene family members in these species, it is speculated that this phenomenon may be caused by the different frequency of fragment duplication and tandem duplication among different species during the evolution of the LBD gene family. Furthermore, the collinearity results of peanut plants with monocotyledonous plants (rice and maize) and dicotyledonous plants (Arabidopsisa and soybean) showed that peanut had significantly more collinearity with Arabidopsis and soybean than with rice and corn, indicating that the genetic relationship between peanut and dicotyledonous plants was closer.
Studies had shown that the number of exons of LBD homologous genes in maize and rice was 1–5 and 2–4, respectively [41,42], and the analysis of the gene structure of AhLBDs in this study showed that the number of exons of most genes was also 1–3 (except AhLBD1, AhLBD38, and AhLBD62), indicating that the LBD gene family structure among these species was relatively simple and may be relatively conserved during evolution.

3.2. The Potential Biological Functions of AhLBDs in Peanut Plants

Promoter cis-acting elements were closely related to gene expression regulation [49]. This study found that there are many cis-acting elements in the promoter region of the peanut plant’s LBDs gene, which could be divided into three categories: growth and development related elements, light regulation, and stress response elements. Among them, light regulatory elements were detected in all AhLBD family genes. Abscisic acid responsive elements and anaerobic induction essential elements were also detected in most genes, suggesting that light and abscisic acid might affect the expression of AhLBDs, thereby affecting the growth and development of peanut plants. In addition, it should be noted that AhLBD4, AhLBD29, and AhLBD53 contained more light-responsive elements than other LBD family members in peanut plants, and it was speculated that these genes might respond more strongly to light than other genes. Both AhLBD35 and AhLBD72 in Class I had three drought-inducibility response elements (see Figure 6), and fluorescence quantitative PCR results showed that AhLBD35 and AhLBD72 responded to drought stress, which might be related to the fact that they contain more drought-inducibility cis-acting elements.
In addition, more than half of the top 20 GO items enriched in AhLBDs were related to the development and formation of plant organs (see Figure 9). Moreover, the results of potential interactions between AhLBD and other proteins from the peanut plant showed that AhLBD6/7/14/15/18/19/41/42/44/50/53/54 interacted directly with auxin response factors, suggesting that these genes might be involved in the growth and development of people. So far, many studies have shown that LBD genes also play an important role in abiotic stress response [48,49,50]. The RNA-Seq data and qRT-PCR results in our study both showed that many AhLBD genes responded to salt and drought stress (see Figure 12 and Figure 14). These results indicate that AhLBD genes are widely involved in various abiotic stress responses. In addition, it is well known that roots are the main organs responding to drought and salt stress [51].
In this study, the expression of AhLBD16, AhLBD33, and AhLBD67 was increased by more than 3 times in the roots after 24 h of salt treatment. These genes may be candidate genes for positive regulation of peanut plant salt stress. Compared with 0 h salt treatment, the expression of AhLBD24 and AhLBD51 were significantly down-regulated during 3–6 h salt treatment, and the expression of AhLBD72 was significantly down-regulated during 3–24 h salt treatment. This indicates that these genes may be negative regulatory genes in response to salt stress in peanut plants. This study further confirmed through molecular genetic experiments that heterologous overexpression of AhLBD33 and AhLBD67 in Arabidopsis could significantly enhance tolerance to salt stress.
In addition, at 12 h and 24 h, the expression levels of AhLBD24 and AhLBD71 were upregulated 6 times compared with that of before treatment; the expression levels of AhLBD33 and AhLBD67 were upregulated 3 and 4 times, respectively; and the expression level of AhLBD35 was also upregulated 3 times. This indicates that these genes are candidate genes for the positive regulation of peanut plant drought stress.
Furthermore, subcellular localization results showed that AhLBD24, AhLBD33, AhLBD67, and AhLBD71 were nuclear-localized genes, further proving that these genes are very likely to play the role of transcription factors in abiotic stress. Previous studies have shown that LBD genes of multiple species are significantly upregulated under different abiotic stresses. For example, Ta-6B-LBD 81, Ta-4B-LBD51, and Ta-U-LBD90 were found to be upregulated under salt stress, while Ta-2A-LBD13, Ta-2B-LBD15, and Ta-2D-LBD18 were found to be upregulated under drought stress [52]. Moreover, potato genes StLBD2-6 and SLBD3-5 were found to be significantly upregulated under drought stress [40]. In conclusion, AhLBD genes showed different responses to salt stress and drought stress. Although the molecular mechanism of AhLBD involved in abiotic stress response are still unclear, this study has provided a key candidate gene for further resistance research in peanut plants.

4. Materials and Methods

4.1. Identification and Physicochemical Properties of the AhLBD Gene Family

The A. hypogaea Tifrunner genome v2.0 was used in this study. The protein sequences of AtLBD family genes were obtained from the TAIR database (https://www.arabidopsis.org/, accessed on 15 March 2024). The genomic data and GFF3 file of A. hypogaea were obtained from the PeanutBase website (https://dev.peanutbase.org/, accessed on 15 March 2024). All AtLBD protein sequences were used as the queries to perform a BLASTP search against the local protein database of A. hypogaea with an e-value 1e-10and identity of 50% as the threshold. Furthermore, the LBD domain (PF03195) obtained from the PFAM database (http://pfam.xfam.org/, accessed on 15 March 2024) was used as the query for the hidden Markov model (HMM) search using the HMMER 3.0 program (http://hmmer.org/, accessed on 15 March 2024) [53]. The AhLBD protein sequences identified by blast and HMM searching were integrated and parsed by manual editing to remove redundancy, and the remaining genes were considered as the putative AhLBDs. The ExPASy ProtParam tool (http://web.expasy.org/protparam/, accessed on 15 March 2024) was used to predict protein physicochemical parameters [54]. Alongside this, the subcellular location of AhLBDs was predicted by WOLF–PSORT (https://wolfpsort.hgc.jp/, accessed on 15 March 2024) [55] and CELLO ver.2.5 (http://cello.life.nctu.edu.tw/, accessed on 15 March 2024) [56].

4.2. Phylogenetic Analysis of AhLBD Proteins

ClustalW software in MEGA11.0 was employed for a multiple sequence alignment of LBD protein sequences between the peanut plant and Arabidopsis. The phylogenetic tree was constructed with the Maximum Likelihood method with 1000 bootstrap replications using MEGA11.0 [57]. The trees were further modified using EvolView (https://www.evolgenius.info/evolview, accessed on 15 March 2024) [58].

4.3. Analysis of Chromosome Location and Synteny Analysis of AhLBDs

The length of each chromosome and the position information of AhLBDs on chromosomes were extracted from the GFF3 file of A. hypogaea, and then mapped by Mapchart [59]. The synteny relationship of LBDs between peanut plants and Arabidopsis, soybean plants, rice, and maize were performed by using MCScanX (https://github.com/wyp1125/MCScanX, accessed on 20 April 2024) [60]. Circos and the dual synteny plot tool in TBtools-II (v2.043) were used for visualized mapping of the collinear gene pairs [61].

4.4. Gene Structure, Conserved Motif, and Promoter Cis-Element Analysis

The exon–intron distributions for all AhLBD genes were obtained using GFF3 annotation files from the A. hypogaea genome. Conserved amino acid sequences of LBD proteins were analyzed using the online MEME tool (http://meme-suite.org/, accessed on 15 March 2024) [62]. MEME analysis parameters included a minimum width ≥6, a maximum width of 50, and a motif number of 10, and all other parameters were set to default values. The 2000 bp upstream sequences of the start codon (ATG) of AhLBDs were chosen to identify the cis-acting elements in the putative promoter regions, which were identified with the online program PlantCARE (http://bioinformatics.psb.ugent.be/webtools/plantcare/html/, accessed on 15 March 2024) [63]. The phylogenetic tree along with cis-acting elements was visualized by using TBtools-II (v2.043)software [61].

4.5. Protein–Protein Interaction Network and Gene Ontology (GO) Analysis of AhLBDs

We downloaded the Arabidopsis protein database and the Arabidopsis protein interaction relationship file from the STRING database (https://stringdb.org/, accessed on 15 March 2024). We then used TBtools-II software to compare and screen the AhLBD family peanut plant interaction protein network file through the Arabidopsis protein interaction relationship file [61]. Finally, we used Cytoscape software (v3.10.2) to visualize the interaction protein network [64]. The file of go-basic.obo was downloaded from the website (http://purl.obolibrary.org/obo/go/go-basic.obo/, accessed on 15 March 2024). GO annotation was analyzed using TBtools-II(v2.043) [61] and visualized with the online software tool (https://www.bioinformatics.com.cn/, accessed on 15 March 2024) [65].

4.6. RNA-Seq Based Expression Profiling of AhLBDs

The RNA-seq data of 21 distinct tissue types and developmental stages (vegetative shoot tip, reproductive shoot tip, root, nodule roots, flowers, pisti, stamen, aerial peg, subterranean peg, MainLeaf, lateral leaf, leaf, pod pattee 3, pericarp pattee 5, pericarp pattee 6, seed pattee 5, seed pattee 6, seed pattee 7, seed pattee 8, seed pattee 10, and gyn tip stalk) (accession: PRJNA291488), along with cold (4 °C), heat (37 °C), salt (2%Nacl) and drought (20% PEG6000) treatments (accession: PRJNA553073) were downloaded from NCBI database (https://www.ncbi.nlm.nih.gov/, accessed on 15 March 2024). All gene expression levels were normalized using log2(FPKM+1). The heat maps were generated through TBtools-II (v2.043)software [61].

4.7. Plant Material, Abiotic Stress Treatments and qRT-PCR Analysis

A. hypogea cultivar “QingHua 6” was grown in the experimental field at the Institute of Cotton Research of Shanxi Agricultural University (Yuncheng, China). Peanut plant tissue samples at different developmental stages were collected, including root, stem, young leaves at the seedling stage, and flower at the flowering stage, and seeds developed 40 and 70 days after flowering were collected.
QingHua 6 was also grown in a greenhouse with 24–26 °C (16 h light/8 h dark). Six leaf seedlings of peanut plants were grown in 1/2 Hoagland solution and were treated with salt (2% NaCl) and drought (30% PEG6000). PEG6000 is an ideal osmotic regulator for simulating drought stress [66]. The control was collected without any treatment at the same stage. The roots were collected at different time points (3, 6, 12, and 24 h after treatment), frozen in liquid nitrogen immediately, and then stored at −80 °C until RNA extraction. Three replicate samples for each treatment were collected.
To further evaluate the expression patterns of the selected AhLBD genes in different peanut plant tissues and various abiotic stresses, RNA was extracted using an RNAprep Pure Plant Kit (Tiangen, Beijing, China) and first-strand cDNA was synthesized using a Prime Script® RT reagent kit (Takara, Dalian, China). qRT-PCR was carried out with three biological replicates using a TBGreen Premix Ex Taq Kit (Takara, Dalian, China) on an Applied Biosystems QuantStudio 5 Real-time PCR System (ABI, Thermo Fisher Scientific, USA). AhACT11 (Ah10g066400.1) was used as an endogenous control for qRT-PCR. Relative gene expression levels were calculated using the 2−ΔΔCT method [67]. The primers for qRT-PCR are listed in Table S3.

4.8. Subcellular Localization Assay

For subcellular localization, the full-length coding sequences of genes AhLBD24, AhLBD33, AhLBD67, and AhLBD71 were cloned and ligated into the pRI101-35S-GFP vector (primers listed in Table S3), while the empty pRI101-35S-GFP vector was used as a control. The fusion vector was then transformed into Agrobacterium tumefaciens strain GV3101. Agrobacterium-mediated transient transformation of Nicotiana benthamiana leaves was applied according to Sparkes et al. (2006) [68]. The injected tobacco leaves were cultured for 36–48 h. The GFP fluorescence in the leaves was observed using confocal microscopy (Leica, SP8, Germany), GFP was excited at 488 nm and captured at 500–530 nm.

4.9. Transformation of Arabidopsis thaliana Overexpressing AhLBD33 and AhLBD67 and Salt Stress

The AhLBD33 and AhLBD67 subcellular localization vectors constructed above were used as overexpression vectors and transformed into Agrobacterium tumefaciens strain GV3101. Arabidopsis thaliana (Columbia ecotype) was inoculated using the floral dipping method [69]. After inoculation, the plants were dark-treated for 24 h and then transferred to an incubator for growth at 20–22 °C with 16 h of light/8 h of darkness. They were inoculated again after 7 days until the T0 generation seeds were harvested. Positive strains of T0-T3 generation seeds were screened on 1/2 MS solid culture plates containing Kan+ (50 μg/mL). Three T3 generation overexpression transgenic lines and wild-type materials were selected. When they were grown on the non-resistant 1/2 MS medium for 5 days, the uniformly growing seedlings were transferred to a new square plate containing 1/2 MS medium containing 200 mmol/L NaCl. Each square plate contained three homozygous overexpression lines and WT, with three replicates. A total of 10 seedlings were transferred to each replicate for stress testing. After 7 days of vertical cultivation in a light incubator, the taproot was photographed and the root length was measured using ImageJ software. (https://imagej.net/ij/download.html, accessed on 20 April 2024).

5. Conclusions

In this study, the LBD gene family of peanut plants was systematically identified and analyzed. A total of 73 AhLBDs were identified and divided into three groups by phylogenetic tree analysis. Gene structure and conserved protein motif analysis supported the evolutionary conservation of AhLBDs. The chromosomal locations, gene duplications, promoters, and PPI network of the peanut LBD genes were also investigated. Gene expression profiling and qRT-PCR analysis showed that different genes have different responses to salt and drought stresses. There were also differences in expression patterns. AhLBD24, AhLBD33, AhLBD67, and AhLBD71 were all located in the nucleus, which indicated that these genes play a role as transcription factors in plant growth and abiotic stress. Heterologous overexpression of AhLBD33 and AhLBD67 could significantly enhance the salt tolerance of transgenic Arabidopsis. These results provide important candidate genes and a theoretical basis for studying the molecular mechanism for abiotic stress in peanut plants.

Supplementary Materials

The following supporting information can be downloaded at: https://www.mdpi.com/article/10.3390/ijms251910561/s1.

Author Contributions

Methodology, C.W. and P.L.; conceptualization, R.W., L.Y. and G.L.; software, B.H. and R.W.; formal analysis, L.Y. and Z.P.; investigation, G.L. and B.L.; resources, C.W. and P.L.; data curation, Z.X., C.C. and Z.P.; writing-original draft preparation, C.W. and P.L.; writing review and editing, C.W. and B.H.; funding acquisition, C.W. and P.L. All authors have read and agreed to the published version of the manuscript.

Funding

This work was supported by Doctoral Fund Project of Cotton Research Institute of Shanxi Agricultural University (SBSJJ2023-02), Sub-topic of Shanxi Province Science and Technology Major Special Plan (202201140601025-4-03).

Institutional Review Board Statement

Not applicable.

Informed Consent Statement

Not applicable.

Data Availability Statement

The data presented in this study are available in the article.

Conflicts of Interest

The authors declare that they have no conflicts of interest.

References

  1. Husted, L. Chromosome number in species of peanut, Arachis. Am. Nat. 1931, 65, 476–477. [Google Scholar] [CrossRef]
  2. Moretzsohn, M.C.; Hopkins, M.S.; Mitchell, S.E.; Kresovich, S.; Valls, J.F.; Ferreira, M.E. Genetic diversity of peanut (Arachis hypogaea L.) and its wild relatives based on the analysis of hypervariable regions of the genome. BMC Plant Biol. 2004, 4, 11. [Google Scholar] [CrossRef] [PubMed]
  3. Zhuang, W.; Chen, H.; Yang, M.; Wang, J.; Pandey, M.K.; Zhang, C.; Chang, W.C.; Zhang, L.; Zhang, X.; Tang, R.; et al. The genome of cultivated peanut provides insight into legume karyotypes, polyploid evolution and crop domestication. Nat. Genet. 2019, 51, 865–876. [Google Scholar] [CrossRef]
  4. Jiang, X.; Xu, J.; Pan, L.J.; Chen, N.; Wang, T.; Jiang, X.D.; Yin, Z.X.; Yang, Z.; Yu, S.L.; Chi, X.Y. Peanut yield-related traits and meteorological factors correlation analysis in multiple environments. Acta Agron. Sin. 2023, 49, 3110–3121. [Google Scholar]
  5. Eynard, A.; Lal, R.; Wiebe, K. Crop response in salt-affected soils. J. Sustain. Agric. 2005, 27, 5–50. [Google Scholar] [CrossRef]
  6. Bertioli, D.J.; Cannon, S.B.; Froenicke, L.; Huang, G.; Farmer, A.D.; Cannon, E.K.; Liu, X.; Gao, D.; Clevenger, J.; Dash, S.; et al. The genome sequences of Arachis duranensis and Arachis ipaensis, the diploid ancestors of cultivated peanut. Nat. Genet. 2016, 48, 438–446. [Google Scholar] [CrossRef]
  7. Chen, X.; Lu, Q.; Liu, H.; Zhang, J.; Hong, Y.; Lan, H.; Li, H.; Wang, J.; Liu, H.; Li, S.; et al. Sequencing of Cultivated Peanut, Arachis hypogaea, Yields Insights into Genome Evolution and Oil Improvement. Mol. Plant. 2019, 12, 920–934. [Google Scholar] [CrossRef]
  8. Bertioli, D.J.; Jenkins, J.; Clevenger, J.; Dudchenko, O.; Gao, D.; Seijo, G.; Leal-Bertioli, S.C.M.; Ren, L.; Farmer, A.D.; Pandey, M.K.; et al. The genome sequence of segmental allotetraploid peanut Arachis hypogaea. Nat. Genet. 2019, 51, 877–884. [Google Scholar] [CrossRef]
  9. Latchman, D.S. Introductory overview-transcription factors: An overview. Int. J. Biochem. Cell Biol. 1997, 29, 1305–1312. [Google Scholar] [CrossRef]
  10. Zhang, Y.W.; Li, Z.W.; Ma, B.; Hou, Q.C.; Wan, X.Y. Phylogeny and functions of LOB domain proteins in plants. Int. J. Mol. Sci. 2020, 21, 2278. [Google Scholar] [CrossRef]
  11. Chen, W.F.; Wei, X.-B.; Rety, S.; Huang, L.Y.; Liu, N.N.; Dou, S.X.; Xi, X.G. Structural analysis reveals a “molecular calipers” mechanism for a LATERAL ORGAN BOUNDARIES DOMAIN transcription factor protein from wheat. J. Biol. Chem. 2019, 294, 142–156. [Google Scholar] [CrossRef] [PubMed]
  12. Shuai, B.; Reynaga-Peña, C.G.; Springer, P.S. The Lateral Organ Boundaries gene defines a novel, plant-specific gene family. Plant Physiol. 2002, 129, 747–761. [Google Scholar] [CrossRef] [PubMed]
  13. Majer, C.; Hochholdinger, F. Defining the boundaries: Structure and function of LOB domain proteins. Trends Plant Sci. 2011, 16, 47–52. [Google Scholar] [CrossRef]
  14. Yang, Y.; Yu, X.; Wu, P. Comparison and evolution analysis of two rice subspecies LATERAL ORGAN BOUNDARIES domain gene family and their evolutionary characterization from Arabidopsis. Mol. Phylogenet. Evol. 2006, 39, 248–262. [Google Scholar] [CrossRef] [PubMed]
  15. Iwakawa, H.; Ueno, Y.; Semiarti, E.; Onouchi, H.; Kojima, S.; Tsukaya, H.; Hasebe, M.; Soma, T.; Ikezaki, M.; Machida, C.; et al. The ASYMMETRIC LEAVES2 gene of Arabidopsis thaliana, required for formation of a symmetric flat leaf lamina, encodes a member of a novel family of proteins characterized by cysteine repeats and a leucine zipper. Plant Cell Physiol. 2002, 43, 467–478. [Google Scholar] [CrossRef] [PubMed]
  16. Lu, Q.; Shao, F.; Macmillan, C.; Wilson, I.W.; Merwe, K.; Hussey, S.G.; Myburg, A.A.; Dong, X.; Qiu, D. Genome wide analysis of the lateral organ boundaries domain gene family in Eucalyptus grandis reveals members that differentially impact secondary growth. Plant Biotechnol. J. 2018, 16, 124–136. [Google Scholar] [CrossRef]
  17. Semiarti, E.; Ueno, Y.; Tsukaya, H.; Iwakawa, H.; Machida, C.; Machida, Y. The ASYMMETRIC LEAVES2 gene of Arabidopsis thaliana regulates formation of a symmetric lamina, establishment of venation and repression of meristem-related homeobox genes in leaves. Development 2001, 128, 1771–1783. [Google Scholar] [CrossRef]
  18. Iwakawa, H.; Iwasaki, M.; Kojima, S.; Ueno, Y.; Soma, T.; Tanaka, H.; Semiarti, E.; Machida, Y.; Machida, C. Expression of the ASYMMETRIC LEAVES2 gene in the adaxial domain of Arabidopsis leaves represses cell proliferation in this domain and is critical for the development of properly expanded leaves. Plant J. 2007, 51, 173–184. [Google Scholar] [CrossRef]
  19. Goh, T.; Toyokura, K.; Yamaguchi, N.; Okamoto, Y.; Uehara, T.; Kaneko, S.; Takebayashi, Y.; Kasahara, H.; Ikeyama, Y.; Okushima, Y.; et al. Lateral root initiation requires the sequential induction of transcription factors LBD16 and PUCHI in Arabidopsis thaliana. New Phytol. 2019, 224, 749–760. [Google Scholar] [CrossRef]
  20. Yu, P.; Gutjahr, C.; Li, C.; Hochholdinger, F. Genetic control of lateral root formation in cereals. Trends Plant Sci. 2016, 21, 951–961. [Google Scholar] [CrossRef]
  21. Zentella, R.; Zhang, Z.L.; Park, M.; Thomas, S.G.; Endo, A.; Murase, K.; Fleet, C.M.; Jikumaru, Y.; Nambara, E.; Kamiya, Y.; et al. Global analysis of DELLA direct targets in early gibberellin signaling in Arabidopsis. Plant Cell 2007, 19, 3037–3057. [Google Scholar] [CrossRef]
  22. Naito, T.; Yamashino, T.; Kiba, T.; Koizumi, N.; Kojima, M.; Sakakibara, H.; Mizuno, T. A link between cytokinin and ASL9 (Asymmetric Leaves 2 Like 9) that belongs to the AS2/LOB (Lateral Organ Boundaries) family genes in Arabidopsis thaliana. Biosci. Biotechnol. Biochem. 2007, 71, 1269–1278. [Google Scholar] [CrossRef]
  23. Lee, H.W.; Kim, N.Y.; Lee, D.J.; Kim, J.M. LBD18/ASL20 regulates lateral root formation in combination with LBD16/ASL18 downstream of ARF7 and ARF19 in Arabidopsis. Plant Physiol. 2009, 151, 1377–1389. [Google Scholar] [CrossRef]
  24. Liu, H.; Wang, S.; Yu, X.; Yu, J.; He, X.; Zhang, S.; Shou, H.; Wu, P. ARL1, a LOB-domain protein required for adventitious root formation in rice. Plant J. 2005, 43, 47–56. [Google Scholar] [CrossRef]
  25. Thatcher, L.F.; Kazan, K.; Manners, J.M. Lateral organ boundaries domain transcription factors: New roles in plant defense. Plant Signal. Behav. 2012, 7, 1702–1704. [Google Scholar] [CrossRef]
  26. Li, C.; Zhu, S.; Zhang, H.; Chen, L.; Cai, M.; Wang, J.; Chai, J.; Wu, F.; Cheng, Z.; Guo, X.; et al. OsLBD37 and OsLBD38, two class II type LBD proteins, are involved in the regulation of heading date by controlling the expression of Ehd1 in rice. Biochem. Biophys. Res. Commun. 2017, 486, 720–725. [Google Scholar] [CrossRef]
  27. Xu, C.; Luo, F.; Hochholdinger, F. LOB domain proteins: Beyond lateral organ boundaries. Trends Plant Sci. 2016, 21, 159–167. [Google Scholar] [CrossRef]
  28. Wang, L.; Wang, W.; De-Yang, X.U.; Chang, Z.Y.; Cui, X.F. Overexpression of Arabidopsis ASL25/LBD28 Gene Affects Leaf Morphogenesis. Acta Bot. Boreali-Occident. Sin. 2010, 30, 888–893. [Google Scholar]
  29. Ohashi-Ito, K.; Iwamoto, K.; Fukuda, H. LOB DOMAIN-CONTAINING PROTEIN 15 positively regulates expression of VND7, a master regulator of tracheary elements. Plant Cell Physiol. 2018, 59, 989–996. [Google Scholar] [CrossRef]
  30. Cho, C.; Jeon, E.; Pandey, S.K.; Ha, S.H.; Kim, J. LBD13 positively regulates lateral root formation in Arabidopsis. Planta 2019, 249, 1251–1258. [Google Scholar] [CrossRef]
  31. Okushima, Y.; Fukaki, H.; Onoda, M.; Theologis, A.; Tasaka, M. Arf7 and arf19 regulate lateral root formation via direct activation of LBD/ASL genes in Arabidopsis. Plant Cell 2007, 19, 118–130. [Google Scholar] [CrossRef] [PubMed]
  32. Thatcher, L.F.; Powell, J.J.; Aitken, A.B.; Kazan, K.; Manners, J.M. The lateral organ boundaries domain transcription factor LBD20 functions in fusarium wilt susceptibility and jasmonate signaling in Arabidopsis. Plant Physiol. 2012, 160, 407–418. [Google Scholar] [CrossRef] [PubMed]
  33. Lee, K.H.; Du, Q.; Zhuo, C.; Qi, L.; Wang, H. LBD29-involved auxin signaling represses NAC master regulators and fiber wall biosynthesis. Plant Physiol. 2019, 181, 595–608. [Google Scholar] [CrossRef]
  34. Chalfun-Junior, A.; Franken, J.; Mes, J.J.; Marsch-Martinez, N.; Pereira, A.; Angenent, G.C. ASYMMETRIC LEAVES2-LIKE1 gene, a member of the AS2/LOB family, controls proximal-distal patterning in Arabidopsis petals. Plant Mol. Biol. 2005, 57, 559–575. [Google Scholar] [CrossRef] [PubMed]
  35. Rubin, G.; Tohge, T.; Matsuda, F.; Saito, K.; Scheible, W.R. Members of the LBD Family of Transcription Factors Repress Anthocyanin Synthesis and Affect Additional Nitrogen Responses in Arabidopsis. Plant Cell 2009, 21, 3567–3584. [Google Scholar] [CrossRef]
  36. Zhang, J.R.; Tang, W.; Huang, Y.L.; Niu, X.L.; Zhao, Y.; Han, Y.; Liu, Y.S. Down-regulation of a LBD-like gene, OsIG1, leads to occurrence of unusual double ovules and developmental abnormalities of various floral organs and megagametophyte in rice. J. Exp. Bot. 2015, 66, 99–112. [Google Scholar] [CrossRef]
  37. Albinsky, D.; Kusano, M.; Higuchi, M.; Hayashi, N.; Kobayashi, M.; Fukushima, A.; Mori, M.; Ichikawa, T.; Matsui, K.; Kuroda, H.; et al. Metabolomic screening applied to rice FOX Arabidopsis lines leads to the identification of a gene changing nitrogen metabolism. Mol. Plant. 2010, 3, 125–142. [Google Scholar] [CrossRef]
  38. Li, B.; Liu, D.; Li, Q.; Mao, X.; Li, A.; Wang, J.; Chang, X.; Jing, R. Overexpression of wheat gene TaMOR improves root system architecture and grain yield in Oryza sativa. J. Exp. Bot. 2016, 67, 4155–4167. [Google Scholar] [CrossRef]
  39. Yang, H.; Shi, G.; Du, H.; Wang, H.; Zhang, Z.; Hu, D.; Wang, J.; Huang, F.; Yu, D. Genome-Wide Analysis of Soybean LATERAL ORGAN BOUNDARIES Domain-Containing Genes: A Functional Investigation of GmLBD12. Plant Genome 2017, 10, 1–10. [Google Scholar] [CrossRef]
  40. Liu, H.; Cao, M.; Chen, X.; Ye, M.; Zhao, P.; Nan, Y.; Li, W.; Zhang, C.; Kong, L.; Kong, N.; et al. Genome-Wide Analysis of the Lateral Organ Boundaries Domain (LBD) Gene Family in Solanum tuberosum. Int. J. Mol. Sci. 2019, 20, 5360. [Google Scholar] [CrossRef]
  41. Zhang, Y.M.; Zhang, S.Z.; Zheng, C.C. Genomewide analysis of LATERAL ORGAN BOUNDARIES Domain gene family in Zea mays. J. Genet. 2014, 93, 79–91. [Google Scholar] [CrossRef]
  42. Zhao, D.; Chen, P.; Chen, Z.; Zhang, L.; Wang, Y.; Xu, L. Genome-wide analysis of the LBD family in rice: Gene functions, structure and evolution. Comput. Biol. Med. 2023, 153, 106452. [Google Scholar] [CrossRef]
  43. Guo, B.J.; Wang, J.; Lin, S.; Tian, Z.; Zhou, K.; Luan, H.Y.; Lyu, C.; Zhang, X.Z.; Xu, R.G. A genome-wide analysis of the ASYMMETRIC LEAVES2/LATERAL ORGAN BOUNDARIES (AS2/LOB) gene family in barley (Hordeum vulgare L.). J. Zhejiang Univ. Sci. B 2016, 17, 763–774. [Google Scholar] [CrossRef]
  44. Zhang, C.; Zhu, P.; Zhang, M.; Huang, Z.; Hippolyte, A.R.; Hou, Y.; Lou, X.; Ji, K. Identification, Classification and Characterization of LBD Transcription Factor Family Genes in Pinus massoniana. Int. J. Mol. Sci. 2022, 23, 13215. [Google Scholar] [CrossRef]
  45. Huang, B.; Huang, Z.; Ma, R.; Ramakrishnan, M.; Chen, J.; Zhang, Z.; Yrjälä, K. Genome-wide identification and expression analysis of LBD transcription factor genes in Moso bamboo (Phyllostachys edulis). BMC Plant Biol. 2021, 21, 296. [Google Scholar] [CrossRef]
  46. Shi, L.; Lin, X.; Tang, B.; Zhao, R.; Wang, Y.; Lin, Y.; Wu, L.; Zheng, C.; Zhu, H. Genome-Wide Analysis of the Lateral Organ Boundaries Domain (LBD) Gene Family in Sweet Potato (Ipomoea batatas). Genes 2024, 15, 237. [Google Scholar] [CrossRef]
  47. Xiao, S.; Wu, C.; Zuo, D.; Cheng, H.; Zhang, Y.; Wang, Q.; Lv, L.; Song, G. Systematic analysis and comparison of CaLB genes reveal the functions of GhCaLB42 and GhCaLB123 in fiber development and abiotic stress in cotton. Ind. Crops Prod. 2022, 184, 115030. [Google Scholar] [CrossRef]
  48. Xu, G.X.; Guo, C.C.; Shan, H.Y.; Kong, H.Z. Divergence of duplicate genes in exon-intron structure. Proc. Natl. Acad. Sci. USA 2012, 109, 1187–1192. [Google Scholar] [CrossRef]
  49. Kong, Y.; Xu, P.; Jing, X.; Chen, L.; Li, L.; Li, X. Decipher the ancestry of the plant-specific LBD gene family. BMC Genom. 2017, 18, 951. [Google Scholar] [CrossRef]
  50. Zhang, X.; He, Y.; He, W.; Su, H.; Wang, Y.; Hong, G.; Xu, P. Structural and functional insights into the LBD family involved in abiotic stress and flavonoid synthases in Camellia sinensis. Sci. Rep. 2019, 9, 15651. [Google Scholar] [CrossRef]
  51. Kreszies, T.; Eggels, S.; Kreszies, V.; Osthoff, A.; Shellakkutti, N.; Baldauf, J.A.; Zeisler-Diehl, V.V.; Hochholdinger, F.; Ranathunge, K.; Schreiber, L. Seminal roots of wild and cultivated barley differentially respond to osmotic stress in gene expression, suberization, and hydraulic conductivity. Plant Cell Environ. 2020, 43, 344–357. [Google Scholar] [CrossRef]
  52. Wang, Z.; Zhang, R.; Cheng, Y.; Lei, P.; Song, W.; Zheng, W.; Nie, X. Genome-Wide Identification, Evolution, and Expression Analysis of LBD Transcription Factor Family in Bread Wheat (Triticum aestivum L.). Front Plant Sci. 2021, 12, 721253. [Google Scholar] [CrossRef]
  53. Krejci, A.; Hupp, T.R.; Lexa, M.; Vojtesek, B.; Muller, P. Hammock: A hidden Markov model-based peptide clustering algorithm to identify protein-interaction consensus motifs in large datasets. Bioinformatics 2016, 32, 9–16. [Google Scholar] [CrossRef]
  54. Wilkins, M.R.; Gasteiger, E.; Bairoch, A.; Sanchez, J.C.; Williams, K.L.; Appel, R.D.; Hochstrasser, D.F. Protein identification and analysis tools in the ExPASy server. Methods Mol. Biol. 1999, 112, 531–552. [Google Scholar]
  55. Horton, P.; Park, K.J.; Obayashi, T.; Fujita, N.; Harada, H.; Adams-Collier, C.J.; Nakai, K. WoLF PSORT: Protein localization predictor. Nucleic Acids Res. 2007, 35, W585–W587. [Google Scholar] [CrossRef]
  56. Yu, C.S.; Chen, Y.C.; Lu, C.H.; Hwang, J.K. Prediction of protein subcellular localization. Proteins 2006, 64, 643–651. [Google Scholar] [CrossRef]
  57. Tamura, K.; Stecher, G.; Kumar, S. MEGA11: Molecular Evolutionary Genetics Analysis Version 11. Mol. Biol. Evol. 2021, 38, 3022–3027. [Google Scholar] [CrossRef]
  58. Subramanian, B.; Gao, S.; Lercher, M.J.; Hu, S.; Chen, W.H. Evolview v3: A webserver for visualization, annotation, and management of phylogenetic trees. Nucleic Acids Res. 2019, 47, W270–W275. [Google Scholar] [CrossRef]
  59. Voorrips, R.E. MapChart: Software for the graphical presentation of linkage maps and QTLs. J. Hered. 2002, 93, 77–78. [Google Scholar] [CrossRef]
  60. Yang, X.; Zhou, T.; Wang, M.; Li, T.; Wang, G.; Fu, F.F.; Cao, F. Systematic investigation and expression profiles of the GbR2R3-MYB transcription factor family in ginkgo (Ginkgo biloba L.). Int. J. Biol. Macromol. 2021, 172, 250–262. [Google Scholar] [CrossRef]
  61. Chen, C.; Wu, Y.; Li, J.; Wang, X.; Zeng, Z.; Xu, J.; Liu, Y.; Feng, J.; Chen, H.; He, Y.; et al. TBtools-II: A “one for all, all for one” bioinformatics platform for biological big-data mining. Mol. Plant. 2023, 16, 1733–1742. [Google Scholar] [CrossRef] [PubMed]
  62. Bailey, T.L.; Boden, M.; Buske, F.A.; Frith, M.; Grant, C.E.; Clementi, L.; Ren, J.; Li, W.W.; Noble, W.S. MEME SUITE: Tools for motif discovery and searching. Nucleic Acids Res. 2009, 37, W202–W208. [Google Scholar] [CrossRef]
  63. Lescot, M.; Dehais, P.; Thijs, G.; Marchal, K.; Moreau, Y.; Van de Peer, Y.; Rouze, P.; Rombauts, S. PlantCARE, a database of plant cis-acting regulatory elements and a portal to tools for in silico analysis of promoter sequences. Nucleic Acids Res. 2002, 30, 325–327. [Google Scholar] [CrossRef] [PubMed]
  64. Otasek, D.; Morris, J.H.; Boucas, J.; Pico, A.R.; Demchak, B. Cytoscape Automation: Empowering workflow-based network analysis. Genome Biol. 2019, 20, 185. [Google Scholar] [CrossRef] [PubMed]
  65. Tang, D.; Chen, M.; Huang, X.; Zhang, G.; Zeng, L.; Zhang, G.; Wu, S.; Wang, Y.S. Rplot: A free online platform for data visualization and graphing. PLoS ONE 2023, 18, e0294236. [Google Scholar] [CrossRef] [PubMed]
  66. Carpita, N.C.; Sabularse, D.; Montezinos, D.; Delmer, D.P. Determination of the pore size of cell walls of living plant cells. Science 1979, 205, 1144–1147. [Google Scholar] [CrossRef]
  67. Livak, K.J.; Schmittgen, T.D. Analysis of relative gene expression data using realtime quantitative PCR and the 2−ΔΔCT Method. Methods 2001, 25, 402–408. [Google Scholar] [CrossRef] [PubMed]
  68. Sparkes, I.A.; Runions, J.; Kearns, A.; Hawes, C. Rapid, transient expression of fluorescent fusion proteins in tobacco plants and generation of stably transformed plants. Nat. Protoc. 2006, 1, 2019–2025. [Google Scholar] [CrossRef] [PubMed]
  69. Clough, S.J.; Bent, A.F. Floral dip: A simplified method for Agrobacterium-mediated transformation of Arabidopsis thaliana. Plant J. 1998, 16, 735–743. [Google Scholar] [CrossRef] [PubMed]
Figure 1. Phylogenetic tree of LBDs between A. hypogaea and A. thaliana. The Arabidopsis LBD protein sequences were downloaded from the TAIR database. The phylogenetic tree was constructed by the maximum likelihood method based on MEGA11 with 1000 bootstrap replicates performed. Red pentagram and blue triangle represent the peanut and Arabidopsis LBD genes.
Ijms 25 10561 g001
Figure 2. Chromosomal distribution of the AhLBD gene family. The scale on the left is in mega-bases. The gene ID on the right side of each chromosome corresponds to the approximate locations of each AhLBD gene.
Ijms 25 10561 g002
Figure 3. Collinearity analysis of the AhLBD gene family in A. hypogaea. Red lines represent colinear gene pairs of AhLBDs.
Ijms 25 10561 g003
Figure 4. Phylogenetic tree, conservative motif, and gene structure analysis of all AhLBDs. (A) A maximum likelihood (ML) phylogenetic tree of A. hypogaea protein with 1000 bootstrap replicates was constructed based on the full-length sequence in MEGA11. (B) Distribution of conservative motifs in AhLBD proteins with colored boxes representing motifs 1–10. (C) The genetic structure of the AhLBD genes, including CDS (green rectangle), UTR (untranslated region, yellow rectangle) and intron (black line).
Ijms 25 10561 g004
Figure 5. Multiple sequence alignment and conservative domains of AhLBD proteins. (A) The zinc finger domain (CX2CX6CX3C) was present in all 73 predicted AhLBD protein sequences, while the leucine zipper-like motif (LX6LX3LX6L) was present in Class I and II AhLBD proteins. (B) Alignment of conservative motifs generated by the MEME online website for the two protein domains.
Ijms 25 10561 g005
Figure 6. Distribution of cis-acting elements of AhLBD gene family in the peanut plant. (A) Distribution of cis-acting elements identified in the 2000 bp upstream promoter region of start codon (ATG) of AhLBD genes. (B) Heatmap of the number of cis-acting element types for AhLBDs.
Ijms 25 10561 g006
Figure 7. Collinearity analysis of LBDs between A. hypogaea and other species. The species are Arabidopsis, soybean, rice, and maize. The red line represents the homologous LBD gene pairs of the plant genome, while the gray line represents the collinear block of the plant genome.
Ijms 25 10561 g007
Figure 8. GO annotations for AhLBD proteins. The GO annotation was divided into two categories: biological process and cellular component. The x-axis represents GO Term; the y-axis represents −log10 (p-value) of the GO annotation.
Ijms 25 10561 g008
Figure 9. The top 20 enriched GO terms of candidate AhLBD target genes. The black circles indicate the number of target genes, and different colors indicate the –log10 (p-value), ranging from 12 to 15.
Ijms 25 10561 g009
Figure 10. The AhLBDs functional interaction networks of peanut based on Arabidopsis orthologs. Proteins serve as network nodes and protein–protein relationships are represented by lines.
Ijms 25 10561 g010
Figure 11. Expression profiles of the AhLBD gene family in different tissues. The heat maps are constructed based on transcriptome data (FPKM values). Different colors represent the different expression levels of AhLBDs. Gene names are shown on the right. The scale bar on the right shows the colors used to describe the log2 (FPKM+1) for each gene. FPKM, fragments per kilobase of transcript per million mapped reads. Pod Pattee 3: Pericarp very watery, embryo very small and not easily removed (Pattee stage 3/4); Pericarp Pattee 5: Pericarp soft, not as watery, inner pericarp without cracks (Pattee stage 5); Pericarp Pattee 6: Inner pericarp tissue beginning to show cracks or cottony (Pattee stage 6/7); Seed Pattee 5: Embryo flat, white or just turning pink at one end (Pattee stage 5); Seed Pattee 6: Torpedo shaped; generally pink at embryonic-axis end of kernels (Pattee stage 6); Seed Pattee 7: Torpedo to round shaped; embryonic axis end of kernel pink; other end white to light pink (Pattee stage 7); Seed Pattee 8: Round, light pink all over (Pattee stage 8); Seed Pattee 10: Large, generally dark pink all over; seed coat beginning to dry out (Pattee stage 10).
Ijms 25 10561 g011
Figure 12. Expression profiles of AhLBDs under 2% Nacl, 20%PEG 6000, 4 °C cold, 37 °C hot with leaf and root. The gene names are shown on the right. Class I, II, and III represent three groups according to the phylogenetic tree. Scale bars on the right represent log2 (FPKM+1).
Ijms 25 10561 g012
Figure 13. Expression patterns of 12 AhLBD genes in different tissues. Error bars indicate standard deviations among three independent biological replications. AhACT11 was used as the internal control. Seed1: Pattee 5 seed; Seed2: Pattee 10 seed. t-test was used to analyze three biological replicates of each sample. *: p < 0.05, **: p < 0.01.
Ijms 25 10561 g013
Figure 14. qRT-PCR results of 12 AhLBDs under salt and drought treatments. (A) 12 AhLBD gene expression levels in root under 2% NaCl treatments. (B) 12 AhLBD gene expression levels in root under 30% PEG6000 treatments. Error bars indicate standard deviations among three independent biological replications. 0 h was used as the mock. AhACT11 was used as the internal control. t-test was used to analyze three biological replicates of each sample. *: p < 0.05, **: p < 0.01.
Ijms 25 10561 g014
Figure 15. Subcellular localization of AhLBD24, AhLBD33, AhLBD67, and AhLBD71 proteins in tobacco cells. GFP driven by the CaMV 35S promoter was used as a control. Green fluorescence was observed 48–72 h post-Agrobacterium infiltration using confocal microscopy (Bars = 50 μm).
Ijms 25 10561 g015
Figure 16. Salt stress identification of AhLBD33 and AhLBD67 overexpression in Arabidopsis. (A) and (B) Comparison of root length between AhLBD33 OE lines and WT. (C) and (D) Comparison of root length between AhLBD67 OE lines and WT. OE: overexpression line, Bar = 1 cm. *: p < 0.05, **: p < 0.01.
Ijms 25 10561 g016
Disclaimer/Publisher’s Note: The statements, opinions and data contained in all publications are solely those of the individual author(s) and contributor(s) and not of MDPI and/or the editor(s). MDPI and/or the editor(s) disclaim responsibility for any injury to people or property resulting from any ideas, methods, instructions or products referred to in the content.

