Article

Regulatory Role of IL6 in Immune-Related Adverse Events during Checkpoint Inhibitor Treatment in Melanoma

by
Krishna P. Singh
1,
Anuj Singh
2,
Olaf Wolkenhauer
1,3,4 and
Shailendra Kumar Gupta
1,3,*
1
Department of Systems Biology & Bioinformatics, University of Rostock, 18051 Rostock, Germany
2
Amity Institute of Biotechnology, Amity University Uttar Pradesh, Lucknow 226028, India
3
Department of Biomedical Engineering & Bioinformatics, Chhattisgarh Swami Vivekananda Technical University, Bhilai 491107, India
4
Leibniz Institute for Food Systems Biology, Technical University of Munich, 85354 Freising, Germany
*
Author to whom correspondence should be addressed.
Int. J. Mol. Sci. 2024, 25(19), 10600; https://doi.org/10.3390/ijms251910600
Submission received: 27 August 2024 / Revised: 23 September 2024 / Accepted: 27 September 2024 / Published: 1 October 2024
(This article belongs to the Special Issue Drug Discovery of Compounds by Structural Design)

Abstract

:
The landscape of clinical management for metastatic melanoma (MM) and other solid tumors has been modernized by the advent of immune checkpoint inhibitors (ICI), including programmed cell death-1 (PD-1), programmed cell death-ligand 1 (PD-L1), and cytotoxic T lymphocyte antigen 4 (CTLA-4) inhibitors. While these agents demonstrate efficacy in suppressing tumor growth, they also lead to immune-related adverse events (irAEs), resulting in the exacerbation of autoimmune diseases such as rheumatoid arthritis (RA), ulcerative colitis (UC), and Crohn’s disease (CD). The immune checkpoint inhibitors offer promising advancements in the treatment of melanoma and other cancers, but they also present significant challenges related to irAEs and autoimmune diseases. Ongoing research is crucial to better understand these challenges and develop strategies for mitigating adverse effects while maximizing therapeutic benefits. In this manuscript, we addressed this challenge using network-based approaches by constructing and analyzing the molecular and signaling networks associated with tumor-immune crosstalk. Our analysis revealed that IL6 is the key regulator responsible for irAEs during ICI therapies. Furthermore, we conducted an integrative network and molecular-level analysis, including virtual screening, of drug libraries, such as the Collection of Open Natural Products (COCONUT) and the Zinc15 FDA-approved library, to identify potential IL6 inhibitors. Subsequently, the compound amprenavir was identified as the best molecule that may disrupt essential interactions between IL6 and IL6R, which are responsible for initiating the signaling cascades underlying irAEs in ICI therapies.

1. Introduction

Metastatic melanoma is an advanced and aggressive form of skin cancer that arises from the uncontrolled growth of pigment-producing cells called melanocytes [1]. Immune checkpoint inhibitor (ICI) therapies have emerged as a revolutionary approach in the treatment of melanoma. ICI therapies focus on modulating the immune system to enhance its ability to recognize and attack cancer cells. Various ICIs have been discovered to inhibit specific proteins (e.g., cytotoxic T-lymphocyte-associated antigen 4 (CTLA-4) [2] and programmed cell death protein 1 (PD-1) in tumor-immune environments and thereby eliminate tumor cells [3,4,5,6]. While ICI therapies hold great promise in cancer treatment, they present a distinct challenge by potentially inducing autoimmune phenotypes [7]. The mechanisms that enable the immune system to target cancer cells are also supposed to inadvertently lead to the immune-related adverse events (irAEs) responsible for the exacerbation of autoimmune diseases [8]. This dual nature of immune checkpoint therapies underscores the delicate balance that must be struck between activating the immune system to combat melanoma and preventing it from attacking the body’s tissues, resulting in irAEs [9,10,11,12]. Understanding the crosstalk between melanoma and autoimmune diseases is challenging due to the involvement of a large number of immune cells, and it is vital for the safe use of ICI therapies in the regulation of tumor growth. In this manuscript, we approached this challenge using network-based approaches by constructing and analyzing the molecular and signaling network associated with tumor-immune crosstalk. A detailed workflow of our research is shown in Figure 1.

2. Results and Discussion

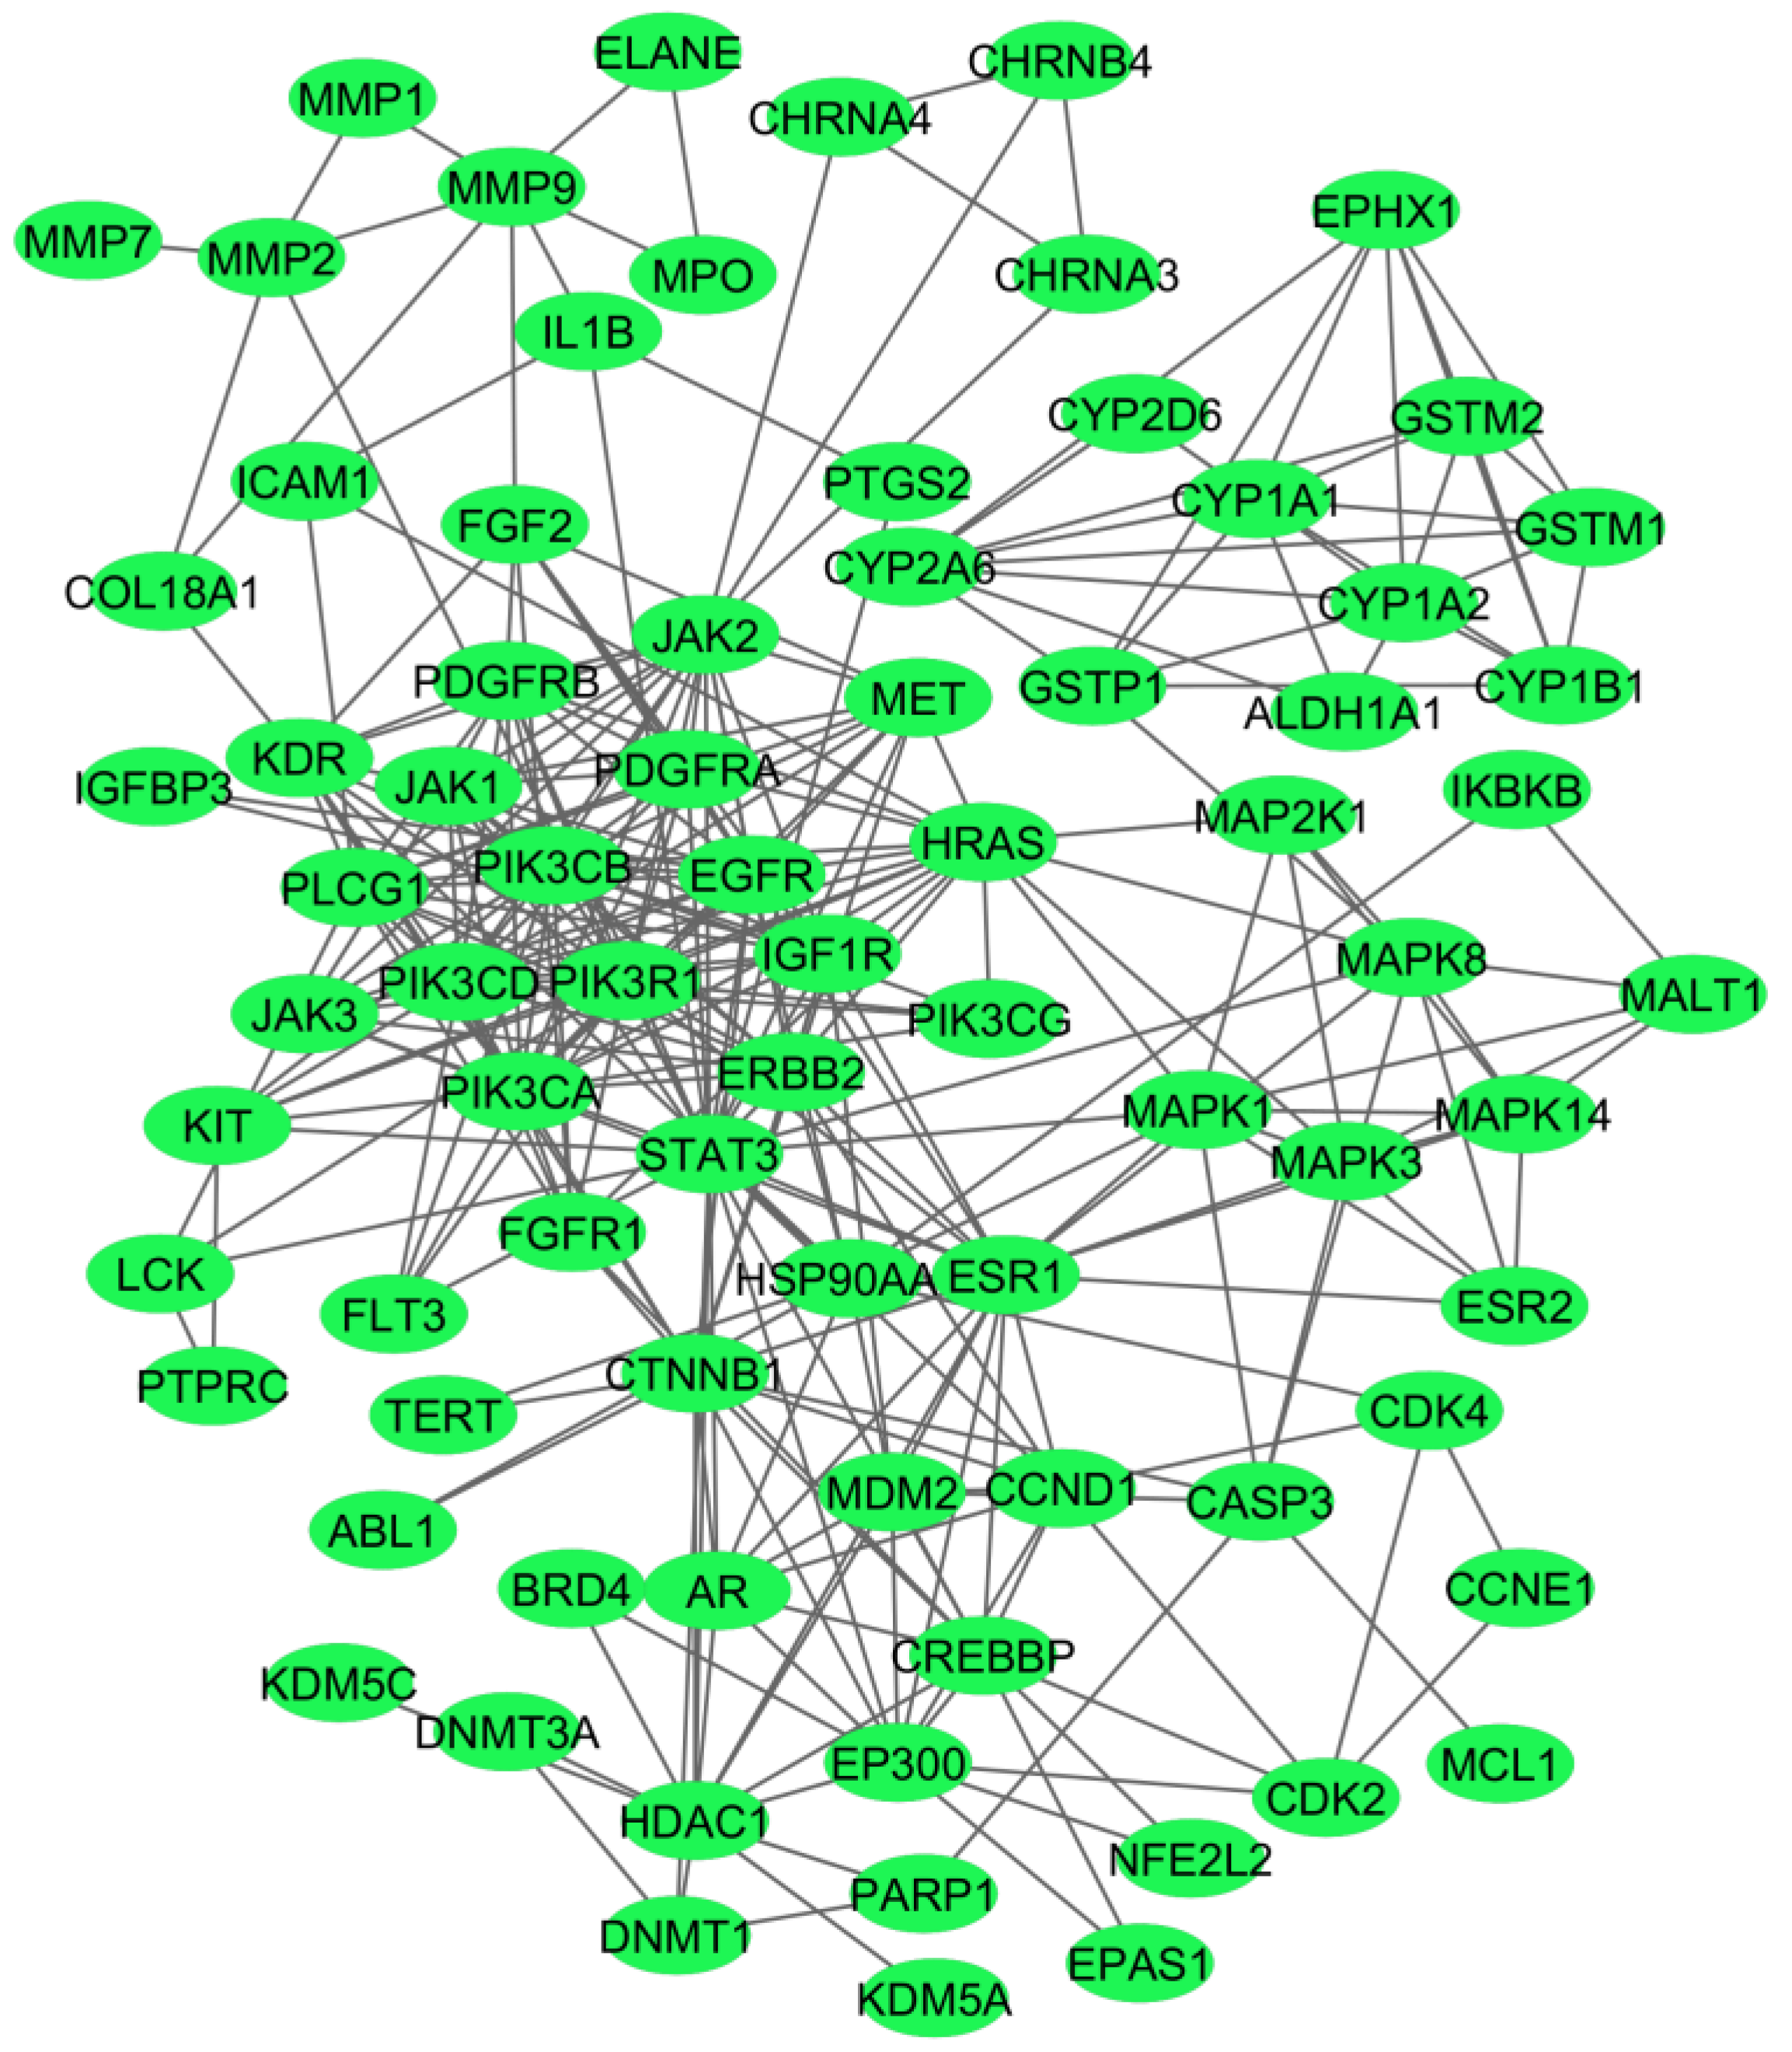
2.1. Protein–Protein Interaction Network at the Interface of Melanoma and Autoimmune Diseases

We extracted the genes associated with MM (n = 504), RA (n = 2722), UC (n = 1458), and CD (n = 1382) from the DisGeNet database. We found a total of 132 common genes in all 4 disease phenotypes, for which a protein–protein interaction (PPI) network was prepared using the STRING database (Figure 2). We considered these common genes as the connecting links between melanoma and the investigated autoimmune diseases.
Out of the 132 genes used for the construction of the PPI network, 25 genes did not exhibit any connections with other genes, and hence, we created a network showing the common 107 genes (Figure 3).

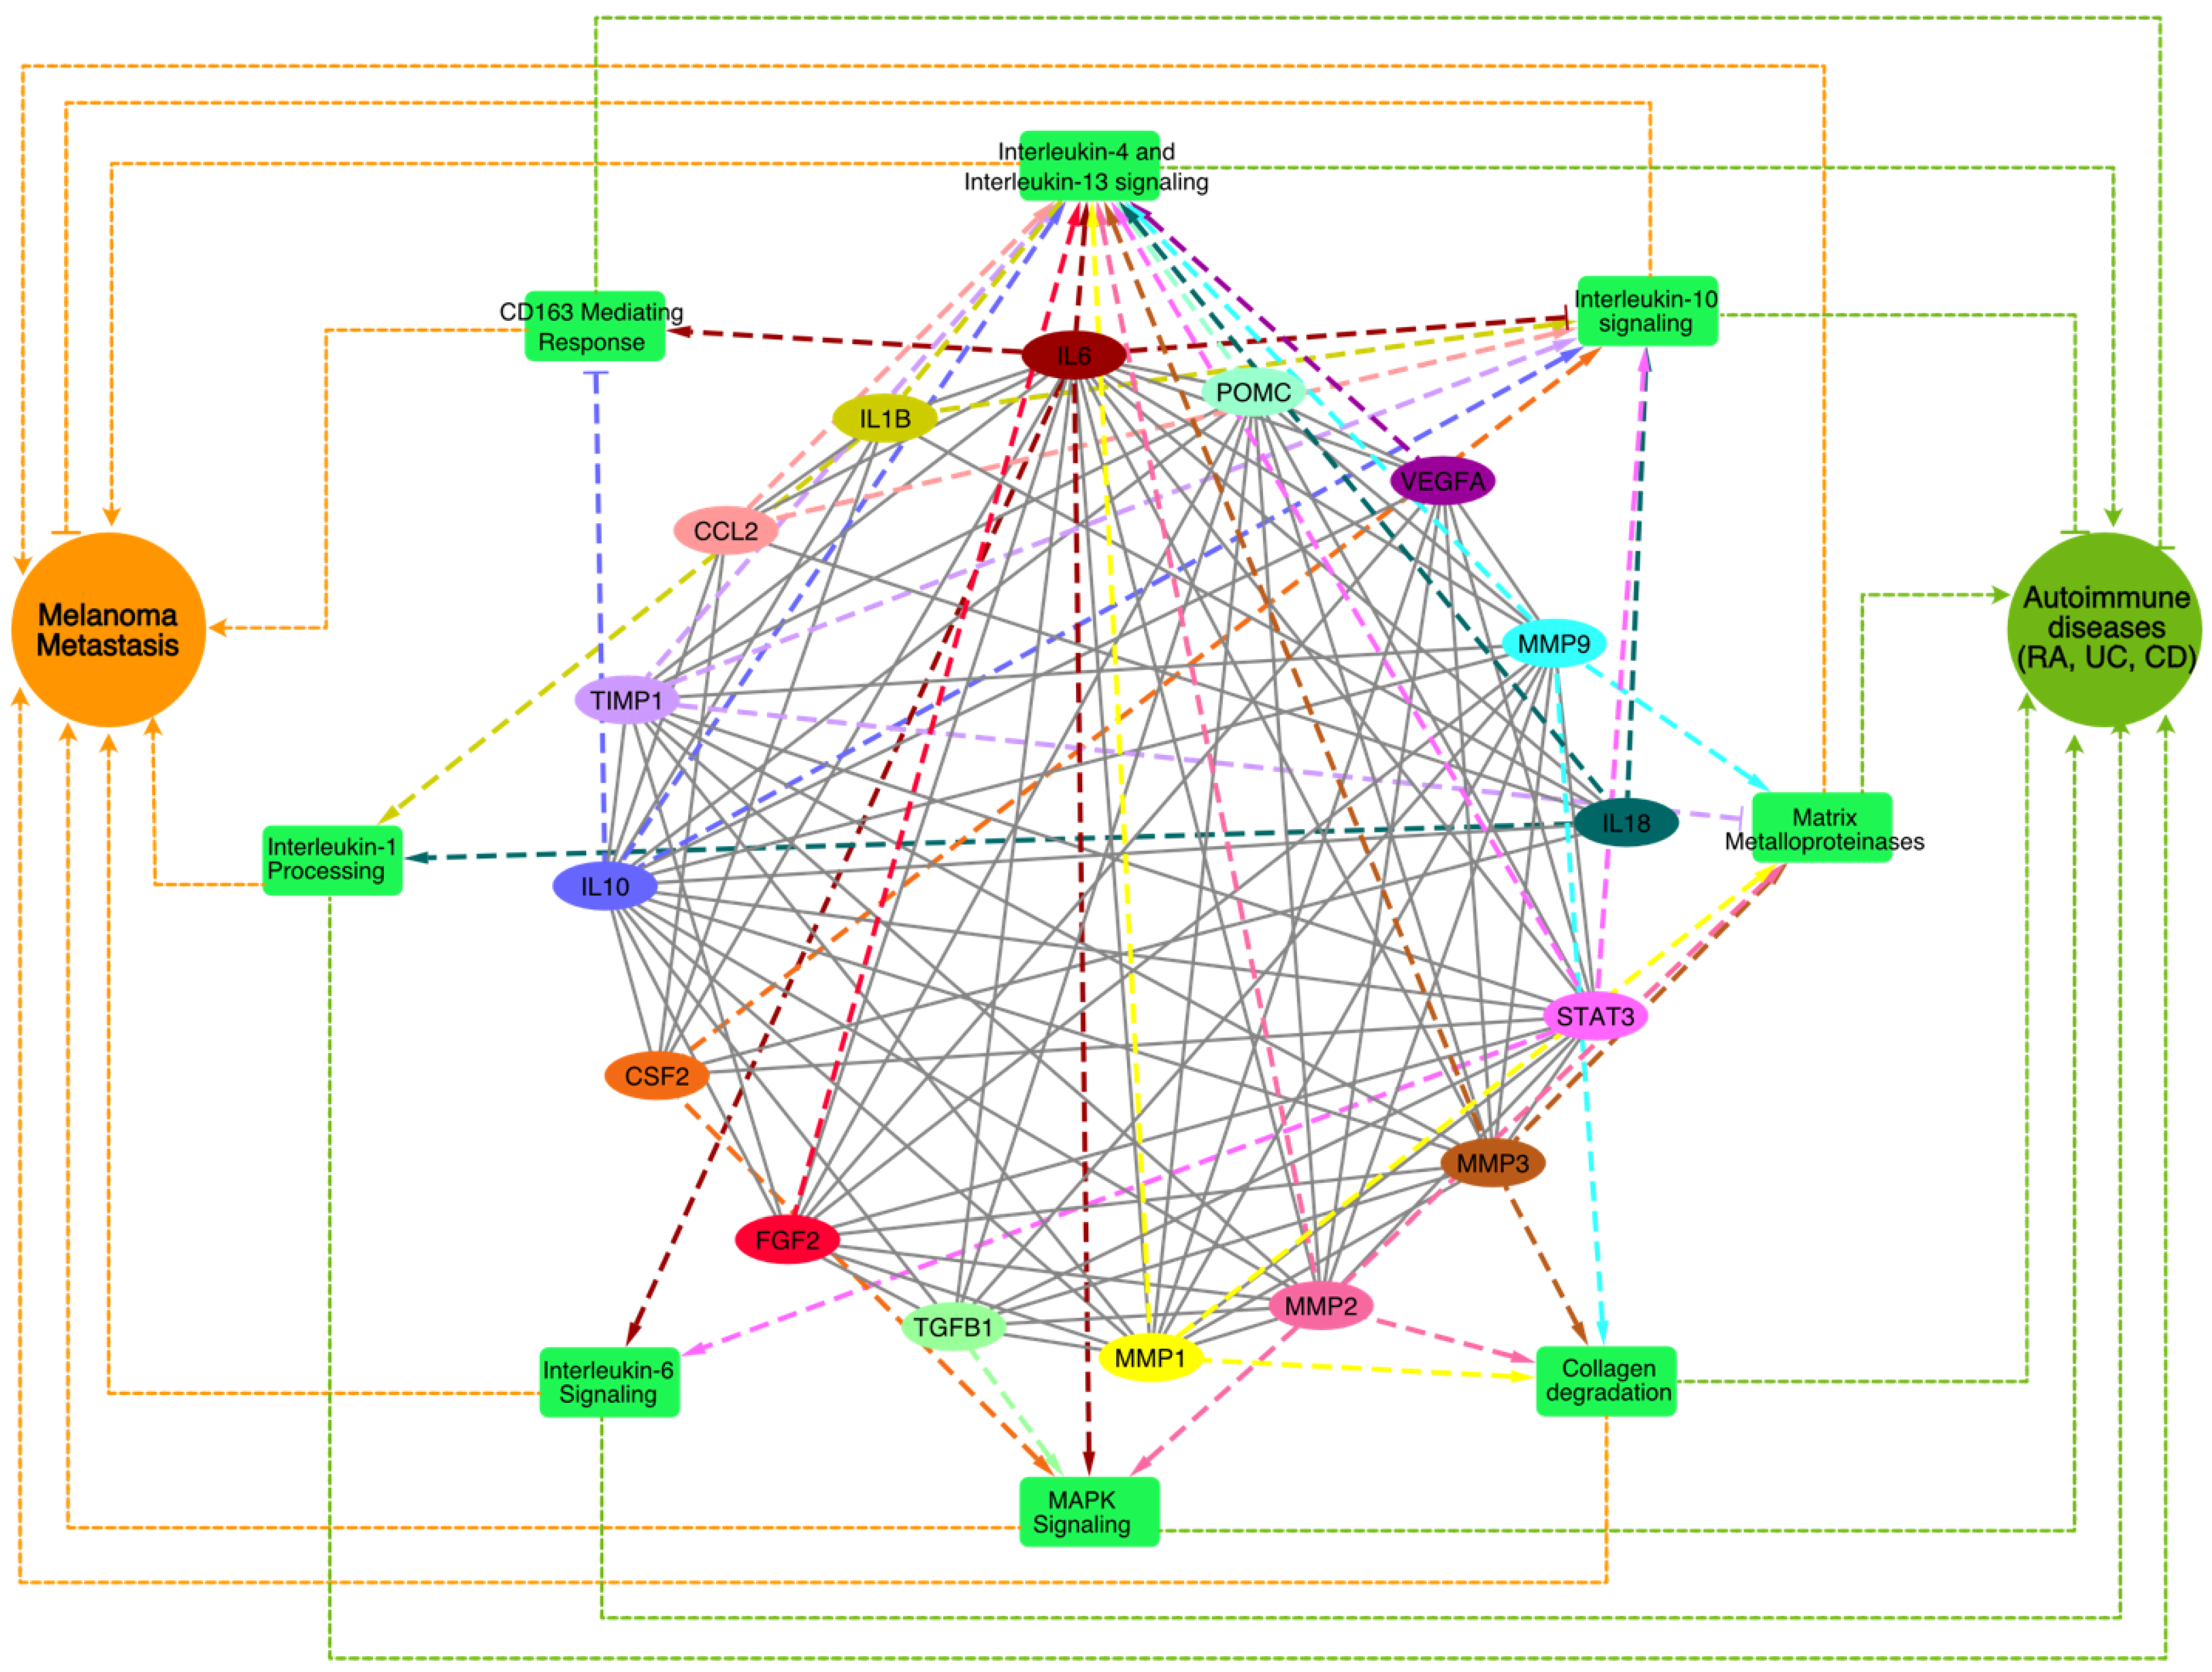
2.2. Identification of the Hub Genes from the PPI Network Associated with Crosstalk between Melanoma and Autoimmune Diseases

To identify the key hub genes in the PPI network prepared using the common genes in melanoma and autoimmune diseases, we used the Cytoscape plugin Molecular Complex Detection (MCODE) algorithm. The MCODE algorithm detects interconnected network clusters based on a k-core score that represents the maximal number of connected subgraphs, with all the nodes connected by a minimum number of k degrees [13]. The MCODE algorithm detected six highly connected subnetworks, represented as MCODE modules (Table 1). For the identification of the hub genes responsible for the crosstalk between melanoma and autoimmune diseases, we selected module 1, which contained 16 genes, with the highest MCODE score of 10.13.

2.3. Pathway Enrichment Analysis of the Top MCODE Cluster

To identify the biological processes and pathways that might play a key role in the crosstalk of melanoma and autoimmune diseases, we performed a pathway enrichment analysis of the genes associated with the top MCODE module using the Reactome database 2022 in the Enrichr web-based server (https://maayanlab.cloud/Enrichr accessed on 10 April 2024). All the enriched pathways (Figure 4), along with the pathway p-values, adjusted p-values, and gene/protein sets for each case, were examined (Supplementary Table S1).
The interleukin-4 (IL4) and interleukin-13 (IL13) signaling pathways, which play key roles immune regulation and inflammation and are primarily associated with allergic responses and Th2 immunity [14], were among the top enriched pathways. Previous studies have also suggested that these pathways shape the tumor microenvironment and promote tumor progression by modulating immune responses and survival pathways [15]. In autoimmune diseases like RA and UC, IL4 and IL13 contribute to excessive inflammation and tissue damage, fostering autoantibody production and B cell survival [16]. Further, we also found that the interleukin-6 (IL6), interleukin-10 (IL10), and interleukin-1 (IL1) signaling cascades among the top enriched pathways that regulate melanoma [17,18] and autoimmune diseases [19], exerting diverse effects on inflammation, immune dysregulation, and disease progression. Elevated IL6 levels in melanoma correlate with advanced disease stages and therapy resistance, while in autoimmune diseases, IL6 drives inflammation and tissue damage [19]. Conversely, IL10 exhibits dual roles, suppressing anti-tumor immunity in melanoma yet mitigating inflammation in autoimmune diseases. In melanoma, IL1 orchestrates tumor growth, angiogenesis, and metastasis [20] by instigating pro-inflammatory cytokine production, fostering melanoma cell invasiveness, and modulating the tumor microenvironment’s immune cell composition that may contribute to autoimmune disease pathogenesis, fueling inflammation and tissue damage in conditions like RA [21] and IBD [22] by inciting cytokine production and immune cell activation. Additionally, we also found that matrix metalloproteinases (MMPs), collagen degradation, MAPK signaling, and CD163-mediated anti-inflammatory responses were among the top enriched pathways that are known for regulating melanoma and autoimmune diseases [23,24,25,26,27,28,29]. In melanoma, collagen degradation promotes tumor invasion and metastasis by the MMP-mediated breakdown of the extracellular matrix (ECM), facilitating melanoma cell infiltration into surrounding tissues and distant metastasis [30,31]. Elevated levels of collagen degradation products also instigate immune-mediated tissue damage and inflammation in autoimmune diseases like RA [32]. The CD163-mediated anti-inflammatory responses potentially affect the inflammation resolution phase, resulting in progression towards chronic inflammatory phenotypes, together with the exacerbation of autoimmune symptoms. Understanding the intricate interplay of these signaling pathways is crucial for developing targeted therapies that effectively modulate immune responses, together with the management of tumors by immune checkpoint inhibitors.
The pathway enrichment analysis not only helped us to identify the pathways associated with the common genes at the interface of melanoma and autoimmune diseases but also the directions from the genes to the pathways, which enabled us to prioritize the therapeutic targets.

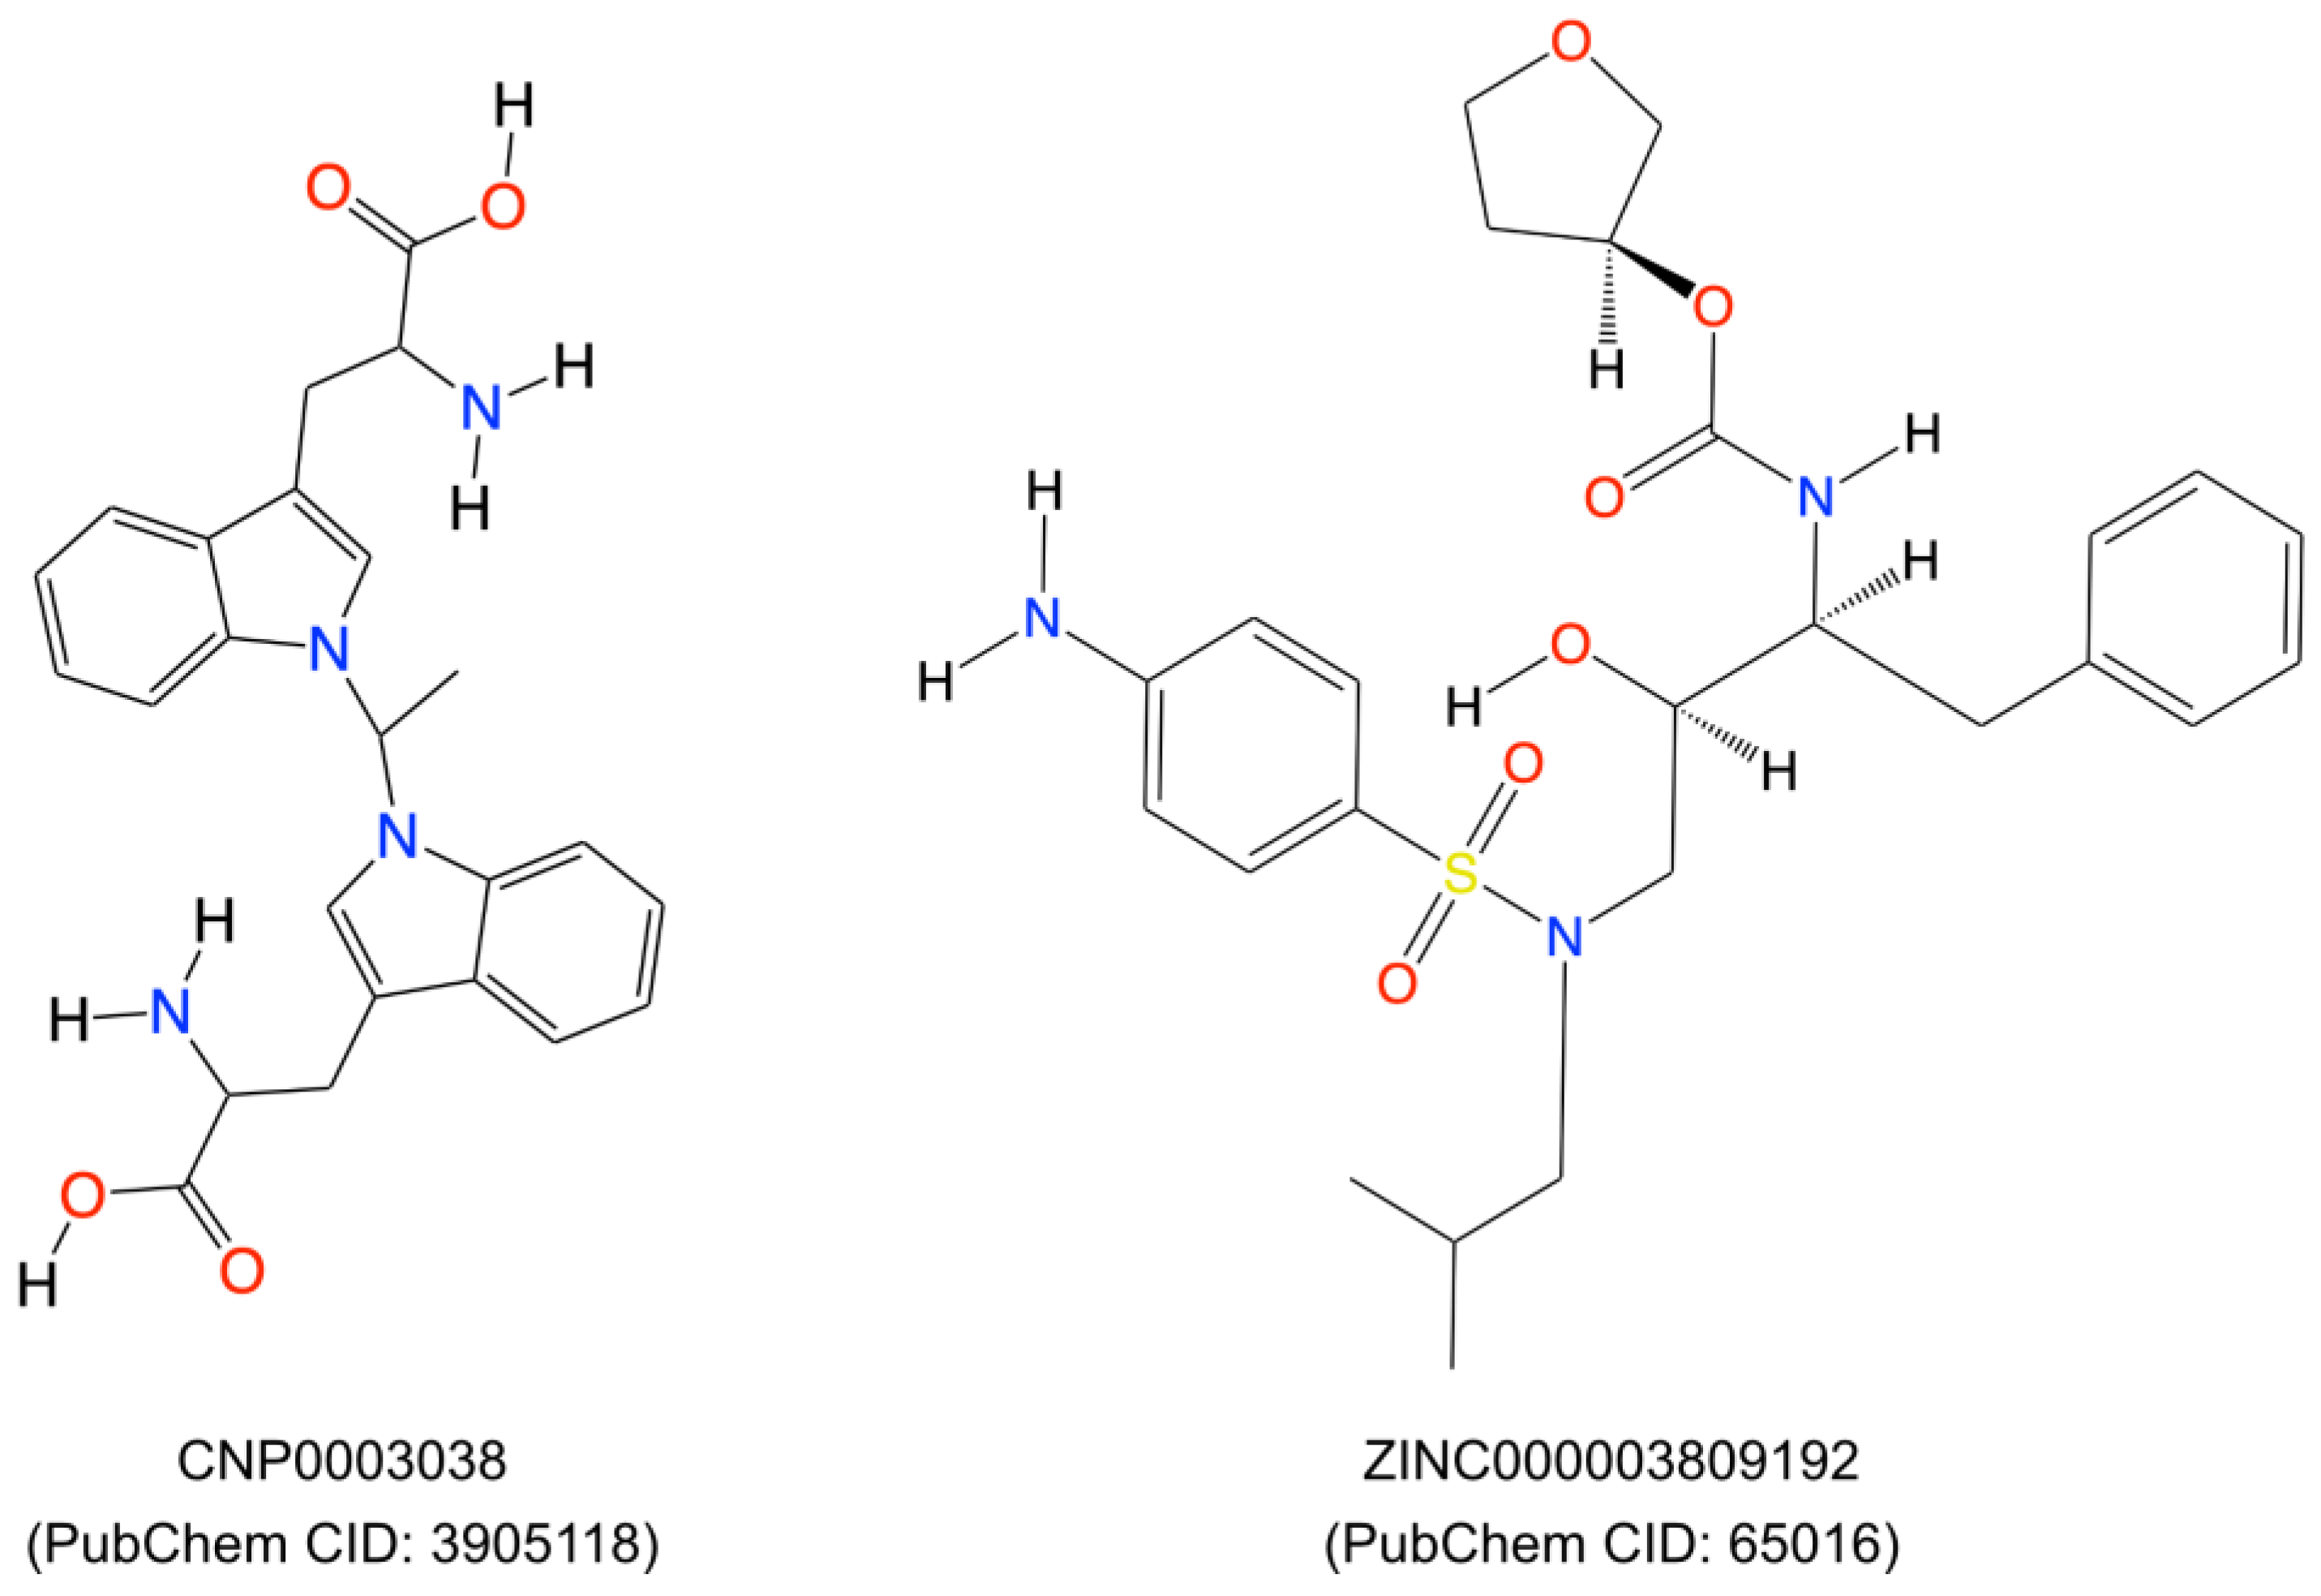
2.4. Identification of Lead Molecule and Molecular Docking

IL6 (Figure 4) was found to regulate five pathways among the eight enriched pathways associated with MM and autoimmune disease. This directed network suggests that the inhibition of IL6 will reduce the activity of pathways such as IL6, IL4/IL13 signaling, collagen degradation, CD163-mediating responses, and MAPK signaling, and it may activate IL10 signaling. Thus, the inhibition of IL6 will not only be able to suppress melanoma metastasis but also reduce autoimmune phenotypes, which may be exacerbated during immune checkpoint therapies [33,34,35]. Interestingly, previous reports have also highlighted increased levels of IL6 as a significant contributor to irAEs, as seen in melanoma patients undergoing anti-CTLA-4 ICI therapy [36,37]. Hailemichael and colleagues analyzed samples from ICI-treated tumor patients with immune-related enterocolitis (irEC) and found that IL6 gene expression profiles were more than 24-fold upregulated compared with normal tissues [38]. Lei et al. highlighted that patients with high serum levels of IL6 developed resistance to ICIs [39]. Similarly, average IL6 (both mRNA and protein-level) expression was elevated in RA, UC, and CD patients compared with healthy controls [40,41,42]. These reports have indicated that targeting IL6 will improve the responsiveness of ICIs and also downregulate irAEs.
To identify potential inhibitors for the IL6 protein, we utilized the FDA-approved library using the Zinc15 database (https://zinc15.docking.org/) accessed on 20 April 2024, which contains 1615 compounds, and the natural compound library of the COCONUT database (https://coconut.naturalproducts.net/) accessed on 30 April 2024, which contains 407,270 unique compounds [43]. We filtered the COCONUT database libraries prior to the virtual screening with IL6 for Lipinski’s rule of five [44] in order to consider only drug-like molecules. Only 272,001 compounds were able to pass Lipinski’s rule of five filtering criteria.
The active site of IL6 was selected, considering amino acid residues Phe74, Phe78, Leu178, Arg179, and Arg182, which play a significant role (as hotspot residues) in its interaction with IL6R [45]. We used the LibDock protocol available in the DS2022 for the initial screening of the drug libraries. LibDock is a rigid-based docking program that first calculates hotspots (polar and apolar probes) from the active site of a receptor and then rotates ligands in the cavities for a proper fit [46,47]. The top 20 compounds, based on their LibDock scores [48,49], were further analyzed using the flexible docking tool ‘CDOCKER’ present in the DS2022 (Table 2). In flexible CDOCKER docking [50], both a compound and its receptor can adjust their conformations for a better fit. This adaptability is crucial for accurately predicting the binding affinity and interaction mode between a candidate compound and its target protein [51,52]. Only nine compounds out of twenty could be further docked with IL6 using the CDOCKER protocol.
We selected the top two compounds (Figure 5) because they had the highest CDOCKER energy values (CNP0003038: −41.6684 kcal/mol and ZINC03809192: −34.7136 kcal/mol, respectively). One belonged to the natural compound library and the other to the ZINC database.
We performed a literature survey for these two compounds for their toxicity, bioassays, and roles in tumor/autoimmune disease regulation. We found that the compound CNP0003038, also referred to as 1,1′-ethylenebis-L-tryptophan (EBT; PubChem CID: 3905118), enhances the proliferation of EoL-3 eosinophilic leukemia cells and induces the release of eosinophil cationic protein from isolated human peripheral blood eosinophils, resulting in eosinophilia-myalgia syndrome [53]. EBT has also been shown to induce IL-5 production in isolated human T cells, and it induced inflammation, mast cell infiltration, fascia thickening, and adipose tissue fibrosis in an eosinophilia-myalgia-syndrome mouse model [54]. Due to the possible toxic effects of compound CNP0003038 on the immune system, we removed it from further analysis.
The compound from the ZINC database, ‘ZINC000003809192’, also known as amprenavir, is primarily known as a protease inhibitor and used in the treatment of HIV/AIDS. It inhibits the HIV protease enzyme, thereby blocking the cleavage of viral polyproteins into functional proteins, ultimately hindering viral replication [55,56]. Amprenavir was also included in the investigation of FDA-approved small molecule drugs through in-silico screening, and their potential as inhibitors of extracellular signal-regulated kinase (ERK) and apoptosis inducers in MCF-7 human breast cancer cells has been assessed [57]. Based on all the above facts, we selected only Amprenavir for the molecular dynamic simulation.
We employed molecular docking and molecular dynamics simulation analyses to investigate the interaction patterns, stability, and flexibility of the docked complex, which helped us explore the interaction and stability of Amprenavir with IL6 during the simulation. Our molecular docking studies suggested that Amprenavir forms three hydrogen bonds and four hydrophobic bonds with the IL6 amino acid residues SER176, CYS73, MET67, ARG179, LYS54, and LYS66 (more information on the bonds is provided in Supplementary Table S2). To further check if Amprenavir interfered with the binding of IL6 with IL6R, we performed additional protein–protein docking using the HDOCK tool [58]. For this, we first used an IL6 and IL6R complex (PDB ID: 1P9M) [59] and redocked the protein units using HDOCK as a control scenario. Next, we used IL6 in complex with ‘Amprenavir’ and performed the protein–protein docking with IL6R, again using the HDOCK tool. Both scenarios were compared with each other to evaluate the effect of ‘Amprenavir’ on IL6 and IL6R interactions. We observed that the docked complex of IL6-IL6R had a higher docking energy of −398.1 kcal/mol, and thus, it was more stable in comparison to the IL6-Amprenavir-IL6R complex (−262.02 kcal/mol). We further compared the impact of ‘Amprenavir’ on the number of bonds formed between IL6 and IL6R.
The residues essential for IL6 binding to IL6R include the following from IL6: LYS27, GLN28, ARG30, PHE74, PHE75, PHE78, LEU178, ARG179, ALA180, and ARG182 [59], which form various bonds with the following residues from IL6RA: GLU163, GLN190, PHE229, ASP253, GLU277, GLU278, and PHE279, as well as the following residues from IL6RB: LYS118, LYS119, ARG128, VAL167, TYR168, PHE169, VAL230, and VAL264 (more information on the bonds formed between IL6 and IL6R is provided in Supplementary Table S3).
Our analysis revealed that the IL6-Amprenavir-IL6R complex lost six significant bonds that were formed between the IL6-IL6R complex. However, one new bond formed between IL6 and IL6R in the presence of Amprenavir (IL6’s ARG179 with IL6RA’s GLU163) (Supplementary Table S3). We also observed that the IL6 amino acid residues LYS66, SER176, and ARG179 and the IL6R residues GLY164 and CYS192 formed bonds with Amprenavir (Figure 6a,b) (Supplementary Table S3). The energies and bond assessments of the docked complex showed that the compound Amprenavir functions as an inhibitor for IL6 interactions with IL6R, disrupting numerous bonds that originally formed between the protein and its receptor.

2.5. Molecular Dynamics Simulation

To evaluate the flexibility and overall stability of the IL6-Amprenavir docked complex, we performed time-dependent molecular dynamics (MDs) simulations using the ‘Standard Dynamics Cascade’ protocol in the DS2022. The complex’s stability was assessed through root mean square deviation (RMSD), which measures the deviations of atomic coordinates from their initial positions, and this allowed us to monitor how the structures of the complexes changed over time. In parallel, root mean square fluctuation (RMSF) was used to analyze the flexibility of individual residues, quantifying how much each residue fluctuated during the simulation rather than tracking their positional shifts over time. Additionally, we measured the Radius of gyration (Rg) to assess the compactness of the proteins’ backbones. The Rg measurements provided insights into the overall structural compactness, dynamics, and flexibility of the proteins in a biological environment (Figure 7). We observed the RMSD of the docked complex (IL6-Amprenavir) for 50 ns, and we found that the complex achieved convergence and stabilized at around 20 ns (Figure 7b).
We comprehensively analyzed the residue fluctuations in the RMSF, which were crucial for IL6 to bind with IL6R. The residues within the hydrophilic domain (Lys27, Arg30, Phe78, Arg179, and Arg182) formed salt bridges with the IL6R proteins. In the molecular docking of the IL6-Amprenavir-IL6R complex, we observed the disruptions to the salt bridges involved the residues Lys27 and Arg182 between IL6 and IL6R. The same happened for Phe 78, which disengaged from its bond with IL6R (Supplementary Table S3). All these residues took part in the binding of Amprenavir into the cavities of IL6. During the MD simulation, all these residues showed minimal fluctuations of 0.4 (Å), which indicated that these IL6 residues were tightly engaged with the drug ‘Amprenavir’ and were not available for interaction with IL6R. Furthermore, no residues showed fluctuations of more than 0.7 Å (Figure 7c). In the case of the radius of gyration, during the MD run after the binding of the Amprenavir, IL6 started to achieve a more compact structure (Figure 7d). A comparison of the bonds formed in the IL6-Amprenavir complex before and after the MD simulation is shown in Figure 7a and in Supplementary Tables S2 and S4. The analysis of the final pose of the IL6-Amprenavir complex after the MD simulation indicated increases in the bonds compared to the initial docked pose. Initially, it formed three hydrogen bonds with various IL6 residues, which increased to five after a 50 ns production run. Overall, our analysis indicated that the compound Amprenavir binds with IL6 and forms a stable complex at the same site that is associated with IL6R interactions.

3. Methods and Methodology

3.1. Data Collection and Protein–Protein Interaction (PPI)

The genes related to MM, RA, UC, and CD were extracted from the DisGeNet database (https://www.disgenet.org/) accessed on 15 March 2024, which is one of the largest publicly available collections of genes and variants associated with human diseases [60]. The data extracted from DisGeNet was subsequently analyzed to identify the common genes among the above-mentioned disease phenotypes. All the common genes were further used to explore their protein–protein interactions using the STRING database (http://string-db.org) accessed on 30 March 2024 [61], with a confidence score cutoff of 0.70.

3.2. Identification of Highly Interconnected Clusters in the Tumor-Autoimmune PPI Network

We used the Cytoscape plugin the Molecular Complex Detection (MCODE) algorithm [13] to identify highly connected clusters in the protein–protein interaction network of the common genes associated with the tumors and the selected autoimmune disease phenotypes. The degree cutoff 2 was used to control the genes that were to become part of the cluster. New members were added to the cluster only if their node score deviates from the cluster’s seed node score by less than the set cutoff of 0.2. The k-score cutoff 2 was used to filter out clusters that did not contain a maximally interconnected sub-cluster of a degree score of at least 2. A max depth of 100 was set to limit the distance from the seed node within which MCODE could search for cluster members. This approach allowed us to partition the network based on its topology, pinpointing densely connected regions within the protein–protein interaction network associated with the crosstalk between melanoma and the immune checkpoint therapies that induced irAEs.

3.3. Pathway Enrichment Analysis

For the top cluster identified using the MCODE analysis, we identified enriched pathways using Enrichr (https://maayanlab.cloud/Enrichr/) accessed on 10 April 2024 [62]. We specifically focused on the pathways that were present in the Reactome 2022 database, with the significance threshold of a p-value of 0.05 for the enrichment analysis. The pathways were sorted on the basics of the combined score [63], which was described as follows:
C = log ( p ) × z
where C is the combined score, p is the Fisher exact test p-value, and z is the z-score for the deviation from the expected rank. Further, we filtered enriched pathways that were previously identified to play a role in melanoma and autoimmune diseases. From the filtered pathways, we identified the nodes that were common in all the enriched pathways for future analysis.

3.4. Three-Dimensional Structure Preparation and Screening of the Lead Compounds

We conducted virtual screening and molecular docking analyses to elucidate the inhibition mechanism and identify the potential lead compounds for IL6 inhibition. To perform these analyses, we use a 3D model of IL6 (PDB ID: 1ALU) from the RCSB PDB database (https://www.rcsb.org/) accessed on 15 April 2024 [64]. The model was subjected to the ‘Prepare Protein’ protocols of the Biovia Discovery Studio 2022 (DS2022) [65] using the CHARMM force field [66]. The structure was further optimized using the ‘Smart Minimiser’ algorithm to achieve a stable state through energy minimization. The minimization process was completed in 2000 steps, with an RMS gradient tolerance set at 0.1. With the help of the ‘Receptor-ligand Interaction’ tool of the DS2022, we defined the IL6 binding site based on the amino acid residues that played a key role in its interaction with IL6R [64]. To identify potential inhibitors for the IL6 proteins, we conducted a virtual screening of the natural products using Collection of Open Natural Products (COCONUT), an extensive and well-annotated resource for natural products [43]. Additionally, we included an FDA-approved drug library from the ZINC 15 database [67] for the virtual screening using the ‘LibDock’ protocol of the DS2022. All the docked compounds were further subjected to the flexible ‘CDOCKER’ program in the DS2022 [65,68]. Finally, we performed the protein–protein docking between IL6R and IL6 in the complex with the screened drug molecules using the HDOCK tool [58].

3.5. Molecular Dynamic Simulation

We assessed the binding affinity of the IL6 inhibitor docked at the IL6R interaction site, and we performed the MD simulation using the DS2022. The MD simulation was performed in an implicit solvent environment to investigate the stability, conformational changes, and dynamic behavior of the inhibitor in the binding cavity by examining the formation of diverse electrostatic interactions. For the MD simulation, the complex was subjected to an initial minimization phase consisting of 1000 steps using the steepest descent algorithm, followed by an additional 2000 steps employing the conjugate gradient method with the CHARMM force field [66]. After minimization, the systems underwent a heating phase where the initial temperature was incrementally increased from 50 K to 300 K in 50 ps intervals. Subsequently, an equilibration step lasting 100 ps was performed. The adjusted velocity frequency was configured to 50 for the heating and equilibration phases. Subsequently, a production run of 50 ns was conducted within an NVT assembly (maintaining normal volume and temperature) at a constant temperature of 300 K, with the results being saved at intervals of 0.02 ns. For the entire simulation run, we analyzed trajectories consisting of 25,000 conformations. Various properties, including root mean square deviation (RMSD), root mean square fluctuation (RMSF), and the radius of gyration (ROG), were examined using the ‘Analyze Trajectory Protocol’ of the DS2022

4. Conclusions

The introduction of ICIs, such as PD-1, PD-L1, and CTLA-4 inhibitors, has revolutionized the clinical management of metastatic melanoma (MM). These inhibitors have shown remarkable efficacy in controlling the growth of tumors. However, their use also leads to irAEs, resulting in the exacerbation of autoimmune diseases such as RA, UC, and CD in melanoma patients. Our research explored the interface between MM and autoimmune diseases, aiming to identify potential druggable targets and understand the crosstalk between these conditions for the safe use of ICIs in MM management. Using an integrative network approach, IL6 was identified as a promising target at the interface between MM and autoimmune diseases. Through structure biology approaches, the lead compounds capable of inhibiting IL6, such as Amprenavir, were identified. As IL6 is mainly an acute inflammatory cytokine, presumably, an IL6 inhibitor may be used to treat the acute inflammatory responses caused by ICIs in melanoma patients that later exacerbate the autoimmune phenotypes. However, further laboratory experiments are needed to validate the efficacy of Amprenavir together with ICIs.

Supplementary Materials

The following supporting information can be downloaded at: https://www.mdpi.com/article/10.3390/ijms251910600/s1.

Author Contributions

K.P.S. conceived and designed the study, collected and analyzed the data, and drafted the manuscript. A.S. contributed to the study’s design, conducted experiments, and provided critical revisions to the manuscript. S.K.G. provided valuable intellectual input throughout the project and drafted the manuscript. O.W. participated in the study’s design and provided technical expertise. All authors have read and agreed to the published version of the manuscript.

Funding

This research was funded by the German Federal Ministry of Education and Research (BMBF) (e: Med-MelAutim 01ZX2205B).

Institutional Review Board Statement

Not applicable.

Informed Consent Statement

Not applicable.

Data Availability Statement

The data are contained within the article and the Supplementary Materials.

Conflicts of Interest

The authors declare no conflicts of interest.

References

  1. Lowe, L. Metastatic melanoma and rare melanoma variants: A review. Pathology 2023, 55, 236–244. [Google Scholar] [CrossRef] [PubMed]
  2. Rausch, M.P.; Hastings, K.T. Immune Checkpoint Inhibitors in the Treatment of Melanoma: From Basic Science to Clinical Application. In Cutaneous Melanoma: Etiology and Therapy; AU: Brisbane, Australia, 2017; pp. 121–142. [Google Scholar]
  3. Shah, V.; Panchal, V.; Shah, A.; Vyas, B.; Agrawal, S.; Bharadwaj, S. Immune checkpoint inhibitors in metastatic melanoma therapy (Review). Med. Int. 2024, 4, 13. [Google Scholar] [CrossRef] [PubMed]
  4. Shiravand, Y.; Khodadadi, F.; Kashani, S.M.A.; Hosseini-Fard, S.R.; Hosseini, S.; Sadeghirad, H.; Ladwa, R.; O’byrne, K.; Kulasinghe, A. Immune Checkpoint Inhibitors in Cancer Therapy. Curr. Oncol. 2022, 29, 3044–3060. [Google Scholar] [CrossRef] [PubMed]
  5. Motofei, I.G. Melanoma and autoimmunity: Spontaneous regressions as a possible model for new therapeutic approaches. Melanoma Res. 2019, 29, 231–236. [Google Scholar] [CrossRef]
  6. Ibis, B.; Aliazis, K.; Cao, C.; Yenyuwadee, S.; Boussiotis, V.A. Immune-related adverse effects of checkpoint immunotherapy and implications for the treatment of patients with cancer and autoimmune diseases. Front. Immunol. 2023, 14, 1197364. [Google Scholar] [CrossRef]
  7. Darvin, P.; Toor, S.M.; Sasidharan Nair, V.; Elkord, E. Immune checkpoint inhibitors: Recent progress and potential biomarkers. Exp. Mol. Med. 2018, 50, 12. [Google Scholar] [CrossRef]
  8. Khan, S.; Gerber, D.E. Autoimmunity, Checkpoint Inhibitor Therapy and Immune-related Adverse Events: A Review. Semin. Cancer Biol. 2020, 64, 93–101. [Google Scholar] [CrossRef]
  9. Hassel, J.C. Checkpoint blocker induced autoimmunity as an indicator for tumour efficacy in melanoma. Br. J. Cancer 2021, 126, 163–164. [Google Scholar] [CrossRef]
  10. Portenkirchner, C.; Kienle, P.; Horisberger, K. Checkpoint inhibitor-induced colitis—A clinical overview of incidence, prognostic implications and extension of current treatment options. Pharmaceuticals 2021, 14, 367. [Google Scholar] [CrossRef]
  11. Lo, C.H.; Khalili, H.; Lochhead, P.; Song, M.; Lopes, E.W.; Burke, K.E.; Richter, J.M.; Chan, A.T.; Ananthakrishnan, A.N. Immune-mediated disease and Risk of Crohn’s Disease or Ulcerative Colitis: A Prospective Cohort Study. Aliment. Pharmacol. Ther. 2021, 53, 598–607. [Google Scholar] [CrossRef]
  12. Jeurling, S.; Cappelli, L.C. Treatment of immune checkpoint inhibitor-induced inflammatory arthritis. Curr. Opin. Rheumatol. 2020, 32, 315–320. [Google Scholar] [CrossRef] [PubMed]
  13. Bader, G.D.; Hogue, C.W.V. An automated method for finding molecular complexes in large protein interaction networks. BMC Bioinform. 2003, 4, 2. [Google Scholar] [CrossRef] [PubMed]
  14. Iwaszko, M.; Biały, S.; Bogunia-Kubik, K. Significance of Interleukin (IL)-4 and IL-13 in Inflammatory Arthritis. Cells 2021, 10, 3000. [Google Scholar] [CrossRef] [PubMed]
  15. Eddy, K.; Shah, R.; Chen, S. Decoding Melanoma Development and Progression: Identification of Therapeutic Vulnerabilities. Front. Oncol. 2021, 10, 626129. [Google Scholar] [CrossRef]
  16. Napolitano, M.; di Vico, F.; Ruggiero, A.; Fabbrocini, G.; Patruno, C. The hidden sentinel of the skin: An overview on the role of interleukin-13 in atopic dermatitis. Front. Med. 2023, 10, 1165098. [Google Scholar] [CrossRef]
  17. Hoejberg, L.; Bastholt, L.; Schmidt, H. Interleukin-6 and melanoma. Melanoma Res. 2012, 22, 327–333. [Google Scholar] [CrossRef]
  18. Nemunaitis, J.; Fong, T.; Shabe, P.; Martineau, D.; Ando, D. Comparison of serum interleukin-10 (IL-10) levels between normal volunteers and patients with advanced melanoma. Cancer Investig. 2001, 19, 239–247. [Google Scholar] [CrossRef]
  19. Tanaka, T.; Narazaki, M.; Kishimoto, T. IL-6 in inflammation, immunity, and disease. Cold Spring Harb. Perspect. Biol. 2014, 6, a016295. [Google Scholar] [CrossRef]
  20. Voronov, E.; Carmi, Y.; Apte, R.N. The role IL-1 in tumor-mediated angiogenesis. Front. Physiol. 2014, 5, 114. [Google Scholar] [CrossRef]
  21. Iwakura, Y. Roles of IL-1 in the development of rheumatoid arthritis: Consideration from mouse models. Cytokine Growth Factor Rev. 2002, 13, 341–355. [Google Scholar] [CrossRef]
  22. Silva, F.A.R.; Rodrigues, B.L.; Ayrizono, M.D.L.S.; Leal, R.F. The Immunological Basis of Inflammatory Bowel Disease. Gastroenterol. Res. Pract. 2016, 2016, 2097274. [Google Scholar] [CrossRef] [PubMed]
  23. Hofmann, U.B.; Westphal, J.R.; Van Muijen, G.N.P.; Ruiter, D.J. Matrix metalloproteinases in human melanoma. J. Investig. Dermatol. 2000, 115, 337–344. [Google Scholar] [CrossRef] [PubMed]
  24. Cabral-Pacheco, G.A.; Garza-Veloz, I.; la Rosa, C.C.D.; Ramirez-Acuña, J.M.; Perez-Romero, B.A.; Guerrero-Rodriguez, J.F.; Martinez-Avila, N.; Martinez-Fierro, M.L. The Roles of Matrix Metalloproteinases and Their Inhibitors in Human Diseases. Int. J. Mol. Sci. 2020, 21, 9739. [Google Scholar] [CrossRef] [PubMed]
  25. Lakatos, G.; Hritz, I.; Varga, M.Z.; Juhász, M.; Miheller, P.; Cierny, G.; Tulassay, Z.; Herszényi, L. The impact of matrix metalloproteinases and their tissue inhibitors in inflammatory bowel diseases. Dig. Dis. 2012, 30, 289–295. [Google Scholar] [CrossRef] [PubMed]
  26. Guo, Y.; Pan, W.; Liu, S.; Shen, Z.; Xu, Y.; Hu, L. ERK/MAPK signalling pathway and tumorigenesis. Exp. Ther. Med. 2020, 19, 1997–2007. [Google Scholar] [CrossRef] [PubMed]
  27. Wei, Z.; Liu, H.T. MAPK signal pathways in the regulation of cell proliferation in mammalian cells. Cell Res. 2002, 12, 9–18. [Google Scholar]
  28. Skytthe, M.K.; Graversen, J.H.; Moestrup, S.K. Targeting of CD163+ Macrophages in Inflammatory and Malignant Diseases. Int. J. Mol. Sci. 2020, 21, 5497. [Google Scholar] [CrossRef]
  29. Etzerodt, A.; Moestrup, S.K. CD163 and inflammation: Biological, diagnostic, and therapeutic aspects. Antioxid. Redox Signal. 2013, 18, 2352–2363. [Google Scholar] [CrossRef]
  30. Miskolczi, Z.; Smith, M.P.; Rowling, E.J.; Ferguson, J.; Barriuso, J.; Wellbrock, C. Collagen abundance controls melanoma phenotypes through lineage-specific microenvironment sensing. Oncogene 2018, 37, 3166–3182. [Google Scholar] [CrossRef]
  31. Van Kempen, L.C.L.T.; Rijntjes, J.; Mamor-Cornelissen, I.; Vincent-Naulleau, S.; Gerritsen, M.J.P.; Ruiter, D.J.; Van Dijk, M.C.R.F.; Geffrotin, C.; Van Muijen, G.N.P. Type I collagen expression contributes to angiogenesis and the development of deeply invasive cutaneous melanoma. Int. J. Cancer 2008, 122, 1019–1029. [Google Scholar] [CrossRef]
  32. Gencoglu, H.; Orhan, C.; Sahin, E.; Sahin, K. Undenatured Type II Collagen (UC-II) in Joint Health and Disease: A Review on the Current Knowledge of Companion Animals. Animals 2020, 10, 697. [Google Scholar] [CrossRef] [PubMed]
  33. Jarlborg, M.; Gabay, C. Systemic effects of IL-6 blockade in rheumatoid arthritis beyond the joints. Cytokine 2022, 149, 155742. [Google Scholar] [CrossRef] [PubMed]
  34. Rašková, M.; Lacina, L.; Kejík, Z.; Venhauerová, A.; Skaličková, M.; Kolář, M.; Jakubek, M.; Rosel, D.; Smetana, K.; Brábek, J. The Role of IL-6 in Cancer Cell Invasiveness and Metastasis-Overview and Therapeutic Opportunities. Cells 2022, 11, 3698. [Google Scholar] [CrossRef] [PubMed]
  35. Shahini, A.; Shahini, A. Role of interleukin-6-mediated inflammation in the pathogenesis of inflammatory bowel disease: Focus on the available therapeutic approaches and gut microbiome. J. Cell Commun. Signal. 2023, 17, 55–74. [Google Scholar] [CrossRef]
  36. Schneider, B.J.; Naidoo, J.; Santomasso, B.D.; Lacchetti, C.; Adkins, S.; Anadkat, M.; Atkins, M.B.; Brassil, K.J.; Caterino, J.M.; Chau, I.; et al. Management of Immune-Related Adverse Events in Patients Treated with Immune Checkpoint Inhibitor Therapy: ASCO Guideline Update. J. Clin. Oncol. 2021, 39, 4073–4126. [Google Scholar] [CrossRef]
  37. Tanaka, R.; Okiyama, N.; Okune, M.; Ishitsuka, Y.; Watanabe, R.; Furuta, J.; Ohtsuka, M.; Otsuka, A.; Maruyama, H.; Fujisawa, Y.; et al. Serum level of interleukin-6 is increased in nivolumab-associated psoriasiform dermatitis and tumor necrosis factor-α is a biomarker of nivolumab recativity. J. Dermatol. Sci. 2017, 86, 71–73. [Google Scholar] [CrossRef]
  38. Hailemichael, Y.; Johnson, D.H.; Abdel-Wahab, N.; Foo, W.C.; Bentebibel, S.E.; Daher, M.; Haymaker, C.; Wani, K.; Saberian, C.; Ogata, D.; et al. Interleukin-6 blockade abrogates immunotherapy toxicity and promotes tumor immunity. Cancer Cell 2022, 40, 509–523.e6. [Google Scholar] [CrossRef]
  39. Lei, Y.; Li, X.; Huang, Q.; Zheng, X.; Liu, M. Progress and Challenges of Predictive Biomarkers for Immune Checkpoint Blockade. Front. Oncol. 2021, 11, 617335. [Google Scholar] [CrossRef]
  40. Khoshmirsafa, M.; Seif, F.; Bagheri, N.; Beshkar, P.; Mousavi, M.; Shirzad, H. Correlation of interleukin 6 and transforming growth factor β1 with peripheral blood regulatory T cells in rheumatoid arthritis patients: A potential biomarker. Cent. J. Immunol. 2018, 43, 281–288. [Google Scholar] [CrossRef]
  41. Li, Y.; Jia, Y.; Cui, T.; Zhang, J. IL-6/STAT3 signaling pathway regulates the proliferation and damage of intestinal epithelial cells in patients with ulcerative colitis via H3K27ac. Exp. Ther. Med. 2021, 22, 890. [Google Scholar] [CrossRef]
  42. Nikolaus, S.; Waetzig, G.H.; Butzin, S.; Ziolkiewicz, M.; Al-Massad, N.; Thieme, F.; Lövgren, U.; Rasmussen, B.B.; Reinheimer, T.M.; Seegert, D.; et al. Evaluation of interleukin-6 and its soluble receptor components sIL-6R and sgp130 as markers of inflammation in inflammatory bowel diseases. Int. J. Colorectal Dis. 2018, 33, 927–936. [Google Scholar] [CrossRef] [PubMed]
  43. Sorokina, M.; Merseburger, P.; Rajan, K.; Yirik, M.A.; Steinbeck, C. COCONUT online: Collection of Open Natural Products database. J. Cheminform. 2021, 13, 2. [Google Scholar] [CrossRef] [PubMed]
  44. Lipinski, C.A. Lead- and drug-like compounds: The rule-of-five revolution. Drug Discov. Today Technol. 2004, 1, 337–341. [Google Scholar] [CrossRef] [PubMed]
  45. Tran, Q.H.; Nguyen, Q.T.; Vo, N.Q.H.; Mai, T.T.; Tran, T.T.N.; Tran, T.D.; Le, M.T.; Trinh, D.T.T.; Minh Thai, K. Structure-based 3D-Pharmacophore modeling to discover novel interleukin 6 inhibitors: An in silico screening, molecular dynamics simulations and binding free energy calculations. PLoS ONE 2022, 17, e0266632. [Google Scholar] [CrossRef] [PubMed]
  46. Balasubramaniyan, S.; Irfan, N.; Umamaheswari, A.; Puratchikody, A. Design and virtual screening of novel fluoroquinolone analogs as effective mutant DNA GyrA inhibitors against urinary tract infection-causing fluoroquinolone resistant Escherichia coli. RSC Adv. 2018, 8, 23629–23647. [Google Scholar] [CrossRef]
  47. Pal, S.; Kumar, V.; Kundu, B.; Bhattacharya, D.; Preethy, N.; Reddy, M.P.; Talukdar, A. Ligand-based Pharmacophore Modeling, Virtual Screening and Molecular Docking Studies for Discovery of Potential Topoisomerase I Inhibitors. Comput. Struct. Biotechnol. J. 2019, 17, 291–310. [Google Scholar] [CrossRef]
  48. Smellie, A.; Kahn, S.D.; Teig, S.L. Analysis of Conformational Coverage. 1. Validation and Estimation of Coverage. J. Chem. Inf. Comput. Sci. 1995, 35, 285–294. [Google Scholar] [CrossRef]
  49. Diller, D.J.; Merz, K.M. High throughput docking for library design and library prioritization. Proteins Struct. Funct. Genet. 2001, 43, 113–124. [Google Scholar] [CrossRef]
  50. Koska, J.; Spassov, V.Z.; Maynard, A.J.; Yan, L.; Austin, N.; Flook, P.K.; Venkatachalam, C.M. Fully automated molecular mechanics based induced fit protein-ligand docking method. J. Chem. Inf. Model. 2008, 48, 1965–1973. [Google Scholar] [CrossRef]
  51. Jones, G.; Willett, P.; Glen, R.C.; Leach, A.R.; Taylor, R. Development and validation of a genetic algorithm for flexible docking. J. Mol. Biol. 1997, 267, 727–748. [Google Scholar] [CrossRef]
  52. Sherman, W.; Day, T.; Jacobson, M.P.; Friesner, R.A.; Farid, R. Novel procedure for modeling ligand/receptor induced fit effects. J. Med. Chem. 2006, 49, 534–553. [Google Scholar] [CrossRef] [PubMed]
  53. Love, L.A.; Rader, J.I.; Crofford, L.J.; Raybourne, R.B.; Principato, M.A.; Page, S.W.; Trucksess, M.W.; Smith, M.J.; Dugan, E.M.; Turner, M.L.; et al. Pathological and immunological effects of ingesting L-tryptophan and 1,1′-ethylidenebis (L-tryptophan) in Lewis rats. J. Clin. Investig. 1993, 91, 804–811. [Google Scholar] [CrossRef] [PubMed]
  54. Yamaoka, K.A.; Miyasaka, N.; Inuo, G.; Saito, I.; Kolb, J.P.; Fujita, K.; Kashiwazaki, S. 1,1′-Ethylidenebis(tryptophan) (peak E) induces functional activation of human eosinophils and interleukin 5 production from T lymphocytes: Association of eosinophilia-myalgia syndrome with a l-tryptophan contaminant. J. Clin. Immunol. 1994, 14, 50–60. [Google Scholar] [CrossRef] [PubMed]
  55. Polli, J.W.; Jarrett, J.L.; Studenberg, S.D.; Humphreys, J.E.; Dennis, S.W.; Brouwer, K.R.; Woolley, J.L. Role of P-glycoprotein on the CNS disposition of amprenavir (141W94), an HIV protease inhibitor. Pharm. Res. 1999, 16, 1206–1212. [Google Scholar] [CrossRef] [PubMed]
  56. Yu, Y.X.; Wang, W.; Sun, H.B.; Zhang, L.L.; Wu, S.L.; Liu, W.T. Insights into effect of the Asp25/Asp25′ protonation states on binding of inhibitors Amprenavir and MKP97 to HIV-1 protease using molecular dynamics simulations and MM-GBSA calculations. SAR QSAR Environ. Res. 2021, 32, 615–641. [Google Scholar] [CrossRef]
  57. Jiang, W.; Li, X.; Li, T.; Wang, H.; Shi, W.; Qi, P.; Li, C.; Chen, J.; Bao, J.; Huang, G.; et al. Repositioning of amprenavir as a novel extracellular signal-regulated kinase-2 inhibitor and apoptosis inducer in MCF-7 human breast cancer. Int. J. Oncol. 2017, 50, 823–834. [Google Scholar] [CrossRef]
  58. Yan, Y.; Tao, H.; He, J.; Huang, S.Y. The HDOCK server for integrated protein–protein docking. Nat. Protoc. 2020, 15, 1829–1852. [Google Scholar] [CrossRef]
  59. Boulanger, M.J.; Chow, D.-C.; Brevnova, E.E.; Garcia, K.C. Hexameric structure and assembly of the interieukin-6/IL-6 α-receptor/gp130 complex. Science 2003, 300, 2101–2104. [Google Scholar] [CrossRef]
  60. Piñero, J.; Bravo, Á.; Queralt-Rosinach, N.; Gutiérrez-Sacristán, A.; Deu-Pons, J.; Centeno, E.; García-García, J.; Sanz, F.; Furlong, L.I. DisGeNET: A comprehensive platform integrating information on human disease-associated genes and variants. Nucleic Acids Res. 2017, 45, D833–D839. [Google Scholar] [CrossRef]
  61. Szklarczyk, D.; Gable, A.L.; Lyon, D.; Junge, A.; Wyder, S.; Huerta-Cepas, J.; Simonovic, M.; Doncheva, N.T.; Morris, J.H.; Bork, P.; et al. STRING v11: Protein–protein association networks with increased coverage, supporting functional discovery in genome-wide experimental datasets. Nucleic Acids Res. 2019, 47, D607. [Google Scholar] [CrossRef]
  62. Kuleshov, M.V.; Jones, M.R.; Rouillard, A.D.; Fernandez, N.F.; Duan, Q.; Wang, Z.; Koplev, S.; Jenkins, S.L.; Jagodnik, K.M.; Lachmann, A.; et al. Enrichr: A comprehensive gene set enrichment analysis web server 2016 update. Nucleic Acids Res. 2016, 44, W90. [Google Scholar] [CrossRef] [PubMed]
  63. Chen, E.Y.; Tan, C.M.; Kou, Y.; Duan, Q.; Wang, Z.; Meirelles, G.V.; Clark, N.R.; Ma’ayan, A. Enrichr: Interactive and collaborative HTML5 gene list enrichment analysis tool. BMC Bioinform. 2013, 14, 128. [Google Scholar] [CrossRef] [PubMed]
  64. Somers, W.; Stahl, M.; Seehra, J.S. 1.9 A crystal structure of interleukin 6: Implications for a novel mode of receptor dimerization and signaling. EMBO J. 1997, 16, 989–997. [Google Scholar] [CrossRef] [PubMed]
  65. Gogoi, B.; Chowdhury, P.; Goswami, N.; Gogoi, N.; Naiya, T.; Chetia, P.; Mahanta, S.; Chetia, D.; Tanti, B.; Borah, P.; et al. Identification of potential plant-based inhibitor against viral proteases of SARS-CoV-2 through molecular docking, MM-PBSA binding energy calculations and molecular dynamics simulation. Mol. Divers. 2021, 25, 1963–1977. [Google Scholar] [CrossRef] [PubMed]
  66. Vanommeslaeghe, K.; Hatcher, E.; Acharya, C.; Kundu, S.; Zhong, S.; Shim, J.; Darian, E.; Guvench, O.; Lopes, P.; Vorobyov, I.; et al. CHARMM general force field: A force field for drug-like molecules compatible with the CHARMM all-atom additive biological force fields. J. Comput. Chem. 2010, 31, 671–690. [Google Scholar] [CrossRef]
  67. Sterling, T.; Irwin, J.J. ZINC 15—Ligand Discovery for Everyone. J. Chem. Inf. Model. 2015, 55, 2324–2337. [Google Scholar] [CrossRef]
  68. Yang, W.; Wang, S.; Zhang, X.; Sun, H.; Zhang, M.; Chen, H.; Cui, J.; Li, J.; Peng, F.; Zhu, M.; et al. New natural compound inhibitors of PDGFRA (platelet-derived growth factor receptor α) based on computational study for high–grade glioma therapy. Front. Neurosci. 2023, 16, 1060012. [Google Scholar] [CrossRef]
Figure 1. This workflow outlines the process for identifying a lead compound for melanoma and autoimmune disease. The methods utilized were enhanced with various filters. Initially, gene-related information for all diseases was obtained using DisGeNET. The common genes identified were then analyzed through a protein–protein interaction (PPI) molecular map using the STRING database. The resulting PPI network was further analyzed in Cytoscape for cluster identification with MCODE. The most promising cluster underwent enrichment analysis, and we used a network-based approach to identify the target. Virtual screening and molecular docking were employed to find the best compound. Finally, the stability of the lead compound (amprenavir) was assessed through a molecular dynamics (MDs) simulation.
Ijms 25 10600 g001
Figure 2. Venn diagram highlighting the overlapping genes between rheumatoid arthritis (RA), ulcerative colitis (UC), Crohn’s disease (CD), and melanoma metastasis (MM). A total of 132 genes were shared among all the disease phenotypes.
Ijms 25 10600 g002
Figure 3. A network of the 107 common genes associated with the investigated four disease phenotypes. The network was prepared using the String database, and the connections between the nodes were above the 0.7 confidence score cutoff.
Ijms 25 10600 g003
Figure 4. A network of top enriched pathways associated with the genes present in the best cluster was identified through the MCODE analysis. The enriched pathways are shown in the green rectangle boxes, the genes are shown as colored ovals, and the disease phenotypes (MM and autoimmune diseases) are shown as circular nodes. The impacts of the genes on the pathways (dashed lines) and their links to melanoma and the autoimmune disease phenotypes (dotted lines) are shown where the pointed arrowheads indicate ‘activation’ and the blunt-end arrowheads indicate ‘suppression’.
Ijms 25 10600 g004
Figure 5. Two-dimensional representation of the top two compounds (ZINC000003809192 and CNP0003038, respectively) which were extracted after virtual screening and molecular docking using the DS20222.
Ijms 25 10600 g005
Figure 6. The docked poses obtained from the HDOCK docking tool depicting the interactions between IL6R and IL6 with Amprenavir. In this illustration, IL6R is represented by two different color bases on separate chains (alpha in light green and beta in dark green), while IL6 is shown in blue. The first frame of figure (a) showcases the surface representation of IL6R, the IL6 proteins, and their interactions. Figure (b) showcases a surface representation of IL6R and the IL6 proteins with Amprenavir. Additionally, the frame provides a zoomed-in version of the surface, highlighting the interactions between IL6R, IL6, and Amprenavir.
Ijms 25 10600 g006
Figure 7. MD simulation analysis of the IL6-Amprenavir complex. (a) Hydrogen bonds and hydrophobic interactions between IL6 and Amprenavir are shown before and after the MD simulation. After the MD simulation, Amprenavir formed two additional hydrogen bonds with IL6 compared to the initial docked pose, while the hydrophobic bonds remained unchanged. The colored arrow indicates the nature of the bonds. All IL6 amino acid residues involved in the bond formation are labelled. (b) Root Mean Square Deviation (RMSD) graph of the IL6 from the docked complex over a simulation period of 50 nanoseconds (ns). (c) Root Mean Square Fluctuation (RMSF) graph of the IL6 interaction site associated with IL6R. The IL6 amino acid residues that directly interacted with IL6R are labelled. (d) Radius of gyration (Rg) graph of IL6 from the IL6-Amprenavir complex. The graph suggests that IL6 attained a more compact structure after binding with the drug.
Ijms 25 10600 g007
Table 1. Network modules generated by MCODE, with their score, number of nodes, and interactions, along with the associated gene names.
ModulesNodesInteractionMCODE ScoreGenes
1167610.133CCL2, CSF2, FGF2, IL10, IL18, IL1B, IL6, MMP1, MMP2, MMP3, MMP9, POMC, STAT3, TGFB1, TIMP1, and VEGFA
27186CREBBP, EP300, FOXO3, HIF1A, MAPK1, MDM2, and TP53
3464AKT1, CD40, CD40LG, and PIK3CG
48133.71CTNNB1, CXCL10, CXCL8, IL1A, IL4, MYC, NFKB1, and TNF
57103.33CALM1, CALM2, CALM3, CXCR4, FAS, PIK3CB, and STAT5A
6333HLA-B, HLA-C, and HLA-DQB1
Table 2. List of top 20 compounds identified after the virtual screening of the IL6 binding site responsible for interacting with IL6R.
S. No. Compound IDDatabase Compound NameLibDock Score-CDOCKER Energy (kcal/mol)
1CNP0003841CoconutN-[(3-methoxyphenyl)methyl]-3-({5-[(4-phenylpiperazin-1-yl)methyl]-1,2-oxazol-3-yl}methyl)oxetan-3-amine127.506NA
2CNP0004058Coconut2-chloro-5-hydroxy-N-{[4-hydroxy-5-(hydroxymethyl)-3-{4-[3-(trifluoromethyl)phenyl]piperazin-1-yl}oxolan-2-yl]methyl}benzamide126.919NA
3CNP0004582Coconut2-{[({3-methyl-4-[(7-methyl-1H-1,3-benzodiazol-2-yl)methyl]-6-(propan-2-yl)cyclohex-2-en-1-yl}methyl)carbamoyl]methoxy}acetic acid122.50818.4652
4CNP0004629Coconut2-{[({3-methyl-4-[(1-methyl-1H-1,3-benzodiazol-2-yl)methyl]-6-(propan-2-yl)cyclohex-2-en-1-yl}methyl)carbamoyl]methoxy}acetic acid121.35913.0031
5CNP0000288Coconut7-methoxy-2-(4-methoxyphenyl)-4-[2-(4-methoxyphenyl)ethyl]-3,4-dihydro-2H-1-benzopyran120.93625.4486
6ZINC03809192ZINC[(3S)-oxolan-3-yl] N-[(2S,3R)-4-[(4-aminophenyl)sulfonyl-(2-methylpropyl)amino]-3-hydroxy-1-phenylbutan-2-yl]carbamate120.66834.7136
7CNP0004224Coconut4-(dimethylamino)-N-[5-hydroxy-7a-(2-{[2-(1H-indol-3-yl)ethyl]carbamoyl}ethyl)-3,3,5-trimethyl-octahydro-1H-inden-1-yl]benzamide118.314NA
8CNP0004392Coconut4-[(2-{3-[2-(pyrrolidin-1-yl)pyridin-4-yl]-1,2,4-oxadiazol-5-yl}pyrrolidin-1-yl)methyl]benzoic acid118.034NA
9CNP0003909Coconut3-[4-(4-methoxyphenyl)-1H-imidazol-2-yl]-4-[(4-methylphenyl)methyl]morpholine117.75717.5344
10ZINC03955219ZINC[(3aS,4R,6aR)-2,3,3a,4,5,6a-hexahydrofuro [2,3-b]furan-4-yl] N-[(2S,3R)-4-[(4-aminophenyl)sulfonyl-(2-methylpropyl)amino]-3-hydroxy-1-phenylbutan-2-yl]carbamate117.72718.3056
11CNP0004686Coconut4-cyano-N-{2,3-dihydroxy-5-[6-(morpholin-4-yl)pyridin-3-yl]cyclopentyl}benzamide117.281NA
12CNP0004257CoconutN-[(2H-1,3-benzodioxol-5-yl)methyl]-3-({5-[(dimethylamino)methyl]-1,2-oxazol-3-yl}methyl)oxetan-3-amine116.072NA
13CNP0003888Coconut3-[4-(4-chlorophenyl)-1H-imidazol-2-yl]-4-[(1-methyl-1H-imidazol-2-yl)methyl]morpholine115.83816.6375
14CNP0004329CoconutN-[(2H-1,3-benzodioxol-4-yl)methyl]-3-({5-[(4-phenylpiperazin-1-yl)methyl]-1,2-oxazol-3-yl}methyl)oxetan-3-amine115.688NA
15CNP0004277Coconut(5-{[(3-{[5-(pyridin-2-yl)-1,2-oxazol-3-yl]methyl}oxetan-3-yl)amino]methyl}furan-2-yl)methanol115.539NA
16CNP0004720Coconut2-{[(3-{[5-(4-methoxyphenyl)-1,2-oxazol-3-yl]methyl}oxetan-3-yl)amino]methyl}phenol115.352NA
17CNP0003796CoconutN-[(4-methoxyphenyl)methyl]-3-{[5-(pyridin-2-yl)-1,2-oxazol-3-yl]methyl}oxetan-3-amine113.167NA
18CNP0004058Coconut2-chloro-5-hydroxy-N-{[4-hydroxy-5-(hydroxymethyl)-3-{4-[3-(trifluoromethyl)phenyl]piperazin-1-yl}oxolan-2-yl]methyl}benzamide112.619NA
19CNP0003038Coconut2-amino-3-(1-{1-[3-(2-amino-2-carboxyethyl)-1H-indol-1-yl]ethyl}-1H-indol-3-yl)propanoic acid111.56841.6684
20CNP0005022Coconut4-({3-[4-(pyridin-4-yl)-1H-imidazol-2-yl]morpholin-4-yl}methyl)benzoic acid111.38122.286
Disclaimer/Publisher’s Note: The statements, opinions and data contained in all publications are solely those of the individual author(s) and contributor(s) and not of MDPI and/or the editor(s). MDPI and/or the editor(s) disclaim responsibility for any injury to people or property resulting from any ideas, methods, instructions or products referred to in the content.

