

Comparison of Mitochondrial Genome Expression Differences among Four Skink Species Distributed at Different Latitudes under Low-Temperature Stress

 and
and
Abstract
:1. Introduction
2. Results
2.1. Effect of Cold Exposure on Transcript Levels of Mitochondrial PCGs
2.2. Comparison of the Number of Differentially Expressed Genes
3. Discussion
3.1. Mitochondrial Gene Expression under Low-Temperature Stress
3.2. The Relationship between Mitochondrial Gene Expressions and the CVH
4. Materials and Methods
4.1. Sample Collection, Acclimatization, and Low-Temperature Stress
4.2. DNA Extraction and Sequencing
4.3. Mitochondrial Genome Assembly and Annotation
4.4. Tissue Source, RNA Extraction and cDNA Synthesis
4.5. RT-qPCR Primer Design and Reaction
4.6. Data Analysis
5. Conclusions
Supplementary Materials
Author Contributions
Funding
Institutional Review Board Statement
Data Availability Statement
Acknowledgments
Conflicts of Interest
References
- Pincheira Donoso, D.; Bauer, A.M.; Meiri, S.; Uetz, P. Global taxonomic diversity of living reptiles. PLoS ONE 2013, 8, e59741. [Google Scholar] [CrossRef] [PubMed]
- Sun, B.J.; Williams, C.M.; Li, T.; Speakman, J.R.; Jin, Z.G.; Lu, H.L.; Luo, L.G.; Du, W.G. Higher metabolic plasticity in temperate compared to tropical lizards suggests increased resilience to climate change. Ecol. Monogr. 2022, 92, e01512. [Google Scholar] [CrossRef]
- He, J.Y.; Zhan, L.M.; Meng, S.Q.; Wang, Z.; Gao, L.L.; Wang, W.J.; Storey, K.B.; Zhang, Y.P.; Yu, D.N. Differential mitochondrial genome expression of three sympatric lizards in response to low-temperature stress. Animals 2024, 14, 1158. [Google Scholar] [CrossRef] [PubMed]
- Sun, B.J.; Li, T.; Gao, J.; Ma, L.; Du, W.G. High incubation temperatures enhance mitochondrial energy metabolism in reptile embryos. Sci. Rep. 2015, 5, 8861. [Google Scholar] [CrossRef]
- Ding, Z.H.; Wang, X.F.; Zou, T.T.; Hao, X.; Zhang, Q.; Sun, B.J.; Du, W.G. Climate warming has divergent physiological impacts on sympatric lizards. Sci. Total Environ. 2024, 912, 168992. [Google Scholar] [CrossRef]
- Stroud, J.T.; Mothes, C.C.; Beckles, W.; Heathcote, R.J.P.; Donihue, C.M.; Losos, J.B. An extreme cold event leads to community-wide convergence in lower temperature tolerance in a lizard community. Biol. Lett. 2020, 16, 20200625. [Google Scholar] [CrossRef]
- Burraco, P.; Orizaola, G.; Monaghan, P.; Metcalfe, N.B. Climate change and ageing in ectotherms. Glob. Change Biol. 2020, 26, 5371–5381. [Google Scholar] [CrossRef]
- Sokolova, I.M. Ectotherm mitochondrial economy and responses to global warming. Acta Physiol. 2023, 237, e13950. [Google Scholar] [CrossRef]
- Huey, R.B.; Kearney, M.R.; Krockenberger, A.; Holtum, J.A.; Jess, M.; Williams, S.E. Predicting organismal vulnerability to climate warming: Roles of behaviour, physiology and adaptation. Phil. Trans. R. Soc. Lond. B 2012, 367, 1665–1679. [Google Scholar] [CrossRef]
- Williams, S.E.; Shoo, L.P.; Isaac, J.L.; Hoffmann, A.A.; Langham, G. Towards an integrated framework for assessing the vulnerability of species to climate change. PLoS Biol. 2008, 6, e325. [Google Scholar] [CrossRef]
- Bonebrake, T.C.; Brown, C.J.; Bell, J.D.; Blanchard, J.L.; Chauvenet, A.; Champion, C.; Chen, I.C.; Clark, T.D.; Colwell, R.K.; Danielsen, F. Managing consequences of climate-driven species redistribution requires integration of ecology, conservation and social science. Biol. Rev. 2018, 93, 284–305. [Google Scholar] [CrossRef] [PubMed]
- Stevens, G.C. The latitudinal gradient in geographical range: How so many species coexist in the tropics. Am. Nat. 1989, 133, 240–256. [Google Scholar] [CrossRef]
- Deutsch, C.A.; Tewksbury, J.J.; Huey, R.B.; Sheldon, K.S.; Ghalambor, C.K.; Haak, D.C.; Martin, P.R. Impacts of climate warming on terrestrial ectotherms across latitude. Proc. Natl. Acad. Sci. USA 2008, 105, 6668–6672. [Google Scholar] [CrossRef] [PubMed]
- Ghalambor, C.K.; Huey, R.B.; Martin, P.R.; Tewksbury, J.J.; Wang, G. Are mountain passes higher in the tropics? Janzen’s hypothesis revisited. Integr. Comp. Biol. 2006, 46, 5–17. [Google Scholar] [CrossRef] [PubMed]
- Tewksbury, J.J.; Huey, R.B.; Deutsch, C.A. Putting the heat on tropical animals. Science 2008, 320, 1296–1297. [Google Scholar] [CrossRef]
- Gutiérrez-Pesquera, L.M.; Tejedo, M.; Olalla-Tárraga, M.Á.; Duarte, H.; Nicieza, A.; Solé, M. Testing the climate variability hypothesis in thermal tolerance limits of tropical and temperate tadpoles. J. Biogeogr. 2016, 43, 1166–1178. [Google Scholar] [CrossRef]
- Addo-Bediako, A.; Chown, S.L.; Gaston, K.J. Thermal tolerance, climatic variability and latitude. Proc. R. Soc. Lond. B Biol. Sci. 2000, 267, 739–745. [Google Scholar] [CrossRef]
- Calosi, P.; Bilton, D.T.; Spicer, J.I.; Votier, S.C.; Atfield, A. What determines a species’ geographical range? Thermal biology and latitudinal range size relationships in European diving beetles (Coleoptera: Dytiscidae). Anim. Ecol. 2010, 79, 194–204. [Google Scholar] [CrossRef]
- Smith, S.; Brauer, C.J.; Sasaki, M.; Unmack, P.J.; Guillot, G.; Laporte, M.; Bernatchez, L.; Beheregaray, L.B. Latitudinal variation in climate-associated genes imperils range edge populations. Mol. Ecol. 2020, 29, 4337–4349. [Google Scholar] [CrossRef]
- Clusella-Trullas, S.; Blackburn, T.M.; Chown, S.L. Climatic predictors of temperature performance curve parameters in ectotherms imply complex responses to climate change. Am. Nat. 2011, 177, 738–751. [Google Scholar] [CrossRef]
- Overgaard, J.; Kristensen, T.N.; Mitchell, K.A.; Hoffmann, A.A. Thermal tolerance in widespread and tropical Drosophila species: Does phenotypic plasticity increase with latitude? Am. Nat. 2011, 178, S80–S96. [Google Scholar] [CrossRef] [PubMed]
- Parmesan, C. Ecological and evolutionary responses to recent climate change. Annu. Rev. Ecol. Evol. Syst. 2006, 37, 637–669. [Google Scholar] [CrossRef]
- Pecl, G.T.; Araújo, M.B.; Bell, J.D.; Blanchard, J.; Bonebrake, T.C.; Chen, I.C.; Clark, T.D.; Colwell, R.K.; Danielsen, F.; Evengård, B. Biodiversity redistribution under climate change: Impacts on ecosystems and human well-being. Science 2017, 355, eaai9214. [Google Scholar] [CrossRef] [PubMed]
- Davis, M.B.; Shaw, R.G.; Etterson, J.R. Evolutionary responses to changing climate. Ecology 2005, 86, 1704–1714. [Google Scholar] [CrossRef]
- Morris, M.R.; Richard, R.; Leder, E.H.; Barrett, R.D.; Aubin-Horth, N.; Rogers, S.M. Gene expression plasticity evolves in response to colonization of freshwater lakes in threespine stickleback. Mol. Ecol. 2014, 23, 3226–3240. [Google Scholar] [CrossRef]
- Teplitsky, C.; Mills, J.A.; Alho, J.S.; Yarrall, J.W.; Merilä, J. Bergmann’s rule and climate change revisited: Disentangling environmental and genetic responses in a wild bird population. Proc. Natl. Acad. Sci. USA 2008, 105, 13492–13496. [Google Scholar] [CrossRef]
- Einum, S.; Burton, T. Divergence in rates of phenotypic plasticity among ectotherms. Biol. Lett. 2023, 26, 147–156. [Google Scholar] [CrossRef]
- Aguilar-Kirigin, A.J.; Naya, D.E. Latitudinal patterns in phenotypic plasticity: The case of seasonal flexibility in lizards’ fat body size. Oecologia 2013, 173, 745–752. [Google Scholar] [CrossRef]
- Gotthard, K.; Nylin, S. Adaptive plasticity and plasticity as an adaptation: A selective review of plasticity in animal morphology and life history. Oikos 1995, 74, 3–17. [Google Scholar] [CrossRef]
- Logan, M.L.; Cox, C.L. Genetic constraints, transcriptome plasticity, and the evolutionary response to climate change. Front. Genet. 2020, 11, 538226. [Google Scholar] [CrossRef]
- Kammer, A.R.; Orczewska, J.I.; O’Brien, K.M. Oxidative stress is transient and tissue specific during cold acclimation of threespine stickleback. J. Exp. Biol. 2011, 214, 1248–1256. [Google Scholar] [CrossRef] [PubMed]
- Kelly, S.A.; Panhuis, T.M.; Stoehr, A.M. Phenotypic plasticity: Molecular mechanisms and adaptive significance. Compr. Physiol. 2011, 2, 1417–1439. [Google Scholar]
- West-Eberhard, M.J. Developmental Plasticity and Evolution; Oxford University Press: New York, NY, USA, 2003. [Google Scholar]
- Guderley, H. Locomotor performance and muscle metabolic capacities: Impact of temperature and energetic status. Comp. Biochem. Physiol. 2004, 139, 371–382. [Google Scholar] [CrossRef] [PubMed]
- Podrabsky, J.E.; Somero, G.N. Changes in gene expression associated with acclimation to constant temperatures and fluctuating daily temperatures in an annual killifish Austrofundulus limnaeus. J. Exp. Biol. 2004, 207, 2237–2254. [Google Scholar] [CrossRef] [PubMed]
- Itoi, S.; Kinoshita, S.; Kikuchi, K.; Watabe, S. Changes of carp FoF1-ATPase in association with temperature acclimation. Am. J. Physiol. Integr. Comp. Physiol. 2003, 284, R153–R163. [Google Scholar] [CrossRef] [PubMed]
- Gracey, A.Y.; Fraser, E.J.; Li, W.; Fang, Y.; Taylor, R.R.; Rogers, J.; Brass, A.; Cossins, A.R. Coping with cold: An integrative, multitissue analysis of the transcriptome of a poikilothermic vertebrate. Proc. Natl. Acad. Sci. USA 2004, 101, 16970–16975. [Google Scholar] [CrossRef]
- Vornanen, M.; Hassinen, M.; Koskinen, H.; Krasnov, A. Steady-state effects of temperature acclimation on the transcriptome of the rainbow trout heart. Am. J. Physiol. Regul. Integr. Comp. Physiol. 2005, 289, R1177–R1184. [Google Scholar] [CrossRef]
- Chou, M.Y.; Hsiao, C.D.; Chen, S.C.; Chen, I.W.; Liu, S.T.; Hwang, P.P. Effects of hypothermia on gene expression in zebrafish gills: Upregulation in differentiation and function of ionocytes as compensatory responses. J. Exp. Biol. 2008, 211, 3077–3084. [Google Scholar] [CrossRef]
- Bennett, C.F.; Latorre-Muro, P.; Puigserver, P. Mechanisms of mitochondrial respiratory adaptation. Nat. Rev. Mol. Cell Biol. 2022, 23, 817–835. [Google Scholar] [CrossRef]
- Healy, T.M.; Bryant, H.J.; Schulte, P.M. Mitochondrial genotype and phenotypic plasticity of gene expression in response to cold acclimation in killifish. Mol. Ecol. 2017, 26, 814–830. [Google Scholar] [CrossRef]
- Ballard, J.W.O.; Pichaud, N. Mitochondrial DNA: More than an evolutionary bystander. Funct. Ecol. 2014, 28, 218–231. [Google Scholar] [CrossRef]
- Chong, R.A.; Mueller, R.L. Low metabolic rates in salamanders are correlated with weak selective constraints on mitochondrial genes. Evolution 2013, 67, 894–899. [Google Scholar] [CrossRef] [PubMed]
- Zhang, K.; Sun, J.; Xu, T.; Qiu, J.W.; Qian, P.Y. Phylogenetic relationships and adaptation in deep-sea mussels: Insights from mitochondrial genomes. Int. J. Mol. Sci. 2021, 22, 1900. [Google Scholar] [CrossRef] [PubMed]
- Luo, Y.J.; Gao, W.X.; Gao, Y.Q.; Tang, S.; Huang, Q.Y.; Tan, X.L.; Chen, J.; Huang, T. Mitochondrial genome analysis of Ochotona curzoniae and implication of cytochrome c oxidase in hypoxic adaptation. Mitochondrion 2008, 8, 352–357. [Google Scholar] [CrossRef]
- Zhang, X.; Chen, J.; Luo, H.Y.; Chen, X.; Zhong, J.; Ji, X. Climate-driven mitochondrial selection in lacertid lizards. Ecol. Evol. 2024, 14, e11176. [Google Scholar] [CrossRef]
- Powers, D.A.; Smith, M.; Gonzalez Villasenor, I.; DiMichele, L. A Multidisciplinary Approach to the Selectionist/Neutralist Controversy Using the Model Teleost, Fundulus heteroclitus; Oxford University Press: New York, NY, USA, 1993; Volume 9. [Google Scholar]
- Powers, D.A.; Schulte, P.M. Evolutionary adaptations of gene structure and expression in natural populations in relation to a changing environment: A multidisciplinary approach to address the million-year saga of a small fish. J. Exp. Zool. 1998, 282, 71–94. [Google Scholar] [CrossRef]
- Schulte, P.M. Environmental adaptations as windows on molecular evolution. Comp. Biochem. Physiol. B Biochem. Mol. Biol. 2001, 128, 597–611. [Google Scholar] [CrossRef]
- Whitehead, A.; Crawford, D.L. Neutral and adaptive variation in gene expression. Proc. Natl. Acad. Sci. USA 2006, 103, 5425–5430. [Google Scholar] [CrossRef]
- Dayan, D.I.; Crawford, D.L.; Oleksiak, M.F. Phenotypic plasticity in gene expression contributes to divergence of locally adapted populations of Fundulus heteroclitus. Mol. Ecol. 2015, 24, 3345–3359. [Google Scholar] [CrossRef]
- Hong, Y.H.; Yuan, Y.N.; Li, K.; Storey, K.B.; Zhang, J.Y.; Zhang, S.S.; Yu, D.N. Differential mitochondrial genome expression of four Hylid frog species under low-temperature stress and its relationship with Amphibian temperature adaptation. Int. J. Mol. Sci. 2024, 25, 5967. [Google Scholar] [CrossRef]
- Hedges, S.B. The high-level classification of skinks (Reptilia, Squamata, Scincomorpha). Zootaxa 2014, 3765, 317–338. [Google Scholar] [CrossRef] [PubMed]
- Cai, B.; Wang, Y.Z.; Chen, Y.Y.; Li, J. A revised taxonomy for Chinese reptiles. Biodivers. Sci. 2015, 23, 365–382. [Google Scholar] [CrossRef]
- Kurita, K.; Ota, H.; Hikida, T. A new species of Plestiodon (Squamata: Scincidae) from the Senkaku Group, Ryukyu Archipelago, Japan. Zootaxa 2017, 4254, 520–536. [Google Scholar] [CrossRef] [PubMed]
- Brandley, M.C.; Ota, H.; Hikida, T.; de Oca, A.N.M.; Feria-Ortiz, M.; Guo, X.; Wang, Y. The phylogenetic systematics of blue-tailed skinks (Plestiodon) and the family Scincidae. Zool. J. Linn. Soc. 2012, 165, 163–189. [Google Scholar] [CrossRef]
- Jiang, Y.F. A study on habit of Eumeces capito. Sichuan J. Zool. 2005, 24, 370–372. [Google Scholar]
- Pope, C.H.; Granger, W. Notes on Reptiles from Fukien and Other Chinese Provinces. Bull. AMNH 1929, 58, 8. [Google Scholar]
- Norval, G.; Huang, S.-C.; Mao, J.-J.; Goldberg, S.R. Notes on some dietary items of Eutropis longicaudata (Hallowell, 1857), Japalura polygonata xanthostoma Ota, 1991, Plestiodon elegans (Boulenger, 1887), and Sphenomorphus indicus (Gray, 1853) from Taiwan. Herpetol. Notes 2012, 5, 453–456. [Google Scholar]
- Uetz, P.; Koo, M.S.; Aguilar, R.; Brings, E.; Catenazzi, A.; Chang, A.T.; Wake, D. A quarter century of reptile and amphibian databases. Herpetol. Rev 2021, 52, 246–255. [Google Scholar]
- Zang, X.Y.; Guo, J.L.; Geng, X.F.; Li, P.F.; Sun, J.Y.; Wang, Q.W.; Xu, C.S. Proteome analysis of the liver in the Chinese fire-bellied newt Cynops orientalis. Genet. Mol. Res 2016, 15, 15037993. [Google Scholar] [CrossRef]
- Wu, Z.; Sainz, A.G.; Shadel, G.S. Mitochondrial DNA: Cellular genotoxic stress sentinel. Trends Biochem. Sci. 2021, 46, 812–821. [Google Scholar] [CrossRef]
- Gustafsson, C.M.; Falkenberg, M.; Larsson, N.-G. Maintenance and expression of mammalian mitochondrial DNA. Annu. Rev. Biochem. 2016, 85, 133–160. [Google Scholar] [CrossRef] [PubMed]
- Ritchie, D.J.; Friesen, C.R. Invited review: Thermal effects on oxidative stress in vertebrate ectotherms. Comp. Biochem. Physiol. A Mol. Integr. Physiol. 2022, 263, 111082. [Google Scholar] [CrossRef] [PubMed]
- Zhang, K.Z.; Wang, G.H.; Zhang, X.B.; Huttemann, P.P.; Qiu, Y.; Liu, J.; Mitchell, A.; Lee, I.; Zhang, C.; Lee, J.S.; et al. COX7AR is a Stress-inducible Mitochondrial COX Subunit that Promotes Breast Cancer Malignancy. Sci. Rep. 2016, 6, 31742. [Google Scholar] [CrossRef] [PubMed]
- Timon-Gomez, A.; Nyvltova, E.; Abriata, L.A.; Vila, A.J.; Hosler, J.; Barrientos, A. Mitochondrial cytochrome c oxidase biogenesis: Recent developments. Semin. Cell Dev. Biol. 2018, 76, 163–178. [Google Scholar] [CrossRef]
- Formosa, L.E.; Dibley, M.G.; Stroud, D.A.; Ryan, M.T. Building a complex complex: Assembly of mitochondrial respiratory chain complex I. Semin. Cell Dev. Biol. 2018, 76, 154–162. [Google Scholar] [CrossRef]
- Barbhuiya, P.A.; Uddin, A.; Chakraborty, S. Codon usage pattern and evolutionary forces of mitochondrial ND genes among orders of class Amphibia. J. Cell. Physiol. 2021, 236, 2850–2868. [Google Scholar] [CrossRef]
- Romshin, A.M.; Osypov, A.A.; Popova, I.Y.; Zeeb, V.E.; Sinogeykin, A.G.; Vlasov, I.I. Heat release by isolated mouse brain mitochondria detected with diamond thermometer. Nanomaterials 2022, 13, 98. [Google Scholar] [CrossRef]
- Zhan, L.M.; He, J.Y.; Meng, S.Q.; Guo, Z.Q.; Chen, Y.X.; Storey, K.B.; Zhang, J.Y.; Yu, D.N. Mitochondrial protein-coding gene expression in the lizard Sphenomorphus incognitus (Squamata: Scincidae) responding to different temperature stresses. Animals 2024, 14, 1671. [Google Scholar] [CrossRef]
- Niu, Y.G.; Wei, D.B.; Zhang, X.J.; Xu, T.S.; Li, X.Y.; Zhang, H.Y.; An, Z.F.; Kenneth, B.S.; Chen, Q. Surviving winter on the Qinghai-Xizang Plateau: Extensive reversible protein phosphorylation plays a dominant role in regulating hypometabolism in hibernating Nanorana parkeri. Zool. Res. 2024, 45, 1–12. [Google Scholar] [CrossRef]
- Rak, M.; Su, C.H.; Xu, J.T.; Azpiroz, R.; Singh, A.M.; Tzagoloff, A. Regulation of mitochondrial translation of the ATP8/ATP6 mRNA by Smt1p. Mol. Biol. Cell 2016, 27, 6919–6929. [Google Scholar] [CrossRef]
- Kagawa, Y.; Hamamoto, T.; Endo, H.; Ichida, M.; Shibui, H.; Hayakawa, M. Genes of human ATP synthase: Their roles in physiology and aging. Biosci. Rep. 1997, 17, 115–146. [Google Scholar] [CrossRef] [PubMed]
- Zhang, Q.L.; Zhang, L.; Zhao, T.X.; Wang, J.; Zhu, Q.H.; Chen, J.Y.; Yuan, M.L. Gene sequence variations and expression patterns of mitochondrial genes are associated with the adaptive evolution of two Gynaephora species (Lepidoptera: Lymantriinae) living in different high-elevation environments. Gene 2017, 610, 148–155. [Google Scholar] [CrossRef]
- Cizkova, A.; Stranecky, V.; Ivanek, R.; Hartmannova, H.; Noskova, L.; Piherova, L.; Tesarova, M.; Hansikova, H.; Honzik, T.; Zeman, J.; et al. Development of a human mitochondrial oligonucleotide microarray (h-MitoArray) and gene expression analysis of fibroblast cell lines from 13 patients with isolated F1F0 ATP synthase deficiency. BMC Genom. 2008, 9, 38. [Google Scholar] [CrossRef] [PubMed]
- Chen, L.; Lin, Y.; Xiao, Q.; Lin, Y.; Du, Y.; Lin, C.; Ward-Fear, G.; Hu, C.; Qu, Y.; Li, H. Characterization of the complete mitochondrial genome of the many-lined sun skink (Eutropis multifasciata) and comparison with other Scincomorpha species. Genomics 2021, 113, 2526–2536. [Google Scholar] [CrossRef] [PubMed]
- Yu, X.; Wester-Rosenlöf, L.; Gimsa, U.; Holzhueter, S.-A.; Marques, A.; Jonas, L.; Hagenow, K.; Kunz, M.; Nizze, H.; Tiedge, M. The mtDNA nt7778 G/T polymorphism affects autoimmune diseases and reproductive performance in the mouse. Hum. Mol. Genet. 2009, 18, 4689–4698. [Google Scholar] [CrossRef] [PubMed]
- Brown, J.A.; Sammy, M.J.; Ballinger, S.W. An evolutionary, or “Mitocentric” perspective on cellular function and disease. Redox Biol. 2020, 36, 101568. [Google Scholar] [CrossRef]
- Willmer, P. Biochemical adaptation-Mechanism and process in physiological evolution. Science 2002, 296, 473. [Google Scholar] [CrossRef]
- Todgham, A.E.; Hoaglund, E.A.; Hofmann, G.E. Is cold the new hot? Elevated ubiquitin-conjugated protein levels in tissues of Antarctic fish as evidence for cold-denaturation of proteins in vivo. J. Comp. Physiol. B 2007, 177, 857–866. [Google Scholar] [CrossRef]
- Feiner, N.; Rago, A.; While, G.M.; Uller, T. Developmental plasticity in reptiles: Insights from temperature-dependent gene expression in wall lizard embryos. J. Exp. Zool. A Ecol. Integr. Physiol. 2018, 329, 351–361. [Google Scholar] [CrossRef]
- Bury, S.; Cichoń, M.; Bauchinger, U.; Sadowska, E.T. High oxidative stress despite low energy metabolism and vice versa: Insights through temperature acclimation in an ectotherm. J. Therm. Biol 2018, 78, 36–41. [Google Scholar] [CrossRef]
- Allan, M.E.; Storey, K.B. Expression of NF-κB and downstream antioxidant genes in skeletal muscle of hibernating ground squirrels, Spermophilus tridecemlineatus. Cell Biochem. Funct. 2012, 30, 166–174. [Google Scholar] [CrossRef] [PubMed]
- Vucetic, M.; Stancic, A.; Otasevic, V.; Jankovic, A.; Korac, A.; Markelic, M.; Velickovic, K.; Golic, I.; Buzadzic, B.; Storey, K.B. The impact of cold acclimation and hibernation on antioxidant defenses in the ground squirrel (Spermophilus citellus): An update. Free Radical Biol. Med. 2013, 65, 916–924. [Google Scholar] [CrossRef]
- Zari, T.A. Seasonal acclimation in resting metabolism of the skink, Mabuya brevicollis (Reptilia: Scincidae) from southwestern Saudi Arabia. J. Therm. Biol. 2013, 38, 449–453. [Google Scholar] [CrossRef]
- Gregory, S.A. Biology of the Reptilia; Academic Press: London, UK, 1982; Volume 13, pp. 53–154. [Google Scholar]
- Christian, K.A.; Conley, K.E. Activity and resting metabolism of varanid lizards compared with ‘typical’ lizards. Aust. J. Zool. 1994, 42, 185–193. [Google Scholar] [CrossRef]
- Umina, P.A.; Weeks, A.R.; Kearney, M.R.; McKechnie, S.W.; Hoffmann, A.A. A rapid shift in a classic clinal pattern in Drosophila reflecting climate change. Science 2005, 308, 691–693. [Google Scholar] [CrossRef] [PubMed]
- Powers, D.A.; Lauerman, T.; Crawford, D.; DiMichele, L. Genetic mechanisms for adapting to a changing environment. Annu. Rev. Genet. 1991, 25, 629–660. [Google Scholar] [CrossRef]
- Somero, G. The physiology of climate change: How potentials for acclimatization and genetic adaptation will determine ‘winners’ and ‘losers’. J. Exp. Biol. 2010, 213, 912–920. [Google Scholar] [CrossRef]
- Hoffmann, A.A.; Sgrò, C.M. Climate change and evolutionary adaptation. Nature 2011, 470, 479–485. [Google Scholar] [CrossRef]
- Amarasekare, P.; Savage, V. A framework for elucidating the temperature dependence of fitness. Am. Nat. 2012, 179, 178–191. [Google Scholar] [CrossRef]
- Mi, C.R.; Han, X.Z.; Jiang, Z.W.; Zeng, Z.G.; Du, W.G.; Sun, B.J. Precipitation and temperature primarily determine the reptile distributions in China. Ecography 2024, e07005. [Google Scholar] [CrossRef]
- Gunderson, A.R.; Stillman, J.H. Plasticity in thermal tolerance has limited potential to buffer ectotherms from global warming. Proc. R. Soc. B 2015, 282, 20150401. [Google Scholar] [CrossRef] [PubMed]
- Rivera, H.E.; Aichelman, H.E.; Fifer, J.E.; Kriefall, N.G.; Wuitchik, D.M.; Wuitchik, S.J.S.; Davies, S.W. A framework for understanding gene expression plasticity and its influence on stress tolerance. Ecol. Evol. 2021, 30, 1381–1397. [Google Scholar] [CrossRef] [PubMed]
- Chown, S.; Gaston, K.; Robinson, D. Macrophysiology: Large-Scale Patterns in Physiological Traits and Their Ecological Implications; Wiley Online Library: Hoboken, NJ, USA, 2004; Volume 18, pp. 159–167. [Google Scholar]
- Bozinovic, F.; Calosi, P.; Spicer, J.I. Physiological correlates of geographic range in animals. Annu. Rev. Ecol. Evol. Syst. 2011, 42, 155–179. [Google Scholar] [CrossRef]
- Huey, R.B.; Deutsch, C.A.; Tewksbury, J.J.; Vitt, L.J.; Hertz, P.E.; Álvarez Pérez, H.J.; Garland, T., Jr. Why tropical forest lizards are vulnerable to climate warming. Proc. R. Soc. B 2009, 276, 1939–1948. [Google Scholar] [CrossRef]
- Lancaster, L.T.; Dudaniec, R.Y.; Chauhan, P.; Wellenreuther, M.; Svensson, E.I.; Hansson, B. Gene expression under thermal stress varies across a geographical range expansion front. Ecol. Evol. 2016, 25, 1141–1156. [Google Scholar] [CrossRef]
- Wang, J.Y.; Zhang, L.H.; Hong, Y.H.; Cai, L.N.; Storey, K.B.; Zhang, J.Y.; Zhang, S.S.; Yu, D.N. How does mitochondrial protein-coding gene expression in Fejervarya kawamurai (Anura: Dicroglossidae) respond to extreme temperatures? Animals 2023, 13, 3015. [Google Scholar] [CrossRef]
- Kumazawa, Y.; Endo, H. Mitochondrial genome of the Komodo dragon: Efficient sequencing method with reptile-oriented primers and novel gene rearrangements. DNA Res. 2004, 11, 115–125. [Google Scholar] [CrossRef]
- Lalitha, S. Primer Premier 5. Biotech. Softw. Internet Rep. 2000, 1, 270–272. [Google Scholar] [CrossRef]
- Dierckxsens, N.; Mardulyn, P.; Smits, G. NOVOPlasty: De novo assembly of organelle genomes from whole genome data. Nucleic Acids Res. 2017, 45, e18. [Google Scholar]
- Jin, J.J.; Yu, W.B.; Yang, J.B.; Song, Y.; DePamphilis, C.W.; Yi, T.S.; Li, D.Z. GetOrganelle: A fast and versatile toolkit for accurate de novo assembly of organelle genomes. Genome Biol. 2020, 21, 241. [Google Scholar] [CrossRef]
- Burland, T.G. DNASTAR’s Lasergene sequence analysis software. In Bioinformatics Methods and Protocols; Humana Press: Totowa, NJ, USA, 1999; Volume 132, pp. 71–91. [Google Scholar]
- Kumar, S.; Stecher, G.; Tamura, K. MEGA7: Molecular evolutionary genetics analysis version 7.0 for bigger datasets. Mol. Biol. Evol. 2016, 33, 1870–1874. [Google Scholar] [CrossRef] [PubMed]
- Biederman, J.; Yee, J.; Cortes, P. Validation of internal control genes for gene expression analysis in diabetic glomerulosclerosis. Kidney Int. 2004, 66, 2308–2314. [Google Scholar] [CrossRef] [PubMed]
- Cai, L.N.; Zhang, L.H.; Lin, Y.J.; Wang, J.Y.; Storey, K.B.; Zhang, J.Y.; Yu, D.N. Two-fold ND5 genes, three-fold control regions, incRNA, and the “missing” ATP8 found in the mitogenomes of Polypedates megacephalus (Rhacophridae: Polypedates). Animals 2023, 13, 2857. [Google Scholar] [CrossRef] [PubMed]
- Moeller, A.H.; Ivey, K.; Cornwall, M.B.; Herr, K.; Rede, J.; Taylor, E.N.; Gunderson, A.R. The lizard gut microbiome changes with temperature and is associated with heat tolerance. App. Environ. Microb. 2020, 86, e01181-20. [Google Scholar] [CrossRef]
- May, R.A.; Stevenson, K.J. Software review of Origin 8. J. Am. Chem. Soc. 2009, 131, 872. [Google Scholar] [CrossRef]


| Collection Time | Species | Sex | Latitude (N) | Longitude (E) | Altitude | Locality | Accession No. |
|---|---|---|---|---|---|---|---|
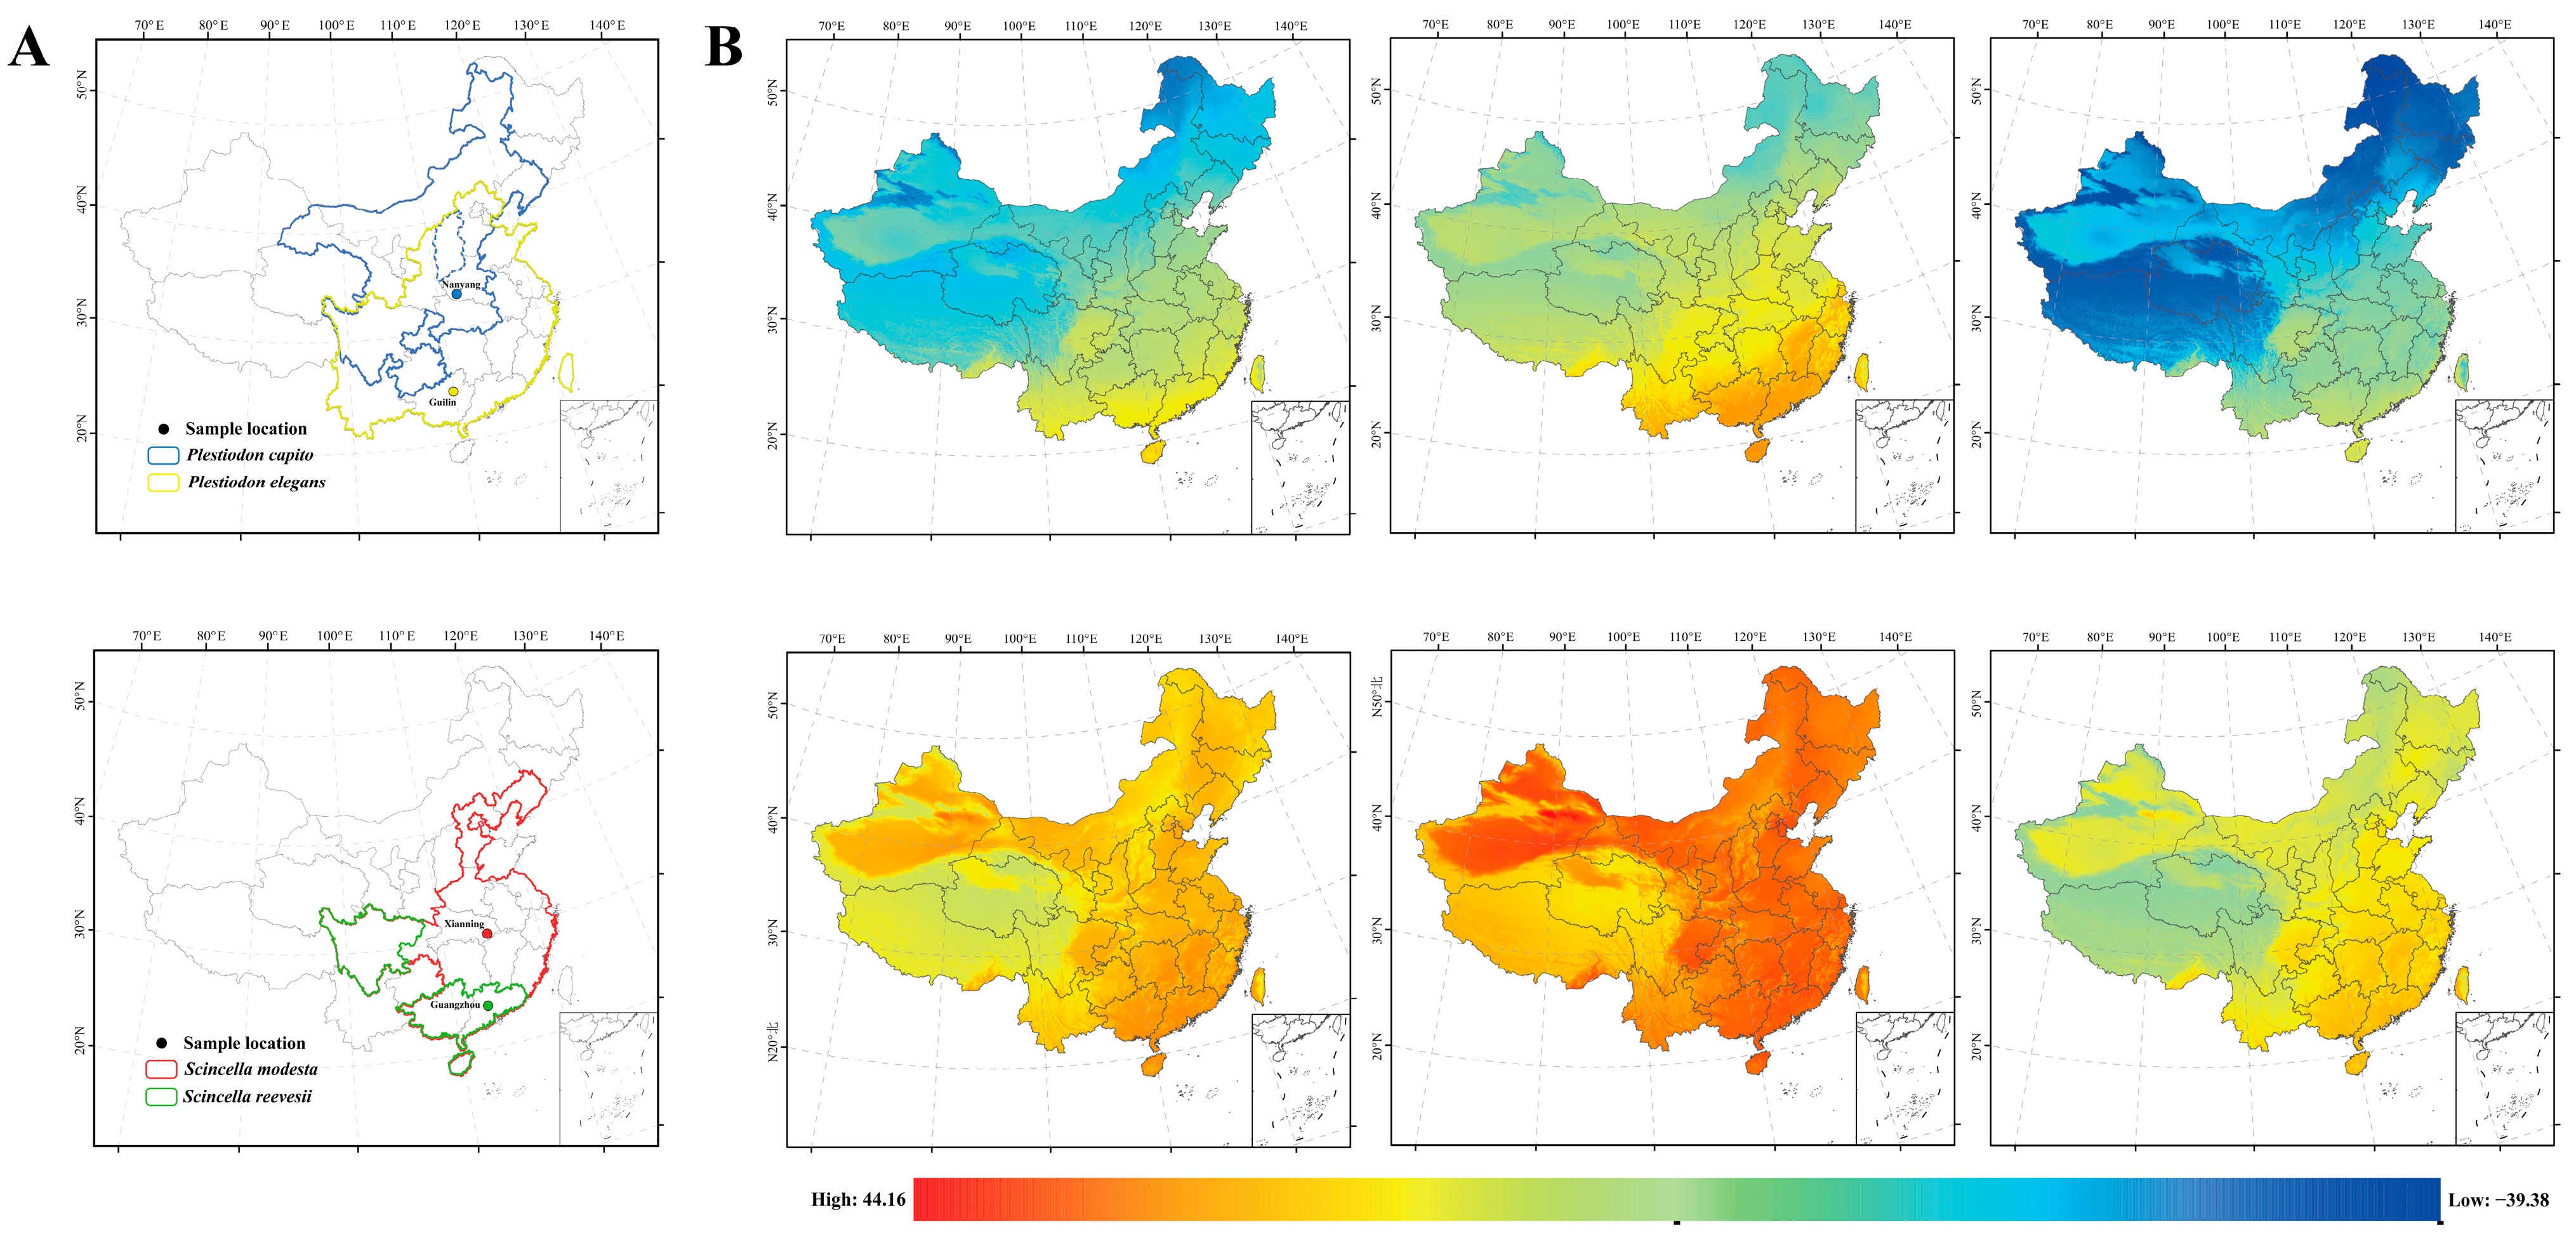
| Spring | Plestiodon elegans | male | 24°18′ | 109°42′ | 202 m | Guilin, Guangxi | PP946410 |
| Spring | Plestiodon capito | male | 33°08′ | 112°21′ | 203 m | Nanyang, Henan | PP946409 |
| Spring | Scincella reevesii | male | 23°11′ | 113°23′ | 204 m | Guangzhou, Guangdong | PP946408 |
| Spring | Scincella modesta | male | 29°34′ | 114°29′ | 218 m | Xianning, Hubei | PP946411 |
| Group | Gene | ||||||||||||
|---|---|---|---|---|---|---|---|---|---|---|---|---|---|
| COI | COII | COIII | ATP8 | ATP6 | ND1 | ND2 | ND3 | ND4 | ND4L | ND5 | ND6 | CYTB | |
| S. modesta (4 °C) | − | − | − | − | − | − | − | + | − | ||||
| S. modesta (8 °C) | + | + | − | + | + | + | + | ||||||
| S. reevesii (8 °C) | − | − | |||||||||||
| P. elegans (8 °C) | − | − | − | − | − | ||||||||
| P. capito (8 °C) | − | − | − | − | − | − | − | ||||||
Disclaimer/Publisher’s Note: The statements, opinions and data contained in all publications are solely those of the individual author(s) and contributor(s) and not of MDPI and/or the editor(s). MDPI and/or the editor(s) disclaim responsibility for any injury to people or property resulting from any ideas, methods, instructions or products referred to in the content. |
© 2024 by the authors. Licensee MDPI, Basel, Switzerland. This article is an open access article distributed under the terms and conditions of the Creative Commons Attribution (CC BY) license (https://creativecommons.org/licenses/by/4.0/).
Share and Cite
Zhan, L.; He, J.; Ding, L.; Storey, K.B.; Zhang, J.; Yu, D. Comparison of Mitochondrial Genome Expression Differences among Four Skink Species Distributed at Different Latitudes under Low-Temperature Stress. Int. J. Mol. Sci. 2024, 25, 10637. https://doi.org/10.3390/ijms251910637
Zhan L, He J, Ding L, Storey KB, Zhang J, Yu D. Comparison of Mitochondrial Genome Expression Differences among Four Skink Species Distributed at Different Latitudes under Low-Temperature Stress. International Journal of Molecular Sciences. 2024; 25(19):10637. https://doi.org/10.3390/ijms251910637
Chicago/Turabian StyleZhan, Lemei, Jingyi He, Lingyi Ding, Kenneth B. Storey, Jiayong Zhang, and Danna Yu. 2024. "Comparison of Mitochondrial Genome Expression Differences among Four Skink Species Distributed at Different Latitudes under Low-Temperature Stress" International Journal of Molecular Sciences 25, no. 19: 10637. https://doi.org/10.3390/ijms251910637
APA StyleZhan, L., He, J., Ding, L., Storey, K. B., Zhang, J., & Yu, D. (2024). Comparison of Mitochondrial Genome Expression Differences among Four Skink Species Distributed at Different Latitudes under Low-Temperature Stress. International Journal of Molecular Sciences, 25(19), 10637. https://doi.org/10.3390/ijms251910637