Abstract
The TaqIA polymorphism is a marker of both the Ankyrin Repeat and Kinase Domain containing I gene (ANKK1) encoding a RIP-kinase, and the DRD2 gene for the dopamine receptor D2. Despite a large number of studies of TaqIA in addictions and other psychiatric disorders, there is difficulty in interpreting this genetic phenomenon due to the lack of knowledge about ANKK1 function. In SH-SY5Y neuroblastoma models, we show that ANKK1 interacts with the synapse protein FERM ARH/RhoGEF and Pleckstrin Domain 1 (FARP1), which is a guanine nucleotide exchange factor (GEF) of the RhoGTPases RAC1 and RhoA. ANKK1–FARP1 colocalized in F-ACTIN-rich structures for neuronal maturation and migration, and both proteins activate the Wnt/PCP pathway. ANKK1, but not FARP1, promotes neuritogenesis, and both proteins are involved in neuritic spine outgrowth. Notably, the knockdown of ANKK1 or FARP1 affects RhoGTPases expression and neural differentiation. Additionally, ANKK1 binds WGEF, another GEF of Wnt/PCP, regulating its interaction with RhoA. During neuronal differentiation, ANKK1–WGEF interaction is downregulated, while ANKK1–FARP1 interaction is increased, suggesting that ANKK1 recruits Wnt/PCP components for bidirectional control of F-ACTIN assembly. Our results suggest a brain structural basis in TaqIA-associated phenotypes.
1. Introduction
Addictions are psychiatric disorders characterized by dysregulation of motivational circuits, reward deficits, and modification of learning systems in the brain [1]. Twin studies [2], recurrence in families [3,4], and inherited alterations in brain structure [5,6] support that the risk of developing substance-use disorders has an important hereditary component.
The TaqIA single nucleotide variant (SNV, rs1800497) located in the Ankyrin Repeat and Kinase domain containing 1 gene (ANKK1) [7] has been associated with addictions in a huge number of studies [8]. TaqIA consists of a C/T change producing two alleles referred to as A2 (C) and A1 (T). Blum et al. first reported the association between alcoholism and the TaqIA A1 allele and the A1+ genotype (hetero- or homozygous for A1) [9]. As ANKK1 is adjacent to the DRD2 gene for the dopamine D2 receptor and the TaqIA is a marker of both genes [10], it is difficult to interpret the TaqIA-association genetic phenomenon [8,11,12]. We previously found ANKK1 association with the dopaminergic system in a series of patients with antisocial alcoholism [13], in human peripheral blood mononuclear cells [8] and cellular models [10,14], and in the mouse brain [15]. In zebrafish and mouse models, the link of Ankk1 with the dopaminergic system has been reported [16,17]. Additionally, ANKK1 localizes to radial glia and other neural progenitors, suggesting its participation in shaping brain structure [10,18]. However, the precise function of ANKK1 is still unknown.
ANKK1 belongs to the Receptor Interacting Protein Kinases (RIPKs) family that share homologous kinase domains with unusual flexibility and conformation roles that extend beyond catalytic functions [19]. RIPKs participate in cell death [20], intracellular inflammatory signaling [21], and/or cellular differentiation [22]. ANKK1 is the RIPK5, which contains 765 amino acids, including an N-terminal RIP kinase and a C-terminal ankyrin repeats domain where the TaqIA SNV produces a Glu713-to-Lys (p.Glu713Lys) substitution [7]. RIPK4, which shares the RIP kinase and ankyrin repeats domain with ANKK1, is needed for skin development during embryogenesis and normal skin tissue epidermal differentiation in adults [23].
In this study, we show that ANKK1 is a binding partner of FARP1 (FERM, ARH/RhoGEF, and Pleckstrin Domain Protein 1), a guanine nucleotide exchange factor (GEF) of RhoGTPases [24]. FARP1 is involved in neural development through interactions with cell surface proteins and activation of RhoGTPases regulating dendritic filopodia and spine morphology [24], axon guidance and extension, dendritic complexity, and the number of spines [25,26]. Given that both ANKK1 and FARP1 are expressed during prenatal and postnatal neurodevelopment [10,18,25], we hypothesize that ANKK1–FARP1 interaction participates in neurogenic pathways, where regulation of FARP1 activity by ANKK1 plays a key role. We have discovered in SH-SY5Y cell models, both as proliferative neuroblasts and during differentiation as neuron-like phenotype, the function of ANKK1 as a scaffold protein in the Wnt/PCP pathway for neural F-ACTIN assembly.
2. Results
2.1. ANKK1 and FARP1 Interact in Neural Cells and Colocalize in Neuritic Structures
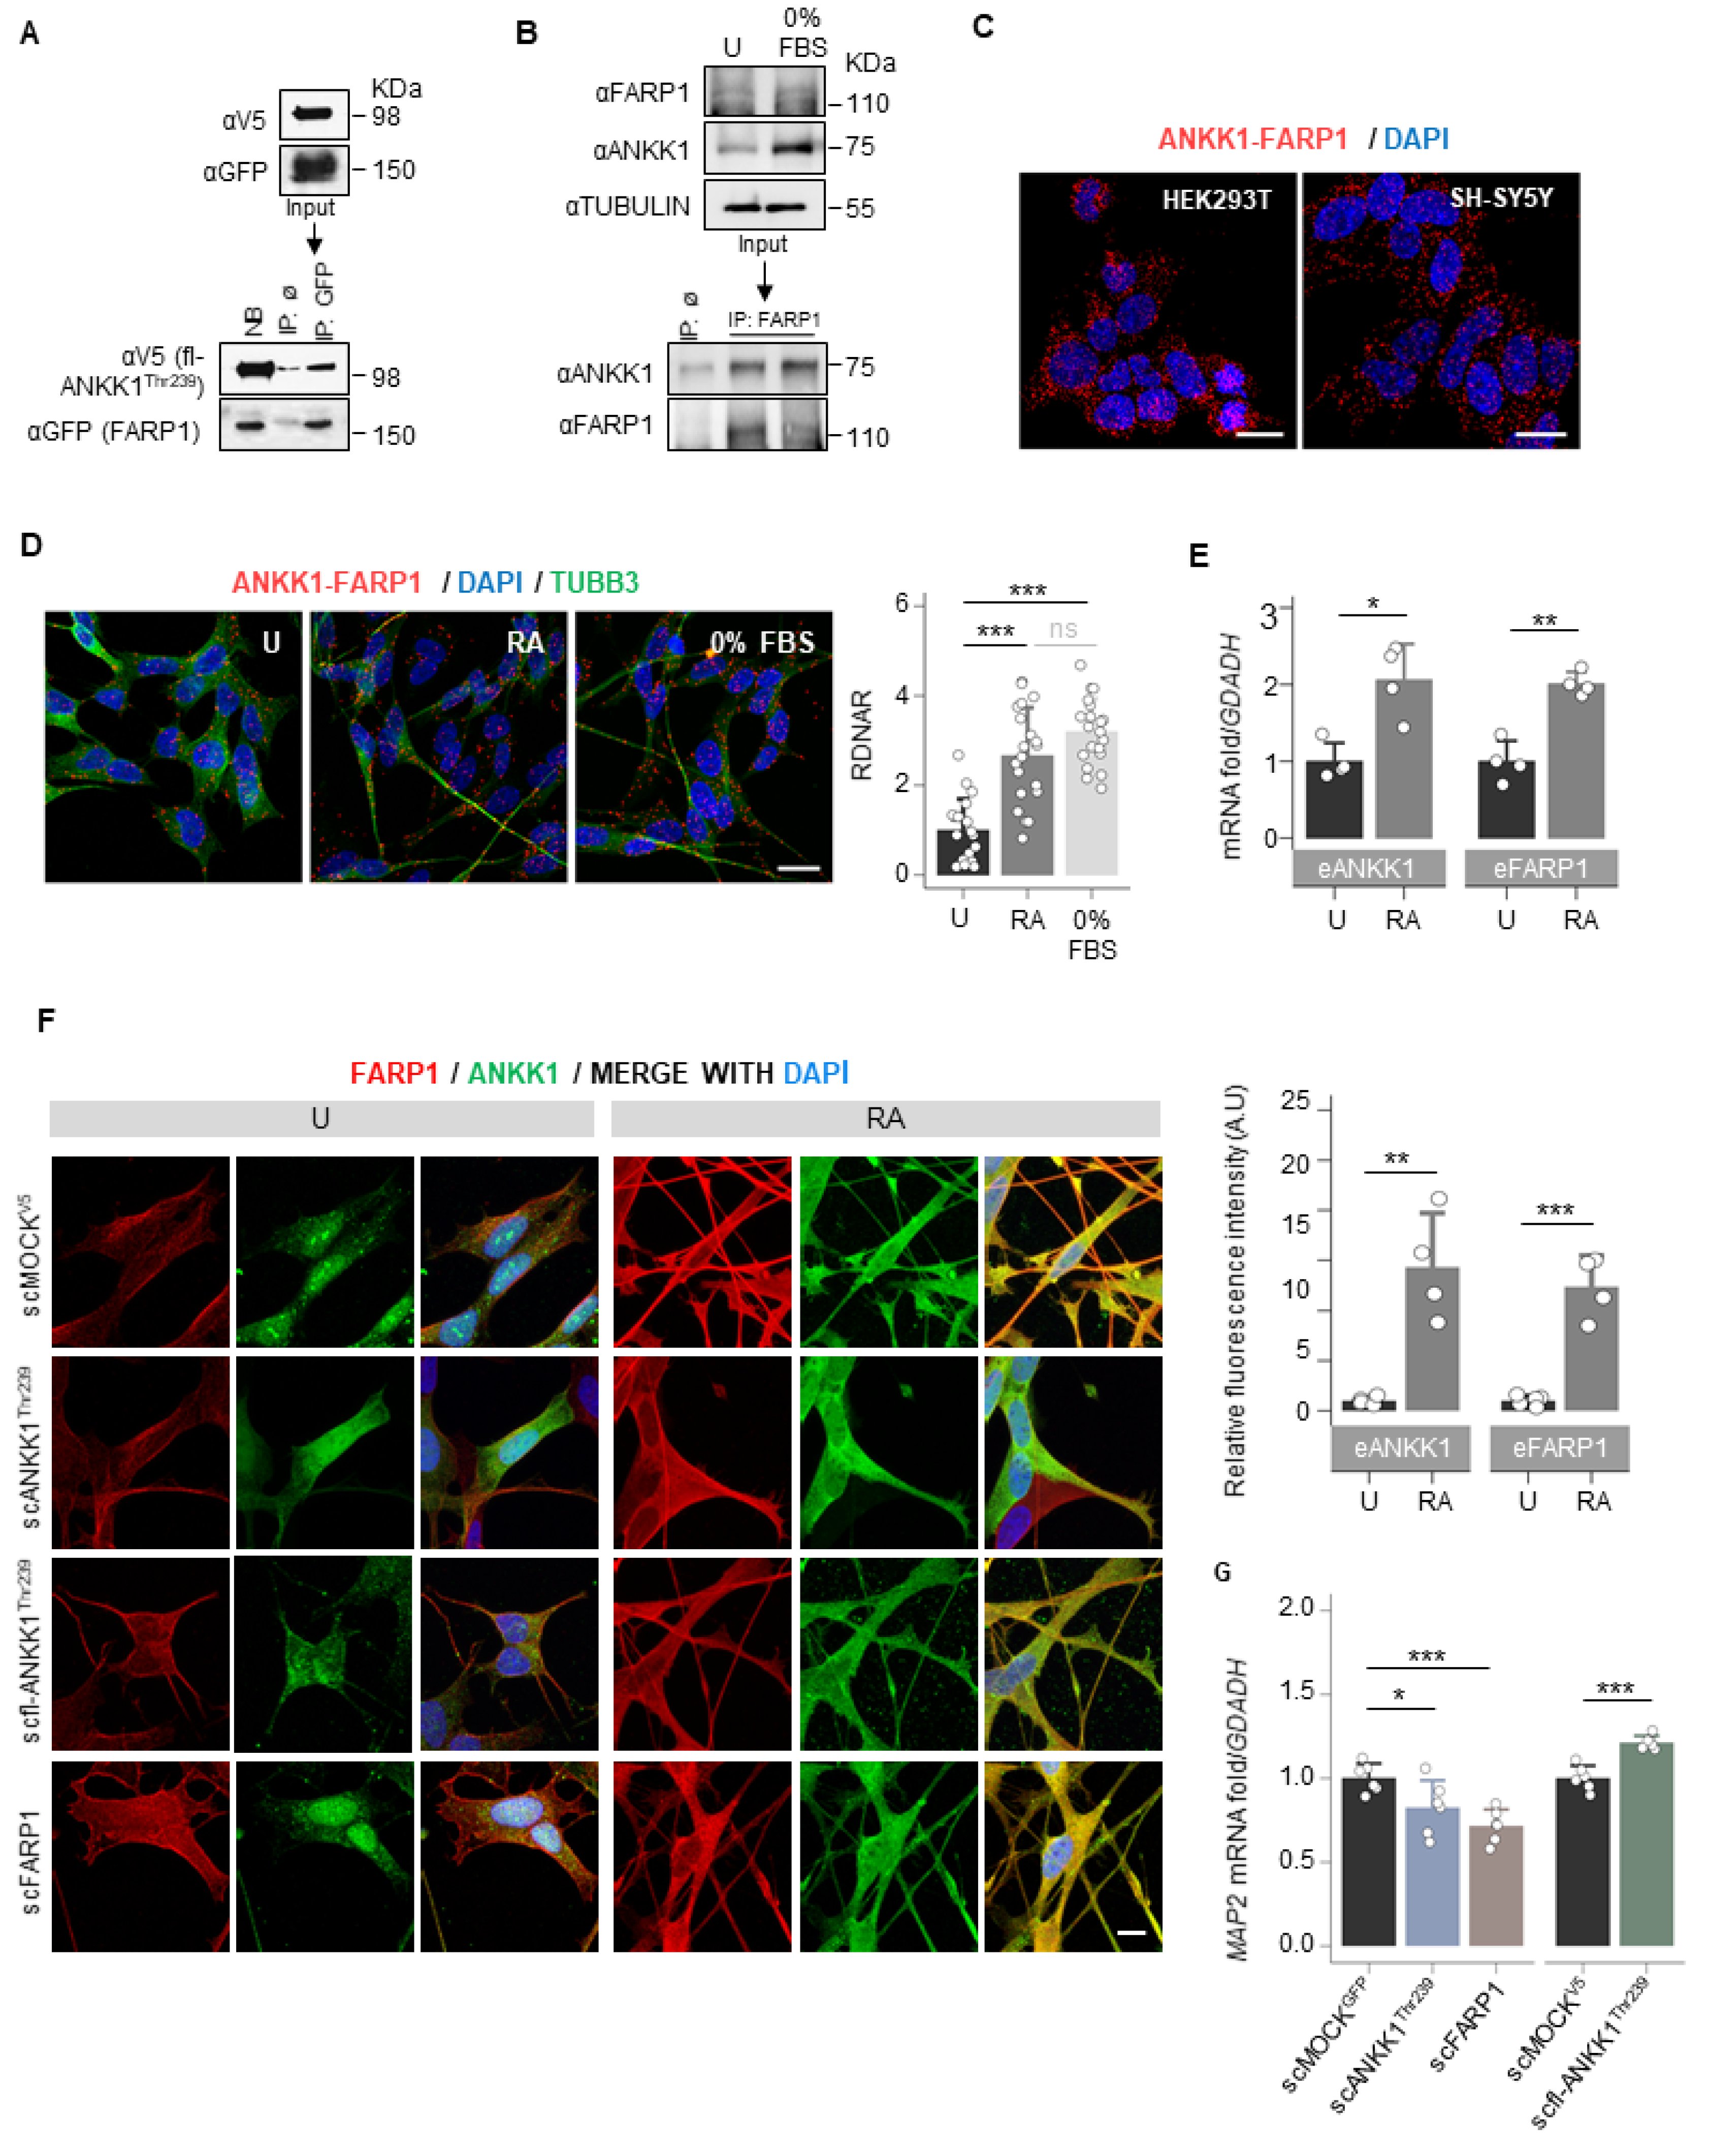
To identify ANKK1 interactors, we overexpressed the short isoform of ANKK1 fused with the Green Fluorescence Protein (GFP) [14] in HEK293T cells. This isoform comprises only the ANKK1 kinase domain (ANKK1Thr239, Figure S1) and is expressed in embryonic/proliferative neurogenesis stages [18]. After co-immunoprecipitation (co-IP) with α-GFP, the analysis by isobaric tagging for relative and absolute quantitation (iTRAQ) mass spectrometry identified candidate proteins that increased in the ANKK1 sample compared with the MOCK control (overexpresses GFP). We selected FARP1 for further analysis because of its high ANKK1/MOCK iTRAQ ratio and biological function in neurons [24,25]. After overexpression of the full-length ANKK1Thr239 (fl-ANKK1Thr239) and FARP1 constructs (Figure S1 and Table S1), co-IP experiments confirmed ANKK1–FARP1 interaction (Figure 1A). In the neuroblastoma cells SH-SY5Y, co-IP of endogenous ANKK1 and FARP1 demonstrated their interaction under proliferative (neuroblast-like) or serum-starved conditions (0% fetal bovine serum, FBS) that induce neural differentiation (neuronal-like) (Figure 1B). ANKK1–FARP1 interaction was further confirmed by proximity ligation assay (PLA) in undifferentiated cells (Figure 1C) and after retinoic acid (RA) treatment or starvation to induce differentiation (Figure 1D). We observed in differentiated SH-SY5Y cells a significant increase in both the ANKK1–FARP1 interaction and the mRNA expression of ANKK1 and FARP1 (Figure 1D,E).

Figure 1.
ANKK1 and FARP1 interact constitutively and during neural differentiation. (A). Co-IP of transfected FARP1 and fl-ANKK1Thr239 in HEK293T cells. (B). Co-IP of endogenous FARP1 and ANKK1 in proliferative and 48 h serum-starved SH-SY5Y cells (0% FBS). (C,D). ANKK1–FARP1 interaction by PLA in HEK293T or SH-SY5Y. In SH-SY5Y, PLA was combined with immunostaining of TUBB3 in undifferentiated, and RA- or 0% FBS-treated cells. Maximum intensity projections are shown. Scale bar: 20 µm. Analysis of RDNAR is shown in the bar plot (n = 20 images, 3 independent experiments). (E). Quantification by RT-PCR of ANKK1 and FARP1 expression levels in undifferentiated and RA-treated SH-SY5Y cells (n = 3 independent experiments). (F). Immunolabelling of ANKK1 and FARP1 in undifferentiated or RA-treatment conditions of the following SH-SY5Y cell lines that stably express ANKK1 or FARP1: scMOCKV5 (α-ANKK1 (StK2) and α-FARP1); scANKK1Thr239 for the short isoform in fusion with GFP (α-GFP and α-FARP1); scfl-ANKK1Thr239 for the full-length isoform in fusion with V5 (α-V5 and α-FARP1) and scFARP1 for FARP1 in fusion with GFP (α-ANKK1 (StK2) and α-GFP). Maximum intensity projections are shown. Scale bar: 10 µm. Quantification of ANKK1 and FARP1 fluorescence intensity is shown in the bar plots (n = 3 independent experiments). (G). qRT-PCR of Microtubule-associated protein 2 gene (MAP2) in undifferentiated scANKK1, scFARP1, and scfl-ANKK1Thr239 cell lines. Plots represent mean ± SD and individual values are displayed as dots. One-sample t-test on the fold-change values was used for U-group comparisons. Bonferroni was used as a multiple-testing correction method. * p < 0.05; ** p < 0.01; *** p < 0.001; ns, not significant. Abbreviations: FBS: Fetal Bovine Serum; IP: immunoprecipitation; NB: not-bound; IP ø: non-specific IP; PLA: Proximity ligation assay; RA: Retinoic acid. See also Figure S1.
To find out shared functions of ANKK1 and FARP1 during neural differentiation, we generated modified SH-SY5Y cell lines that stably express (stable cell, sc) the short isoform of ANKK1 (scANKK1Thr239), the full-length ANKK1 (scfl-ANKK1Thr239) or FARP1 (scFARP1) (Table S2). The study of these undifferentiated cell lines revealed differences in the subcellular localization of both proteins. scfl-ANKK1Thr239 presented a greater tendency to neuritic outgrow and significantly higher mRNA levels of Microtubule-associated protein 2 (MAP2) mRNA, a neural marker of neuritogenesis (Figure 1G). The scFARP1 cells exhibited larger somas and FARP1 across the entire plasma membrane and lower MAP2 expression (Figure 1F,G). In addition, after differentiation of the scMOCKV5 cells, we found a significant increase in ANKK1 and FARP1 signals (Figure 1F right). These results argued that overexpression of ANKK1 or FARP1 promotes different morphological changes in SH-SY5Y cell lines.
Next, we developed a custom automatic image analysis method to quantify the neurites-to-soma area ratio as a marker of neuritogenesis (Figures S2 and S3). Undifferentiated cells showed a significant increase in neurite/soma area in the scANKK1Thr239 and scfl-ANKK1Thr239 cell lines but not in scFARP1 (Figure 2A). It should be noted that neuritogenesis was increased in the scFARP1 cells after transfection with ANKK1Thr239 or fl-ANKK1Thr239 plasmids (Figure 2A right), thus suggesting a regulatory role of ANKK1 on FARP1 function. Although no differences were observed between differentiated SH-SY5Y cell lines (Figure 2A, 0% FBS), the more detailed examination of neurites by deconvoluted confocal images using a custom automatic image analysis (Figure S4) revealed an increase in the dendritic spines in scANKK1Thr239, scfl-ANKK1Thr239, and scFARP1 lines (Figure 2B left). In contrast, the spine length was exclusively associated with lines stably expressing ANKK1 or by transfection of ANKK1 isoforms in the scFARP1 line (Figure 2B right). These results suggest that ANKK1 and FARP1 appear to have synergistic roles in spine formation.
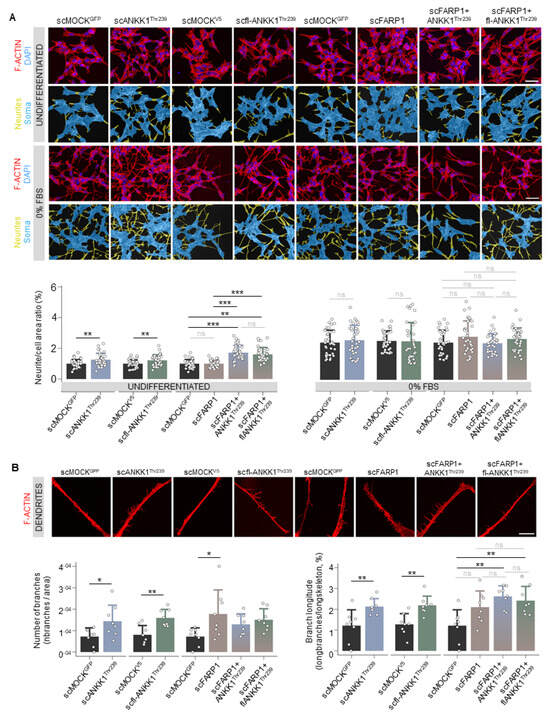
Figure 2.
ANKK1 but not FARP1 promotes neuritogenesis, and both proteins contribute to the growth of neuritic spines. (A). F-ACTIN (phalloidin) staining of undifferentiated (U) or 48 h 0% FBS-treated scMOCK, scANKK1Thr239, scfl-ANKK1Thr239, scFARP1 cell lines, and scFARP1 transfected with ANKK1Thr239 or fl-ANKK1Thr239 constructs. Maximum intensity projections are shown. Scale bar: 40 µm. The corresponding neurites (yellow)/soma (blue) image segmentation are displayed below each original image. Analysis of neurite/cell area ratio (as a marker of differentiation) in undifferentiated (upper panel) and after 48 h of 0% FBS (lower panel) is shown in the bar plots below (n = 35 images, 3 independent experiments). (B). Representative deconvoluted confocal images of dendritic spines after 48 h of 0% FBS. Maximum intensity projections are shown. Scale bar: 10 µm. Analysis of the relative number of branches (left panel) and branch longitude (right panel) as markers of dendritogenesis is shown in the bar plots below (n = 8 images, 3 independent experiments). Plots represent mean ± SD and individual values are displayed as dots. (A,B) One-sample t-test on the fold-change values was used for each MOCK-group comparison and Bonferroni was applied as a multiple-testing correction method. ANOVA on the fold-change values was used for between-group comparison. * p < 0.05; ** p < 0.01; *** p < 0.001; ns, not significant. Abbreviations: FBS: Fetal bovine serum; U: Undifferentiated. See also Figures S2–S4.
Since FARP1 promotes F-ACTIN assembly [24,27], we immunostained endogenous ANKK1/FARP1, or ANKK1/F-ACTIN (Phalloidin staining) in SH-SY5Y cells treated with RA, or RA and brain-derived neurotrophic factor (BDNF) to obtain mature neurons. We found complete ANKK1–FARP1 and ANKK1–F-ACTIN colocalization signals in the growth cone, neurites, and dendritic filopodia (Figure S5). These findings suggest shared ANKK1/FARP1 functions associated with neuronal maturation.
2.2. ANKK1 and FARP1 Participate in Neural Cell Migration
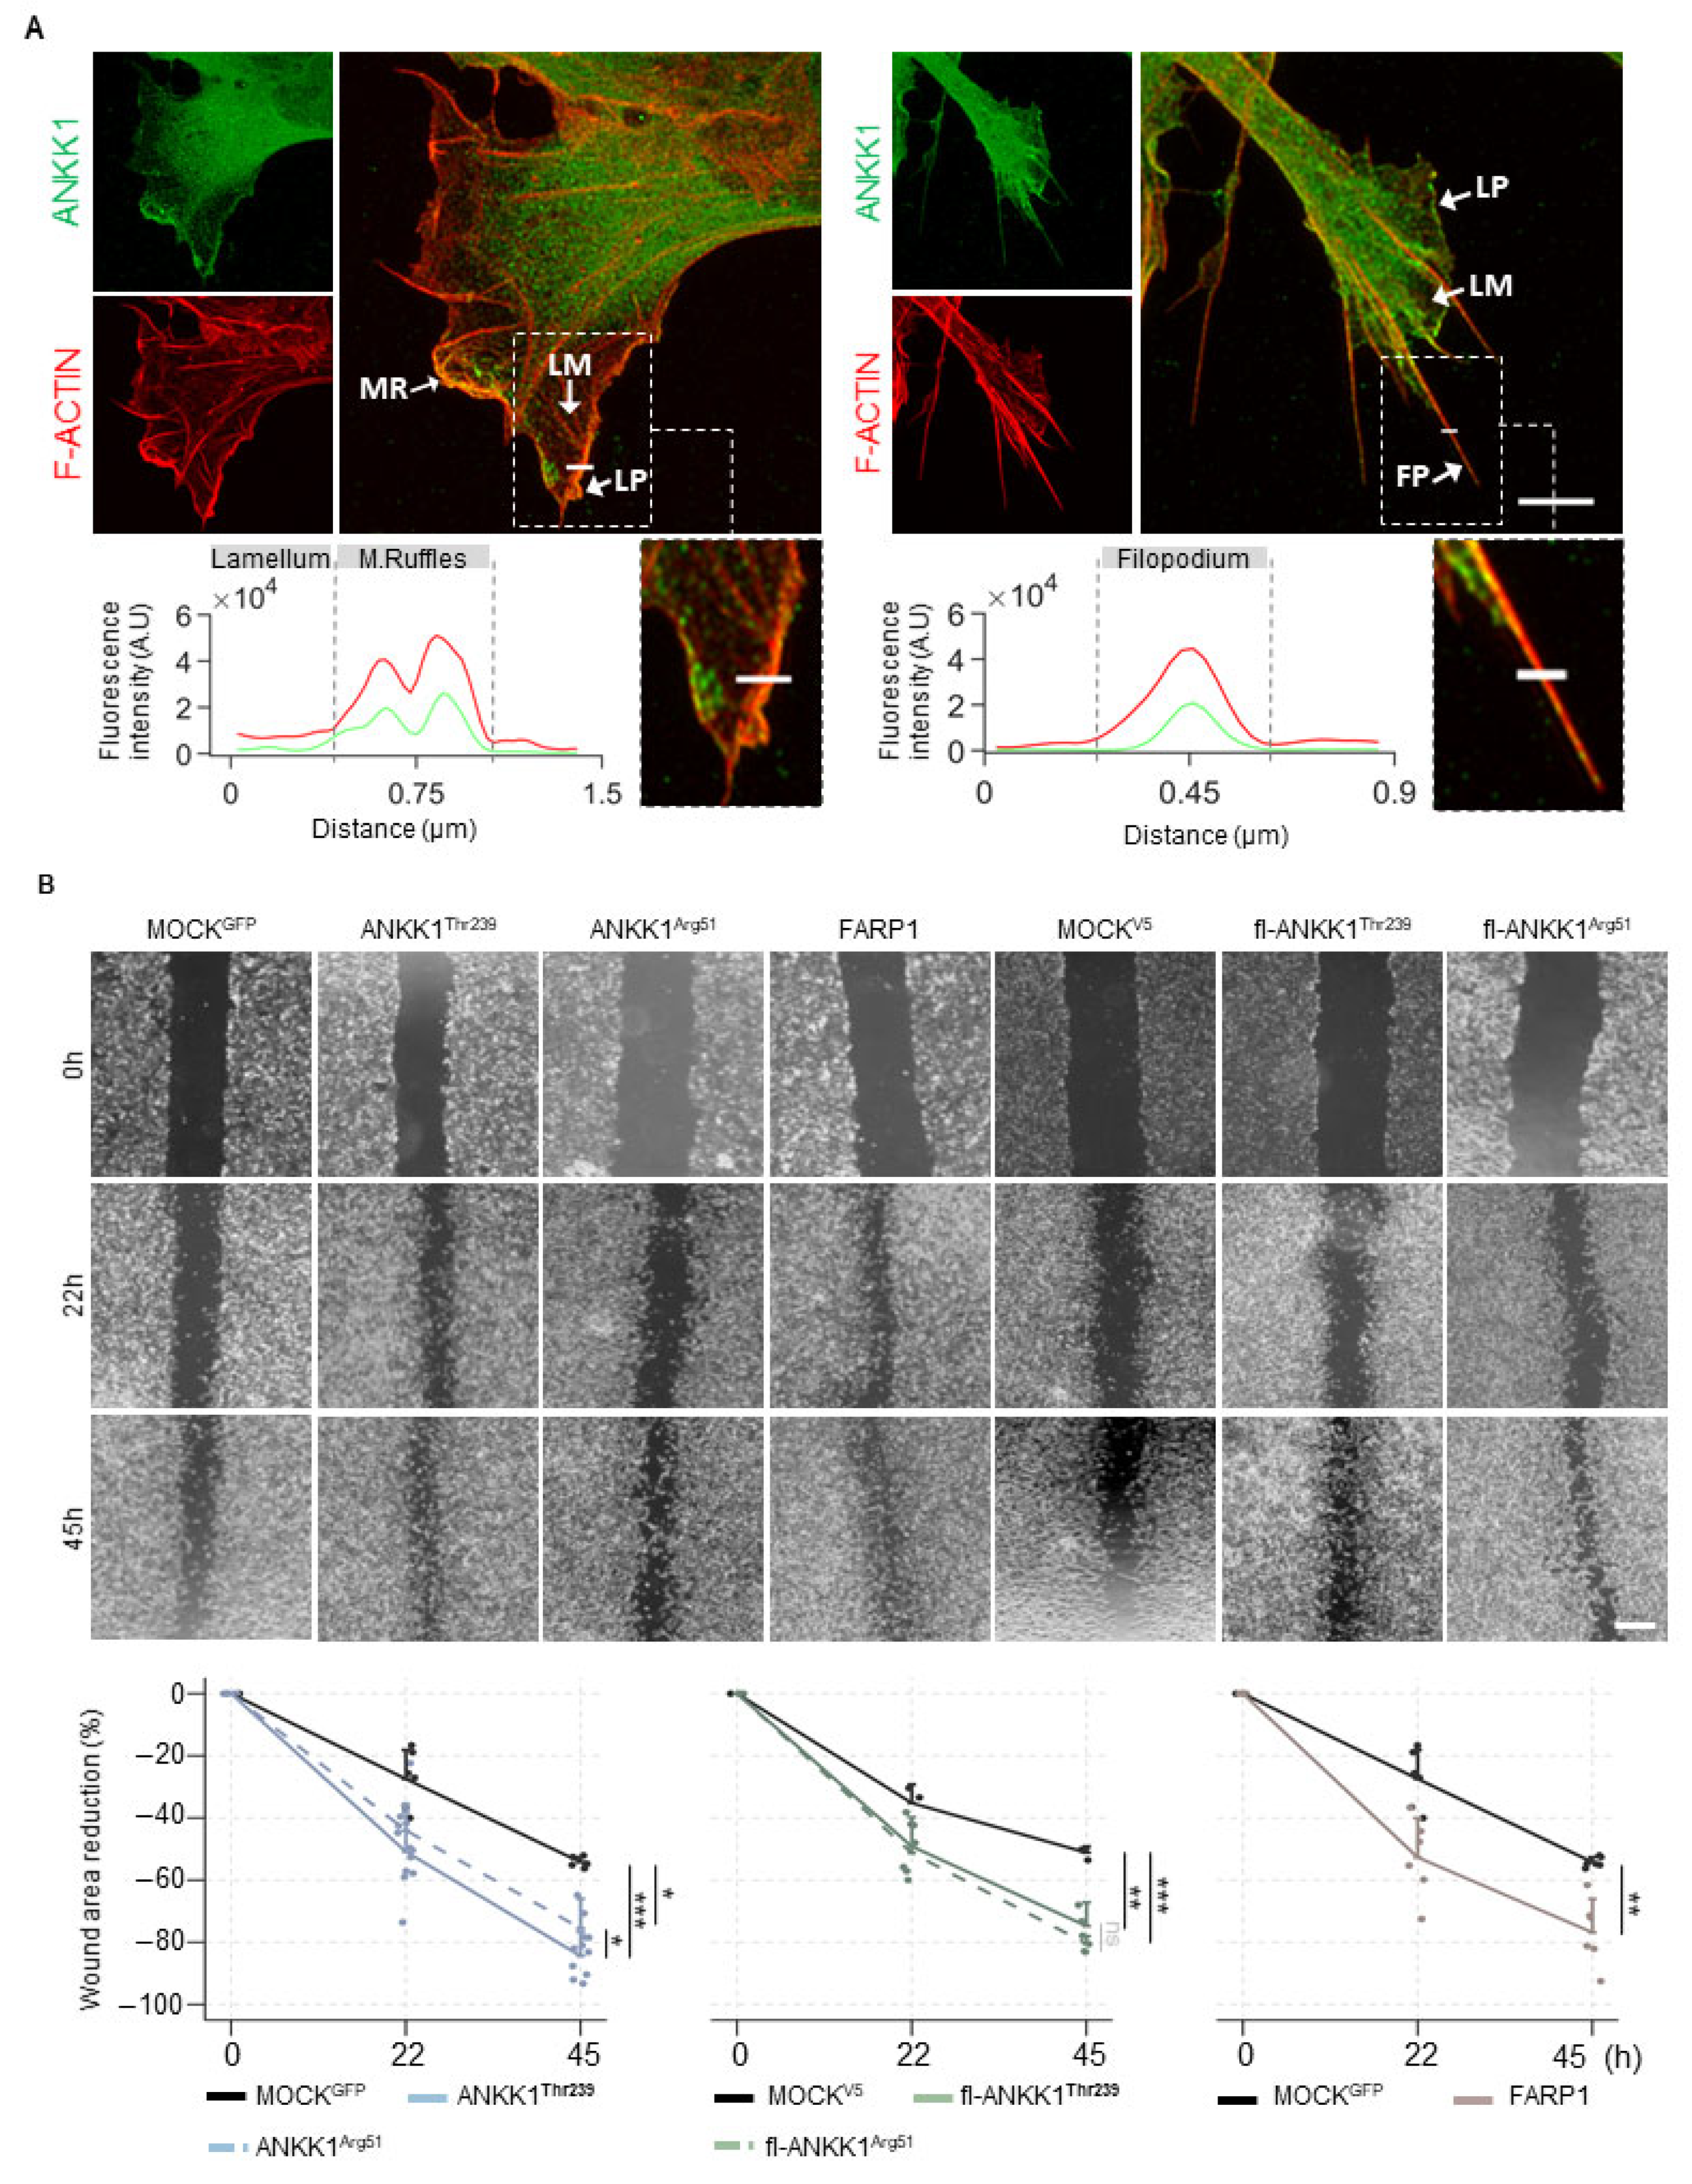
Since ANKK1 is found in migratory neuroblasts and myoblasts [18,28] and FARP1 promotes cell motility [29,30], we analyzed endogenous ANKK1 in subcellular cell migration structures in proliferative SH-SY5Y cells. Immunolabeling experiments showed that ANKK1 was located at the leading edge of F-ACTIN-rich sites, which are responsible for protrusive movements, such as lamellipodia, filopodia, and membrane ruffles (Figure 3A). We did not observe ANKK1 in the lamellum, a less dense F-ACTIN site related to substrate adhesion and contraction. These results suggest that ANKK1 is specifically involved in the forward movement in cell migration.

Figure 3.
ANKK1 and FARP1 are involved in neural cell migration. (A). Representative confocal images showing endogenous ANKK1 (α-STk2) and F-ACTIN (Phalloidin) at subcellular cell migration structures (white arrows) of undifferentiated SH-SY5Y cells. Maximum intensity projections are shown. Scale bar: 2 µm. The line profile plots indicate the intensity distribution of the green and red channels along the straight line crossing the ROI (magnified boxes). (B). Representative microscopy images of the scratch wound healing assay at 0, 22, and 45 h in SH-SY5Y cells transiently overexpressing ANKK1 (n = 8 independent experiments), ANKK1Arg51 (n = 8 independent experiments), FARP1 (n = 8 independent experiments), fl-ANKK1Thr239 (n = 3 independent experiments), and fl-ANKK1Arg51 (n = 3 independent experiments). Scale bar: 500 µm. Line plots represent the percent rates of wounded areas relative to the start time of scratch (mean ± SD). Individual values are displayed as dots. Mixed effects linear regression was used to estimate wound healing mean change over time across the different cell groups. * p < 0.05; ** p < 0.01; *** p < 0.001; ns, not significant. Abbreviations: A.U: Arbitrary units; FP (Filopodium); LM (Lamellum); LP (Lamellipodium); MR (Membrane ruffles). See also Figures S6 and S7.
After, we performed scratch wound healing assays in SH-SY5Y cells transfected with ANKK1Thr239, fl-ANKK1Thr239, or FARP1 constructs and with the mutant constructs ANKK1Arg51 and fl-ANKK1Arg51 [p.Lys51Arg change, which would affect kinase activity [14]] (Figure S1 and Table S1). A custom automatic image analysis method was developed to evaluate the wound area (Figure S6). Overexpression of all constructs caused a significant reduction of the wounding area compared to the MOCK at 45 h after scratching. The p.Lys51Arg variant does not affect this reduction, as shown by ANKK1Arg51 and fl-ANKK1Arg51 constructs (Figure 3B). Since these experiments involved transient transfections, we confirmed that migrating cells closing the gap overexpressed ANKK1 or FARP1 (Figure S7A). Moreover, co-transfection of ANKK1 and UtrCH-cherry plasmid for F-ACTIN imaging [31] confirmed that living migrating cells overexpressing ANKK1 were localized at the leading front (Figure S7B). These results add further evidence of ANKK1 and FARP1 role in the migration of neural lineage cells and F-ACTIN assembling.
2.3. ANKK1 and FARP1 Activate the Non-Canonical Wnt/PCP Pathway
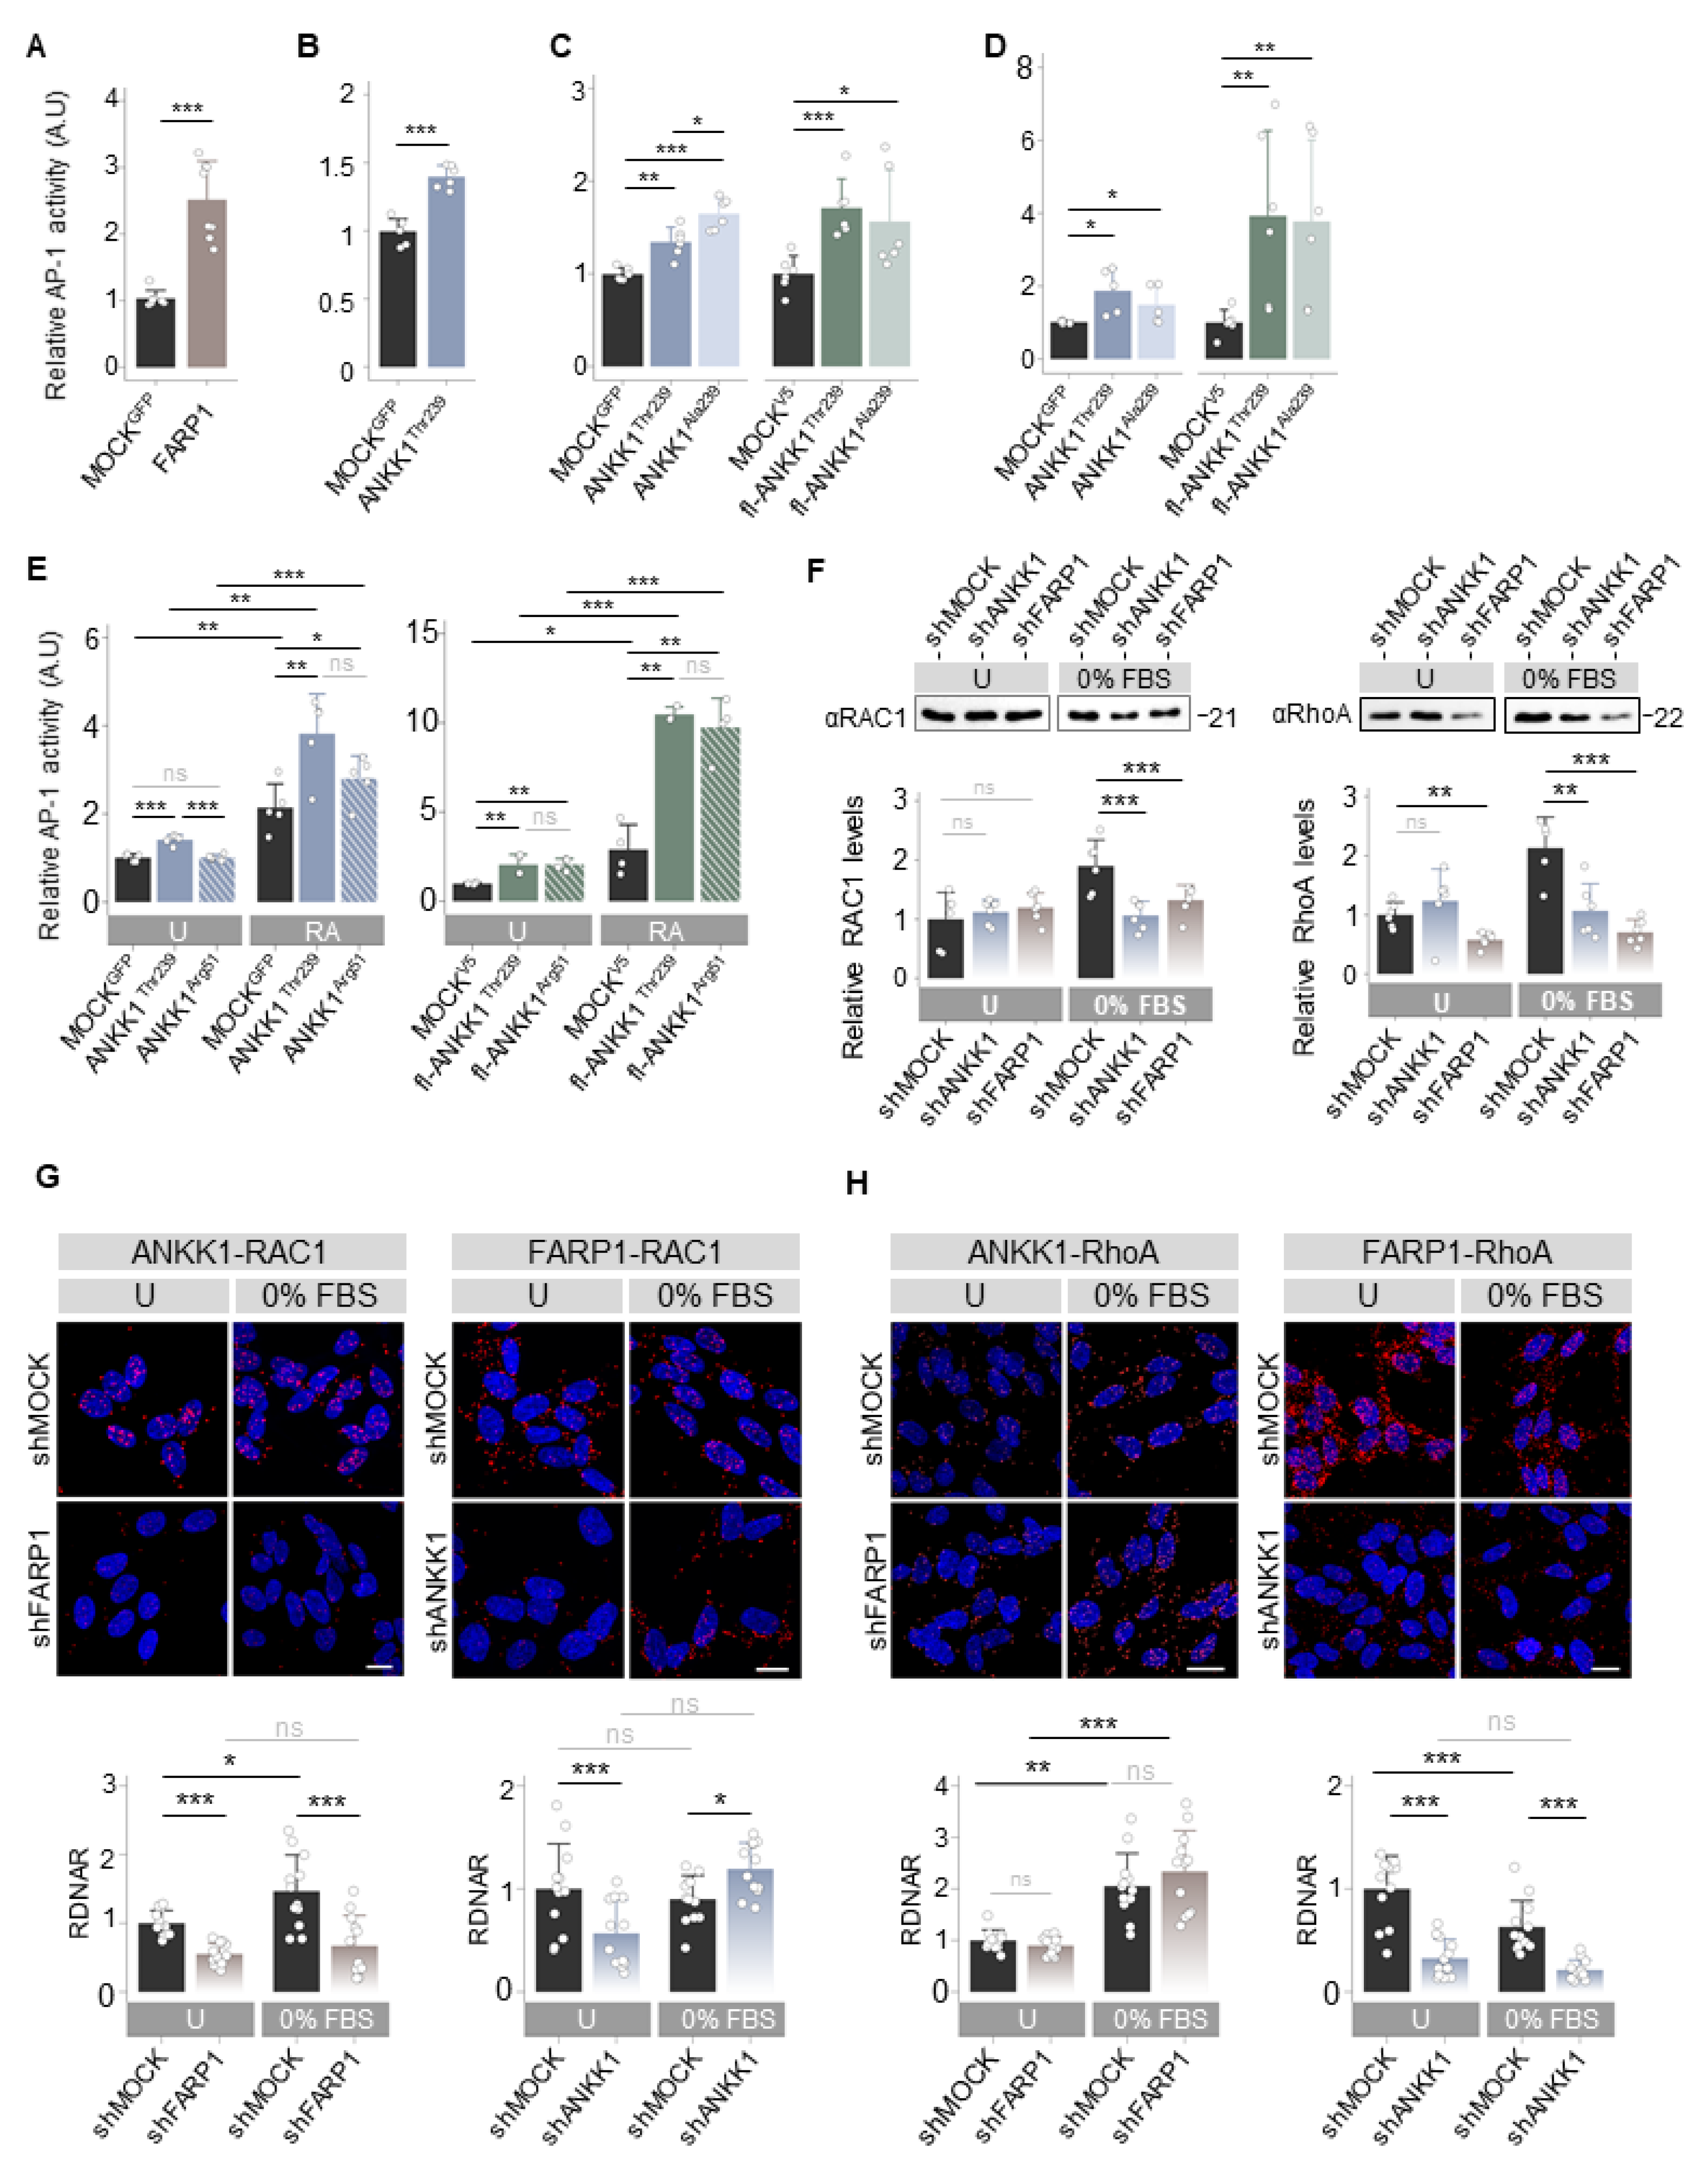
As ANKK1 and FARP1 were involved in neural migration and differentiation, processes regulated by the Wnt Planar Cell Polarity (Wnt/PCP) [32], we hypothesized that both proteins are components of this pathway. We studied the effect of ANKK1Thr239 or FARP1 overexpression on the Wnt/PCP pathway with luciferase reporter assays (LRA) that measure Activator Protein-1 (AP-1)-dependent transcriptional activity. In HEK293T cells, we found that the two proteins drove significant AP-1 activity (Figure 4A,B). Since the TaqIA ANKK1 SNV, associated with addictions [8], is a marker of amino acid changes in the ANKK1 proteins, we wondered if this SNV affects the activation of Wnt/PCP induced by ANKK1. We overexpressed ANKK1Thr239 (Thr239 allele) and fl-ANKK1Thr239 (H1 haplotype, allele Thr239-Lys713) constructs and the ANKK1Ala239 (Ala239 allele) and fl-ANKK1Ala239 (H2 haplotype, Ala239-Glu713 allele) polymorphic variants (Figure S1 and Table S1). We found that ANKK1Thr239 drove a significantly lower AP-1 activity in comparison with ANKK1Ala239, while no differences were found between fl-ANKK1Thr239 and fl-ANKK1Ala239 (Figure 4C).
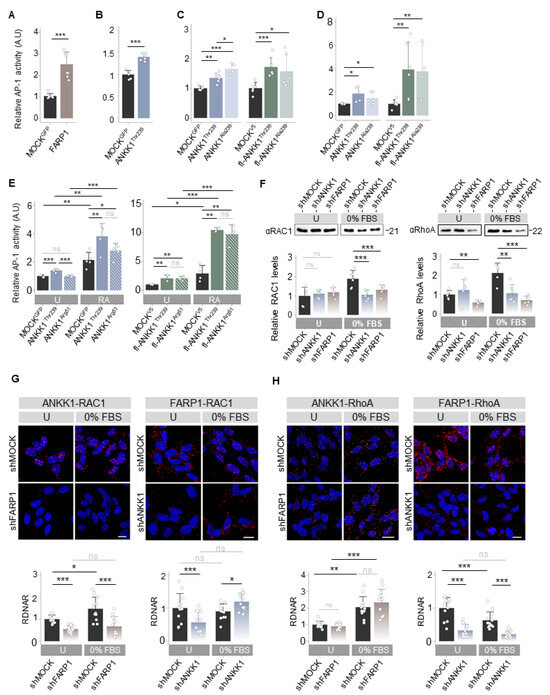
Figure 4.
ANKK1 and FARP1 are components of the Wnt/PCP pathway activating RhoGTPases. (A–E). LRA of AP-1 dependent transcriptional activity for the Wnt/PCP pathway activation after transient overexpression of: (A–C) HEK293 cells transfected with (A) FARP1 (n = 8, 3 replicas each), (B) ANKK1 (n = 6, 3 replicas each), (C, blue) ANKK1Thr239 or ANKK1Ala239, and (C, green) fl-ANKK1Thr239 or fl-ANKK1Ala239 (n = 6, 3 replicas each), (D,E) proliferative SH-SY5Y cells transfected with (D, blue) ANKK1Thr239 or ANKK1Ala239, and (D, green) fl-ANKK1Thr239 or fl-ANKK1Ala239 (n = 6, 3 replicas each) and (E) undifferentiated (U) or RA treated (RA) SH-SY5Y cells transfected with (E, blue) ANKK1Thr239 or ANKK1Arg51, and (E, green) fl-ANKK1Thr239 or fl-ANKK1Arg51 (n = 5/4, 3 replicas each). (F). Western blot of RAC1 (left panel) and RhoA (right panel) in undifferentiated (U) or 48 h serum-starved (0% FBS) in shMOCK, shANKK1, and shFARP1 cell lines. For RAC1 and RhoA quantification total protein levels were assessed. Protein quantification is shown in the bar plots below (n = 6, 2 independent experiments). (G,H). PLA confocal images showing the interaction of endogenous: RAC1–ANKK1 (G left), RAC1–FARP1 (G right), RhoA–ANKK1 (H left) and RhoA–FARP1 (H right) in undifferentiated (U) or 48 h serum starved (0%FBS) shFARP1 and shANKK1 cell lines. Maximum intensity projections are shown. Scale bar: 10 µm. Analysis of RDNAR is shown in the bar plots below (n = 12 images, 3 independent experiments). Plots represent mean ± SD and individual values are displayed as dots. (A,B,F) One-sample t-test on the fold-change values was used for MOCK/U-group comparisons. (C,D,G,H) One-sample t-test on the fold-change values was used for MOCK-group comparisons. Student’s t-test on the fold-change values was used for inter-group comparisons. Bonferroni was used as a multiple-testing correction method. (E) One-sample t-test on the fold-change values was used for MOCK (U)-group comparisons. Student’s t-test (2 groups) or ANOVA (3 groups) on the fold-change values was used for inter-group comparisons. Bonferroni was used as a multiple-testing correction method. * p < 0.05; ** p < 0.01; *** p < 0.001; ns, not significant. Abbreviations: FBS: Fetal bovine serum; PLA: Proximity ligation assay; RA: Retinoic acid; RDNAR: Relative dots/nuclei area ratio; U: Undifferentiated. See also Figures S8–S10.
Next, we studied whether ANKK1 activates the Wnt/PCP pathway in the neural lineage. In undifferentiated SH-SY5Y cells, overexpression of ANKK1Thr239 and fl-ANKK1Thr239 proteins significantly increased AP-1 activity (Figure 4D). No differences between polymorphic variants were found in this cell line. Furthermore, we examined the temporal activity of Wnt/PCP induction by ANKK1Thr239, ANKK1Arg51, fl-ANKK1Thr239, and fl-ANKK1Arg51 constructs in transfected SH-SY5Y cells during differentiation. The expression of constructs was monitored by Western blot (Figure S8). In differentiated SH-SY5Y cells, LRA showed that overexpression of all ANKK1 isoforms significantly increased AP-1 activity compared to proliferative cells. The fl-ANKK1Thr239 isoform [expressed during the establishment of neuronal connectivity in early postnatal stages [18]] and fl-ANKK1Arg51 caused the highest increase in AP-1 activation (10×) in comparison to the short ANKK1Thr239 isoform (Figure 4E).
As the Wnt/PCP pathway activates the Rho family of small GTPases to remodel the ACTIN cytoskeleton [33], we evaluated the interaction of ANKK1 with the RhoGTPases RAC1, RhoA, and Cdc42. In undifferentiated SH-SY5Y lines, co-IP experiments revealed a robust interaction between fl-ANKK1Thr239 and RAC1 (Figure S9A), while the interaction with RhoA was minimal (Figure S9B left) and absent with Cdc42 (Figure S9C left). Notably, the mutant isoform scfl-ANKK1Arg51 interacted with RAC1 (Figure S9A), in agreement with the Wnt/PCP activation by this isoform (Figure 4E). After SH-SY5Y differentiation, our experiments revealed the interaction of fl-ANKK1Thr239 with RhoA while interaction with Cdc42 remained absent (Figure S9B,C right). PLA experiments confirmed these findings (Figure S9D–F) and showed a significant increase in fl-ANKK1Thr239–RAC1 and fl-ANKK1Thr239–RhoA interactions in differentiated cells. These results argue that ANKK1 and FARP1 are Wnt/PCP components during neural differentiation.
2.4. ANKK1 Regulates GEFs/RhoGTPases Interactions during Neural Differentiation
Since ANKK1 interacts with FARP1 and with RAC1 and RhoA, which are activated by FARP1 [24,27], we hypothesized a functional relationship between all these proteins. To assess this possibility, we established ANKK1 and FARP1 shRNA-mediated knockdown SH-SY5Y cell lines named shANKK1 and shFARP1, respectively (Table S2). The knockdown cells were characterized by qRT-PCR, Western blot, and PLA (Figure S10). qRT-PCR experiments showed coordinated expression of ANKK1 and FARP1 in both cell lines. Under proliferative conditions, we found a significant decrease in the target gene expression and a significant increment of the other (Figure S10A left). In contrast, in differentiated cells, the decreased expression of one gene caused a significantly reduced expression of the other (Figure S10A right). Moreover, using ENCODE data we identified common transcription factor binding sites in ANKK1 and FARP1 regulatory regions (Figures S10B and S11) associated with neural differentiation (Table S3). This data set added further evidence for functional coordination between these genes. Western blot and PLA showed the reduction of the protein of the target gene (Figure S10C,D).
In the shANKK1 and shFARP1 knockdown lines, we first analyzed RAC1 and RhoA levels by Western blotting. In the shMOCK cells, serum-starved conditions (0% FBS) to induce differentiation caused a significant increase in RAC1 and RhoA. In contrast, the shANKK1 or shFARP1 lines showed no increase of these proteins (Figure 4F). These results suggest that ANKK1 and FARP1 are needed for RAC1 and RhoA participation in neuronal differentiation.
To investigate whether the interaction of ANKK1 with RAC1 and/or RhoA depends on FARP1 and vice versa, we conducted PLA studies in both undifferentiated cells and after 0% FBS treatment to induce neural differentiation. The ANKK1–RAC1 interaction, which increases during differentiation, decreases with the knockdown of FARP1 (shFARP1) (Figure 4G left). The FARP1–RAC1 interaction remained unchanged in 0% FBS but decreased with the knockdown of ANKK1 (shANKK1) in undifferentiated cells. However, shANKK1 in 0% FBS showed a significant increment of FARP1–RAC1 interaction, suggesting an ANKK1 regulatory role in this interaction (Figure 4G right). Since the ANKK1–FARP1 interaction increased during differentiation (Figure 1D), these results suggest a functional relationship between ANKK1–FARP1–RAC1 necessary for RAC1 activation during neuronal differentiation. Regarding the ANKK1–FARP1–RhoA relationship, we found that the ANKK1–RhoA interaction is independent of FARP1. In contrast, the FARP1–RhoA interaction was greater in proliferation, decreased during differentiation, and required ANKK1 (Figure 4H). These results suggest that ANKK1 facilitates interactions between FARP1 and their substrates.
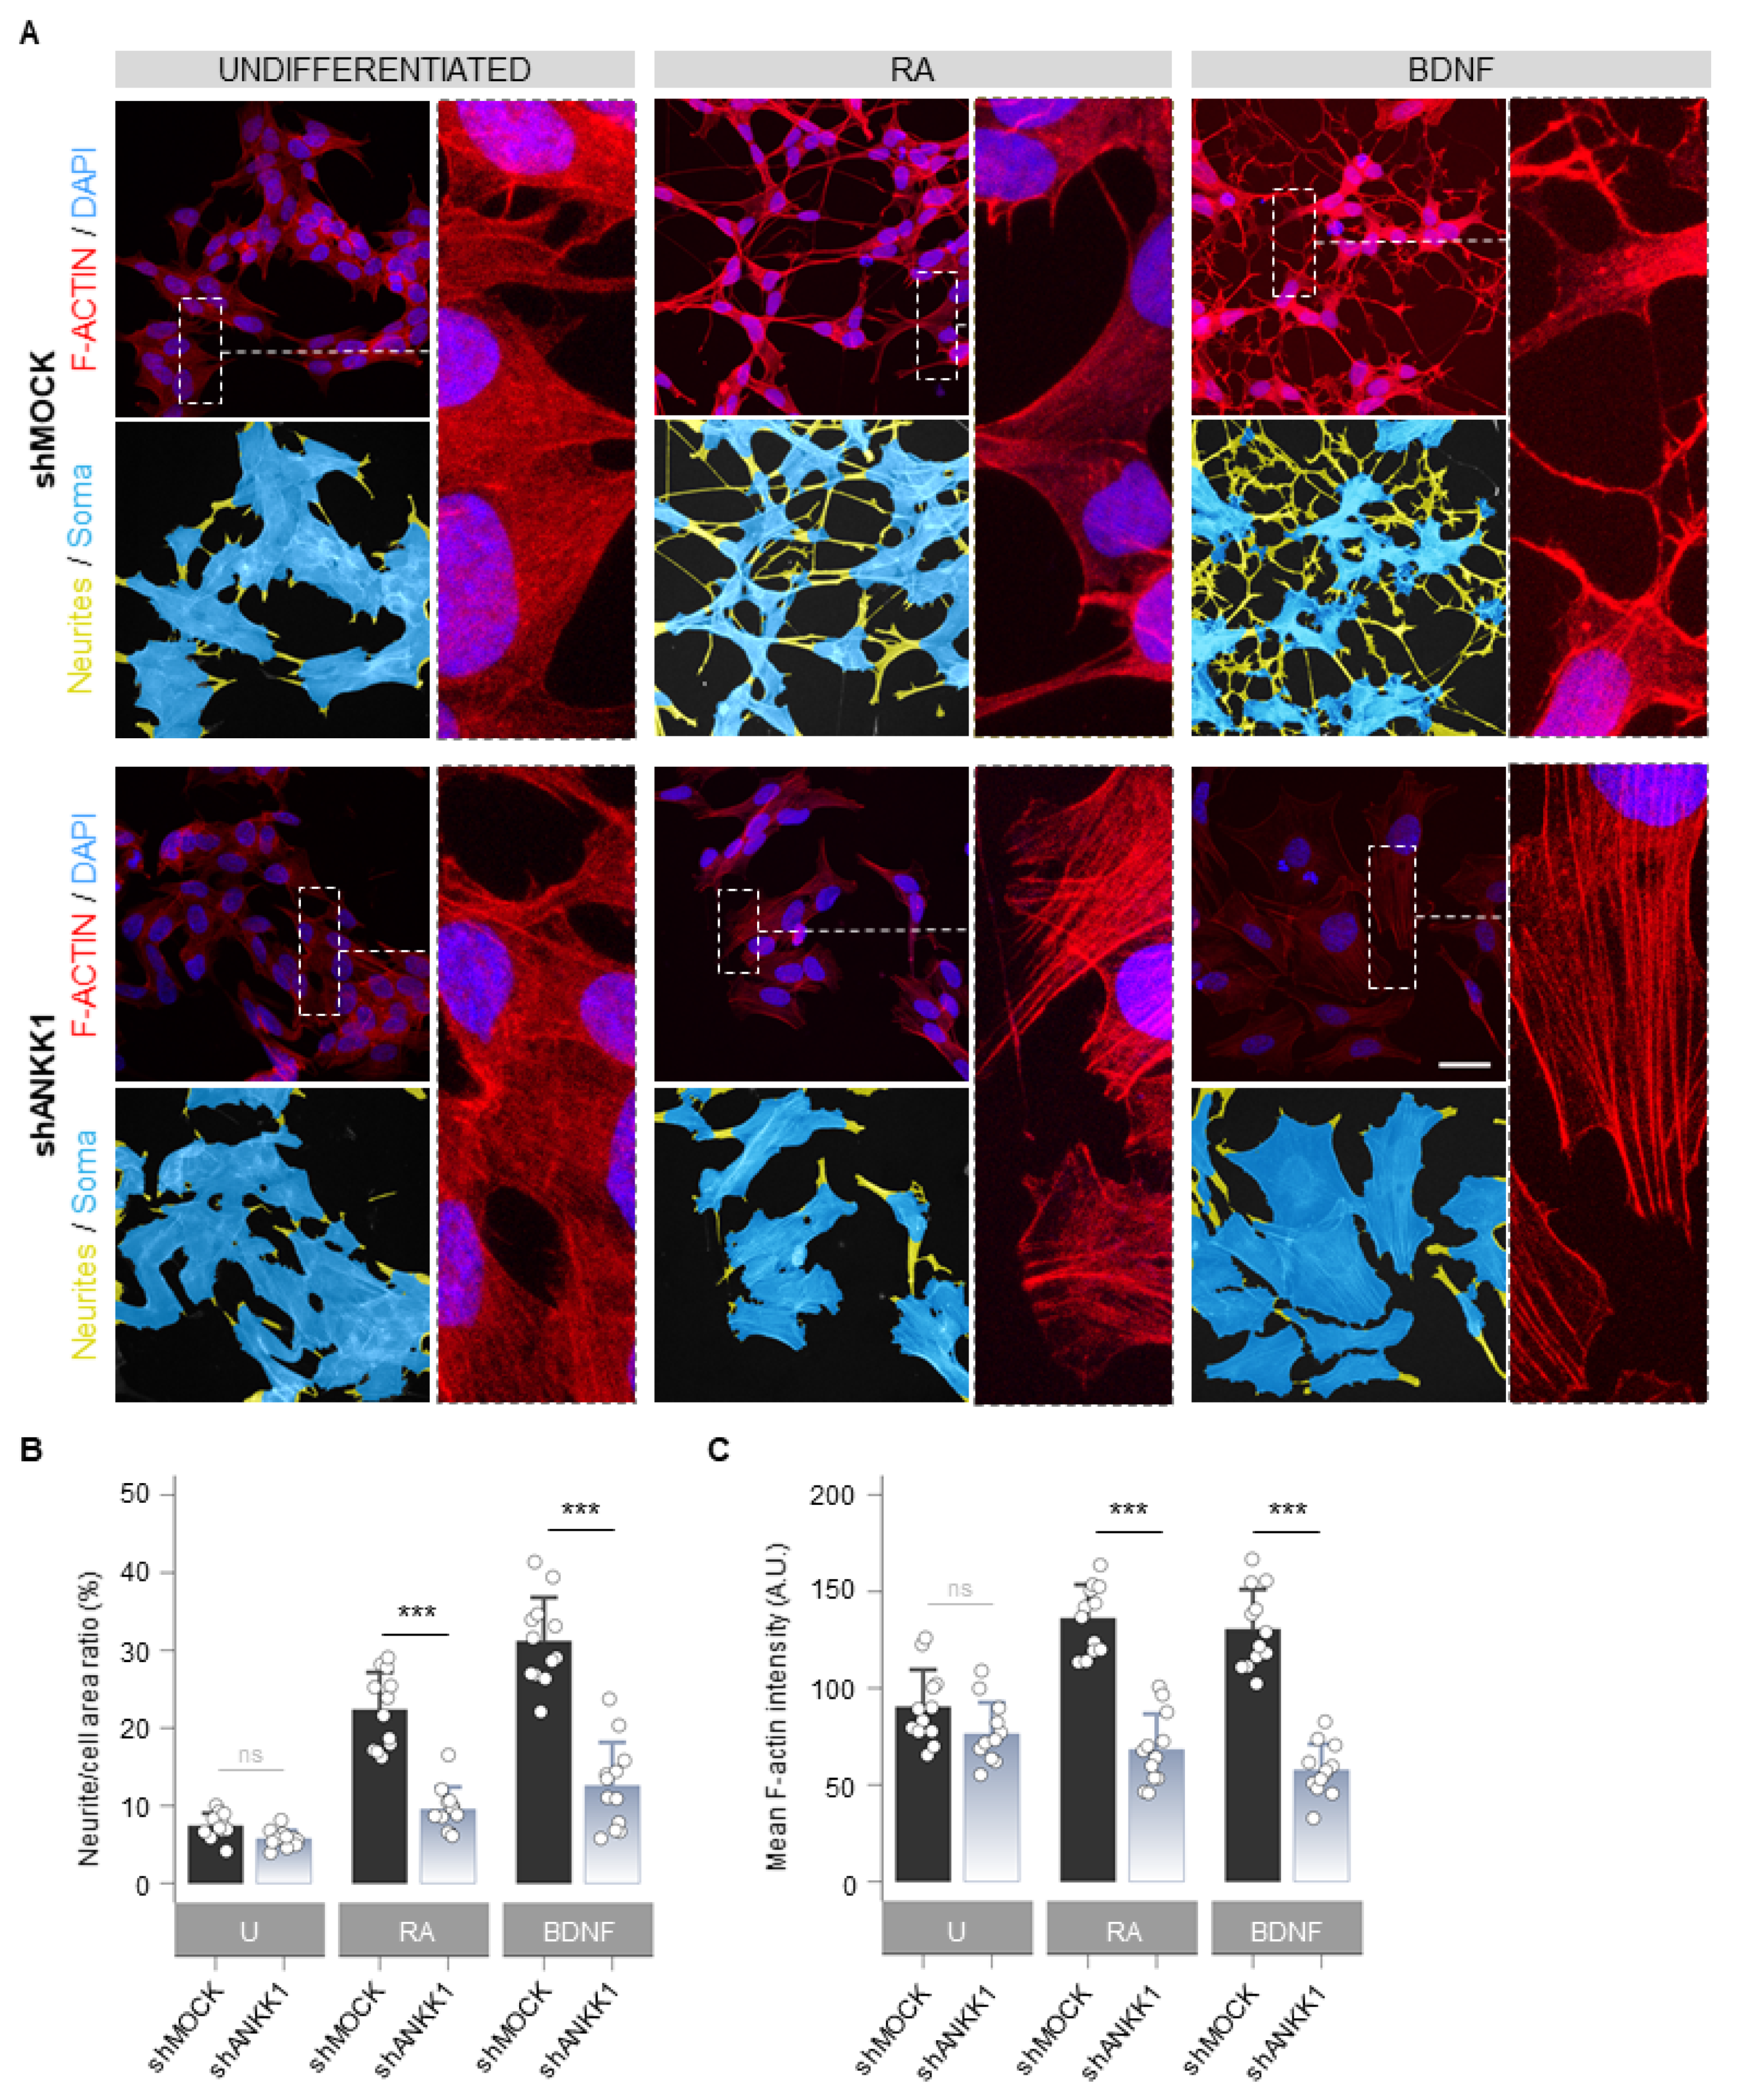
Next, we studied the cellular morphology and F-ACTIN pattern in shANKK1 cells treated with RA and BDNF to obtain mature neurons. The undifferentiated knockdown of ANKK1 (shANKK1) showed slight morphological differences with a tendency to a lower number of neurites and a larger soma area compared to the shMOCK, although with similar levels of F-ACTIN (Figure 5A left). After the RA and RA/BDNF treatment, the shMOCK line significantly changed its morphology to a neuronal-like phenotype (Figure 5A right). In contrast, the shANKK1 line did not undergo differentiation and retained its proliferative morphology (Figure 5A), significantly decreasing the F-ACTIN signal compared to shMOCK (Figure 5B,C). Qualitatively, the F-ACTIN in RA- and RA/BDNF-treated shANKK1 cells showed a stress fibers pattern typically associated with RhoA activity. These results indicate that without ANKK1, the necessary F-ACTIN assembly for differentiation into a neural phenotype does not occur.
2.5. ANKK1 Works as a Scaffold Protein Regulating GEFs/RhoGTPases Interactions
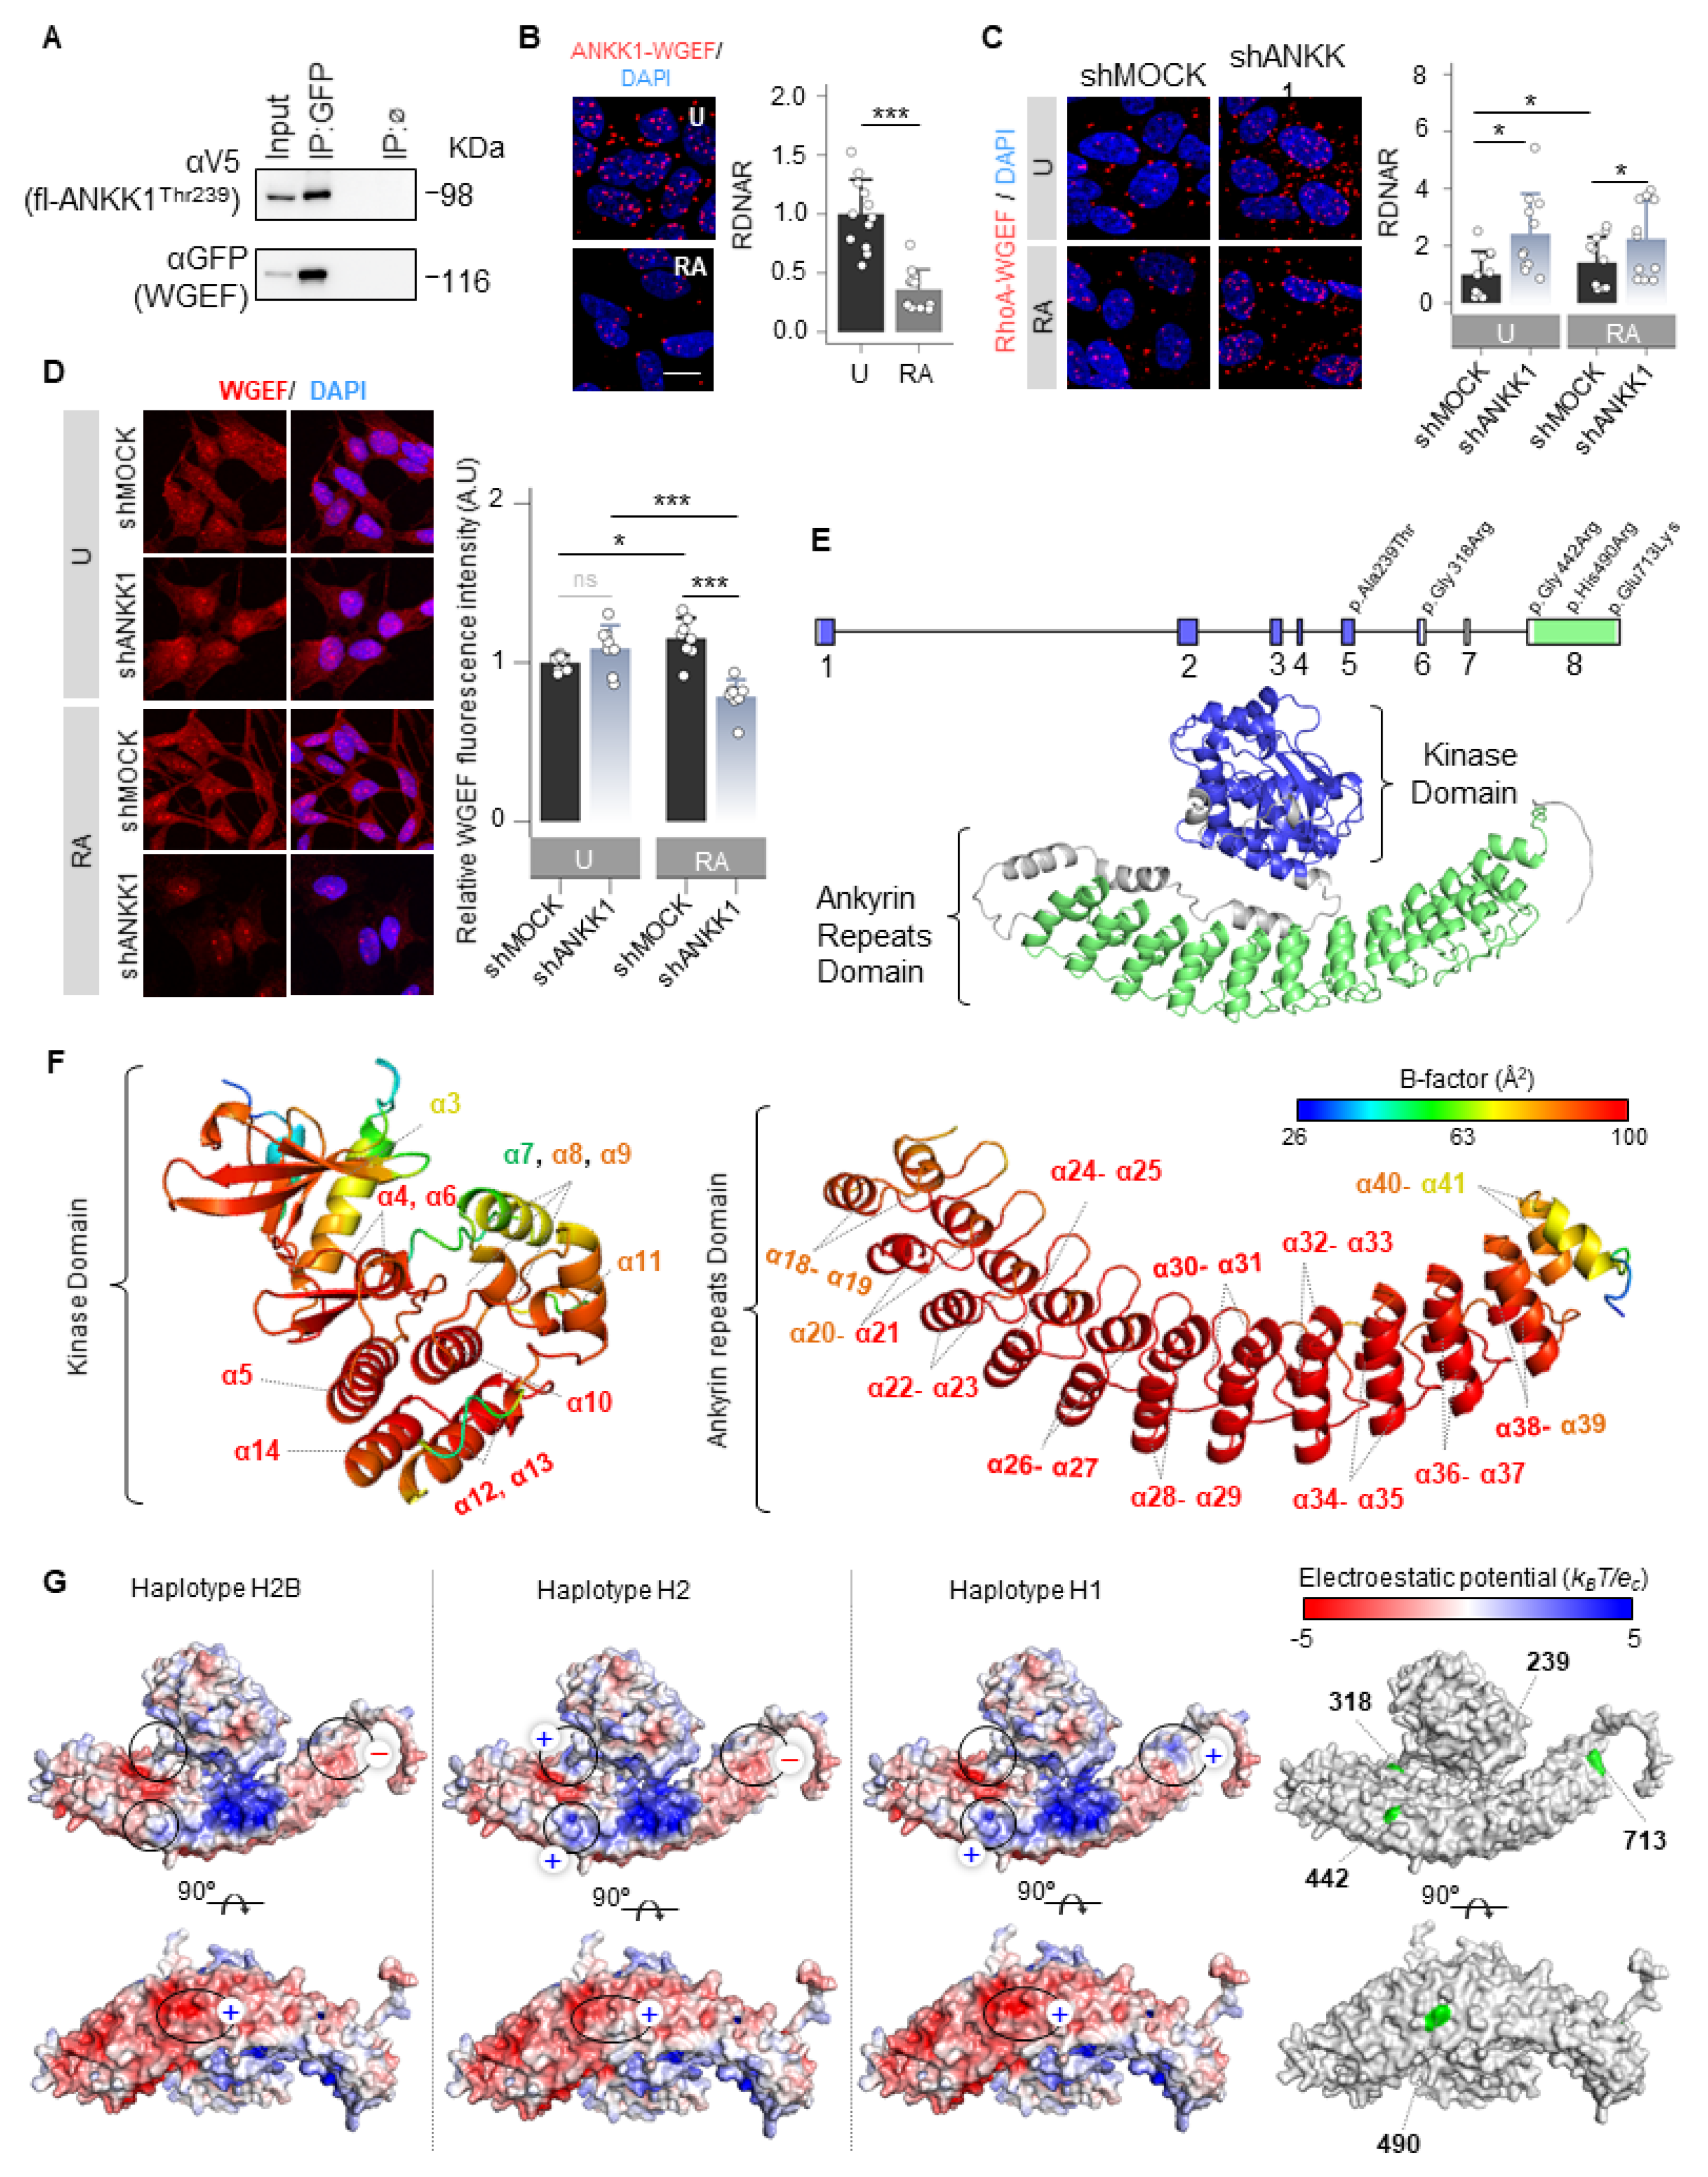
We searched among possible interactors to study whether ANKK1 interacts with other GEFs. We found RhoGEF19 (WGEF), which has been previously reported to activate RhoA in the Wnt/PCP [34]. Co-IP and PLA experiments confirmed ANKK1–WGEF interaction (Figure 6A,B). This interaction decreased significantly in differentiated cells (Figure 6B). It is noteworthy that RhoA, a WGEF substrate, showed a significant increase in its interaction with ANKK1 during differentiation (Figure 4H). Thus, we propose an inverse relationship between ANKK1–RhoA and ANKK1–WGEF interactions during SH-SY5Y differentiation. Furthermore, the WGEF–RhoA interaction increased when ANKK1 was knocked down (shANKK1) (Figure 6C), suggesting that ANKK1 regulates this interaction. The immunostaining of WGEF in proliferative shMOCK and shANKK1 cells showed a broad cellular distribution, while after differentiation, we observed a significant decrease in the WGEF signal in shANKK1 (Figure 6D). In addition, we studied ANKK1 and WGEF colocalization in the scfl-ANKK1Thr239 differentiated cell line using STED microscopy. Although both proteins localize to neurites, colocalization was low (Figure S12), consistent with a decrease in ANKK1–WGEF interaction during differentiation. Altogether, these results suggest that ANKK1 is required to downregulate the WGEF–RhoA interaction during SH-SY5Y neural differentiation.

Figure 6.
ANKK1 is a scaffold protein that interacts with Wnt/PCP components. (A). Co-IP of endogenous WGEF and ANKK1 in scMOCK and scfl-ANKK1Thr239 cell lines during proliferation. (B). ANKK1–WGEF interaction by PLA in undifferentiated (U) and RA-treated (RA) SH5YSY cells. Maximum intensity projections are shown. Scale bar: 10 µm. Analysis of RDNAR is shown in the bar plots below (n = 12 images, 2 independent experiments (C). PLA confocal images showing the endogenous RhoA–WGEF interaction in undifferentiated (U) and RA-treated (RA) shMOCK and shANKK1 knockdown cell lines. Maximum intensity projections are shown. Scale bar: 10 µm. Analysis of RDNAR is shown in the bar plots below (n = 11 images, 2 independent experiments). (D). Immunostaining of WGEF in undifferentiated (U) and RA-treated (RA) shMOCK and shANKK1 cell lines. Maximum intensity projections are shown. Scale bar: 15 µm. Analysis of WGEF intensity is shown in the adjacent bar plots (n = 8 images, 2 independent experiments). (E). ANKK1 gene and protein structures. Colors correspond to the kinase domain (blue; encoded by exons 1–6, comprising amino acid positions from 22 to 289) and to the ankyrin repeats domain (green; encoded by exon 8, comprising amino acid positions from 361 to 753, in green). (F). B-factor analysis for the ANKK1 protein. Dark blue represents the lowest B-factor values, while red represents the highest ones. (G). Electrostatic potential surfaces with solvent exclusion calculated by the APBS module implemented with PyMol for the different ANKK1 haplotypes: H2B, H2, and H1 (A red-white-blue color scheme with a range of −5/+5 is used, where red and blue colors correspond to negative and positive electrostatic potentials, respectively. To show different display options, each protein has been rotated 90°. Amino acid positions where the ANKK1 haplotypes/alleles differ (239, 318, 442, 490 and 713) are highlighted in green (right). Plots represent mean ± SD and individual values are displayed as dots. (B) One-sample t-test on the fold-change values was used for U-group comparison. (C) One-sample t-test on the fold-change values was used for shMOCK(U)-group comparison, and Bonferroni was used as a multiple-testing correction method. Student’s t test on the fold-change values was used for inter-group comparisons. * p < 0.05; *** p < 0.001; ns, not significant. Abbreviations: Co-IP: co-immunoprecipitation; IP:ø: non-specific IP; FBS: Fetal bovine serum; PLA: Proximity ligation assay; RA: Retinoic acid; RDNAR: Relative dots/nuclei area ratio; U: Undifferentiated; (+): Positively charged; (−): Negatively charged; (n): neutrally charged. See also Figures S12 and S13.

Figure 5.
ANKK1 knockdown prevents neural differentiation and F-ACTIN assembly. (A). F-ACTIN staining (phalloidin) in undifferentiated (U) and RA or BDNF-treated shMOCK and shANKK1 knockdown cell lines. The corresponding neurites (yellow)/soma (blue) segmentation results are displayed below each original image. A magnification detail of F-ACTIN staining is also shown (image contrast was equalized to appreciate F-ACTIN fibers pattern). Maximum intensity projections are shown. Scale bar: 30 µm. (B) Bar plots showing neurite (yellow)/cell (yellow + blue) area ratio as a marker of neuritogenesis (n = 12 images, 3 independent experiments). (C) Bar plots showing F-ACTIN fluorescence intensity quantification (A.U.) as a marker of F-ACTIN polymerization (n = 12 images in each category, 3 independent experiments). Plots represent mean ± SD and individual values are displayed as dots. Student’s t-test was used for MOCK-group comparisons. Bonferroni was used as a multiple-testing correction method. *** p < 0.001; ns, not significant. Abbreviations: A.U.: Arbitrary units; BDNF: Brain-derived neurotrophic factor; RA: Retinoic acid; U: Undifferentiated.
ANKK1 interactions with the Wnt/PCP components FARP1, WGEF, RAC1, and RhoA lead us to propose that ANKK1 functions as a scaffold protein within this pathway. Considering this, we obtained the ANKK1 structure from the AlphaFold database [35,36] (Uniprot Q8NFD2) to perform in silico studies (Figure 6E). In addition to the RIP kinase and C-terminal ankyrin repeats domains, ANKK1 contains five polymorphic amino acid changes in its sequence that generate specific haplotypes (H2B, H2, and H1). The H2B haplotype is common to all populations, the H2 is the most common in Caucasians, and the H1 includes the risk allele A1 for the TaqIA SNV (Figure S13A). The in silico study using PyMOL (version 1.8) [37] revealed no differences in structure, folding, or flexibility between these ANKK1 haplotypes. However, ANKK1 showed a high B-factor indicative of high flexibility in the RIP kinase and the ankyrin repeats domain (Figure 6F). B-factor for ANKK1 ranges from 26.85 to 98.63 Å2, with a mean value of 82.75 Å2. The largest B-factors are located between the α21–α39 helices of the Ankyrin repeats domain (87.2–98.63 Å2). The kinase domain also shows elevated B-factors for the α5, α6, α10, and α13 helices (90.02–98.06 Å2). Additionally, the electrostatic mapping showed significant differences in the ankyrin repeats domain between ANKK1 haplotypes involving the TaqIA SNV position (Figure 6G). We found changes in the ANKK1 surface for each haplotype/allele in the amino acids 318 [Arg(+) in H2 and Gly(n) in H2B/H1]; 442 [Arg(+) in H2/H1 and Gly(n) in H2B]; 490 [His(+) in H2B/H1 and Arg(+) in H2] and 713 [Glu(−) in H2B/H2 and Lys(+) in H1]. Moreover, we found 56 putative binding sites (Figure S13B), which could facilitate protein interactions and scaffolding properties.
3. Discussion
ANKK1 has been widely associated with addictions, learning paradigms, and other dopaminergic-related phenotypes, especially its TaqIA SNV [8]. Yet, the function of ANKK1 was unknown, and the biological basis of this genetic phenomenon remained unclear. This work shows that ANKK1 is required to modulate the classical GEFs FARP1 and WGEF in their interaction with their substrates RAC1/RhoA and RhoA, respectively. Inferred from these ANKK1 interactors, and considering that ANKK1 overexpression activates the Wnt/PCP signaling, we propose that ANKK1 is a scaffold protein of Wnt/PCP that recruits RhoGEFs in regulating RhoGTPases activation in proliferative neuroblasts and during their differentiation into neurons.
This proposal is based on the following lines of evidence. First, ANKK1 and FARP1 interact at different molecular and cellular levels: (i) genetically, since their expression is coordinated in neuroblasts and during neuronal differentiation; (ii) protein-wise, since ANKK1 and FARP1 interact and this interaction increases during neuronal differentiation; (iii) within the Wnt/PCP pathway, which is activated by individual overexpression of both proteins; (iv) in their cellular function, since both promote morphological changes in the neural lineage, leading the differentiation and maturation of neurons; (v) in their subcellular location, since they colocalize within the plasmatic membrane and in F-ACTIN rich structures for neural maturation and migration; and finally, (vi) both proteins are necessary for RAC1 and RhoA expression and F-ACTIN assembly during neural differentiation. Second, ANKK1 interacts with WGEF, which activates RhoA in the Wnt/PCP pathway [34]. During neuronal differentiation, the ANKK1–WGEF interaction is downregulated, whereas the ANKK1–FARP1 interaction is increased, suggesting that ANKK1 is required to recruit components of Wnt/PCP signaling for the bidirectional control of F-ACTIN assembly.
Given that FARP1 is involved in dendritic growth and synapsis [24,38,39], the ANKK1–FARP1–RAC1 functional relationship may play a role during the development of brain structure or promote neuroplasticity events underlying ANKK1-associated conditions [8]. On the other hand, WGEF belongs to the Ephexin GEFs subfamily involved in neuron development and synaptic homeostasis via F-ACTIN reorganization [40] and regulates planar cell polarity in vertebrate brain development [41]. On the ANKK1 side, our results align with the neurodevelopmental-related locus on chromosome 11q22-23, where ANKK1 maps [42]. In previous work, we demonstrated in mice that the Ankk1 gene and proteins have their maximum expression during embryonic and postnatal development and localize in radial glia and other progenitors [10,18]. Furthermore, ANKK1 is increased in mitotic neural progenitors [18], and Wnt/PCP has been implicated in asymmetric mitosis of neural progenitors during development [43]. Here, we demonstrate that ANKK1 is a component of Wnt/PCP participating in different stages of neural development directed by this pathway, such as neuritogenesis, dendritogenesis, and migration of neural precursors [44]. Our results are consistent with the location of ANKK1 within neural precursors [10,18] and suggest that this protein is relevant to the structural conformation of the brain.
From a clinical point of view, our results would offer a molecular explanation for the association of heritable differences in both structure [5] and cortico-striatal connectivity [6] of the human brain and vulnerability to addiction. Considering that lower cortico-striatal connectivity is associated with vulnerability to addictions [6], we propose that carriers of the A2 allele (H2B and H2 haplotypes) would have a greater cortico-striatal connection than carriers of the A1 allele who are predisposed to addictions. At the neurocognitive level, the A1 allele has been associated with midbrain structures related to addiction biology [45,46,47] and reduced activity in the prefrontal cortex and striatum [48]. Additionally, carriers of the A1 risk allele show greater impulsivity [49,50,51,52,53] and deficiencies in working memory [54], reverse learning [48], learning from errors [55], and long-term memory [56]. All of these deficiencies cause a greater predisposition to addictions.
The genetic phenomenon of association with the TaqIA ANKK1 SNV, however, goes beyond addictions to other psychiatric illnesses such as schizophrenia, eating disorders, and some childhood behavior disorders [57]. Given the relationship between ANKK1 and Wnt/PCP, all of these TaqIA-associated phenotypes could have a basis in brain structure for their expression [57]. Moreover, Wnt pathways are involved in ventral midbrain neurogenesis and dopaminergic axon morphogenesis during development [58,59,60] and also in adult neurogenesis [61,62,63]. Differences in ANKK1 scaffolding properties related to ANKK1 haplotypes and their impact on Wnt/PCP are relevant in these scenarios. If this is the case, ANKK1 polymorphic alleles could potentially impact prenatal Wnt/PCP during brain development, which is a plausible biological mechanism underlying the association between the TaqIA, the psychiatric phenotypes, and human brain structure. Future studies of the WNT/PCP pathway in ANKK1 knockout mouse models are necessary to provide more information about the involvement of ANKK1 proteins and their influence on behavior and susceptibility to addiction.
In conclusion, here we provide the first evidence for the precise function of ANKK1 and a biological correlate to the wide range of behavioral phenotypes and psychiatric disorders associated with the ANKK1 TaqIA SNV. Henceforward, the TaqIA-associated phenotypes can no longer be explained only by functional variations in the dopamine receptor D2, as our findings support a definitive role for ANKK1. There is still work to be performed to understand the implications of the ANKK1 alleles and their relationship to tissue- or context-dependent components of Wnt/PCP and their functions. This knowledge could reveal how brain structural differences underlie vulnerability or resilience to changes induced either by drug use in the case of addiction or by environmental factors that trigger other ANKK1-associated disorders or behaviors.
4. Materials and Methods
4.1. Study Design, Materials and Data Collection
This study was designed to identify ANKK1 pathways and interactors using as a first step, isobaric tagging for relative and absolute quantitation (iTRAQ) mass spectrometry of protein extracts from HEK293 cells overexpressing ANKK1. ANKK1–FARP1 interaction was characterized in SH-SY5Y cells with neuroblast-like morphology, which are positive for tyrosine hydroxylase (TH) and dopamine-β-hydroxylase and can be differentiated to a mature neuron-like phenotype characterized by neuronal markers [64]. We generated modified SH-SY5Y cell lines that stably express ANKK1 or FARP1, as well as knockdown cell lines for these proteins. The cellular models were studied under proliferative conditions (undifferentiated) or after treatment with retinoic acid (RA) or serum-starved conditions to induce their differentiation into neurons. A detailed description of the materials and methods can be found as Supplementary Materials.
4.2. Statistical Analysis
Statistical analysis was performed using R software for Windows (version 4.3.1). The Shapiro–Wilk test was used to check the normality assumption for data distribution. When necessary, we normalized data relative to controls to mitigate variability between assays. In these cases, we performed a one-sample t-test (≠1) for each groups compared to the control (forced to be =1 because of normalization), and Student’s t-test (2 groups) or ANOVA (>2 groups) for each group-to-group comparison. For the remaining analyses, we used Student’s t-test (2 groups) or ANOVA (>2 groups) for each group-to-group comparison. To reduce the risk of false discoveries stemming from multiple tests, we employed the Bonferroni correction.
We developed custom automatic image analysis methods to quantify and qualify neural structures (Supplementary Materials). An independent investigator performed the analysis of the experimental results blindly. Sample sizes were estimated based on our previous experience with each technique. Outliers were excluded from the analysis. All experiments with biological replicates are indicated in the figure legends. The details of the materials and methods are in the Supplementary Materials. To evaluate wound area reduction over time, we performed mixed-effects linear regression. All statistical tests defined p < 0.05 as significant. Unless otherwise specified, all results are expressed as mean ± 1 SD. The experiments were performed at least three times.
Supplementary Materials
The following supporting information can be downloaded at: https://www.mdpi.com/article/10.3390/ijms251910705/s1. References [10,14,18,64,65,66,67,68,69,70,71,72,73,74,75,76,77,78,79,80,81,82,83,84,85,86,87] are cited in the Supplementary Materials.
Author Contributions
Conceptualization, J.H. and L.D.-B.; acquisition of data, L.D.-B., L.C., M.R.-S., G.T., E.G., J.T.-B., M.S., X.H.C.-M., S.F.-L., E.U., E.C., J.A.L. and J.H.; formal analysis, J.H., L.D.-B., L.C., M.R.-S. and J.H.; writing original draft J.H.; review & editing, J.H., F.P., L.C., M.R.-S., S.F.-L., J.T.-B., M.S., J.A.L. and L.D.-B.; funding acquisition, J.H., T.P. and F.P. All authors have read and agreed to the published version of the manuscript.
Funding
Instituto de Salud Carlos III has funded this study, grants PI19/00126 and PI22/00680 (Co-funded by European Regional Development Fund/European Social Fund “A way to make Europe”/”Investing in your future”). The CIBERER, CIBERCV and CIBERSAM are initiatives of the Instituto de Salud Carlos III, Ministerio de Ciencia e Innovación and Unión Europea-European Regional Development Fund. The CNIC is supported by the Instituto de Salud Carlos III (ISCIII), the Ministerio de Ciencia e Innovación (MICIN) and the Pro CNIC Foundation), and is a Severo Ochoa Center of Excellence (grant CEX2020-001041-S funded by MICIN/AEI/10.13039/501100011033). The Hospital Sant Joan de Déu is a member of the European Reference Network, ERN ITHACA. All imaging acquirement was performed at the confocal microscopy unit of Sant Joan de Déu Children’s Hospital, as part of ‘Centre Daniel Bravo de Diagnòstic i Recerca en Malalties Minoritàries (CDB).
Institutional Review Board Statement
Not applicable.
Informed Consent Statement
Not applicable.
Data Availability Statement
Further information and requests for resources and reagents should be directed to and will be fulfilled by the Lead Contact, Janet Hoenicka (janet.hoenicka@sjd.es).
Conflicts of Interest
The authors declare no competing interests.
References
- Koob, G.F.; Volkow, N.D. Neurobiology of addiction: A neurocircuitry analysis. Lancet Psychiatry 2016, 3, 760–773. [Google Scholar] [CrossRef] [PubMed]
- Bevilacqua, L.; Goldman, D. Genes and addictions. Clin. Pharmacol. Ther. 2009, 85, 359–361. [Google Scholar] [CrossRef] [PubMed]
- Kendler, K.S.; Davis, C.G.; Kessler, R.C. The familial aggregation of common psychiatric and substance use disorders in the National Comorbidity Survey: A family history study. Br. J. Psychiatry J. Ment. Sci. 1997, 170, 541–548. [Google Scholar] [CrossRef] [PubMed]
- Merikangas, K.R.; Stolar, M.; Stevens, D.E.; Goulet, J.; Preisig, M.A.; Fenton, B.; Zhang, H.; O’Malley, S.S.; Rounsaville, B.J. Familial transmission of substance use disorders. Arch. Gen. Psychiatry 1998, 55, 973–979. [Google Scholar] [CrossRef] [PubMed]
- Ersche, K.D.; Jones, P.S.; Williams, G.B.; Turton, A.J.; Robbins, T.W.; Bullmore, E.T. Abnormal brain structure implicated in stimulant drug addiction. Science 2012, 335, 601–604. [Google Scholar] [CrossRef] [PubMed]
- Ersche, K.D.; Meng, C.; Ziauddeen, H.; Stochl, J.; Williams, G.B.; Bullmore, E.T.; Robbins, T.W. Brain networks underlying vulnerability and resilience to drug addiction. Proc. Natl. Acad. Sci. USA 2020, 117, 15253–15261. [Google Scholar] [CrossRef]
- Neville, M.J.; Johnstone, E.C.; Walton, R.T. Identification and characterization of ANKK1: A novel kinase gene closely linked to DRD2 on chromosome band 11q23.1. Hum. Mutat. 2004, 23, 540–545. [Google Scholar] [CrossRef]
- Koeneke, A.; Ponce, G.; Troya-Balseca, J.; Palomo, T.; Hoenicka, J. Ankyrin Repeat and Kinase Domain Containing 1 Gene, and Addiction Vulnerability. Int. J. Mol. Sci. 2020, 21, 2516. [Google Scholar] [CrossRef]
- Blum, K.; Noble, E.P.; Sheridan, P.J.; Montgomery, A.; Ritchie, T.; Jagadeeswaran, P.; Nogami, H.; Briggs, A.H.; Cohn, J.B. Allelic association of human dopamine D2 receptor gene in alcoholism. JAMA 1990, 263, 2055–2060. [Google Scholar] [CrossRef]
- Hoenicka, J.; Quinones-Lombrana, A.; Espana-Serrano, L.; Alvira-Botero, X.; Kremer, L.; Perez-Gonzalez, R.; Rodriguez-Jimenez, R.; Jimenez-Arriero, M.A.; Ponce, G.; Palomo, T. The ANKK1 gene associated with addictions is expressed in astroglial cells and upregulated by apomorphine. Biol. Psychiatry 2010, 67, 3–11. [Google Scholar] [CrossRef]
- Lucht, M.; Rosskopf, D. Comment on “Genetically determined differences in learning from errors”. Science 2008, 321, 200. [Google Scholar] [CrossRef] [PubMed]
- Jung, Y.; Montel, R.A.; Shen, P.H.; Mash, D.C.; Goldman, D. Assessment of the Association of D2 Dopamine Receptor Gene and Reported Allele Frequencies With Alcohol Use Disorders: A Systematic Review and Meta-analysis. JAMA Netw. Open 2019, 2, e1914940. [Google Scholar] [CrossRef] [PubMed]
- Ponce, G.; Hoenicka, J.; Jimenez-Arriero, M.A.; Rodriguez-Jimenez, R.; Aragues, M.; Martin-Sune, N.; Huertas, E.; Palomo, T. DRD2 and ANKK1 genotype in alcohol-dependent patients with psychopathic traits: Association and interaction study. Br. J. Psychiatry J. Ment. Sci. 2008, 193, 121–125. [Google Scholar] [CrossRef] [PubMed]
- Garrido, E.; Palomo, T.; Ponce, G.; Garcia-Consuegra, I.; Jimenez-Arriero, M.A.; Hoenicka, J. The ANKK1 protein associated with addictions has nuclear and cytoplasmic localization and shows a differential response of Ala239Thr to apomorphine. Neurotox. Res. 2011, 20, 32–39. [Google Scholar] [CrossRef]
- Ponce, G.; Quinones-Lombrana, A.; Martin-Palanco, N.G.; Rubio-Solsona, E.; Jimenez-Arriero, M.A.; Palomo, T.; Hoenicka, J. The Addiction-Related Gene Ankk1 is Oppositely Regulated by D1R- and D2R-Like Dopamine Receptors. Neurotox. Res. 2016, 29, 345–350. [Google Scholar] [CrossRef]
- Leggieri, A.; Garcia-Gonzalez, J.; Torres-Perez, J.V.; Havelange, W.; Hosseinian, S.; Mech, A.M.; Keatinge, M.; Busch-Nentwich, E.M.; Brennan, C.H. Ankk1 Loss of Function Disrupts Dopaminergic Pathways in Zebrafish. Front. Neurosci. 2022, 16, 794653. [Google Scholar] [CrossRef]
- Montalban, E.; Walle, R.; Castel, J.; Ansoult, A.; Hassouna, R.; Foppen, E.; Fang, X.; Hutelin, Z.; Mickus, S.; Perszyk, E.; et al. The Addiction-Susceptibility TaqIA/Ankk1 Controls Reward and Metabolism Through D(2) Receptor-Expressing Neurons. Biol. Psychiatry 2023, 94, 424–436. [Google Scholar] [CrossRef]
- Espana-Serrano, L.; Martin-Palanco, N.G.; Montero-Pedrazuela, A.; Perez-Santamarina, E.; Vidal, R.; Garcia-Consuegra, I.; Valdizan, E.M.; Pazos, A.; Palomo, T.; Jimenez-Arriero, M.A.; et al. The Addiction-Related Protein ANKK1 is Differentially Expressed During the Cell Cycle in Neural Precursors. Cereb. Cortex 2017, 27, 2809–2819. [Google Scholar] [CrossRef]
- Cuny, G.D.; Degterev, A. RIPK protein kinase family: Atypical lives of typical kinases. Semin. Cell Dev. Biol. 2021, 109, 96–105. [Google Scholar] [CrossRef]
- Zhang, D.; Lin, J.; Han, J. Receptor-interacting protein (RIP) kinase family. Cell Mol. Immunol. 2010, 7, 243–249. [Google Scholar] [CrossRef]
- Witt, A.; Vucic, D. Diverse ubiquitin linkages regulate RIP kinases-mediated inflammatory and cell death signaling. Cell Death Differ. 2017, 24, 1160–1171. [Google Scholar] [CrossRef] [PubMed]
- Meylan, E.; Tschopp, J. The RIP kinases: Crucial integrators of cellular stress. Trends Biochem. Sci. 2005, 30, 151–159. [Google Scholar] [CrossRef] [PubMed]
- Rountree, R.B.; Willis, C.R.; Dinh, H.; Blumberg, H.; Bailey, K.; Dean, C., Jr.; Peschon, J.J.; Holland, P.M. RIP4 regulates epidermal differentiation and cutaneous inflammation. J. Investig. Dermatol. 2010, 130, 102–112. [Google Scholar] [CrossRef]
- Cheadle, L.; Biederer, T. The novel synaptogenic protein Farp1 links postsynaptic cytoskeletal dynamics and transsynaptic organization. J. Cell Biol. 2012, 199, 985–1001. [Google Scholar] [CrossRef]
- Zhuang, B.; Su, Y.S.; Sockanathan, S. FARP1 promotes the dendritic growth of spinal motor neuron subtypes through transmembrane Semaphorin6A and PlexinA4 signaling. Neuron 2009, 61, 359–372. [Google Scholar] [CrossRef]
- Cheadle, L.; Biederer, T. Activity-dependent regulation of dendritic complexity by semaphorin 3A through Farp1. J. Neurosci. Off. J. Soc. Neurosci. 2014, 34, 7999–8009. [Google Scholar] [CrossRef]
- Cooke, M.; Zhang, S.; Maciel, F.C.; Kazanietz, M.G. Gi/o GPCRs drive the formation of actin-rich tunneling nanotubes in cancer cells via a Gbetagamma/PKCalpha/FARP1/Cdc42 axis. J. Biol. Chem. 2023, 299, 104983. [Google Scholar] [CrossRef] [PubMed]
- Rubio-Solsona, E.; Marti, S.; Vilchez, J.J.; Palau, F.; Hoenicka, J. ANKK1 is found in myogenic precursors and muscle fibers subtypes with glycolytic metabolism. PLoS ONE 2018, 13, e0197254. [Google Scholar]
- Hirano, T.; Shinsato, Y.; Tanabe, K.; Higa, N.; Kamil, M.; Kawahara, K.; Yamamoto, M.; Minami, K.; Shimokawa, M.; Arigami, T.; et al. FARP1 boosts CDC42 activity from integrin alphavbeta5 signaling and correlates with poor prognosis of advanced gastric cancer. Oncogenesis 2020, 9, 13. [Google Scholar] [CrossRef]
- Cooke, M.; Kreider-Letterman, G.; Baker, M.J.; Zhang, S.; Sullivan, N.T.; Eruslanov, E.; Abba, M.C.; Goicoechea, S.M.; Garcia-Mata, R.; Kazanietz, M.G. FARP1, ARHGEF39, and TIAM2 are essential receptor tyrosine kinase effectors for Rac1-dependent cell motility in human lung adenocarcinoma. Cell Rep. 2021, 37, 109905. [Google Scholar] [CrossRef]
- Burkel, B.M.; von Dassow, G.; Bement, W.M. Versatile fluorescent probes for actin filaments based on the actin-binding domain of utrophin. Cell Motil. Cytoskeleton 2007, 64, 822–832. [Google Scholar] [CrossRef] [PubMed]
- Mulligan, K.A.; Cheyette, B.N. Wnt signaling in vertebrate neural development and function. J. Neuroimmune Pharmacol. 2012, 7, 774–787. [Google Scholar] [CrossRef] [PubMed]
- Schlessinger, K.; Hall, A.; Tolwinski, N. Wnt signaling pathways meet Rho GTPases. Genes. Dev. 2009, 23, 265–277. [Google Scholar] [CrossRef] [PubMed]
- Tanegashima, K.; Zhao, H.; Dawid, I.B. WGEF activates Rho in the Wnt-PCP pathway and controls convergent extension in Xenopus gastrulation. EMBO J. 2008, 27, 606–617. [Google Scholar] [CrossRef] [PubMed]
- Jumper, J.; Evans, R.; Pritzel, A.; Green, T.; Figurnov, M.; Ronneberger, O.; Tunyasuvunakool, K.; Bates, R.; Zidek, A.; Potapenko, A.; et al. Highly accurate protein structure prediction with AlphaFold. Nature 2021, 596, 583–589. [Google Scholar] [CrossRef]
- Varadi, M.; Anyango, S.; Deshpande, M.; Nair, S.; Natassia, C.; Yordanova, G.; Yuan, D.; Stroe, O.; Wood, G.; Laydon, A.; et al. AlphaFold Protein Structure Database: Massively expanding the structural coverage of protein-sequence space with high-accuracy models. Nucleic Acids Res. 2022, 50, D439–D444. [Google Scholar] [CrossRef]
- Schrödinger, L.L.C. The PyMOL Molecular Graphics System, Version 1.8; Schrödinger: New York, NY, USA, 2015. [Google Scholar]
- Koyano, Y.; Kawamoto, T.; Shen, M.; Yan, W.; Noshiro, M.; Fujii, K.; Kato, Y. Molecular cloning and characterization of CDEP, a novel human protein containing the ezrin-like domain of the band 4.1 superfamily and the Dbl homology domain of Rho guanine nucleotide exchange factors. Biochem. Biophys. Res. Commun. 1997, 241, 369–375. [Google Scholar] [CrossRef]
- Fan, L.; Yan, H.; Pellegrin, S.; Morigen; Mellor, H. The Rif GTPase regulates cytoskeletal signaling from plexinA4 to promote neurite retraction. Neurosci. Lett. 2015, 590, 178–183. [Google Scholar] [CrossRef]
- Kim, K.; Lee, S.A.; Park, D. Emerging Roles of Ephexins in Physiology and Disease. Cells 2019, 8, 87. [Google Scholar] [CrossRef]
- Wada, H.; Okamoto, H. Roles of planar cell polarity pathway genes for neural migration and differentiation. Dev. Growth Differ. 2009, 51, 233–240. [Google Scholar] [CrossRef]
- Mota, N.R.; Araujo-Jnr, E.V.; Paixao-Cortes, V.R.; Bortolini, M.C.; Bau, C.H. Linking dopamine neurotransmission and neurogenesis: The evolutionary history of the NTAD (NCAM1-TTC12-ANKK1-DRD2) gene cluster. Genet. Mol. Biol. 2012, 35 (Suppl. S4), 912–918. [Google Scholar] [CrossRef] [PubMed]
- Delaunay, D.; Cortay, V.; Patti, D.; Knoblauch, K.; Dehay, C. Mitotic spindle asymmetry: A Wnt/PCP-regulated mechanism generating asymmetrical division in cortical precursors. Cell Rep. 2014, 6, 400–414. [Google Scholar] [CrossRef]
- Mulligan, K.A.; Cheyette, B.N. Neurodevelopmental Perspectives on Wnt Signaling in Psychiatry. Mol. Neuropsychiatry 2017, 2, 219–246. [Google Scholar] [CrossRef] [PubMed]
- Cerasa, A.; Gioia, M.C.; Tarantino, P.; Labate, A.; Arabia, G.; Annesi, G.; Lanza, P.; Di Palma, G.; Blasi, V.; Quattrone, A. The DRD2 TaqIA polymorphism associated with changed midbrain volumes in healthy individuals. Genes. Brain Behav. 2009, 8, 459–463. [Google Scholar] [CrossRef] [PubMed]
- Montag, C.; Weber, B.; Jentgens, E.; Elger, C.; Reuter, M. An epistasis effect of functional variants on the BDNF and DRD2 genes modulates gray matter volume of the anterior cingulate cortex in healthy humans. Neuropsychologia 2010, 48, 1016–1021. [Google Scholar] [CrossRef] [PubMed]
- Li, X.; Papenberg, G.; Kalpouzos, G.; Backman, L.; Persson, J. Influence of the DRD2/ANKK1 Taq1A polymorphism on caudate volume in older adults without dementia. Brain Struct. Funct. 2018, 223, 2653–2662. [Google Scholar] [CrossRef]
- Jocham, G.; Klein, T.A.; Neumann, J.; von Cramon, D.Y.; Reuter, M. Ullsperger, Dopamine DRD2 polymorphism alters reversal learning and associated neural activity. J. Neurosci. Off. J. Soc. Neurosci. 2009, 29, 3695–3704. [Google Scholar] [CrossRef]
- Rodriguez-Jimenez, R.; Avila, C.; Ponce, G.; Ibanez, M.I.; Rubio, G.; Jimenez-Arriero, M.A.; Ampuero, I.; Ramos, J.A.; Hoenicka, J.; Palomo, T. The TaqIA polymorphism linked to the DRD2 gene is related to lower attention and less inhibitory control in alcoholic patients. Eur. Psychiatry J. Assoc. Eur. Psychiatr. 2006, 21, 66–69. [Google Scholar] [CrossRef]
- Eisenberg, D.T.; Mackillop, J.; Modi, M.; Beauchemin, J.; Dang, D.; Lisman, S.A.; Lum, J.K.; Wilson, D.S. Examining impulsivity as an endophenotype using a behavioral approach: A DRD2 TaqI A and DRD4 48-bp VNTR association study. Behav. Brain Funct. 2007, 3, 2. [Google Scholar] [CrossRef]
- White, M.J.; Morris, C.P.; Lawford, B.R.; Young, R.M. Behavioral phenotypes of impulsivity related to the ANKK1 gene are independent of an acute stressor. Behav. Brain Funct. 2008, 4, 54. [Google Scholar] [CrossRef]
- Hamidovic, A.; Dlugos, A.; Skol, A.; Palmer, A.A.; de Wit, H. Evaluation of genetic variability in the dopamine receptor D2 in relation to behavioral inhibition and impulsivity/sensation seeking: An exploratory study with d-amphetamine in healthy participants. Exp. Clin. Psychopharmacol. 2009, 17, 374–383. [Google Scholar] [CrossRef] [PubMed]
- Gullo, M.J.; John, N.S.; Mc, D.Y.R.; Saunders, J.B.; Noble, E.P.; Connor, J.P. Impulsivity-related cognition in alcohol dependence: Is it moderated by DRD2/ANKK1 gene status and executive dysfunction? Addict. Behav. 2014, 39, 1663–1669. [Google Scholar] [CrossRef] [PubMed]
- Nymberg, C.; Banaschewski, T.; Bokde, A.L.; Buchel, C.; Conrod, P.; Flor, H.; Frouin, V.; Garavan, H.; Gowland, P.; Heinz, A.; et al. DRD2/ANKK1 polymorphism modulates the effect of ventral striatal activation on working memory performance. Neuropsychopharmacol. Off. Publ. Am. Coll. Neuropsychopharmacol. 2014, 39, 2357–2365. [Google Scholar] [CrossRef] [PubMed]
- Klein, T.A.; Neumann, J.; Reuter, M.; Hennig, J.; von Cramon, D.Y.; Ullsperger, M. Genetically determined differences in learning from errors. Science 2007, 318, 1642–1645. [Google Scholar] [CrossRef]
- Persson, J.; Rieckmann, A.; Kalpouzos, G.; Fischer, H.; Backman, L. Influences of a DRD2 polymorphism on updating of long-term memory representations and caudate BOLD activity: Magnification in aging. Hum. Brain Mapp. 2015, 36, 1325–1334. [Google Scholar] [CrossRef]
- Ponce, G.; Perez-Gonzalez, R.; Aragues, M.; Palomo, T.; Rodriguez-Jimenez, R.; Jimenez-Arriero, M.A.; Hoenicka, J. The ANKK1 kinase gene and psychiatric disorders. Neurotox. Res. 2009, 16, 50–59. [Google Scholar] [CrossRef] [PubMed]
- Fernando, C.V.; Kele, J.; Bye, C.R.; Niclis, J.C.; Alsanie, W.; Blakely, B.D.; Stenman, J.; Turner, B.J.; Parish, C.L. Diverse roles for Wnt7a in ventral midbrain neurogenesis and dopaminergic axon morphogenesis. Stem Cells Dev. 2014, 23, 1991–2003. [Google Scholar] [CrossRef]
- Andersson, E.R.; Salto, C.; Villaescusa, J.C.; Cajanek, L.; Yang, S.; Bryjova, L.; Nagy, I.I.; Vainio, S.J.; Ramirez, C.; Bryja, V.; et al. Wnt5a cooperates with canonical Wnts to generate midbrain dopaminergic neurons in vivo and in stem cells. Proc. Natl. Acad. Sci. USA 2013, 110, E602–E610. [Google Scholar] [CrossRef]
- Blakely, B.D.; Bye, C.R.; Fernando, C.V.; Horne, M.K.; Macheda, M.L.; Stacker, S.A.; Arenas, E.; Parish, C.L. Wnt5a regulates midbrain dopaminergic axon growth and guidance. PLoS ONE 2011, 6, e18373. [Google Scholar] [CrossRef]
- Qu, Q.; Sun, G.; Murai, K.; Ye, P.; Li, W.; Asuelime, G.; Cheung, Y.T.; Shi, Y. Wnt7a regulates multiple steps of neurogenesis. Mol. Cell. Biol. 2013, 33, 2551–2559. [Google Scholar] [CrossRef]
- Davis, E.K.; Zou, Y.; Ghosh, A. Wnts acting through canonical and noncanonical signaling pathways exert opposite effects on hippocampal synapse formation. Neural Dev. 2008, 3, 32. [Google Scholar] [CrossRef] [PubMed]
- Rosso, S.B.; Sussman, D.; Wynshaw-Boris, A.; Salinas, P.C. Wnt signaling through Dishevelled, Rac and JNK regulates dendritic development. Nat. Neurosci. 2005, 8, 34–42. [Google Scholar] [CrossRef] [PubMed]
- Kovalevich, J.; Santerre, M.; Langford, D. Considerations for the Use of SH-SY5Y Neuroblastoma Cells in Neurobiology. Methods Mol. Biol. 2021, 2311, 9–23. [Google Scholar] [PubMed]
- Alonso-Orgaz, S.; Martin-Rojas, T.; Calvo, E.; Lopez, J.A.; Vivanco, F.; Barderas, M.G. Differential protein expression analysis of degenerative aortic stenosis by iTRAQ labeling. Methods Mol. Biol. 2013, 1005, 109–117. [Google Scholar] [CrossRef]
- Larionov, A.; Krause, A.; Miller, W. A standard curve based method for relative real time PCR data processing. BMC Bioinform. 2005, 6, 62. [Google Scholar] [CrossRef]
- Coll, L.; Civera-Tregón, A.; Hoenicka, J.; Palau, F.; Benítez, R. Comparison of different cell segmentation techniques in neuronal cultures. In Proceedings of the XXXV Annual Congress of the Spanish Society of Biomedical Engineering, Bilbao, Spain, 29 November–1 December 2017. [Google Scholar]
- Jiang, Q.; Zhang, J.; Li, F.; Ma, X.; Wu, F.; Miao, J.; Li, Q.; Wang, X.; Sun, R.; Yang, Y.; et al. POLR2A Promotes the Proliferation of Gastric Cancer Cells by Advancing the Overall Cell Cycle Progression. Front. Genet. 2021, 12, 688575. [Google Scholar] [CrossRef]
- Shimizu, Y.; Kawasaki, T. Histone acetyltransferase EP300 regulates the proliferation and differentiation of neural stem cells during adult neurogenesis and regenerative neurogenesis in the zebrafish optic tectum. Neurosci. Lett. 2021, 756, 135978. [Google Scholar] [CrossRef]
- Tan, Y.; Xie, Z.; Ding, M.; Wang, Z.; Yu, Q.; Meng, L.; Zhu, H.; Huang, X.; Yu, L.; Meng, X.; et al. Increased levels of FoxA1 transcription factor in pluripotent P19 embryonal carcinoma cells stimulate neural differentiation. Stem Cells Dev. 2010, 19, 1365–1374. [Google Scholar] [CrossRef]
- Willett, R.T.; Greene, L.A. Gata2 is required for migration and differentiation of retinorecipient neurons in the superior colliculus. J. Neurosci. Off. J. Soc. Neurosci. 2011, 31, 4444–4455. [Google Scholar] [CrossRef]
- Haugas, M.; Tikker, L.; Achim, K.; Salminen, M.; Partanen, J. Gata2 and Gata3 regulate the differentiation of serotonergic and glutamatergic neuron subtypes of the dorsal raphe. Development 2016, 143, 4495–4508. [Google Scholar] [CrossRef]
- El Wakil, A.; Francius, C.; Wolff, A.; Pleau-Varet, J.; Nardelli, J. The GATA2 transcription factor negatively regulates the proliferation of neuronal progenitors. Development 2006, 133, 2155–2165. [Google Scholar] [CrossRef] [PubMed]
- Snyder, M.; Huang, X.Y.; Zhang, J.J. Stat3 is essential for neuronal differentiation through direct transcriptional regulation of the Sox6 gene. FEBS Lett. 2011, 585, 148–152. [Google Scholar] [CrossRef] [PubMed]
- Pachernik, J.; Horvath, V.; Kubala, L.; Dvorak, P.; Kozubik, A.; Hampl, A. Neural differentiation potentiated by the leukaemia inhibitory factor through STAT3 signalling in mouse embryonal carcinoma cells. Folia Biol. 2007, 53, 157–163. [Google Scholar]
- Dixon, J.R.; Selvaraj, S.; Yue, F.; Kim, A.; Li, Y.; Shen, Y.; Hu, M.; Liu, J.S.; Ren, B. Topological domains in mammalian genomes identified by analysis of chromatin interactions. Nature 2012, 485, 376–380. [Google Scholar] [CrossRef]
- Nora, E.P.; Lajoie, B.R.; Schulz, E.G.; Giorgetti, L.; Okamoto, I.; Servant, N.; Piolot, T.; van Berkum, N.L.; Meisig, J.; Sedat, J.; et al. Spatial partitioning of the regulatory landscape of the X-inactivation centre. Nature 2012, 485, 381–385. [Google Scholar] [CrossRef]
- Lehman, B.J.; Lopez-Diaz, F.J.; Santisakultarm, T.P.; Fang, L.; Shokhirev, M.N.; Diffenderfer, K.E.; Manor, U.; Emerson, B.M. Dynamic regulation of CTCF stability and sub-nuclear localization in response to stress. PLoS Genet. 2021, 17, e1009277. [Google Scholar] [CrossRef]
- Zhang, L.; Zhang, X.; Zhang, Y.; Xu, N.; Wang, J.; Zhu, Y.; Xia, C. Brn4 promotes the differentiation of radial glial cells into neurons by inhibiting CtBP2. Life Sci. 2020, 254, 116866. [Google Scholar] [CrossRef] [PubMed]
- Sher, F.; Rossler, R.; Brouwer, N.; Balasubramaniyan, V.; Boddeke, E.; Copray, S. Differentiation of neural stem cells into oligodendrocytes: Involvement of the polycomb group protein Ezh2. Stem Cells 2008, 26, 2875–2883. [Google Scholar] [CrossRef]
- Pfarr, C.M.; Mechta, F.; Spyrou, G.; Lallemand, D.; Carillo, S.; Yaniv, M. Mouse JunD negatively regulates fibroblast growth and antagonizes transformation by ras. Cell 1994, 76, 747–760. [Google Scholar] [CrossRef]
- Schlingensiepen, K.H.; Wollnik, F.; Kunst, M.; Schlingensiepen, R.; Herdegen, T.; Brysch, W. The role of Jun transcription factor expression and phosphorylation in neuronal differentiation, neuronal cell death, and plastic adaptations in vivo. Cell Mol. Neurobiol. 1994, 14, 487–505. [Google Scholar] [CrossRef]
- Cheng, H.; Zhang, N.; Pati, D. Cohesin subunit RAD21: From biology to disease. Gene 2020, 758, 144966. [Google Scholar] [CrossRef] [PubMed]
- Li, H.H.; Li, A.G.; Sheppard, H.M.; Liu, X. Phosphorylation on Thr-55 by TAF1 mediates degradation of p53: A role for TAF1 in cell G1 progression. Mol. Cell 2004, 13, 867–878. [Google Scholar] [CrossRef] [PubMed]
- Ren, G.; Hu, J.; Shang, Y.; Zhong, Y.; Yu, Z.; An, J. Tributylphosphate (TBP) and tris (2-butoxyethyl) phosphate (TBEP) induced apoptosis and cell cycle arrest in HepG2 cells. Toxicol. Res. 2017, 6, 902–911. [Google Scholar] [CrossRef] [PubMed]
- Knauss, J.L.; Miao, N.; Kim, S.N.; Nie, Y.; Shi, Y.; Wu, T.; Pinto, H.B.; Donohoe, M.E.; Sun, T. Long noncoding RNA Sox2ot and transcription factor YY1 co-regulate the differentiation of cortical neural progenitors by repressing Sox2. Cell Death Dis. 2018, 9, 799. [Google Scholar] [CrossRef]
- Ye, B.; Yang, G.; Li, Y.; Zhang, C.; Wang, Q.; Yu, G. ZNF143 in Chromatin Looping and Gene Regulation. Front. Genet. 2020, 11, 338. [Google Scholar] [CrossRef]

Disclaimer/Publisher’s Note: The statements, opinions and data contained in all publications are solely those of the individual author(s) and contributor(s) and not of MDPI and/or the editor(s). MDPI and/or the editor(s) disclaim responsibility for any injury to people or property resulting from any ideas, methods, instructions or products referred to in the content. |
© 2024 by the authors. Licensee MDPI, Basel, Switzerland. This article is an open access article distributed under the terms and conditions of the Creative Commons Attribution (CC BY) license (https://creativecommons.org/licenses/by/4.0/).