Article

Genome-Wide Profiling of the ACTIN Gene Family and Its Implications for Agronomic Traits in Brassica Napus: A Bioinformatics Study

1
College of Life Science and Technology, Wuhan Polytechnic University, Wuhan 430023, China
2
Horticultural Crop Biology and Germplasm Enhancement, College of Horticulture, South China Agricultural University, Guangzhou 510642, China
*
Author to whom correspondence should be addressed.
Int. J. Mol. Sci. 2024, 25(19), 10752; https://doi.org/10.3390/ijms251910752 (registering DOI)
Submission received: 12 September 2024 / Revised: 1 October 2024 / Accepted: 4 October 2024 / Published: 6 October 2024
(This article belongs to the Section Molecular Plant Sciences)

Abstract

:
ACTINs are key structural proteins in plants, which form the actin cytoskeleton and are engaged in numerous routine cellular processes. Meanwhile, ACTIN, recognized as a housekeeping gene, has not yet been thoroughly investigated in Brassica napus. The current research has led to the detection of 69 actin genes in B. napus, which were organized into six distinct subfamilies on the basis of phylogenetic relationships. Functional enrichment analysis, along with the construction of protein interaction networks, suggested that BnACTINs play roles in Preserving cell morphology and facilitating cytoplasmic movement, plant development, and adaptive responses to environmental stress. Moreover, the BnACTIN genes presented a wide range of expression levels among different tissues, whereas the majority experienced a substantial increase in expression when subjected to various abiotic stresses, demonstrating a pronounced sensitivity to abiotic factors. Furthermore, association mapping analysis indicated that some BnACTINs potentially affected certain key agronomic traits. Overall, our research deepens the knowledge of BnACTIN genes, promotes the cultivation of improved B. napus strains, and lays the groundwork for subsequent functional research.

1. Introduction

ACTIN protein is highly conserved in eukaryotes, which participate in cytoskeletal formation and various cellular processes that have a significant influence on plant growth and development [1,2]. The plant actin cytoskeleton is irreplaceable for its role in the connection of proteomic functions to cellular life activities [3,4,5]. A multitude of cellular processes in plant cells relies on the cytoplasmic actin cytoskeleton, which is key to cell fission and expansion regulation, propelling the flow of cytoplasm, nurturing growth at the tips, forming and sustaining cell contours and directional properties and orchestrating organelle transport and relocation [6,7,8]. Moreover, the cytoskeleton frequently acts as a mediator of stress response in plants [9,10]. For instance, ACTINs may be employed as candidate genes to fortify sweet potato against abiotic stress [11]. ACTIN filaments are crucial in stress-induced signaling pathways, serving as both direct targets and signal transducers [12]. ACTIN can exist in the form of monomeric G-actin or as a part of filamentous F-actin. G-ACTIN represents the soluble, globular monomeric form of ACTIN, capable of polymerizing to create F-ACTIN, which then constitutes the cytoskeleton and the contractile machinery of muscle cells, driving cell movement and muscle contractions [13,14]. Additionally, ACTIN stands as a highly conserved protein with a molecular mass of about 42 kDa and consists of a polypeptide chain made up of 375 amino acids. At least six types of actin have been isolated in mammalian and avian cells, four of which are called alpha-actins, specifically found in skeletal muscle, cardiac muscle, vascular smooth muscle, and intestinal smooth muscle, respectively; the other two are beta-actin and gamma-actin, which are present in all muscle cells and the cytoplasm of non-muscle cells. Nevertheless, multiple genes in plants encode ACTINs, leading to the existence of various ACTIN isoforms [15,16,17]. In order to accommodate various functions, multiple ACTIN isoforms with diverse functions are coexpressed in different eukaryotic organisms [15,18]. ACTIN serves as a key constituent of the organelle skeleton, crucial for the life-sustaining functions of plants, and is frequently used as an internal reference gene owing to its consistent expression across diverse cellular physiological conditions [19,20].
In the past, research on the structural and functional aspects of actin genes has been chiefly concerned with higher eukaryotes. In terrestrial plants and animals, actin genes are generally the product of a diverse gene family, a result of gene duplication and subsequent diversification [21]. So far, actin genes have been identified in several plants at the genome-wide level, including 20 in Arabidopsis thaliana, 16 in grape, 22 in rice, 18 in poplar, and 30 in sweet potato, following the rapid development of high-throughput sequencing [4,15,22,23]. Multiple distinct actin isoforms have been recognized in these species, all encoded by separate genes. In Arabidopsis thaliana, ACTINs are categorized into six subfamilies, the majority of which display tissue-specific expression patterns [24]. Moreover, according to their phylogenetic relationships and expression profiles, the eight genes can be divided into two main categories: one vegetative class, predominantly expressed in leaves, stems, roots, petals, and sepals, and a reproductive class, strongly expressed in pollen, ovules, and embryonic tissues. In the case of AtACT1 and AtACT3, their expression is observed in all organ primordia and mature pollen. AtACT4 and AtACT12 are specific to mature pollen and young vascular tissue, whereas AtACT11 is highly expressed in the ovule, embryo, and endosperm [25]. Moreover, AtACT2 and AtACT8 are active in a wide range of vegetative tissues [24,26,27], while the misexpression of AtACT1 led to stunted plant growth and changes in organ shape [28]. Furthermore, the double mutation of vegetative genes AtACT2 and AtACT8 (act2/8) was associated with larger leaf size and increased ploidy in mature leaves, while Suppressing AtACT2 and AtACT8 caused roots to be completely devoid of hairs [29,30]. In addition, a recent investigation reported that the cotton (Gossypium hirsutum) possesses 16 actin gene family members, exhibiting differential expression across various organs, which was determined through real-time PCR and RNA gel blot analysis [31].
Allotetraploid Brassica napus (AnAnCnCn, 2n = 38) is one of the crucial oil crops, which possesses a high economic and appreciatory value [32,33,34]. B. napus evolved from the hybridization event between Brassica rapa (ArAr, 2n = 20) and Brassica oleracea (CoCo, 2n = 18), accompanied by chromosome doubling nearly 7500 years back [35,36,37]. Brassica species, members of the Brassica genus and the Brassicaceae family, serve as an excellent model for investigating the evolution of polyploid genomes, as well as the processes of gene duplication, gene loss, gene emergence, and modification of gene functions [32,38,39]. Beyond supplying high-quality oil that contains minimal saturated fatty acids and cholesterol while being rich in microelements, it also contributes to the production of animal feed and the generation of biodiesel [40]. In the context of the rapid progress in high-throughput genomic sequencing, the accessibility of genome sequences for B. napus, B. oleracea, and B. rapa has presented a unique chance to discover and define pivotal genes on a genomic scale.
Up to now, although the biological roles and regulatory dynamics of ACTINs have been investigated in several higher plants, they have yet to be understood in B. napus. In this research, a total of 69, 37, and 31 ACTIN genes were identified in allotetraploid B. napus and its diploid progenitors (B. oleracea, B. rapa), respectively. Additionally, this study conducted a comprehensive analysis of ACTINs in rapeseed, encompassing molecular properties, evolutionary relationships, expression patterns, and possible influences on key agronomic traits. In a word, the findings of the study provided a deeper insight into BnACTIN genes, establishing a foundation for forthcoming investigations into gene function and genetic improvement.

2. Results

2.1. Genome-Wide Characterization of ACTIN Genes in B. napus and Its Diploid Progenitors

The ACTIN domain annotation file (PF00022) sourced from the Pfam database was employed as a query to search for UBC family members within the B. napus protein dataset. Moreover, assumed BnACTIN peptides, which exhibited matches to AtACTINs through BLAST, underwent additional verification for ACTIN domain existence by searching in the Pfam, SMART, and CDD repositories. A total of 69 BnACTIN family members were discovered within the B. napus proteome, which was listed in Supplementary Table S1 for details. BnACTIN full-length transcripts vary in length from 825 bp to 3296 bp, with the corresponding protein sequences extending from 275 aa to 993 aa. Moreover, among the deduced 69 BnACTIN proteins, the molecular weight (MW) estimates range from a low of 30.28 kDa to a high of 112.57 kDa. Concurrently, their hydropathy (GRAVY) indices and isoelectric points (pIs) extend from −0.74 to 0.078 and from 4.64 to 9.35, respectively (Supplementary Table S1). Additionally, 54 out of the 69 BnACTIN proteins exhibited an instability index below 39, categorizing them as stable proteins. Furthermore, subcellular localization predictions indicated that the majority of BnACTINs, 53 in total, were cytoplasm, while ten were nuclear, five were associated with the cell membrane, and the remaining one was chloroplast. The identification of 31 BraACTINs in B. rapa as well as 37 BolACTINs in B. oleracea was pursued to understand the evolutionary interplay among gene family members in Brassicaceae crops, following the above consistent pipeline (Supplementary Table S2).

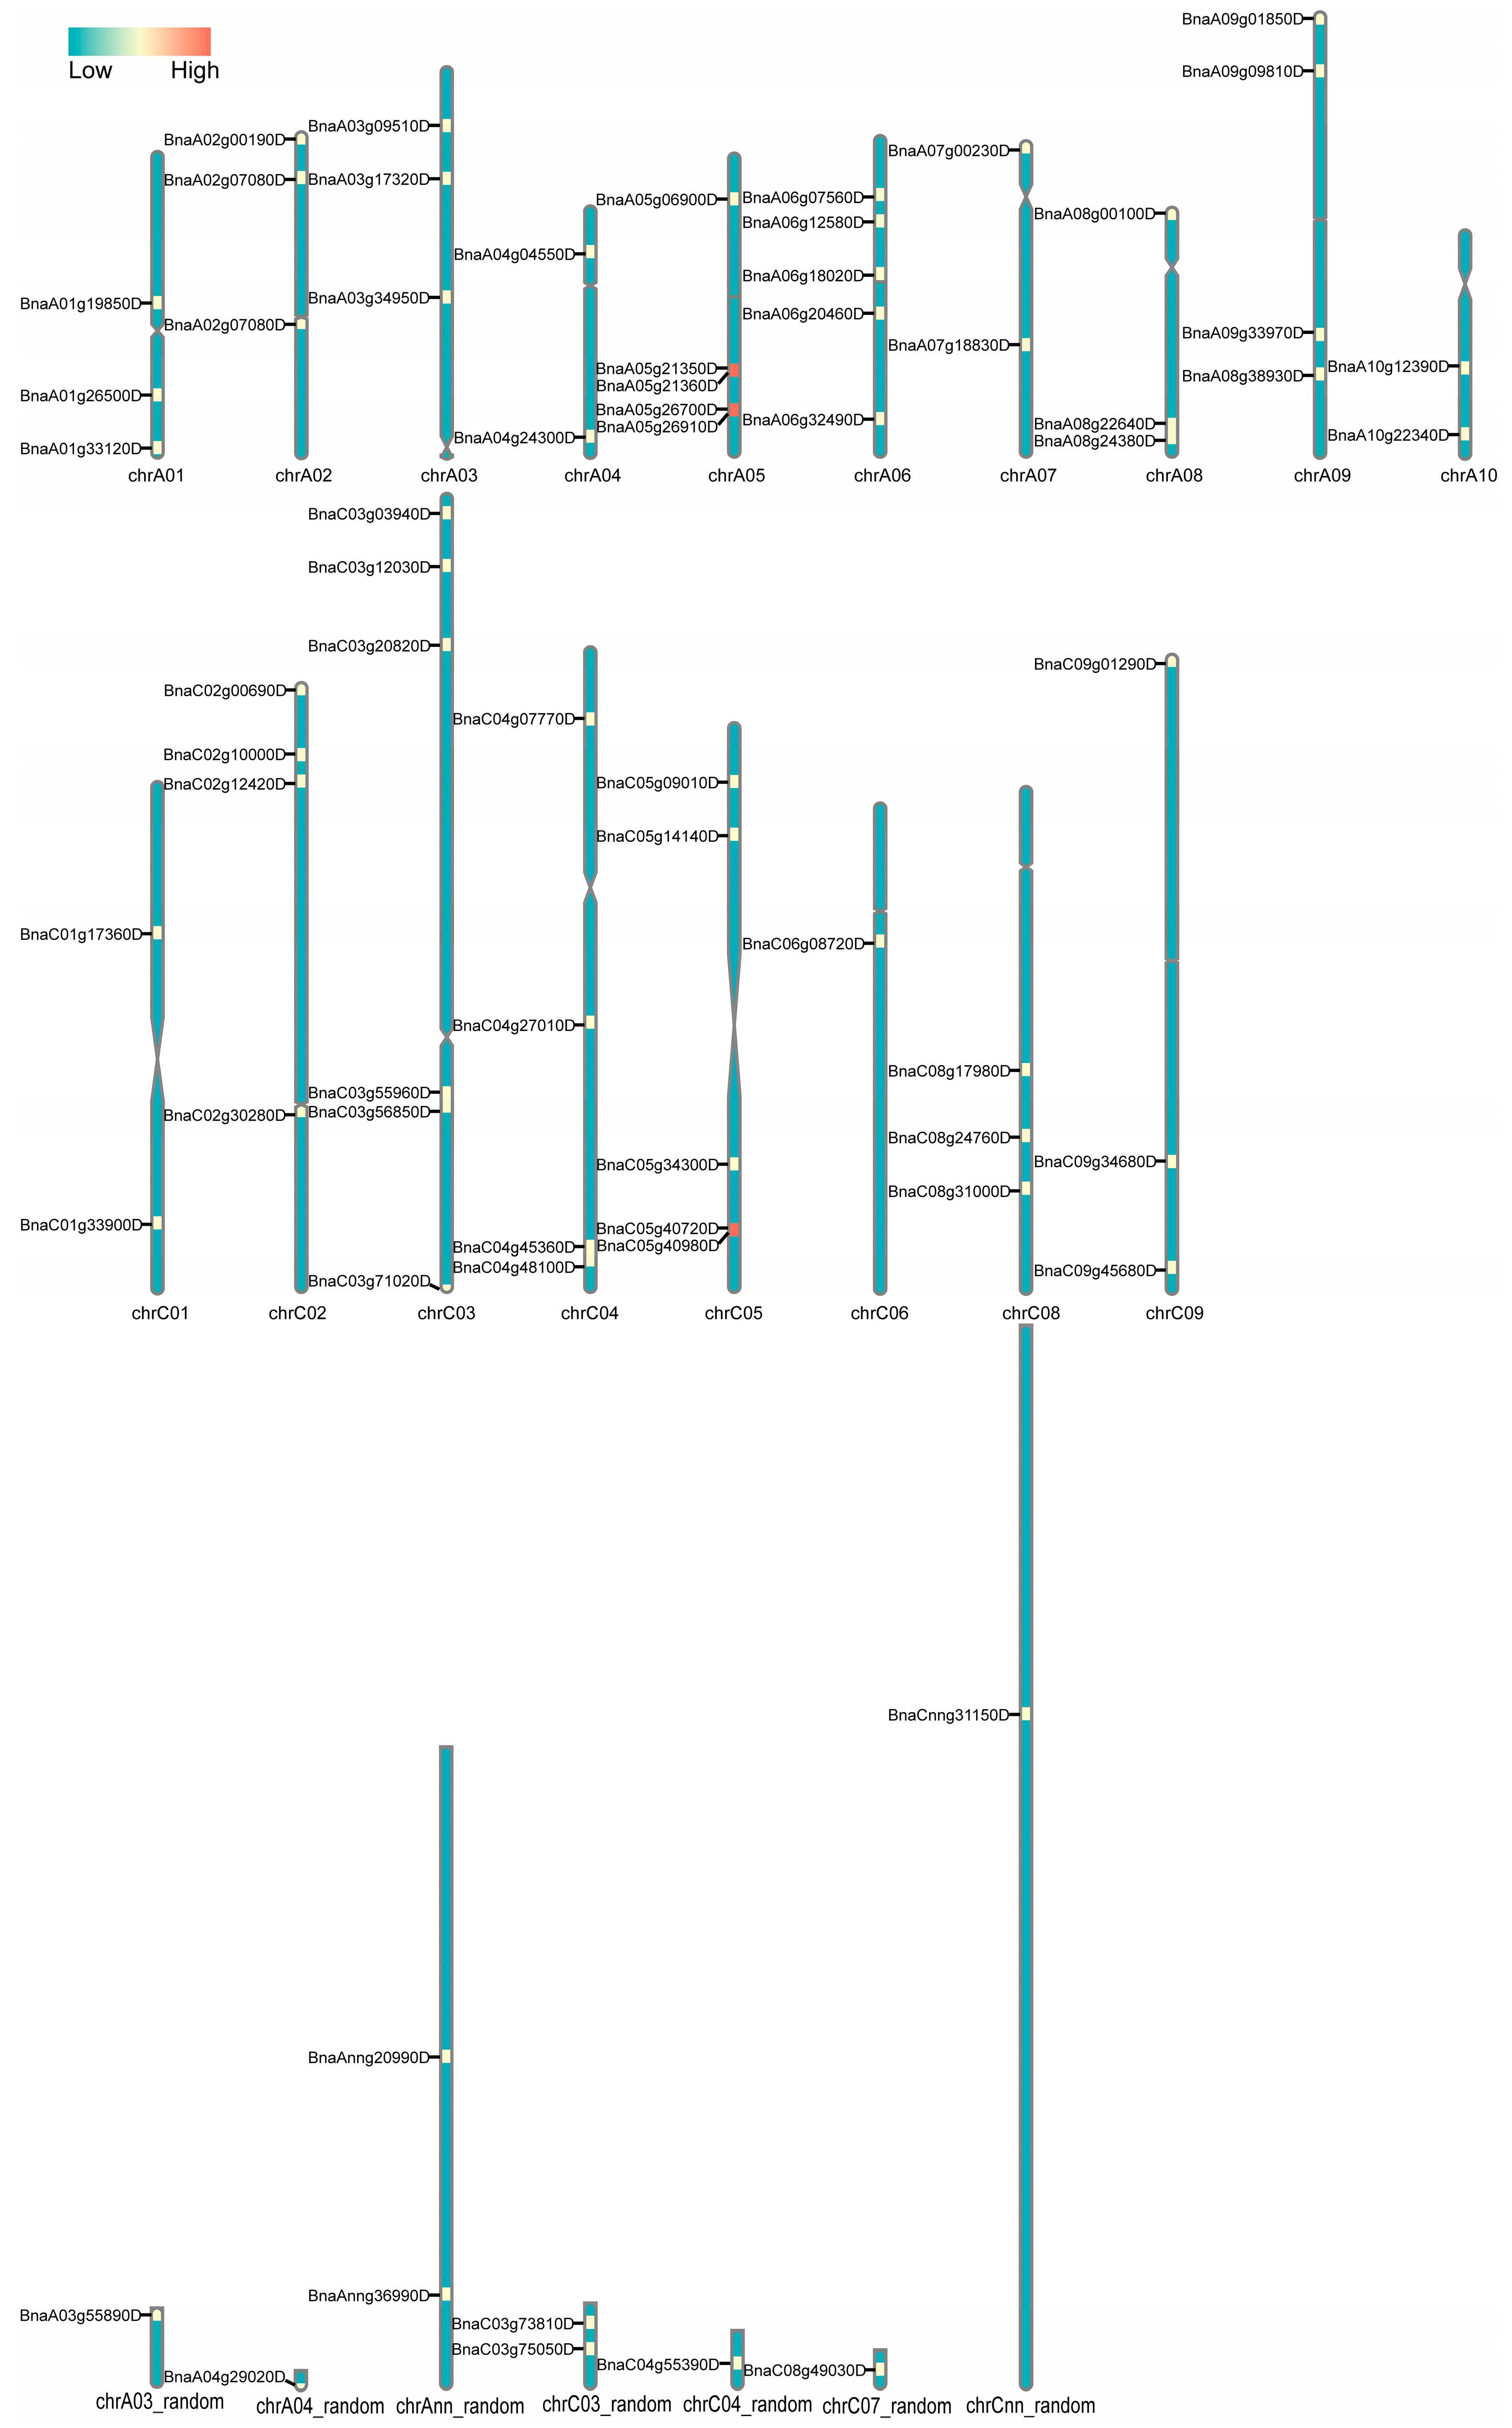
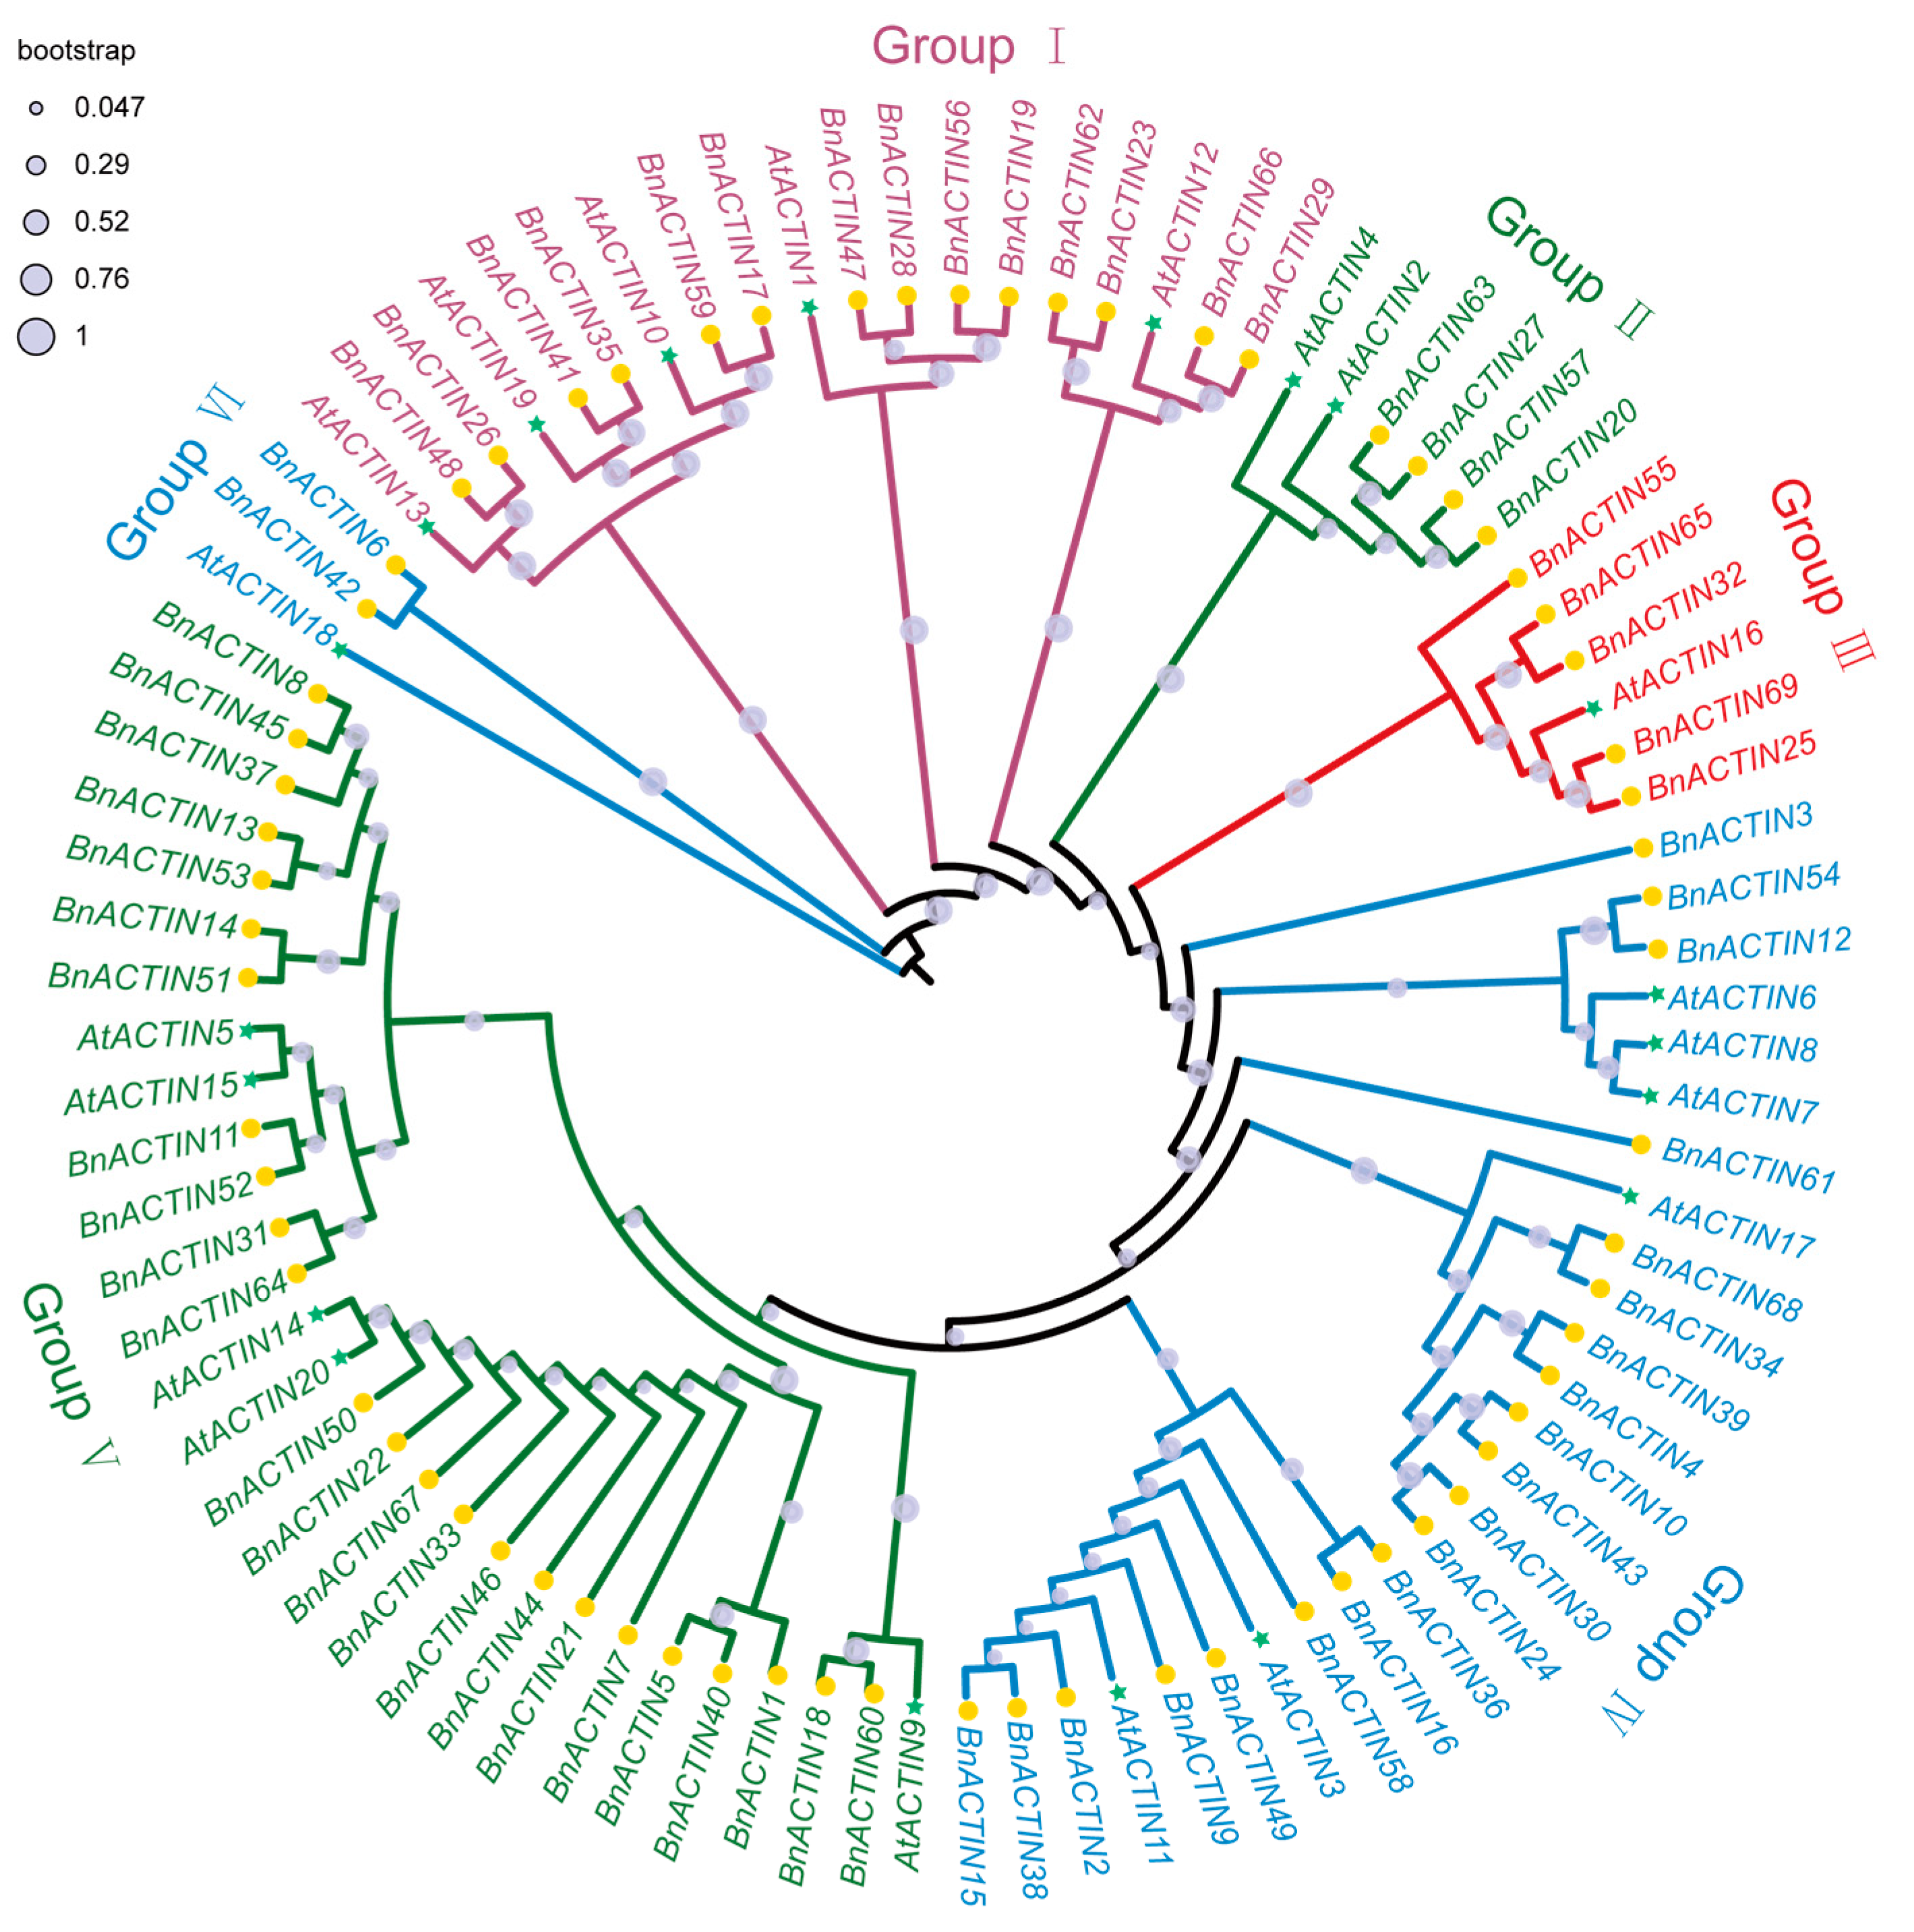
2.2. Chromosomal Localization and Phylogenetic Relationships Insights into BnACTINs

The visual representation of the chromosomal locations for detected BnACTINs was conducted based on their physical positions (Figure 1). The 69 BnACTIN genes exhibited an uneven distribution across the 19 chromosomes, with 36 genes in the An subgenome and 33 in the Cn subgenome (Figure 1). Every chromosome possessed at least a single ACTIN gene. On average, the An subgenome contained 3.6 BnACTIN genes per chromosome across its ten chromosomes, with chromosomes A07 and A10 having the fewest (2) and chromosomes A05 and A06 having the highest count (5 each). In the Cn subgenome, the mean count of BnACTINs on each chromosome was 3.7, reaching a minimum of one on chromosome C07_random and peaking on chromosome C03. Therefore, the examination yielded no indication of a biased distribution between the two subgenomes. Additionally, BnACTINs showed an uneven distribution landscape across all chromosomes. The phylogenetic relationships of BnACTIN genes were established by constructing a phylogenetic tree with the NJ method, integrating ACTIN proteins from A. thaliana [22]. 69 BnACTINs were categorized into six groups (Ⅰ–Ⅵ), predicted by their homologous relationship with AtACTINs (Figure 2). Among the six clusters, there was a marked variation in the number of genes, with cluster Ⅴ containing the highest (24), while cluster Ⅵ the lowest (2).

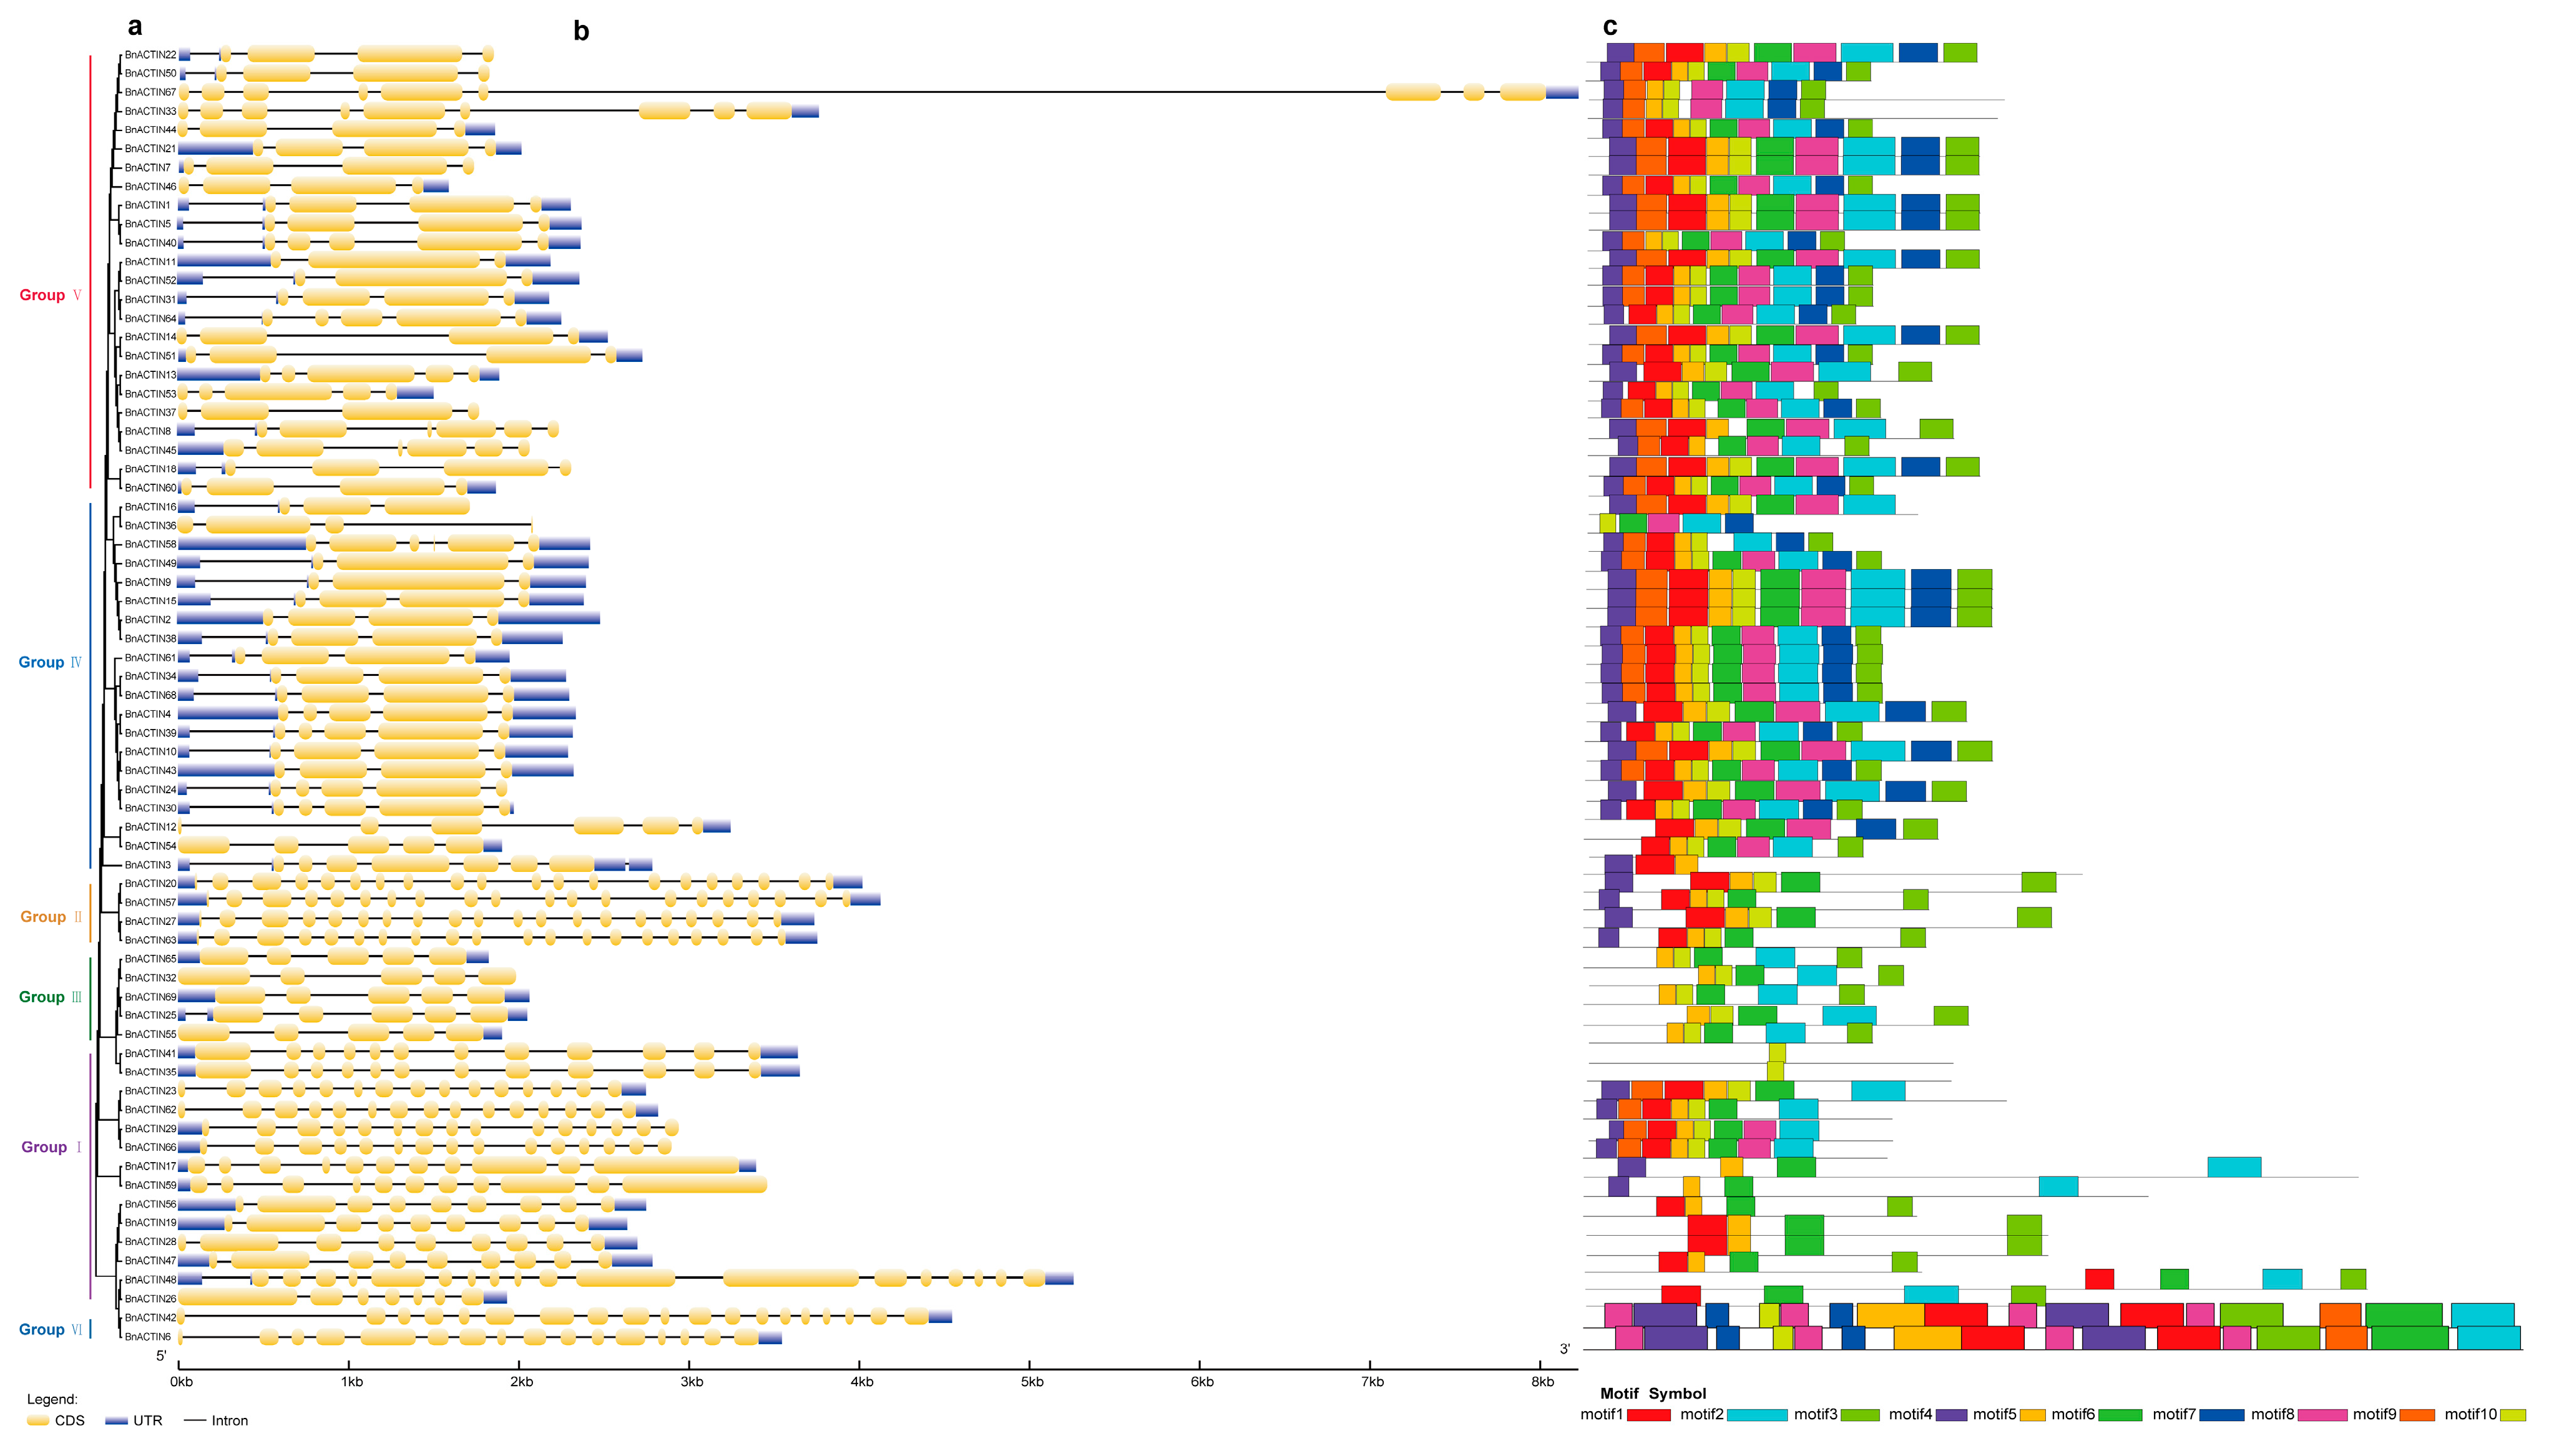
2.3. Deciphering the Molecular Architecture of BnACTINs: Gene Structure, Motifs, and Cis-Acting Regulatory Elements

To further elucidate the evolutionary traits of BnACTINs, we conducted a comparison of gene structures, conserved motifs, and cis-acting regulatory elements across the six clades. To investigate the diversity in gene structure among various groups of BnACTINs, a comparison of their intron-exon structures was made in the context of the phylogenetic relationships (Figure 3a, Supplementary Table S3). Each BnACTIN was multiexon, which harbored multiple introns, especially the genes in Group Ⅱ (BnACTIN20, BnACTIN27, BnACTIN57, BnACTIN63) possessed the greatest number of exons and introns, while members in Group Ⅳ contained a relatively low number of exons (Figure 3b). Furthermore, the number of exons in BnACTINs exhibited considerable variation among different subfamilies, with counts ranging from 3 to 20. Also, inaccurate annotation led to the absence of untranslated regions (UTRs) at both or one end in 28 of 69 BnACTINs. Nonetheless, members within the same subfamily commonly displayed similar intron-exon organization patterns (Figure 3b). For instance, genes in Group Ⅱ typically had two exons, in contrast to Group Ⅲ, which generally contained five exons. Consequently, the distribution of introns and exons offered crucial evidence for understanding the phylogenetic connections among the members of this gene family. In addition, a total of 10 conserved motifs were discovered within the 69 BnACTINs, visualized in Figure 3c. Ranging in length from 21 to 50 aa, the ten conserved motifs were dominated by the highest occurrence of motifs 5 and 6. To explore the potential functional characteristics of motifs, their sequences were searched in InterPro and CDD databases. All the motifs showed notable matches to the ACTIN domain (pfam00022) upon searching against the CDD database. Furthermore, motifs 1–8 exhibited a significant hit with ATPase, which is a nucleotide-binding domain, according to the search in the InterPro database. Distinct subfamilies exhibited variation in motif composition, yet a conserved pattern of motif distribution within the same subcategory underscored their phylogenetic ties and potential functions. Also, the examination of BnACTIN proteins led to the detection and refinement of three key structural properties (Supplementary Figure S1).
As is well-known, the presence of Cis-elements in the promoter regions can modulate the gene expression [41,42]. Hence, the promoters of BnACTINs were investigated utilizing PlantCARE (Supplementary Table S4) [43]. In total, 93 functional cis-elements were found within the promoter regions of BnACTINs (Supplementary Figure S2, Supplementary Table S5). Moreover, all BnACTINs exhibited the presence of either TATA-box or CAAT-box elements, standard components of eukaryotic promoters. Moreover, many of these elements were associated with light response and abscisic acid response and were essential for anaerobic induction. MYC element existed in promoter regions of 66 BnACTINs, which have noteworthy impacts on plant growth, seed yield, and protein content development [44]. MYB elements, which were detected in 65 of 69 BnACTINs, are widely present in higher plants and are pivotal in the stress resistance response [45]. The ARE element, which is a cis-acting regulatory element essential for anaerobic induction, was also identified within 65 of 69 BnACTINs. Furthermore, multiple BnACTIN promoter regions possessed elements related to light response, including Box 4 (a component of a preserved DNA unit responsible for light sensitivity), GT1-motif (light responsive element), G-box (cis-acting regulatory element involved in light responsiveness), TCT-motif (element of a light-reactive motif). In addition, the presence of stress-related elements, such as MBS (MYB binding site involved in drought-inducibility), ABRE (cis-acting element involved in the abscisic acid responsiveness) and TGACG-motif (cis-acting regulatory element involved in the MeJA-responsiveness), were also detected in BnACTINs promoter regions, implying a significant role for BnACTINs in plant development, growth, and stress responses (Supplementary Figure S2, Supplementary Table S5).

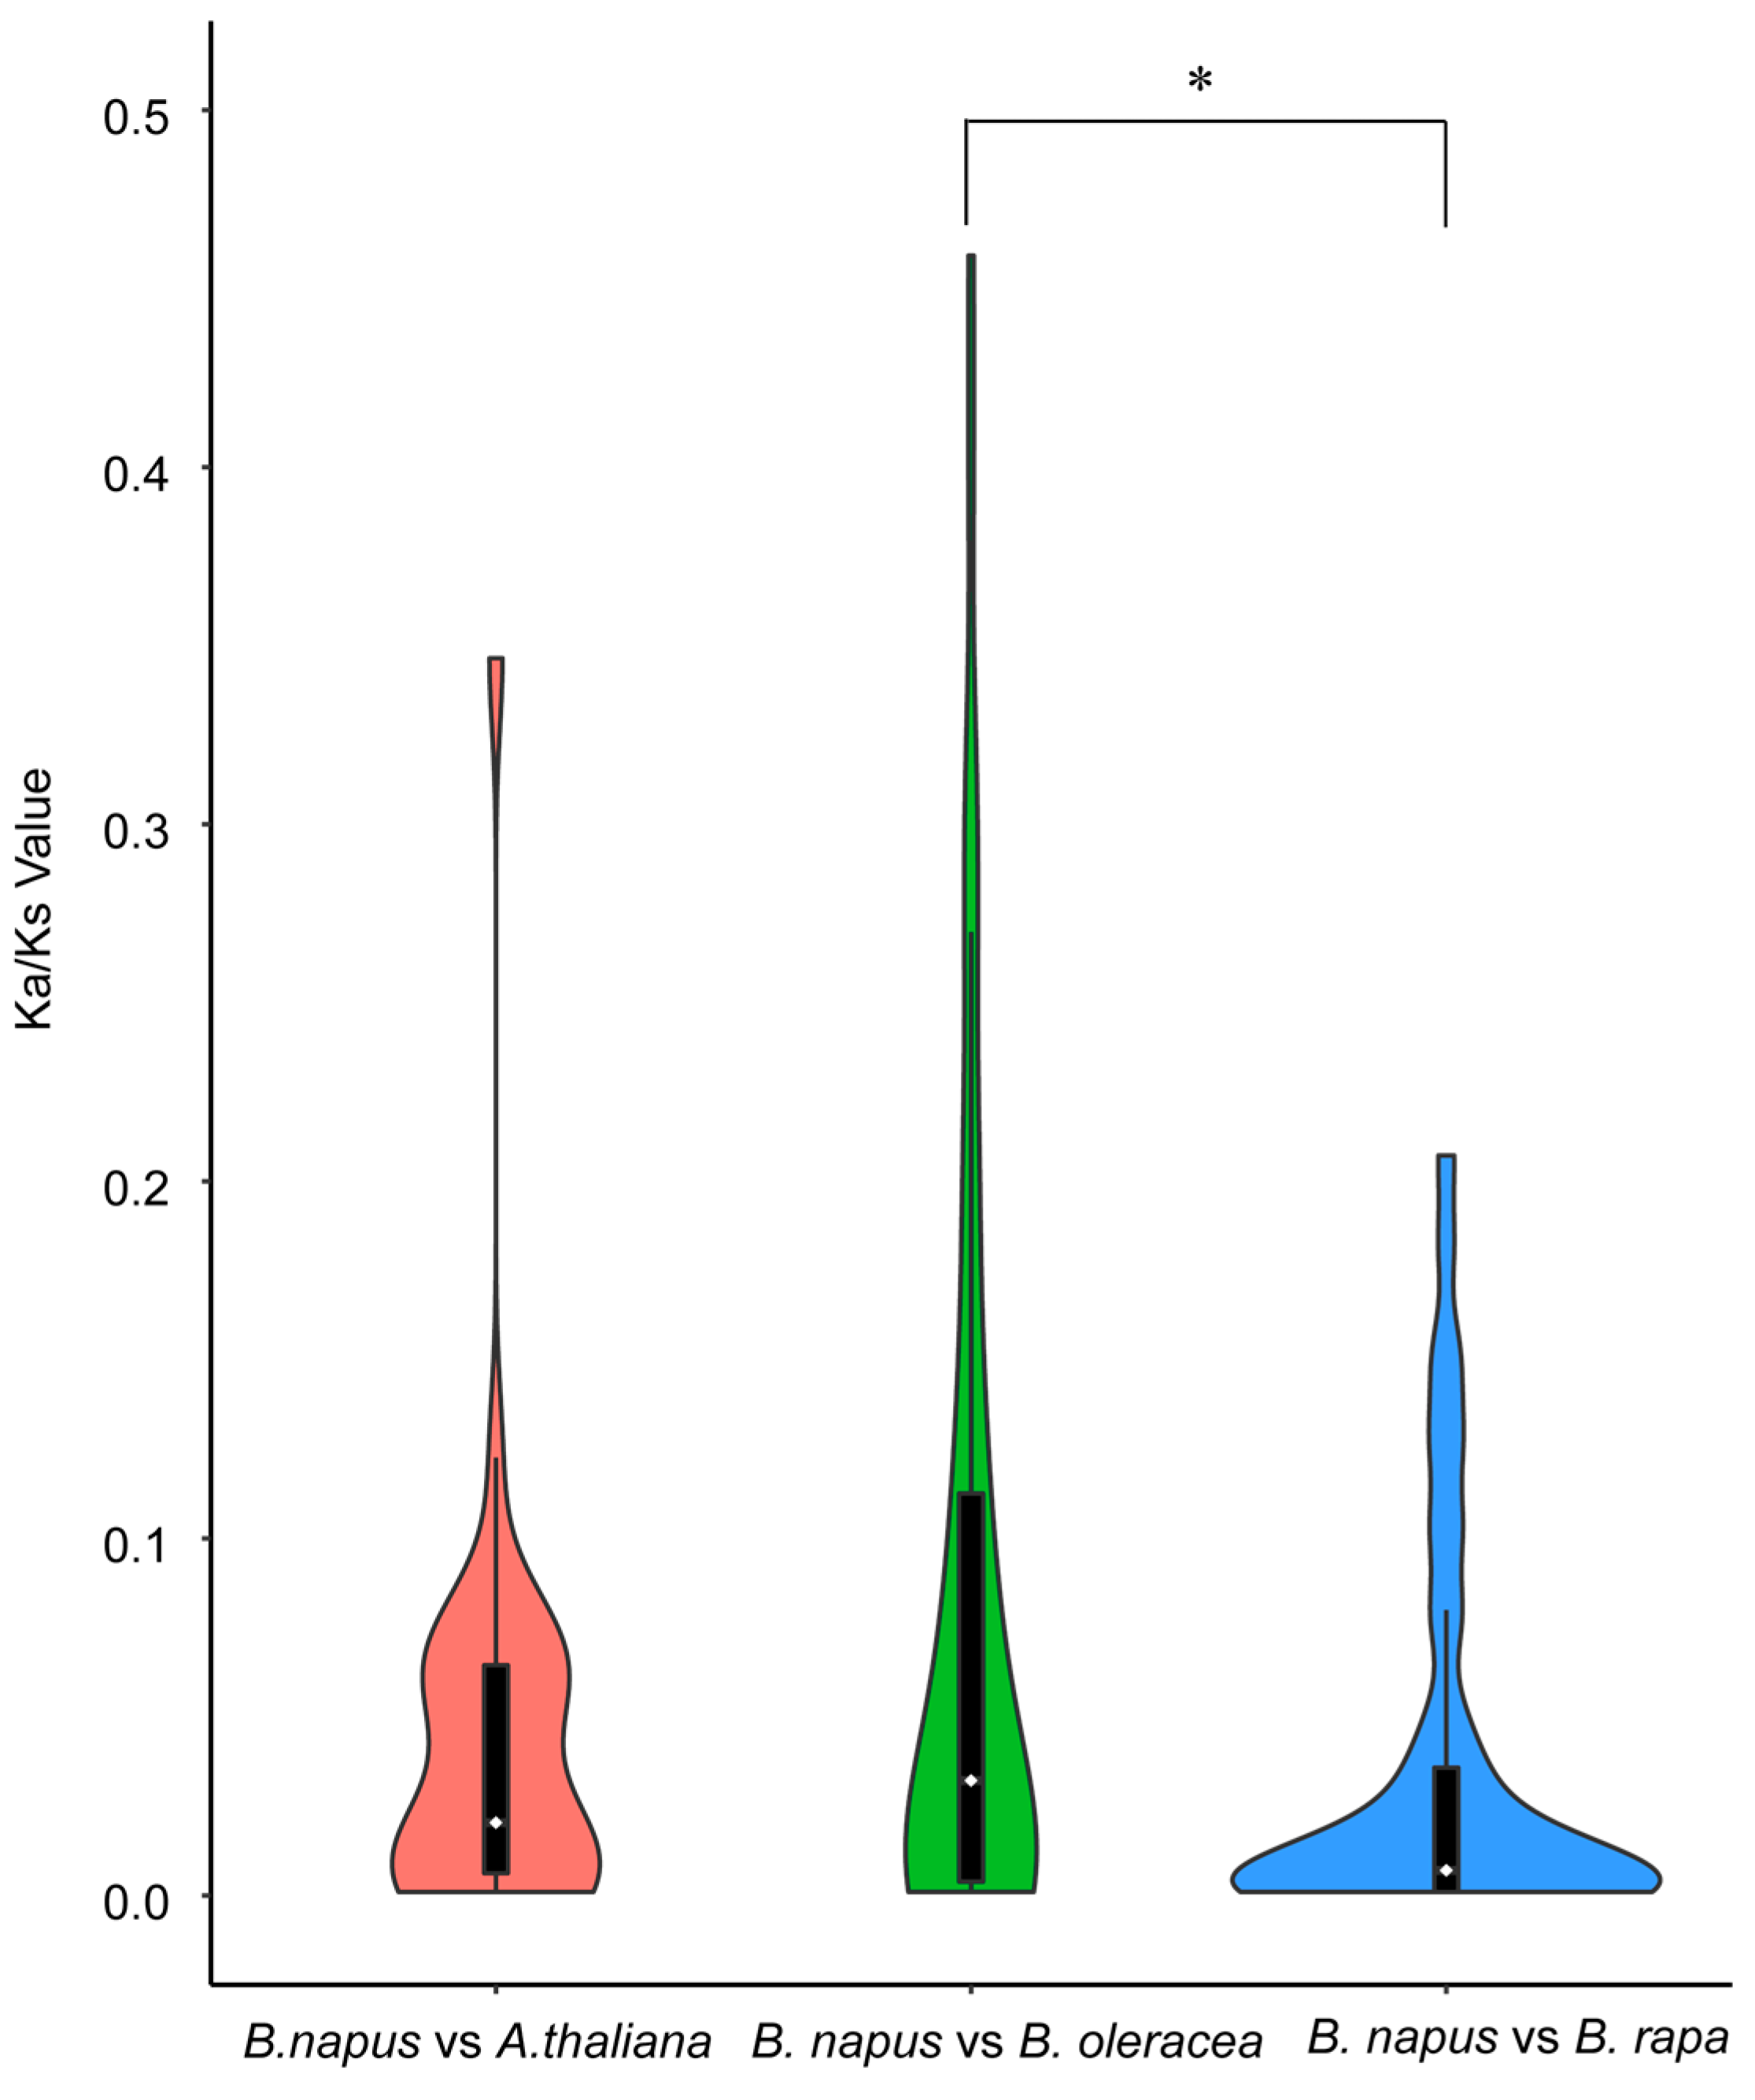
2.4. Syntenic Relationships and Gene Duplication of ACTIN Families

Syntenic analysis was conducted on the protein sequences of detected ACTIN genes across the three species to assess the impact of polyploidization events on the evolution of Brassica genomes and the ACTIN gene family. From the results, 91, 21, 37, and 37 paralogous ACTIN gene pairs were detected within B. napus, A. thaliana, B. oleracea and B. rapa, respectively (Figure 4a,e). Among the 91 paralogous ACTIN pairs in B. napus, 19 pairs were found located in the An subgenome and 11 in the Cn subgenome, with the remaining 61 pairs spanning both two subgenomes. These paralogous gene pairs were categorized into five distinct types: proximal, tandem, WGD (Whole Genome Duplication), dispersed, and transposed (Table 1, Supplementary Table S6). 67 BnACTINs, constituting 97.1% of the total, originated from gene duplication events, driven primarily by WGD (87.9%) and transposition events (12.1%), being the key factors in the family’s enlargement (Table 1, Supplementary Table S6). With regard to the other two Brassica species, the progenitors of B. napus, ACTIN gene family expansion is predominantly driven by the process of WGD as well (Table 1, Supplementary Table S6).
Syntenic genes, which are orthologous, are situated in syntenic fragments across different species and trace back to a common ancestor. The synteny analysis revealed that a total of 62 BnACTINs exhibited collinearity in homoeologous genomic regions with their ancestors (A. thaliana, B. rapa, and B.oleracea). Between B. napus and B. oleracea, 57 orthologous gene pairs were discovered, with 53 identified between B. napus and B. rapa and 30 between B. napus and A. thaliana (Figure 4b–d, Supplementary Table S7). The majority of BnACTINs could trace their lineage back to their ancestors. After diverging from A. thaliana, the Brassica genomes were subjected to an additional round of whole-genome triplication, so in the absence of gene loss, a solitary A. thaliana gene would be represented by six copies in B. napus as well as three copies in B. oleracea and B. rapa. [46]. According to the results, no AtUBC was inherited as whole six copies in B. napus, whereas a total of six AtUBCs retained three whole copies in B. rapa and B.oleracea, indicating that considerable gene loss happened as a part of the polyploid formation (Supplementary Table S7). Additionally, assessing the selection pressure on BnACTINs involved computing the Ka/Ks ratios of BnACTINs paralogous gene pairs as well as their orthologous counterparts to BraACTINs, BolACTINs, and AtACTINs. Typically, a Ka/Ks ratio exceeding one indicates positive selection, a ratio of exactly one suggests neutral selection, and a ratio less than one denotes purifying selection [47]. Among BnACTIN paralogous gene pairs, all Ka/Ks ratios were below one, indicating that these genes were under the influence of robust purifying pressures (Supplementary Table S8). The examination of the Ka/Ks ratios for all orthologous gene pairs revealed a range of 0.001 to 0.818, with a mean of 0.070, suggesting the action of purifying selection (Supplementary Table S9). Orthologous gene pairs between A. thaliana and B. napus are estimated to have diverged approximately 15.2 million years ago, which was consistent with previous reports [48]. As B. napus and its progenitors, the estimation of selection pressure for their orthologous gene pair was also conducted (Supplementary Table S9). In addition, the values of the Ka/Ks ratio for orthologs between B. napus and B. oleracea were notably greater than those between B. napus and its other progenitor, indicating that BnACTINs inherited from B. rapa underwent heavier purifying selection after the formation of allotetraploid B. napus (Figure 5).

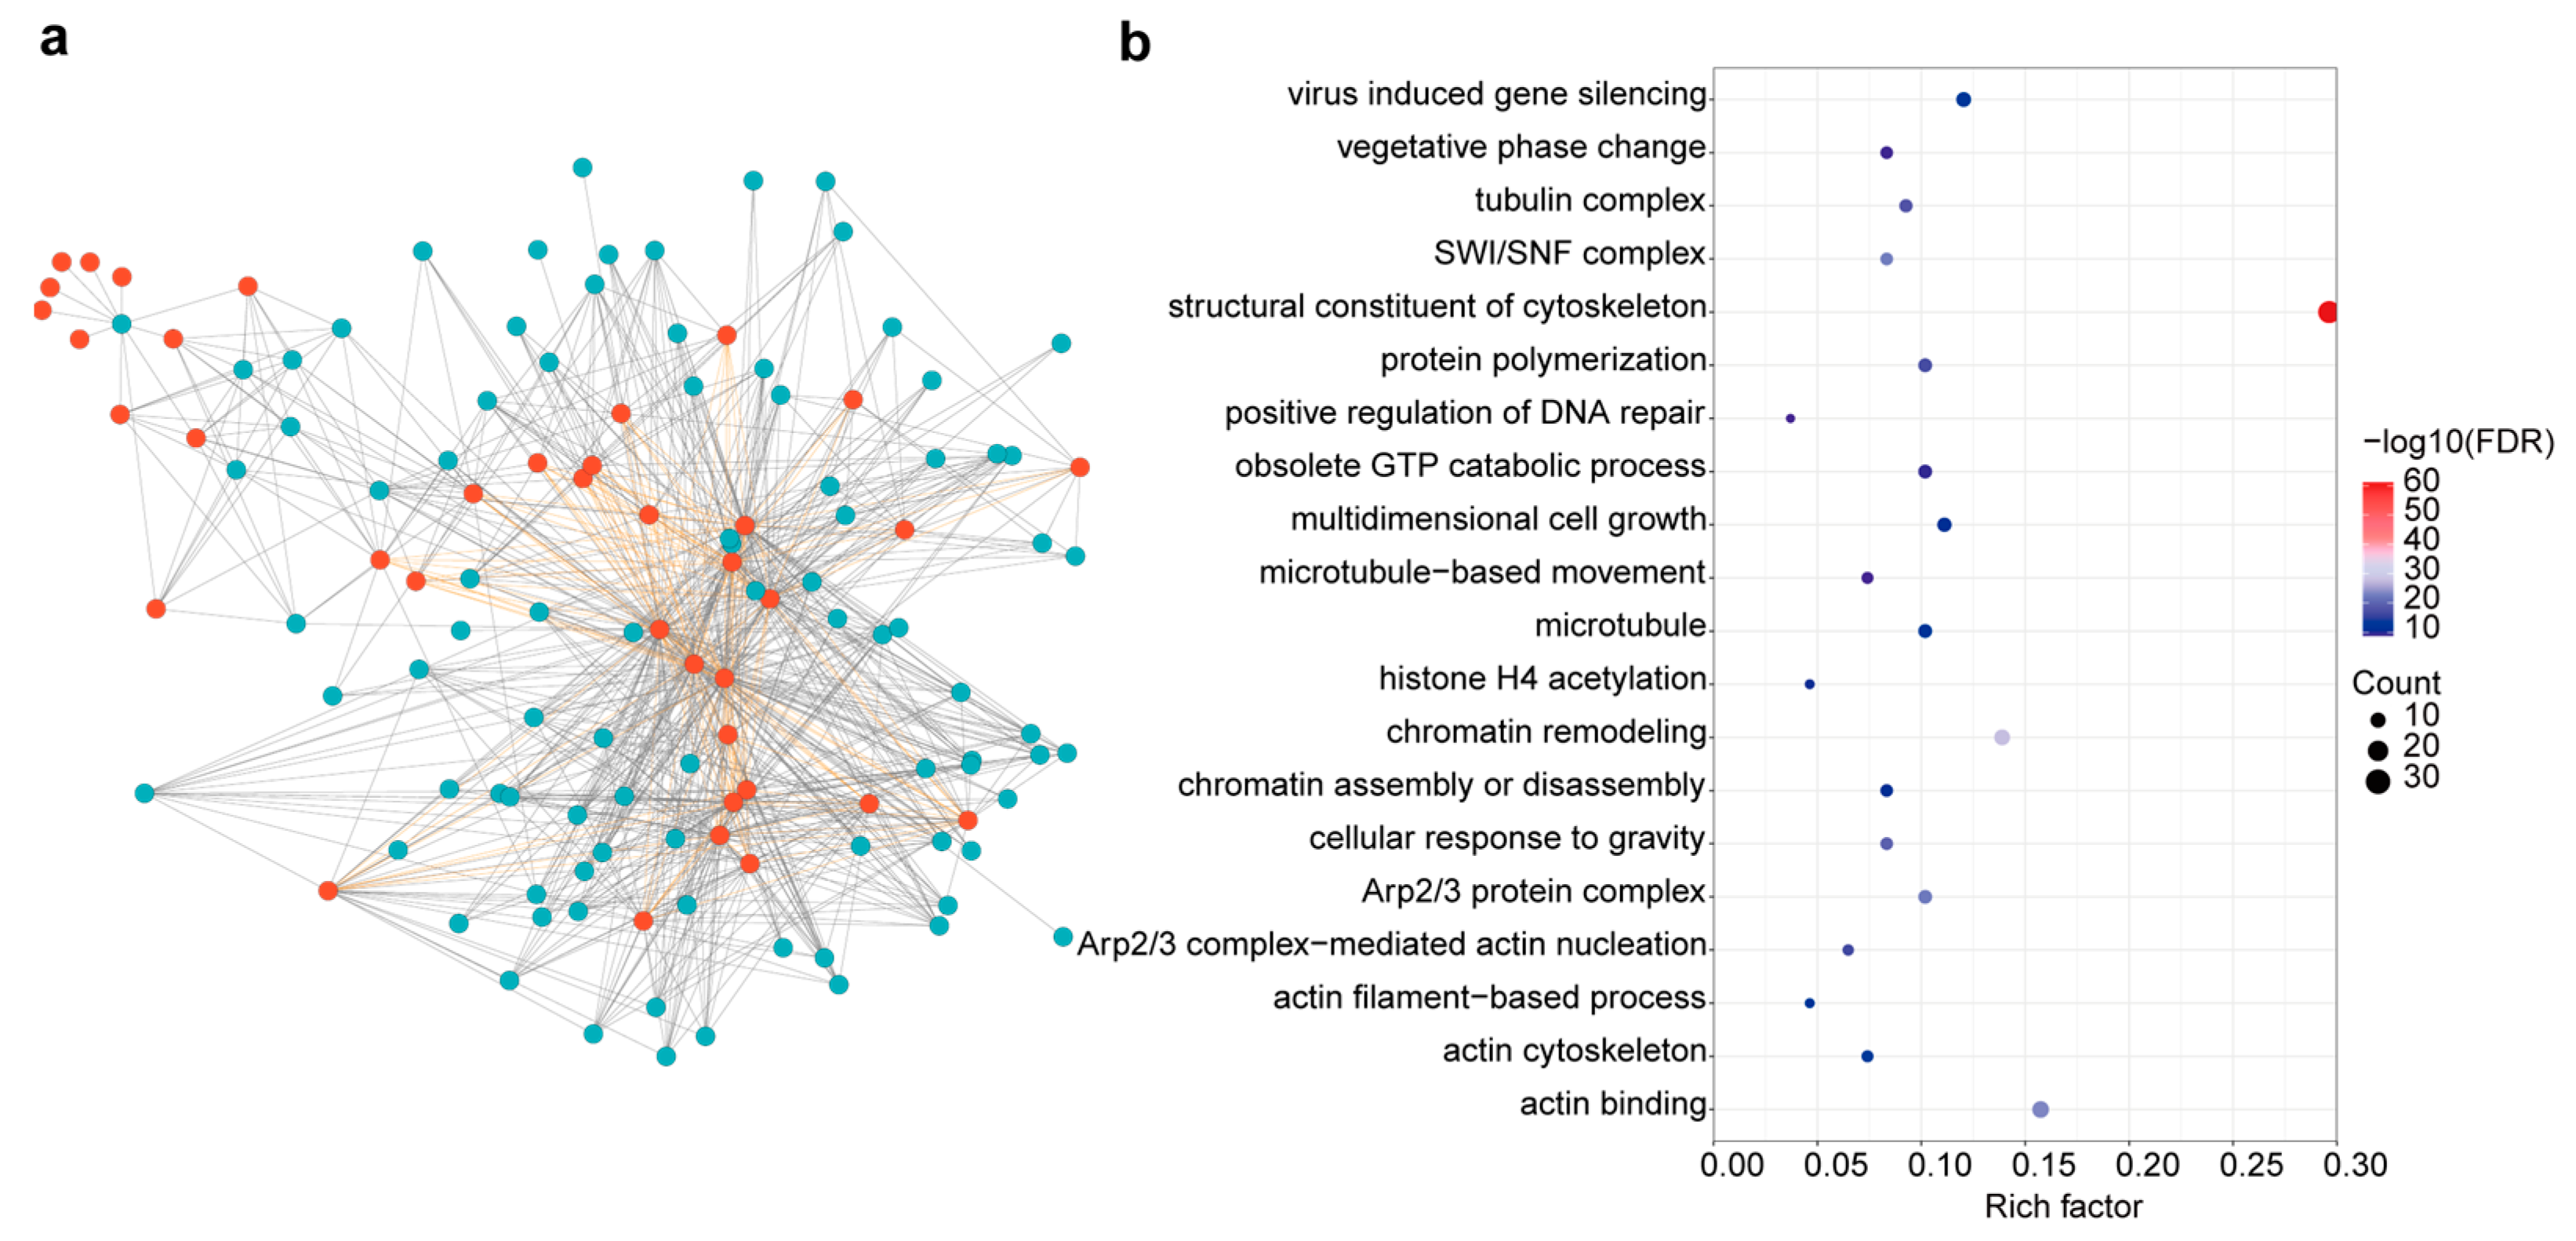
2.5. Predicting Protein Interactions Network and Potential Function of BnACTIN Proteins

To investigate the potential molecular mechanisms and functions of BnACTINs, predicted interaction networks were forecasted based on established protein interactions in A. thaliana. According to the data from the STRING database, 20 AtACTIN proteins interacted with 77 proteins in A. thaliana, which matched 108 orthologs in B. napus (Figure 6a, Supplementary Table S10). BnACTINs could interact with other family members, leading to the formation of heterodimers for involvement in a range of biological processes (Figure 6a,b). Moreover, gene ontology (GO) enrichment analysis was conducted to explore the functional roles of BnACTINs interacted proteins. The results demonstrated that BnACTINs interacted proteins were significantly enriched in a structural constituent of the cytoskeleton, chromatin remodeling, actin binding [49], cellular component (SWI/SNF complex [50], Arp2/3 protein complex [51,52]), cellular response to gravity and vegetative phase change (Figure 6b, Supplementary Table S11). Therefore, our analysis results suggested that BnACTINs might play an important role in plant development and stress response via interacting with proteins associated with these functions.
Additionally, GO enrichment analysis among BnACTINs was conducted to investigate their potential biological functions. The Gene Ontology (GO) terms were categorized into three main groups: molecular functions (MF), biological processes (BP), and cellular components (CC). The functions of most BnACTINs were significantly enriched in the biological processes category, including proteasomal protein catabolic process, actin cytoskeleton organization, cytoskeleton organization, and so on (Supplementary Figure S3, Supplementary Table S12). Furthermore, the remaining GO terms belonging to biological processes showed a broad relationship with plant vegetative development (vegetative phase change, root hair cell tip growth) as well as stress-induced reactions (response to freezing, response to red light). Moreover, GO cellular component (CC) enrichment (cytoskeleton, Arp2/3 protein complex) highlighted that BnACTINs were predominantly located in the cytoplasm. Furthermore, GO terms structural constituent of the cytoskeleton and glycerol−3−phosphate O−acyltransferase activity indicated the molecular functions of BnACTINs. The findings from the GO enrichment analysis demonstrate that BnACTINs are involved in vegetative growth, cytoskeletal function, and stress response in accordance with earlier studies [11,15,49].

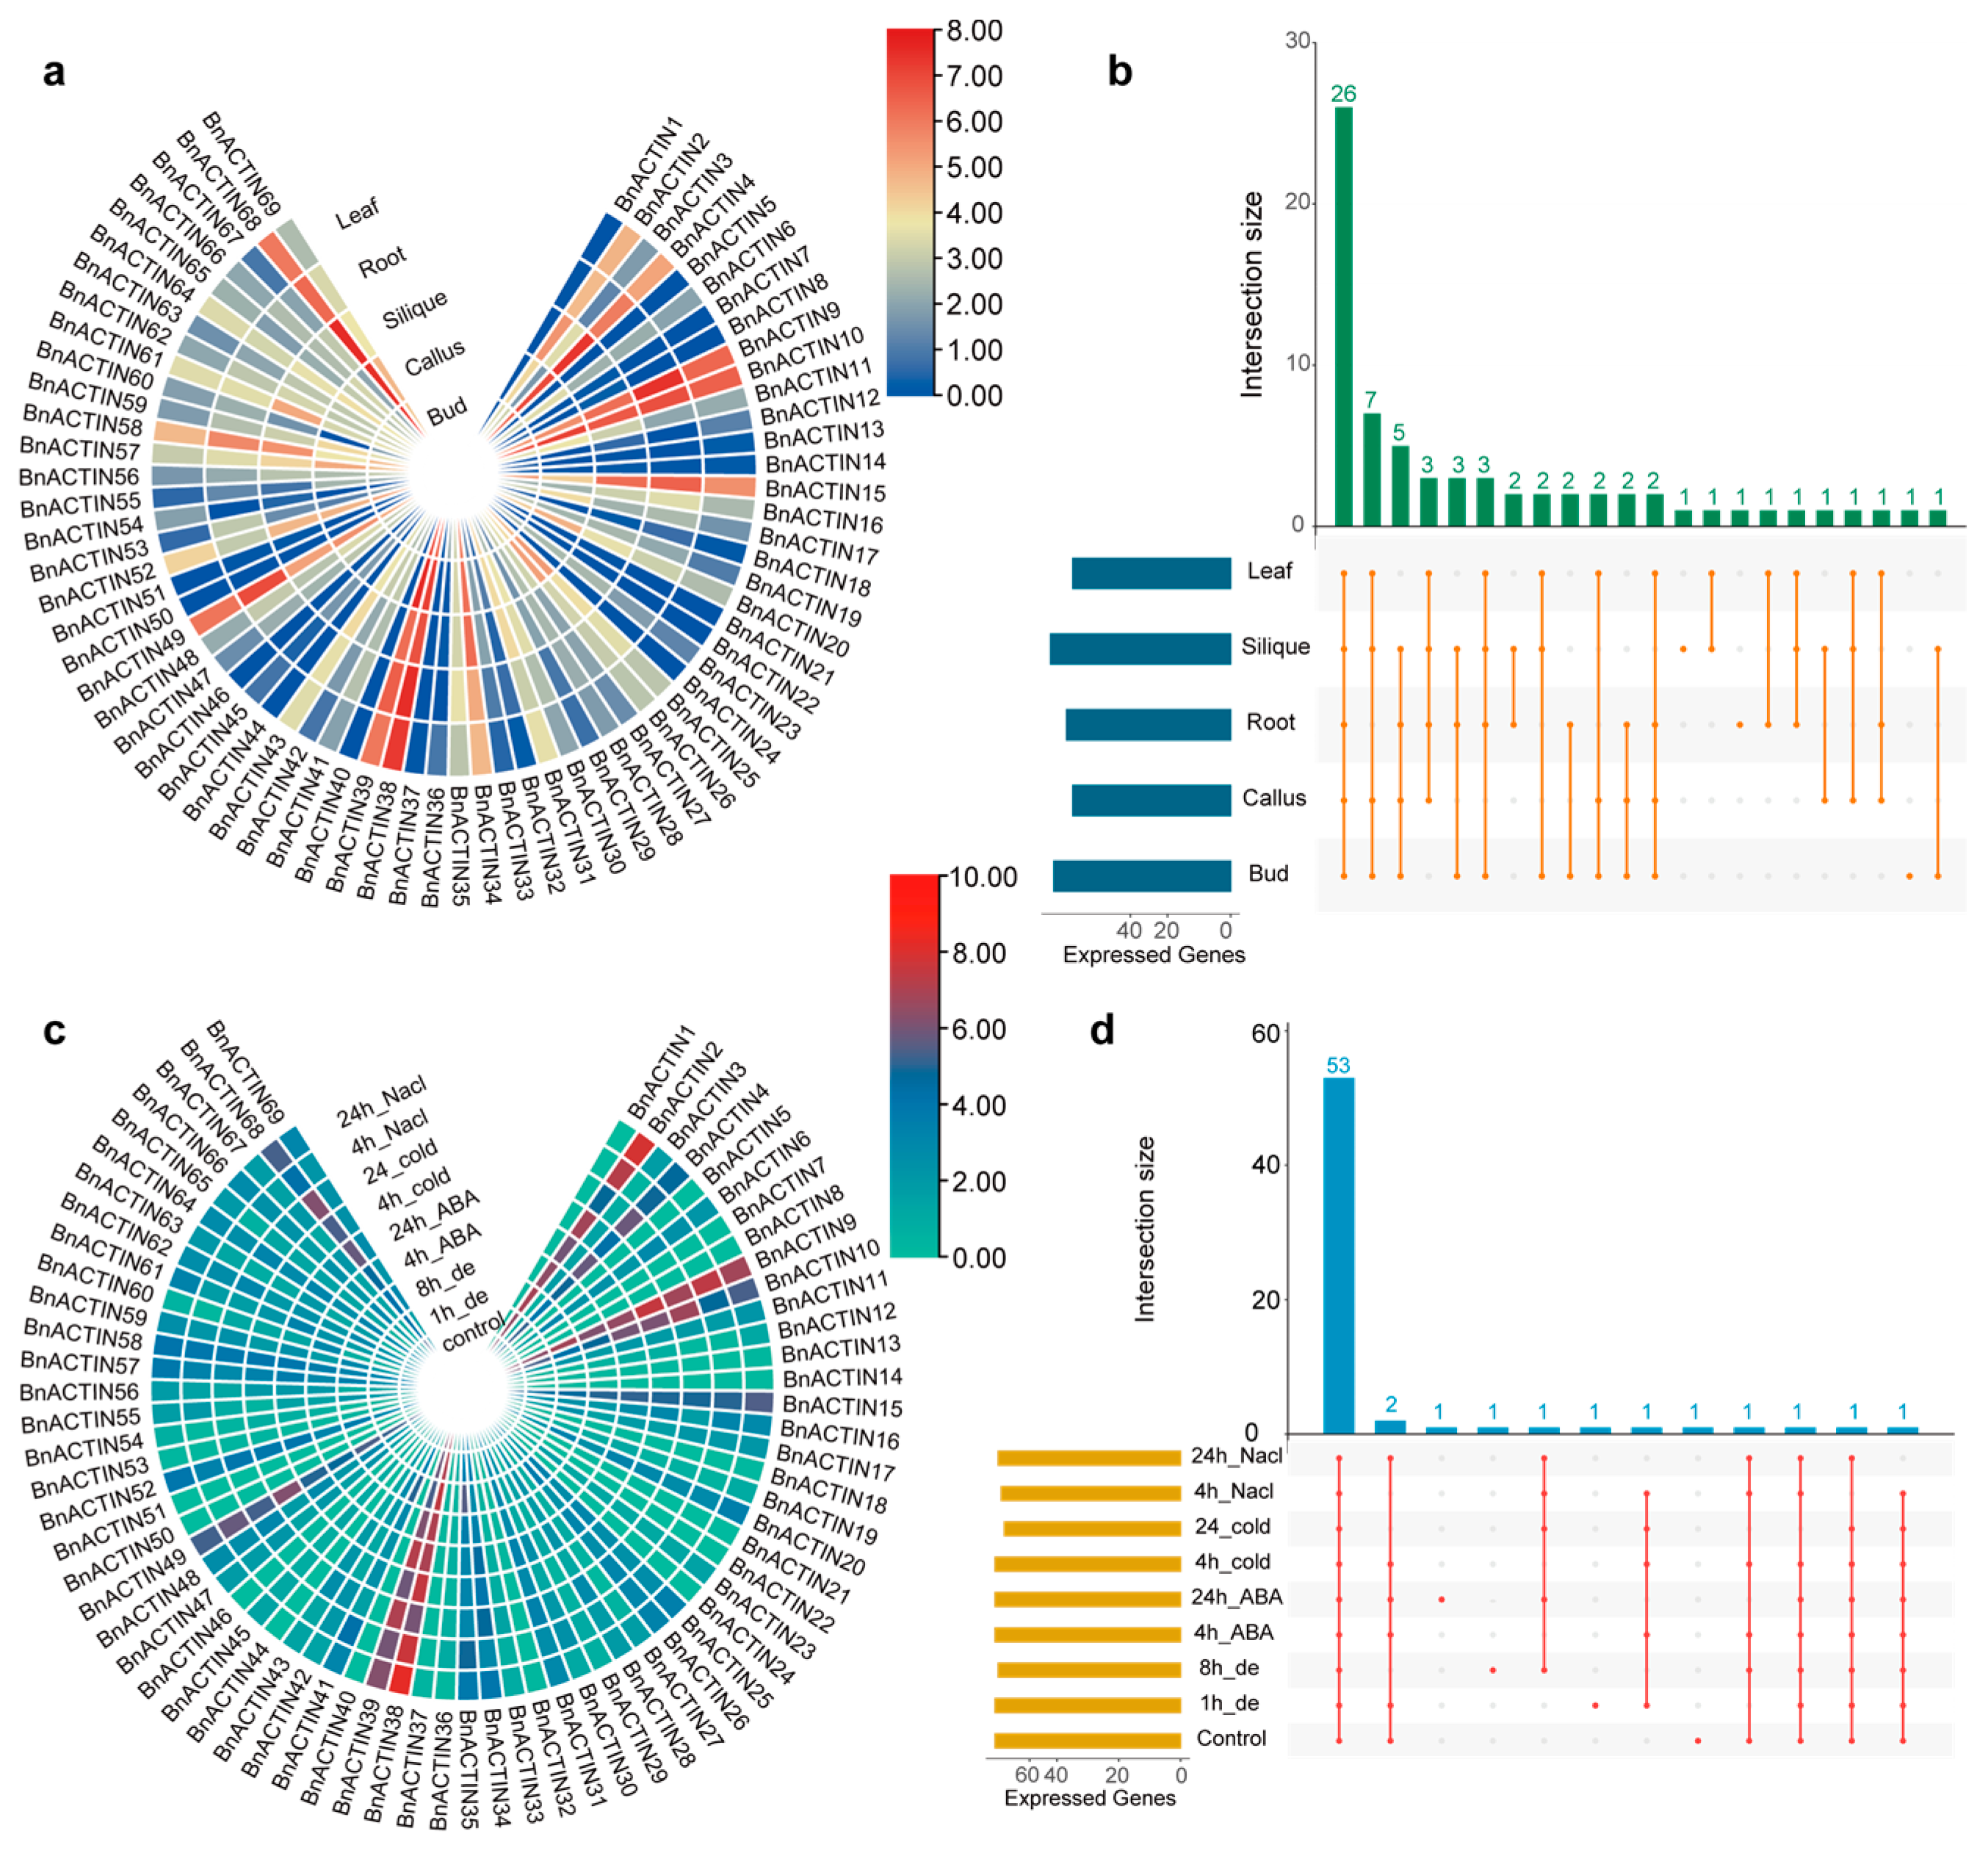
2.6. Insights into BnACTIN Gene Expression Profiling across Different Tissues and Stress Conditions

To explore the potential biological functions and expression patterns of BnACTINs, five tissues (root, leaf, callus, bud, and silique) available RNA-seq data were collected to analyze [53]. In total, 26 BnACTINs were expressed in all the above five tissues, whereas four BnACTINs exhibited expression silence in any tissue (Figure 7b, Supplementary Table S13). Among different tissues, BnACTINs exhibited relatively lower expression levels in the leaf (Figure 7a, Supplementary Table S13). The tissues bud and callus shared analogous expression profiles for the BnACTINs. Moreover, organ-specific expressed BnACTINs showed relatively weak expression levels (FPKM < 1). Some BnACTINs presented tissue-preferential expression patterns, such as BnACTIN9, expressed highest in the root, and BnACTIN4 was observed to be highly expressed in both silique and callus (Figure 7a, Supplementary Table S13). In addition, BnACTIN10 (ortholog of AT5G09810) showed high expression levels across all tissues, suggesting its crucial involvement in plant growth processes.
Beyond examining the expression patterns across various tissues, the expression profiles of BnACTINs under various stress conditions were investigated as well. The RNA-seq data of samples under several abiotic treatments (ABA, cold, dehydration, and salinity) were obtained from public studies [54]. In response to various abiotic stresses, the expression levels of the majority of BnACTINs were up-regulated, excluding those expressing silent or weak genes (Figure 7c, Supplementary Table S14). Moreover, a total of 53 BnACTINs were expressed under all stress conditions (Figure 7d). Notably, the expression levels of BnACTIN35 increased under all treatments, and a subset of genes (BnACTIN2, BnACTIN9, BnACTIN35, BnACTIN38, BnACTIN55) displayed enhanced expression in response to NaCl stress. Strikingly, BnACTIN64 was solitary among BnACTINs that experienced expression down-regulation under each abiotic stress condition.

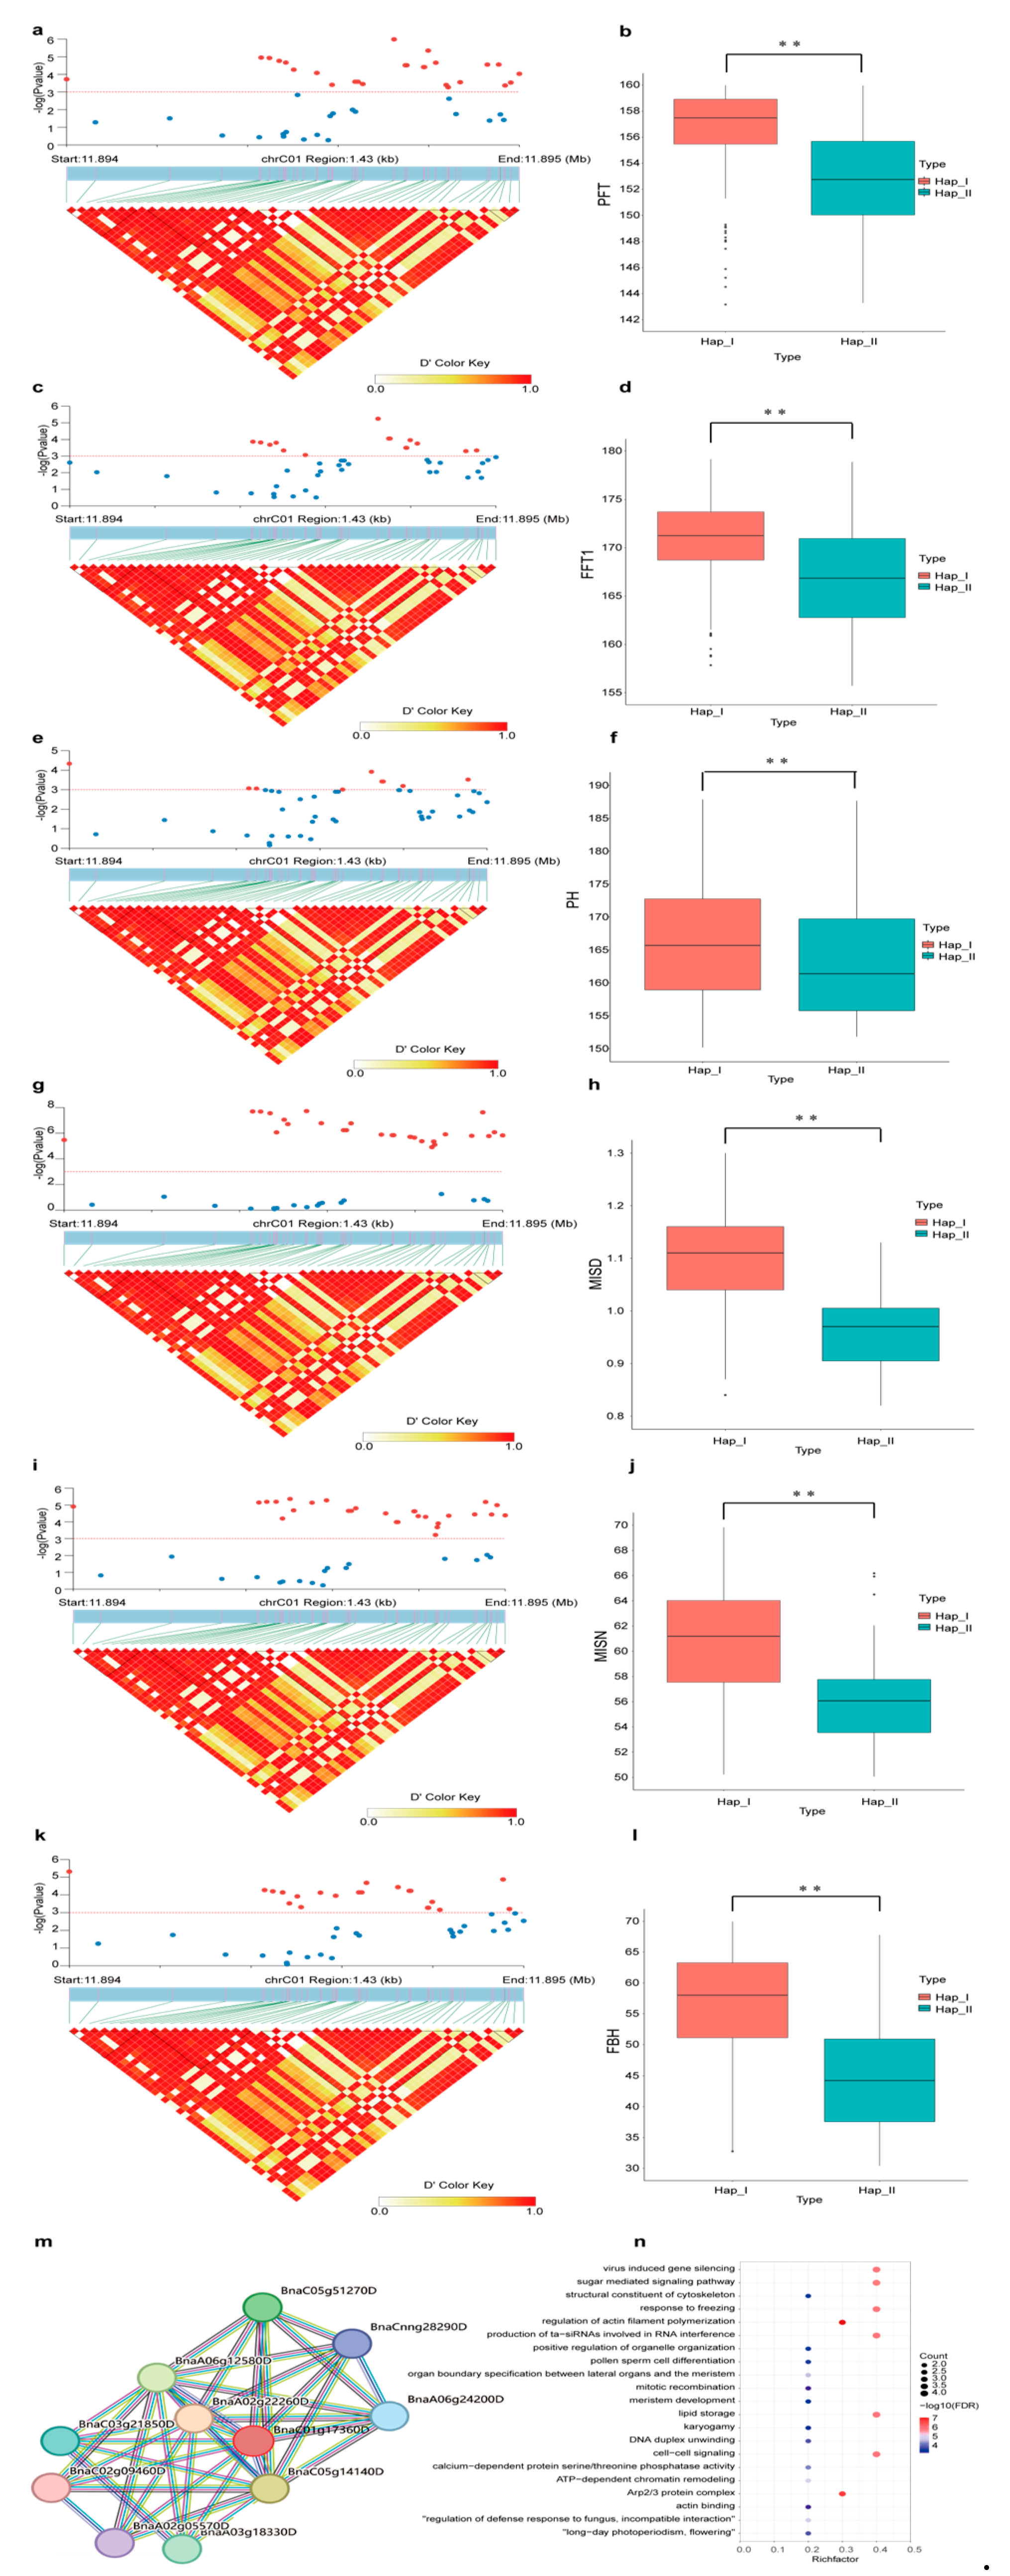
2.7. Genetic Effects of BnACTIN Genes on Agronomic Traits

In order to examine the genetic diversity of BnACTINs, SNPs were detected in a global natural population comprising 324 accessions (Supplementary Table S15) [55]. In total, 3096 SNPs were identified in BnACTINs, with each gene possessing 48 SNPs on average, which exceeded the whole genome-wide frequency (36 SNPs per gene). According to the annotation analysis, among SNPs in B. napus, 1080 (10.637%) out of them were located in exons, and 1097 SNPs comprising 198 missense mutations, six nonsense mutations, and 893 stop codon-causing mutations, led to the diversity of amino acid sequences (Supplementary Table S16). The results revealed that BnACTINs in the An subgenome contained an average of 60 SNPs per gene, which was higher than that in the Cn subgenome (36). Moreover, the number of SNPs within different groups ranges from 92 (Group Ⅱ) to 33 (Group Ⅴ), suggesting SNP density varied widely among subgroups. Furthermore, discrepancies in SNP counts were noted among certain paralogous pairs of BnACTINs, such as BnACTIN33 containing 105 SNPs in contrast to its paralog BnACTIN40 possessing only 10 SNPs. In addition, the paired t-test uncovered the significant variation in SNP density between BnACTIN paralogous gene pairs.
In plants, ACTINs are crucial for numerous organismal development and growth, routine cellular processes, which may finally affect phenotype [11,56,57]. Genome-wide association mapping analysis was conducted on several selected key agronomic characteristics to assess the impact of BnACTINs on agronomic traits. A total of 310 SNPs across four BnACTINs showed significant associations with the examined agronomic traits (Table 2, Supplementary Table S15) (p-value < 0.001). Remarkably, BnACTIN37 was significantly associated with most agronomic traits, including primary flowering time, full flowering time, plant height, main inflorescence silique density, main inflorescence silique number, and first branch height (Figure 8a–i). The t-test between the two genotypes categorized based on the most strongly linked SNP in BnaACTIN37 verified their significant diversity of traits. The STRING platform was utilized to acquire the interaction network of the BnACTIN37 [58] (Figure 8m), and its interacted proteins were notably enriched in functions such as regulation of actin filament polymerization, Arp2/3 protein complex, cell-cell signaling, response to freezing and so on (Figure 8n).
BnACTIN10 was significantly associated with metabolites like oleic acid, eicosenoic acid, and erucic acid (Supplementary Figure S4e–j). Moreover, acquiring the protein interaction network for BnACTIN10 was also achieved through STRING (Supplementary Figure S5a), and its interacted proteins were enriched in functions such as regulation of actin filament polymerization, Arp2/3 protein complex, cell-cell signaling, response to freezing, and so on (Supplementary Figure S5b). Additionally, BnACTIN29 was notably associated with stearic acid and oleic acid (Supplementary Figure S4a–d), and BnACTIN36 was significantly associated with erucic acid (Supplementary Figure S4k,l).

3. Discussion

Actin is the most abundant protein in the cytoplasm of eukaryotic cells, whose amino acid sequence is highly conserved. In plant cells, the actin cytoskeleton constitutes a highly dynamic and responsive network to stimuli, playing a role in vital functions across numerous developmental and growth-related cellular activities [15,16]. The actin-involved cellular process is primarily facilitated by the collective actions of the actin multigene family, the members of which exhibited tissue-biased expression profiles. The actin gene family has been explored whole genome-wide in numerous plants such as A. thaliana [22], sweet potato [24], rice [22], grape [23], and populus [4]. Nevertheless, extensive research on the ACTIN gene family in B. napus is still lacking. Allotetraploid B. napus serves as an ideal subject for research into the genetic implications of polyploidy. Our research facilitates the investigation of the functions and evolution process of homologs after polyploid formation.
Totally, 69 actin genes were detected in B. napus, which uncovered that the quantity of ACTIN genes (20 in A. thaliana, 16 in grape, 22 in rice, 18 in poplar, and 30 in sweet potato, 69 in B. napus) does not clearly mirror the extent of the genome (~125, ~470, ~900, ~380, ~785, ~825 Mb). Post-divergence from Arabidopsis, the Brassica genus underwent a genome triplication. Later, allotetraploid species B. napus originated from a natural cross of B. rapa and B. oleracea approximately 7000 years ago [32]. Therefore, it is anticipated that Each A. thaliana gene has a counterpart in the form of six copies within B. napus due to the occurrence of two whole-genome duplication events [59]. Nevertheless, only 69 actin genes were discovered in B. napus, which was nearly 3.5 times superior in quantity to AtACTINs, and the count of BraACTIN and BolACTIN genes was also under three times of that in A. thaliana. Remarkably, all AtACTINs retained incomplete copies in B. napus. The findings suggest that the phenomenon of gene loss took place following the originating of the Brassica and allotetraploid B. napus. Gene duplication in higher eukaryotes, including whole genome duplication (WGD), tandem duplication, and chromosomal segmental duplication, is recognized as a primary driver of gene family enlargement [60,61,62]. Collinearity analysis among paralogs reveals WGD provides a predominant force in genome expansion for Brassica species, consistent with previous studies [63,64,65] (Table 1). In addition, with all paralogous BnACTIN gene pairs exhibiting a Ka/Ks value below one, it demonstrates the action of purifying selection in the evolutionary process of BnACTINs (Supplementary Table S8).
BnACTINs were categorized into six clusters based on the phylogenetic relationship along with AtACTINs, corresponding to the insights of earlier research [11] (Figure 2). Additionally, the phylogenetic categorization of BnACTINs received additional validation through the examination of gene architecture and the conservation of the motif. All the BnACTINs were discovered to contain the motifs aligning with the actin domain, and ATPase-like associated motifs were also detected, implying their roles in ATPase activity. Moreover, the results display that the members within the same subfamily frequently exhibited a consistent intron-exon and conserved motif arrangement. However, among the various subfamilies, the exon numbers in BnACTINs showed notable diversity, suggesting diverse morphological characteristics of BnACTINs. For instance, genes in Group Ⅱ harbored 20 exons, while those in Group Ⅲ possessed only five (Figure 3). Residing in promoter areas, cis-acting elements are responsible for the regulation of gene transcription involved in physiological processes like abiotic stress responses, plant growth, and development, establishing foundational functional connections within intricate regulatory networks [66,67]. The TATA-box and CAAT-box are common in eukaryotic organisms, which form the binding sites for RNA transcription factors to regulate the gene transcription exhibited in all BnACTINs (Supplementary Figure S2). Apart from these ubiquitous elements, others associated with stress adaptation (MYB, MBS, ABRE, TGACG-motif), light responsive (Box 4, GT1-motif, G-box, TCT-motif), plant growth (MYC) as well as anaerobic induction (ARE) were likewise located across BnACTINs, implying their essential functions in plant development, reactions to abiotic stress and light. Unusually, acting regulatory elements varied among the members in identical clusters, denoting the possibility of their diverse roles [68,69].
A preponderance of BnACTINs was detected to be located in the cytoplasm, which confirms their roles in the formation of the actin cytoskeleton [16] (Supplementary Table S1). Furthermore, the insights from GO enrichment analysis propose that BnACTINs are anticipated to participate primarily in cytoskeleton organization, stress response, cellular process, and so on (Supplementary Figure S3, Supplementary Table S12). In spite of the functional prediction, detailed functional verification of BnACTINs was previously absent. Publicly available RNA-Seq data were facilitated to investigate the expression profiles of BnACTINs across different tissues and stress conditions [53,54]. The expression patterns of BnACTINs fluctuated across a range of tissues, while it presented relatively lower in the leaf compared to other tissues (Figure 7a, Supplementary Table S13). Multiple genes showed tissue-specific or tissue-preferential, implying their functions involved in tissue differentiation similar to the phenomenon in A. thaliana [24]. ACTINs are recognized for their involvement in plant abiotic stress resistance [11,70,71]. ACTIN filaments are pivotal in the signaling pathways triggered by stress, serving as either direct targets or signal transducers [12]. In the face of multiple stress factors, the majority of BnACTINs altered expression levels (Figure 7c, Supplementary Table S14). Moreover, a notable alteration in the expression of BnACTINs was observed under NaCL treatment, suggesting that they are especially susceptible to the effects of salinity. For instance, the expression of BnACTIN35 was increased to 4.4 times after 4 h of cold treatment. Remarkably, the expression of BnACTIN64 was downregulated in each stress environment, indicating that abiotic stress led to different gene expression regulation. Furthermore, the findings demonstrated that each BnACTINs is involved in a multitude of intricate protein interaction networks, and their interacting proteins participate in various cellular activities (Figure 6).
In order to expose the genetic contributions of BnACTINs to agronomic characteristics, SNP within BnACTINs was discovered among accessions of a B. napus natural population (Supplementary Table S15) [55]. With an average SNP density of 48 SNPs per gene, BnACTINs showed a slightly higher frequency compared to the overall genome average of 36 SNPs per gene, suggesting a significant accumulation of polymorphisms in these genes over time. The SNP density within BnACTINs of the An subgenome exceeded that of the Cn subgenome, revealing the asymmetric evolutionary processes of BnACTINs across two subgenomes, which align with patterns observed in other B. napus gene families [65,72,73,74]. Except for the unbalanced SNP density between subgenomes, SNP counts within paralogs were also notably divergent in B. napus, implying their potential functional differentiation. Previously, some studies have explored the connection between actin genes and plant immunity [75,76], whereas our understanding of their roles in agricultural traits remains limited. According to the association mapping analysis, BnACTIN37 was significantly associated with multiple traits, including PFT, FFT1, PH, MISD, MISN, and FBH. Additionally, BnACTIN10 was discovered to be notably linked to several agronomic traits (OA, EA1, EA2) as well. Furthermore, the interacted proteins of these genes primarily participate in the formation of the actin cytoskeleton, Arp2/3 complex, and response to freezing. Consequently, these findings offer a precious collection of potential BnACTINs that could affect agronomic traits.

4. Materials and Methods

4.1. Identification of ACTIN Genes in B. napus and Its Progenitors

The genome sequence and annotation information of B. napus were retrieved and downloaded from the Genoscope database (http://www.genoscope.cns.fr/brassicanapus/ accessed on 10 June 2024) [32]. The datasets of its progenitors B. rapa ‘Chiifu’ (v3.0) and B. oleracea ‘HDEM’ (broccoli) were obtained from databases (https://bigd.big.ac.cn/gwh/Assembly/134/show, accessed on 10 June 2024) [77] and (http://www.ocri-genomics.org/bolbase/index.html, accessed on 10 June 2024) [78], respectively. The annotated protein sequences were HMM searched against the queries, which was an annotation file of Actin domain (PF00022) downloaded from the Pfam database (https://www.ebi.ac.uk/interpro/, accessed on 11 June 2024) applying HMMER version 3.1 (http://hmmer.org/, accessed on 11 June 2024) [79] with E-value setting as1e–20 [80]. Then, utilizing the amino acid sequences of the BnACTINs identified earlier, BLASTP searches were performed against the complete protein sequences of 20 AtACTINs available in the TAIR database (http://www.arabidopsis.org/, accessed on 11 June 2024), applying an E-value cutoff of less than 1e–20. Moreover, the candidate ACTIN genes were verified by the SMART databases [81] and the NCBI Conserved Domain Database [82] based on the existence of the target Actin domain. In addition, the Actin family members were identified in B. rapa and B. oleracea using the consistent method. Furthermore, in order to predict the molecular weights (MWs) and isoelectric point (pI), as well as instability indexes of the BnACTINs, their protein sequences were subjected to the online software ProtParam (https://web.expasy.org/protparam/, accessed on 29 September 2024) [83]. CELLO v2.5 [84] predicted the subcellular location of these BnACTIN proteins.

4.2. Phylogenetic Analysis of BnACTIN Family Members

A phylogenetic analysis was executed to shed light on the genetic relationships within the ACTIN between Brassicaceae species. Sequence alignments between BnACTIN and AtACTIN amino acid sequences were conducted using Clustal W [85] in the MEGA program with default parameters [85]. MEGA facilitated the creation of the phylogenetic tree, applying the neighbor-joining (NJ) technique, pairwise deletion, and 1000 bootstrap replicates for robustness [86]. Furthermore, online software iTOL v6 was applied for the beautification and visualization of phylogenetic trees [87].

4.3. Synteny Analysis of ACTIN Gene Family and Ka/Ks Evaluation

The DupGen_finder tool (https://github.com/qiao-xin/DupGen_finder, accessed on 15 June 2024) [88] was applied to ascertain the gene duplication mechanisms for paralogous UBC genes across A. thaliana, B. napus, B. rapa, and B. oleracea. Moreover, paralogs in BnACTINs located on syntenic chromosome segments were visualized through the graphical capabilities of the Circos software (https://circos.ca/software/, accessed on 29 September 2024) [89]. MCScanX [90] was applied to detect the orthologs between B. napus and its ancestors (B. rapa, B. oleracea, and A. thaliana) with the default setting. At the same time, TBtools (https://github.com/CJ-Chen/TBtools/releases, accessed on 29 September 2024) [91] were used to display duplication events among orthologs. Furthermore, the fmsb package in R software was utilized to illustrate the syntenic connections among these ACTIN paralogous genes. In addition, The KaKs calculator [92] was implemented to assess the divergence of nonsynonymous (Ka) and synonymous (Ks) substitution rates. The evolutionary pressure (Ka/Ks ratio) on UBC orthologous genes between B. napus and the trio of A. thaliana, B. rapa, and B. oleracea was determined based on their coding DNA sequences (CDSs). Moreover, to reduce inaccuracies, gene pairs with a Ks value exceeding one were excluded from subsequent analysis [93,94].

4.4. Chromosomal Mapping, Structural Study, and Motif Conservation of BnACTINs

The genomic annotation from the GENOSCOPE database (http://www.genoscope.cns.fr/brassicanapus/, accessed on 20 June 2024) delineated the chromosomal positions, coding, and protein sequences of B. napus. RIdeogram package in the R software (https://github.com/TickingClock1992/RIdeogram, accessed on 20 June 2024) [95] was utilized to map the physical locations of BnACTINs to their corresponding chromosomes. Moreover, multiple alignments between BnACTIN protein sequences were carried out by applying CLUSTAL v2.1 using default settings. The layout of the BnACTINs gene structure was diagrammatically represented through the Gene Structure Display Server 2.0 (http://gsds.cbi.pku.edu.cn/, accessed on 21 June 2024) [96]. The MEME server (http://meme-suite.org/tools/meme, accessed on 21 June 2024) was utilized to explore conserved motifs within BnACTIN proteins, employing parameters as a maximum of 10 motifs, motif width ranging from 6 to 100 amino acids, and an E-value threshold of less than 1e–10 [97].

4.5. Cis-Acting Regulatory Element and Protein Interaction Detection of BnACTINs

PlantCARE [43] was applied for the identification of the cis-elements from the 2-kb promoter region of the BnACTIN gene sequences. In addition, the protein–protein interaction data for ACTIN proteins in A. thaliana were retrieved from the STRING database [58], which was then employed to predict functional association networks of BnACTINs according to their collinear relationship. The protein–protein interaction (PPI) was visualized using Cytoscape [98]. Furthermore, the BnACTINs interacted proteins were subjected to Gene Ontology enrichment analysis using the R package clusterProfiler [99] to explore their biological roles.

4.6. Profiling Expression Levels and Conducting GO Enrichment Analysis for BnACTINs

The available transcriptome data from several tissues (root, leaf, callus, bud, and silique) as well as stress conditions (cold, salt, dehydration, and ABA) of B. napus cultivar “ZS11” were obtained from public databases (National Genomics Data Centre under the project ID: CRA001775) [53,54]. Stringtie software (https://bioinformaticshome.com/tools/rna-seq/descriptions/StringTie.html#gsc.tab=0, accessed on 29 September 2024) [100] was applied to calculate the pression levels of BnACTINs following alignment with Hisat2 [101]. Additionally, the gene expression profiles visualization was performed to generate a clustered heatmap using the TBtools software [91]. Subsequently, a Gene Ontology (GO) enrichment analysis for the BnACTINs was conducted employing the clusterProfiler package within the R programming.

4.7. Association Mapping Analysis of TPS Genes within B. napus Germplasm Collection

In an effort to explore the genetic diversity of ACTIN genes in B. napus, a worldwide collection of 324 natural accessions was employed in this study [55]. The SnpEff program [102] was facilitated to extract and annotate SNPs within BnACTINs gene loci. This research investigated a range of agronomic traits such as plant height (PH), first branch height (FBH), primary flowering time (PFT) (approximately more than 30% of the buds on the open into flowers), full flowering time (FFT1) (approximately more than 70% of the buds on the plant open into flowers), main inflorescence silique density (MISD), main inflorescence silique number (MISN), thioglycoside (THI), stearic acid (SA) as well as erucic acid (EA2). Family-based association mapping analysis, which accounts for population structure and relative kinship, was conducted using the mixed linear model in EMMAX [103]. Haplotype blocks and linkage disequilibrium were graphically represented using the LDBlockShow tool [104]. In addition, the STRING database provided the interaction networks of B. napus proteins [105].

5. Conclusions

The current investigation delivers a complete examination of the ACTIN family within B. napus. In total, 69 BnACTINs were detected and categorized into six clusters. Members of the same subfamily displayed analogous gene structures and shared motifs. The identification of crucial cis-acting regulatory elements and functional prediction of BnACTINs demonstrate that they contributed importantly to actin cytoskeleton construction and stress response. Additionally, protein–protein interaction analysis revealed that BnACTINs participate in routine cellular activities. BnACTIN genes exhibited diverse expression behaviors across multiple tissues and in response to various abiotic stresses. Furthermore, the association mapping also highlighted the possibility that BnACTIN genes could contribute to agronomic traits in B. napus. In conclusion, these findings have delivered a comprehensive insight into BnACTIN genes, offering a groundwork for advanced functional exploration and genetic enhancement in B. napus cultivation.

Supplementary Materials

The following supporting information can be downloaded at https://www.mdpi.com/article/10.3390/ijms251910752/s1.

Author Contributions

S.Y. and X.Z. designed the study. S.Y., J.P., Q.Z., and M.H. carried out the experiments. S.Y., J.P., and M.H. analyzed the data. S.Y. and X.Z. drafted and revised the manuscript. Concurrently, every author has endorsed the latest draft of the manuscript. All authors have read and agreed to the published version of the manuscript.

Funding

The project was supported by the National Natural Science Foundation of China (nos 32201220) and Research Funding of Wuhan Polytechnic University NO. 2022RZ071.

Institutional Review Board Statement

Not applicable.

Informed Consent Statement

Not applicable.

Data Availability Statement

The associated data are detailed within the Supplementary Materials.

Conflicts of Interest

The authors declare no conflicts of interest.

References

  1. Zheng, B.; Han, M.; Bernier, M.; Wen, J.K. Nuclear actin and actin-binding proteins in the regulation of transcription and gene expression. FEBS J. 2009, 276, 2669–2685. [Google Scholar] [CrossRef] [PubMed]
  2. Sehring, I.M.; Mansfeld, J.; Reiner, C.; Wagner, E.; Plattner, H.; Kissmehl, R. The actin multigene family of Paramecium tetraurelia. BMC Genom. 2007, 8, 82. [Google Scholar] [CrossRef] [PubMed]
  3. Maisch, J.; Nick, P. Actin is involved in auxin-dependent patterning. Plant Physiol. 2007, 143, 1695–1704. [Google Scholar] [CrossRef] [PubMed]
  4. Zhang, D.; Du, Q.; Xu, B.; Zhang, Z.; Li, B. The actin multigene family in Populus: Organization, expression and phylogenetic analysis. Mol. Genet. Genom. 2010, 284, 105–119. [Google Scholar] [CrossRef] [PubMed]
  5. Gu, Y.; Fu, Y.; Dowd, P.; Li, S.; Vernoud, V.; Gilroy, S.; Yang, Z. A Rho family GTPase controls actin dynamics and tip growth via two counteracting downstream pathways in pollen tubes. J. Cell Biol. 2005, 169, 127–138. [Google Scholar] [CrossRef]
  6. Hussey, P.J.; Ketelaar, T.; Deeks, M.J. Control of the actin cytoskeleton in plant cell growth. Annu. Rev. Plant Biol. 2006, 57, 109–125. [Google Scholar] [CrossRef]
  7. Smith, L.G.; Oppenheimer, D.G. Spatial control of cell expansion by the plant cytoskeleton. Annu. Rev. Cell Dev. Biol. 2005, 21, 271–295. [Google Scholar] [CrossRef]
  8. Staiger, C.J. SIGNALING TO THE ACTIN CYTOSKELETON IN PLANTS. Annu. Rev. Plant Physiol. Plant Mol. Biol. 2000, 51, 257–288. [Google Scholar] [CrossRef]
  9. Blancaflor, E.B. The cytoskeleton and gravitropism in higher plants. J. Plant Growth Regul. 2002, 21, 120–136. [Google Scholar] [CrossRef]
  10. Timonen, S.; Peterson, R.L. Cytoskeleton in Mycorrhizal Symbiosis; Springer: Dordrecht, The Netherlands, 2002. [Google Scholar]
  11. Xia, S.; Zhang, H.; He, S. Genome-Wide Identification and Expression Analysis of ACTIN Family Genes in the Sweet Potato and Its Two Diploid Relatives. Int. J. Mol. Sci. 2023, 24, 930. [Google Scholar] [CrossRef]
  12. Kumar, S.; Jeevaraj, T.; Yunus, M.H.; Chakraborty, S.; Chakraborty, N. The plant cytoskeleton takes center stage in abiotic stress responses and resilience. Plant Cell Environ. 2023, 46, 5–22. [Google Scholar] [CrossRef] [PubMed]
  13. Carlier, M.F. Actin self-assembly: From filament structure and mechanics to motile and morphogenetic processes. Semin. Cell Dev. Biol. 2020, 102, 48–50. [Google Scholar] [CrossRef] [PubMed]
  14. Bisaria, A.; Hayer, A.; Garbett, D.; Cohen, D.; Meyer, T. Membrane-proximal F-actin restricts local membrane protrusions and directs cell migration. Science 2020, 368, 1205–1210. [Google Scholar] [CrossRef] [PubMed]
  15. Perrin, B.J.; Ervasti, J.M. The actin gene family: Function follows isoform. Cytoskeleton 2010, 67, 630–634. [Google Scholar] [CrossRef] [PubMed]
  16. Bunnell, T.M.; Ervasti, J.M. Structural and functional properties of the actin gene family. Crit. Rev. Eukaryot. Gene Expr. 2011, 21, 255–266. [Google Scholar] [CrossRef]
  17. Kashina, A.S. Regulation of actin isoforms in cellular and developmental processes. Semin. Cell Dev. Biol. 2020, 102, 113–121. [Google Scholar] [CrossRef]
  18. Erickson, H.P. Evolution of the cytoskeleton. BioEssays News Rev. Mol. Cell. Dev. Biol. 2007, 29, 668–677. [Google Scholar] [CrossRef]
  19. Jain, M.; Nijhawan, A.; Tyagi, A.K.; Khurana, J.P. Validation of housekeeping genes as internal control for studying gene expression in rice by quantitative real-time PCR. Biochem. Biophys. Res. Commun. 2006, 345, 646–651. [Google Scholar] [CrossRef]
  20. Jian, B.; Liu, B.; Bi, Y.; Hou, W.; Wu, C.; Han, T. Validation of internal control for gene expression study in soybean by quantitative real-time PCR. BMC Mol. Biol. 2008, 9, 59. [Google Scholar] [CrossRef]
  21. Bhattacharya, D.; Aubry, J.; Twait, E.C.; Jurk, S. ACTIN GENE DUPLICATION AND THE EVOLUTION OF MORPHOLOGICAL COMPLEXITY IN LAND PLANTS. J. Phycol. 2010, 36, 813–820. [Google Scholar] [CrossRef]
  22. Guo, J.-K.; Cu, Q.-Y.; Ji, Q.; Zhang, L.-S.; Wang, J. Genome-Wide Analysis of ACTIN Families in Arabidopsis thaliana, Oryza sativa and Populus trichocarpa. J. Shanghai Univ. (Nat. Sci. Ed.) 2009, 15, 426–431. [Google Scholar]
  23. Liwen, C.; Ting, Z.; Kekun, Z.; Chuan, Z.; Lingfei, S.; Jinggui, F.; University, N.A. Identification, evolution and expression analyses of Actin gene family of Vitis vinifera. J. Plant Resour. Environ. 2017, 26, 1–10. [Google Scholar]
  24. McDowell, J.M.; Huang, S.; McKinney, E.C.; An, Y.Q.; Meagher, R.B. Structure and evolution of the actin gene family in Arabidopsis thaliana. Genetics 1996, 142, 587–602. [Google Scholar] [CrossRef] [PubMed]
  25. Huang, S.; An, Y.Q.; McDowell, J.M.; McKinney, E.C.; Meagher, R.B. The Arabidopsis ACT11 actin gene is strongly expressed in tissues of the emerging inflorescence, pollen, and developing ovules. Plant Mol. Biol. 1997, 33, 125–139. [Google Scholar] [CrossRef] [PubMed]
  26. Huang, S.; An, Y.Q.; McDowell, J.M.; McKinney, E.C.; Meagher, R.B. The Arabidopsis thaliana ACT4/ACT12 actin gene subclass is strongly expressed throughout pollen development. Plant J. Cell Mol. Biol. 1996, 10, 189–202. [Google Scholar] [CrossRef]
  27. An, Y.Q.; Huang, S.; McDowell, J.M.; McKinney, E.C.; Meagher, R.B. Conserved expression of the Arabidopsis ACT1 and ACT 3 actin subclass in organ primordia and mature pollen. Plant Cell 1996, 8, 15–30. [Google Scholar] [CrossRef]
  28. Kandasamy, M.K.; McKinney, E.C.; Meagher, R.B. Functional nonequivalency of actin isovariants in Arabidopsis. Mol. Biol. Cell 2002, 13, 251–261. [Google Scholar] [CrossRef]
  29. Inada, N.; Takahashi, N.; Umeda, M. Arabidopsis thaliana subclass I ACTIN DEPOLYMERIZING FACTORs and vegetative ACTIN2/8 are novel regulators of endoreplication. J. Plant Res. 2021, 134, 1291–1300. [Google Scholar] [CrossRef]
  30. Kandasamy, M.K.; McKinney, E.C.; Meagher, R.B. A single vegetative actin isovariant overexpressed under the control of multiple regulatory sequences is sufficient for normal Arabidopsis development. Plant Cell 2009, 21, 701–718. [Google Scholar] [CrossRef]
  31. Li, X.B.; Fan, X.P.; Wang, X.L.; Cai, L.; Yang, W.C. The cotton ACTIN1 gene is functionally expressed in fibers and participates in fiber elongation. Plant Cell 2005, 17, 859–875. [Google Scholar] [CrossRef]
  32. Chalhoub, B.; Denoeud, F.; Liu, S.; Parkin, I.A.; Tang, H.; Wang, X.; Chiquet, J.; Belcram, H.; Tong, C.; Samans, B.; et al. Plant genetics. Early allopolyploid evolution in the post-Neolithic Brassica napus oilseed genome. Science 2014, 345, 950–953. [Google Scholar] [CrossRef] [PubMed]
  33. Lu, C.; Napier, J.A.; Clemente, T.E.; Cahoon, E.B. New frontiers in oilseed biotechnology: Meeting the global demand for vegetable oils for food, feed, biofuel, and industrial applications. Curr. Opin. Biotechnol. 2011, 22, 252–259. [Google Scholar] [CrossRef] [PubMed]
  34. Wang, B.; Wu, Z.; Li, Z.; Zhang, Q.; Hu, J.; Xiao, Y.; Cai, D.; Wu, J.; King, G.J.; Li, H.; et al. Dissection of the genetic architecture of three seed-quality traits and consequences for breeding in Brassica napus. Plant Biotechnol. J. 2018, 16, 1336–1348. [Google Scholar] [CrossRef] [PubMed]
  35. Lu, K.; Wei, L.; Li, X.; Wang, Y.; Wu, J.; Liu, M.; Zhang, C.; Chen, Z.; Xiao, Z.; Jian, H.; et al. Whole-genome resequencing reveals Brassica napus origin and genetic loci involved in its improvement. Nat. Commun. 2019, 10, 1154. [Google Scholar] [CrossRef]
  36. Wu, D.; Liang, Z.; Yan, T.; Xu, Y.; Xuan, L.; Tang, J.; Zhou, G.; Lohwasser, U.; Hua, S.; Wang, H.; et al. Whole-Genome Resequencing of a Worldwide Collection of Rapeseed Accessions Reveals the Genetic Basis of Ecotype Divergence. Mol. Plant 2019, 12, 30–43. [Google Scholar] [CrossRef]
  37. Sun, F.; Fan, G.; Hu, Q.; Zhou, Y.; Guan, M.; Tong, C.; Li, J.; Du, D.; Qi, C.; Jiang, L.; et al. The high-quality genome of Brassica napus cultivar ‘ZS11’ reveals the introgression history in semi-winter morphotype. Plant J. Cell Mol. Biol. 2017, 92, 452–468. [Google Scholar] [CrossRef]
  38. Cheng, F.; Wu, J.; Cai, X.; Liang, J.; Freeling, M.; Wang, X. Gene retention, fractionation and subgenome differences in polyploid plants. Nat. Plants 2018, 4, 258–268. [Google Scholar] [CrossRef]
  39. Liu, S.; Liu, Y.; Yang, X.; Tong, C.; Edwards, D.; Parkin, I.A.; Zhao, M.; Ma, J.; Yu, J.; Huang, S.; et al. The Brassica oleracea genome reveals the asymmetrical evolution of polyploid genomes. Nat. Commun. 2014, 5, 3930. [Google Scholar] [CrossRef]
  40. Di, F.; Jian, H.; Wang, T.; Chen, X.; Ding, Y.; Du, H.; Lu, K.; Li, J.; Liu, L. Genome-Wide Analysis of the PYL Gene Family and Identification of PYL Genes That Respond to Abiotic Stress in Brassica napus. Genes. 2018, 9, 156. [Google Scholar] [CrossRef]
  41. Davuluri, R.V.; Sun, H.; Palaniswamy, S.K.; Matthews, N.; Molina, C.; Kurtz, M.; Grotewold, E. AGRIS: Arabidopsis gene regulatory information server, an information resource of Arabidopsis cis-regulatory elements and transcription factors. BMC Bioinform. 2003, 4, 25. [Google Scholar] [CrossRef]
  42. Vandepoele, K.; Quimbaya, M.; Casneuf, T.; De Veylder, L.; Van de Peer, Y. Unraveling transcriptional control in Arabidopsis using cis-regulatory elements and coexpression networks. Plant Physiol. 2009, 150, 535–546. [Google Scholar] [CrossRef] [PubMed]
  43. Lescot, M.; Déhais, P.; Thijs, G.; Marchal, K.; Moreau, Y.; Van de Peer, Y.; Rouzé, P.; Rombauts, S. PlantCARE, a database of plant cis-acting regulatory elements and a portal to tools for in silico analysis of promoter sequences. Nucleic Acids Res. 2002, 30, 325–327. [Google Scholar] [CrossRef] [PubMed]
  44. Qi, T.; Huang, H.; Song, S.; Xie, D. Regulation of Jasmonate-Mediated Stamen Development and Seed Production by a bHLH-MYB Complex in Arabidopsis. Plant Cell 2015, 27, 1620–1633. [Google Scholar] [CrossRef] [PubMed]
  45. Li, J.; Han, G.; Sun, C.; Sui, N. Research advances of MYB transcription factors in plant stress resistance and breeding. Plant Signal. Behav. 2019, 14, 1613131. [Google Scholar] [CrossRef] [PubMed]
  46. Cheng, F.; Sun, R.; Hou, X.; Zheng, H.; Zhang, F.; Zhang, Y.; Liu, B.; Liang, J.; Zhuang, M.; Liu, Y.; et al. Subgenome parallel selection is associated with morphotype diversification and convergent crop domestication in Brassica rapa and Brassica oleracea. Nat. Genet. 2016, 48, 1218–1224. [Google Scholar] [CrossRef]
  47. Nekrutenko, A.; Makova, K.D.; Li, W.H. The K(A)/K(S) ratio test for assessing the protein-coding potential of genomic regions: An empirical and simulation study. Genome Res. 2002, 12, 198–202. [Google Scholar] [CrossRef]
  48. Yang, J.; Liu, D.; Wang, X.; Ji, C.; Cheng, F.; Liu, B.; Hu, Z.; Chen, S.; Pental, D.; Ju, Y.; et al. The genome sequence of allopolyploid Brassica juncea and analysis of differential homoeolog gene expression influencing selection. Nat. Genet. 2016, 48, 1225–1232. [Google Scholar] [CrossRef]
  49. McCurdy, D.W.; Kovar, D.R.; Staiger, C.J. Actin and actin-binding proteins in higher plants. Protoplasma 2001, 215, 89–104. [Google Scholar] [CrossRef]
  50. Sacharowski, S.P.; Gratkowska, D.M.; Sarnowska, E.A.; Kondrak, P.; Jancewicz, I.; Porri, A.; Bucior, E.; Rolicka, A.T.; Franzen, R.; Kowalczyk, J.; et al. SWP73 Subunits of Arabidopsis SWI/SNF Chromatin Remodeling Complexes Play Distinct Roles in Leaf and Flower Development. Plant Cell 2015, 27, 1889–1906. [Google Scholar] [CrossRef]
  51. Szymanski, D.B. Breaking the WAVE complex: The point of Arabidopsis trichomes. Curr. Opin. Plant Biol. 2005, 8, 103–112. [Google Scholar] [CrossRef]
  52. Mathur, J.; Spielhofer, P.; Kost, B.; Chua, N. The actin cytoskeleton is required to elaborate and maintain spatial patterning during trichome cell morphogenesis in Arabidopsis thaliana. Development 1999, 126, 5559–5568. [Google Scholar] [CrossRef] [PubMed]
  53. Yao, S.; Liang, F.; Gill, R.A.; Huang, J.; Cheng, X.; Liu, Y.; Tong, C.; Liu, S. A global survey of the transcriptome of allopolyploid Brassica napus based on single-molecule long-read isoform sequencing and Illumina-based RNA sequencing data. Plant J. Cell Mol. Biol. 2020, 103, 843–857. [Google Scholar] [CrossRef] [PubMed]
  54. Zhang, Y.; Ali, U.; Zhang, G.; Yu, L.; Fang, S.; Iqbal, S.; Li, H.; Lu, S.; Guo, L. Transcriptome analysis reveals genes commonly responding to multiple abiotic stresses in rapeseed. Mol. Breed. 2019, 39, 158. [Google Scholar] [CrossRef]
  55. Tang, M. Population Genome Variations and Subgenome Asymmetry in Brassica napus L. Ph.D. Thesis, Huazhong Agricultural University, Huazhong, China, 2019. [Google Scholar]
  56. Balasubramanian, R.; Karve, A.; Kandasamy, M.; Meagher, R.B.; Moore, B. A role for F-actin in hexokinase-mediated glucose signaling. Plant Physiol. 2007, 145, 1423–1434. [Google Scholar] [CrossRef] [PubMed]
  57. Palmieri, M.; Kiss, J.Z. Disruption of the F-actin cytoskeleton limits statolith movement in Arabidopsis hypocotyls. J. Exp. Bot. 2005, 56, 2539–2550. [Google Scholar] [CrossRef]
  58. Szklarczyk, D.; Gable, A.L.; Lyon, D.; Junge, A.; Wyder, S.; Huerta-Cepas, J.; Simonovic, M.; Doncheva, N.T.; Morris, J.H.; Bork, P.; et al. STRING v11: Protein-protein association networks with increased coverage, supporting functional discovery in genome-wide experimental datasets. Nucleic Acids Res. 2019, 47, D607–D613. [Google Scholar] [CrossRef]
  59. Lysak, M.A.; Koch, M.A.; Pecinka, A.; Schubert, I. Chromosome triplication found across the tribe Brassiceae. Genome Res. 2005, 15, 516–525. [Google Scholar] [CrossRef]
  60. Prince, V.E.; Pickett, F.B. Splitting pairs: The diverging fates of duplicated genes. Nat. Rev. Genet. 2002, 3, 827–837. [Google Scholar] [CrossRef]
  61. Bianconi, M.E.; Dunning, L.T.; Moreno-Villena, J.J.; Osborne, C.P.; Christin, P.A. Gene duplication and dosage effects during the early emergence of C4 photosynthesis in the grass genus Alloteropsis. J. Exp. Bot. 2018, 69, 1967–1980. [Google Scholar] [CrossRef]
  62. Parkin, I.A.; Sharpe, A.G.; Lydiate, D.J. Patterns of genome duplication within the Brassica napus genome. Genome 2003, 46, 291–303. [Google Scholar] [CrossRef]
  63. Ma, J.Q.; Jian, H.J.; Yang, B.; Lu, K.; Zhang, A.X.; Liu, P.; Li, J.N. Genome-wide analysis and expression profiling of the GRF gene family in oilseed rape (Brassica napus L.). Gene 2017, 620, 36–45. [Google Scholar] [CrossRef] [PubMed]
  64. Wu, Y.; Ke, Y.; Wen, J.; Guo, P.; Ran, F.; Wang, M.; Liu, M.; Li, P.; Li, J.; Du, H. Evolution and expression analyses of the MADS-box gene family in Brassica napus. PLoS ONE 2018, 13, e0200762. [Google Scholar] [CrossRef] [PubMed]
  65. Zhu, W.; Guo, Y.; Chen, Y.; Wu, D.; Jiang, L. Genome-wide identification, phylogenetic and expression pattern analysis of GATA family genes in Brassica napus. BMC Plant Biol. 2020, 20, 543. [Google Scholar] [CrossRef] [PubMed]
  66. Hadiarto, T.; Tran, L.S. Progress studies of drought-responsive genes in rice. Plant Cell Rep. 2011, 30, 297–310. [Google Scholar] [CrossRef] [PubMed]
  67. Nuruzzaman, M.; Sharoni, A.M.; Satoh, K.; Kumar, A.; Leung, H.; Kikuchi, S. Comparative transcriptome profiles of the WRKY gene family under control, hormone-treated, and drought conditions in near-isogenic rice lines reveal differential, tissue specific gene activation. J. Plant Physiol. 2014, 171, 2–13. [Google Scholar] [CrossRef]
  68. Oudelaar, A.M.; Higgs, D.R. The relationship between genome structure and function. Nat. Rev. Genet. 2021, 22, 154–168. [Google Scholar] [CrossRef]
  69. Zou, C.; Sun, K.; Mackaluso, J.D.; Seddon, A.E.; Jin, R.; Thomashow, M.F.; Shiu, S.H. Cis-regulatory code of stress-responsive transcription in Arabidopsis thaliana. Proc. Natl. Acad. Sci. USA 2011, 108, 14992–14997. [Google Scholar] [CrossRef]
  70. Kretzschmar, A.; Schülke, J.P.; Masana, M.; Dürre, K.; Müller, M.B.; Bausch, A.R.; Rein, T. The Stress-Inducible Protein DRR1 Exerts Distinct Effects on Actin Dynamics. Int. J. Mol. Sci. 2018, 19, 3993. [Google Scholar] [CrossRef]
  71. Asparuhova, M.B.; Gelman, L.; Chiquet, M. Role of the actin cytoskeleton in tuning cellular responses to external mechanical stress. Scand. J. Med. Sci. Sports 2009, 19, 490–499. [Google Scholar] [CrossRef]
  72. Yao, S.; Xie, M.; Hu, M.; Cui, X.; Wu, H.; Li, X.; Hu, P.; Tong, C.; Yu, X. Genome-wide characterization of ubiquitin-conjugating enzyme gene family explores its genetic effects on the oil content and yield of Brassica napus. Front. Plant Sci. 2023, 14, 1118339. [Google Scholar] [CrossRef]
  73. Wahid, S.; Xie, M.; Sarfraz, S.; Liu, J.; Zhao, C.; Bai, Z.; Tong, C.; Cheng, X.; Gao, F.; Liu, S. Genome-Wide Identification and Analysis of Ariadne Gene Family Reveal Its Genetic Effects on Agronomic Traits of Brassica napus. Int. J. Mol. Sci. 2022, 23, 6265. [Google Scholar] [CrossRef] [PubMed]
  74. Xie, M.; Zuo, R.; Bai, Z.; Yang, L.; Zhao, C.; Gao, F.; Cheng, X.; Huang, J.; Liu, Y.; Li, Y.; et al. Genome-Wide Characterization of Serine/Arginine-Rich Gene Family and Its Genetic Effects on Agronomic Traits of Brassica napus. Front. Plant Sci. 2022, 13, 829668. [Google Scholar] [CrossRef] [PubMed]
  75. Janda, M.; Matoušková, J.; Burketová, L.; Valentová, O. Interconnection between actin cytoskeleton and plant defense signaling. Plant Signal. Behav. 2014, 9, e976486. [Google Scholar] [CrossRef]
  76. Wang, J.; Lian, N.; Zhang, Y.; Man, Y.; Chen, L.; Yang, H.; Lin, J.; Jing, Y. The Cytoskeleton in Plant Immunity: Dynamics, Regulation, and Function. Int. J. Mol. Sci. 2022, 23, 15553. [Google Scholar] [CrossRef] [PubMed]
  77. Zhang, L.; Cai, X.; Wu, J.; Liu, M.; Grob, S.; Cheng, F.; Liang, J.; Cai, C.; Liu, Z.; Liu, B.; et al. Improved Brassica rapa reference genome by single-molecule sequencing and chromosome conformation capture technologies. Hortic. Res. 2018, 5, 124. [Google Scholar] [CrossRef] [PubMed]
  78. Belser, C.; Istace, B.; Denis, E.; Dubarry, M.; Baurens, F.C.; Falentin, C.; Genete, M.; Berrabah, W.; Chevre, A.M.; Delourme, R.; et al. Chromosome-scale assemblies of plant genomes using nanopore long reads and optical maps. Nat. Plants 2018, 4, 879–887. [Google Scholar] [CrossRef]
  79. Eddy, S.R. Accelerated Profile HMM Searches. PLoS Comput. Biol. 2011, 7, e1002195. [Google Scholar] [CrossRef]
  80. Finn, R.D.; Clements, J.; Eddy, S.R. HMMER web server: Interactive sequence similarity searching. Nucleic Acids Res. 2011, 39, W29–W37. [Google Scholar] [CrossRef]
  81. Letunic, I.; Khedkar, S.; Bork, P. SMART: Recent updates, new developments and status in 2020. Nucleic Acids Res. 2021, 49, D458–D460. [Google Scholar] [CrossRef]
  82. Lu, S.; Wang, J.; Chitsaz, F.; Derbyshire, M.K.; Geer, R.C.; Gonzales, N.R.; Gwadz, M.; Hurwitz, D.I.; Marchler, G.H.; Song, J.S.; et al. CDD/SPARCLE: The conserved domain database in 2020. Nucleic Acids Res. 2020, 48, D265–D268. [Google Scholar] [CrossRef]
  83. Wilkins, M.R.; Gasteiger, E.; Bairoch, A.; Sanchez, J.C.; Williams, K.L.; Appel, R.D.; Hochstrasser, D.F. Protein identification and analysis tools in the ExPASy server. Methods Mol. Biol. (Clifton N.J.) 1999, 112, 531–552. [Google Scholar] [CrossRef]
  84. Yu, C.S.; Chen, Y.C.; Lu, C.H.; Hwang, J.K. Prediction of protein subcellular localization. Proteins 2006, 64, 643–651. [Google Scholar] [CrossRef] [PubMed]
  85. Larkin, M.A.; Blackshields, G.; Brown, N.P.; Chenna, R.; McGettigan, P.A.; McWilliam, H.; Valentin, F.; Wallace, I.M.; Wilm, A.; Lopez, R.; et al. Clustal W and Clustal X version 2.0. Bioinformatics 2007, 23, 2947–2948. [Google Scholar] [CrossRef] [PubMed]
  86. Tamura, K.; Stecher, G.; Kumar, S. MEGA11: Molecular Evolutionary Genetics Analysis Version 11. Mol. Biol. Evol. 2021, 38, 3022–3027. [Google Scholar] [CrossRef] [PubMed]
  87. Letunic, I.; Bork, P. Interactive Tree of Life (iTOL) v6: Recent updates to the phylogenetic tree display and annotation tool. Nucleic Acids Res. 2024, 52, W78–W82. [Google Scholar] [CrossRef]
  88. Qiao, X.; Li, Q.; Yin, H.; Qi, K.; Li, L.; Wang, R.; Zhang, S.; Paterson, A.H. Gene duplication and evolution in recurring polyploidization-diploidization cycles in plants. Genome Biol. 2019, 20, 38. [Google Scholar] [CrossRef]
  89. Krzywinski, M.; Schein, J.; Birol, I.; Connors, J.; Gascoyne, R.; Horsman, D.; Jones, S.J.; Marra, M.A. Circos: An information aesthetic for comparative genomics. Genome Res. 2009, 19, 1639–1645. [Google Scholar] [CrossRef]
  90. Wang, Y.; Tang, H.; Debarry, J.D.; Tan, X.; Li, J.; Wang, X.; Lee, T.H.; Jin, H.; Marler, B.; Guo, H.; et al. MCScanX: A toolkit for detection and evolutionary analysis of gene synteny and collinearity. Nucleic Acids Res. 2012, 40, e49. [Google Scholar] [CrossRef]
  91. Chen, C.; Chen, H.; Zhang, Y.; Thomas, H.R.; Frank, M.H.; He, Y.; Xia, R. TBtools: An Integrative Toolkit Developed for Interactive Analyses of Big Biological Data. Mol. Plant 2020, 13, 1194–1202. [Google Scholar] [CrossRef]
  92. Wang, D.; Zhang, Y.; Zhang, Z.; Zhu, J.; Yu, J. KaKs_Calculator 2.0: A toolkit incorporating gamma-series methods and sliding window strategies. Genom. Proteom. Bioinform. 2010, 8, 77–80. [Google Scholar] [CrossRef]
  93. Wang, T.; Hu, J.; Ma, X.; Li, C.; Yang, Q.; Feng, S.; Li, M.; Li, N.; Song, X. Identification, evolution and expression analyses of whole genome-wide TLP gene family in Brassica napus. BMC Genom. 2020, 21, 264. [Google Scholar] [CrossRef] [PubMed]
  94. Guo, Y.; Liu, J.; Zhang, J.; Liu, S.; Du, J. Selective modes determine evolutionary rates, gene compactness and expression patterns in Brassica. Plant J. Cell Mol. Biol. 2017, 91, 34–44. [Google Scholar] [CrossRef] [PubMed]
  95. Hao, Z.; Lv, D.; Ge, Y.; Shi, J.; Weijers, D.; Yu, G.; Chen, J. RIdeogram: Drawing SVG graphics to visualize and map genome-wide data on the idiograms. PeerJ Comput. Sci. 2020, 6, e251. [Google Scholar] [CrossRef] [PubMed]
  96. Hu, B.; Jin, J.; Guo, A.Y.; Zhang, H.; Luo, J.; Gao, G. GSDS 2.0: An upgraded gene feature visualization server. Bioinformatics 2015, 31, 1296–1297. [Google Scholar] [CrossRef]
  97. Bailey, T.L.; Boden, M.; Buske, F.A.; Frith, M.; Grant, C.E.; Clementi, L.; Ren, J.; Li, W.W.; Noble, W.S. MEME SUITE: Tools for motif discovery and searching. Nucleic Acids Res. 2009, 37, W202–W208. [Google Scholar] [CrossRef]
  98. Shannon, P.; Markiel, A.; Ozier, O.; Baliga, N.S.; Wang, J.T.; Ramage, D.; Amin, N.; Schwikowski, B.; Ideker, T. Cytoscape: A software environment for integrated models of biomolecular interaction networks. Genome Res. 2003, 13, 2498–2504. [Google Scholar] [CrossRef]
  99. Yu, G.; Wang, L.G.; Han, Y.; He, Q.Y. clusterProfiler: An R package for comparing biological themes among gene clusters. Omics A J. Integr. Biol. 2012, 16, 284–287. [Google Scholar] [CrossRef]
  100. Pertea, M.; Pertea, G.M.; Antonescu, C.M.; Chang, T.C.; Mendell, J.T.; Salzberg, S.L. StringTie enables improved reconstruction of a transcriptome from RNA-seq reads. Nat. Biotechnol. 2015, 33, 290–295. [Google Scholar] [CrossRef]
  101. Kim, D.; Langmead, B.; Salzberg, S.L. HISAT: A fast spliced aligner with low memory requirements. Nat. Methods 2015, 12, 357–360. [Google Scholar] [CrossRef]
  102. Cingolani, P.; Platts, A.; Wang, L.L.; Coon, M.; Nguyen, T.; Wang, L.; Land, S.J.; Lu, X.; Ruden, D.M. A program for annotating and predicting the effects of single nucleotide polymorphisms, SnpEff: SNPs in the genome of Drosophila melanogaster strain w1118; iso-2; iso-3. Fly 2012, 6, 80–92. [Google Scholar] [CrossRef]
  103. Kang, H.M.; Sul, J.H.; Service, S.K.; Zaitlen, N.A.; Kong, S.Y.; Freimer, N.B.; Sabatti, C.; Eskin, E. Variance component model to account for sample structure in genome-wide association studies. Nat. Genet. 2010, 42, 348–354. [Google Scholar] [CrossRef] [PubMed]
  104. Dong, S.S.; He, W.M.; Ji, J.J.; Zhang, C.; Guo, Y.; Yang, T.L. LDBlockShow: A fast and convenient tool for visualizing linkage disequilibrium and haplotype blocks based on variant call format files. Brief. Bioinform. 2021, 22, bbaa227. [Google Scholar] [CrossRef] [PubMed]
  105. Szklarczyk, D.; Gable, A.L.; Nastou, K.C.; Lyon, D.; Kirsch, R.; Pyysalo, S.; Doncheva, N.T.; Legeay, M.; Fang, T.; Bork, P.; et al. The STRING database in 2021: Customizable protein-protein networks, and functional characterization of user-uploaded gene/measurement sets. Nucleic Acids Res. 2021, 49, D605–D612. [Google Scholar] [CrossRef] [PubMed]
Figure 1. Chromosomal distribution of BnACTINs. The genomic positioning of BnACTINs is depicted, taking into account the centromere positions, chromosome lengths, and gene placements. The chromosome identifiers are indicated at the base of each graphical representation. An accompanying heatmap illustrates the concentration of genes per megabase across the chromosomes.
Ijms 25 10752 g001
Figure 2. The evolutionary ties between ACTIN genes in Arabidopsis thaliana and Brassica napus were elucidated. A phylogenetic tree was assembled using MEGA7.0, applying the neighbor-joining technique with 1000 bootstrap iterations. The diversely colored subgroups were identified based on their positions at nodes and branches, as well as the tree’s inherent features.
Ijms 25 10752 g002
Figure 3. The structural composition and conserved motif patterns of BnACTINs were scrutinized in light of their evolutionary relationships. (a) A phylogenetic study was performed. (b) The gene structures of BnACTINs were illustrated, using yellow for CDS and blue for UTR, with introns marked by black lines. (c) A MEME analysis was conducted to uncover conserved motifs in the BnACTIN protein family.
Ijms 25 10752 g003
Figure 4. Genome-wide synteny analysis of ACTIN genes among A. thaliana, B. napus, B. rapa, and B. oleracea (a) Collinearity among the BnACTINs. Each chromosome of B. napus was indicated with different colors. The red lines represented the collinearity. (b) Synteny analysis of ACTIN genes between A. thaliana and B. napus. The gray lines indicate the whole genome collinear blocks between species, while the red lines emphasize syntenic ACTIN orthologs. The top orange rounded rectangle represents the A. thaliana chromosome, while the bottom green rounded rectangle represents the B. napus chromosome. (c) Synteny analysis of ACTIN genes between B. rapa and B. napus. The gray lines indicate the whole genome collinear blocks between species, while the red lines emphasize syntenic ACTIN orthologs. The top orange rounded rectangle represents the B. rapa chromosome, while the bottom green rounded rectangle represents the B. napus chromosome. (d) Synteny analysis of ACTIN genes between B. oleracea and B. napus. The gray lines indicate the whole genome collinear blocks between species, while the red lines emphasize syntenic ACTIN orthologs. The top orange rounded rectangle represents the B. oleracea chromosome, while the bottom green rounded rectangle represents the B. napus chromosome. (e) Radar charts showed the number of ACTINs orthologous and paralogous gene pairs across four Brassicaceae species.
Ijms 25 10752 g004
Figure 5. Violin plot of the pairwise Ka/Ks ratios among orthologous genes. Only orthologous gene pairs with Ks < 1 were considered. Wilcoxon Rank-Sum Tests were performed to identify significant differences among different categories of orthologous gene pairs, marked by an asterisk for p values less than 0.05. The violin plots feature dotted lines representing the lower, median, and upper quartiles. Comparisons between different species were presented in respective colors.
Ijms 25 10752 g005
Figure 6. The protein interaction network analysis of ACTIN proteins. (a) The BnACTIN PPI network is visualized, where red circles denote BnACTIN proteins and blue circles represent their interacting proteins. Interactions with BnACTINs are marked by grey lines and self-interactions among BnACTINs by yellow lines. (b) GO enrichment analysis is performed to assess the functional enrichment of proteins interacting with BnACTINs.
Ijms 25 10752 g006
Figure 7. Expression profiles of BnACTINs across various tissues and in response to diverse abiotic stressors. (a) Expression values of BnACTINs across several tissues were treated using log2 transformation for normalization, and a color spectrum was utilized to represent different expression intensities. (b) The number of BnACTINs with detectable expression in a variety of tissues is enumerated. (c) Expression values of BnACTINs in response to multiple abiotic stress were treated using log2 transformation for normalization, and a color spectrum was utilized to represent different expression intensities. (d) The number of BnACTINs with detectable expression in a variety of conditions is enumerated.
Ijms 25 10752 g007
Figure 8. Whole-genome association mapping analysis of BnACTIN37 in B. napus germplasm with 324 core collections. (a) Significant association of BnACTIN37 with primary flowering time. (b) The box plot exhibited a primary flowering time trait comparison between two haplotypes divided based on the most significantly associated SNP in BnACTIN37. (c) Significant association of BnACTIN37 with full flowering time. (d) The box plot exhibited a full flowering time trait comparison between two haplotypes divided based on the most significantly associated SNP in BnACTIN37. (e) Significant association of BnACTIN37 with plant height. (f) The box plot exhibited plant height trait comparison between two haplotypes divided based on the most significantly associated SNP in BnACTIN37. (g) Significant association of BnACTIN37 with main inflorescence silique density. (h) The box plot exhibited the main inflorescence silique density trait comparison between two haplotypes divided based on the most significantly associated SNP in BnACTIN37. (i) Significant association of BnACTIN37 with main inflorescence silique number. (j) The box plot exhibited the main inflorescence silique number trait comparison between two haplotypes divided based on the most significantly associated SNP in BnACTIN37. (k) Significant association of BnACTIN37 with first branch height. (l) The box plot exhibited the first branch height trait comparison between two haplotypes divided based on the most significantly associated SNP in BnACTIN37. (m) Protein–protein interaction network of BnACTIN37. (n) GO enrichment analysis of proteins interacted with BnACTIN37. ** indicated extremely significance (p-value < 0.01).
Ijms 25 10752 g008
Table 1. Duplication patterns of ACTIN paralogs across four Brassicaceae species (B. napus, B. rapa. B. oleracea, and A. thaliana).
SpeciesWGDTandemProximalTransposedDispersedTotal
B. napus800011091
B. rapa24007031
B. oleracea261 10037
A. thaliana40116021
Table 2. Overview of BnACTIN genes associated with important phenotypic traits in B. napus.
Agricultural Traits.Significantly Associated Genes
Primary Flowering Time (PFT)BnACTIN37
Full Flowering Time (FFT1)BnACTIN37
Plant Height (PH)BnACTIN37
Main Inflorescence Silique Density (MISD)BnACTIN37
Main Inflorescence Silique Number (MISN)BnACTIN37
Thioglycoside (THI)BnACTIN29
Stearic Acid (SA)BnACTIN29
Oleic Acid (OA)BnACTIN10
Eicosenoic Acid (EA1)BnACTIN10
Erucic Acid (EA2)BnACTIN10 BnACTIN36
First Branch Height (FBH)BnACTIN37
Disclaimer/Publisher’s Note: The statements, opinions and data contained in all publications are solely those of the individual author(s) and contributor(s) and not of MDPI and/or the editor(s). MDPI and/or the editor(s) disclaim responsibility for any injury to people or property resulting from any ideas, methods, instructions or products referred to in the content.

