Article

Modulation of the Arabidopsis Starch Metabolic Network by the Cytosolic Acetyl-CoA Pathway in the Context of the Diurnal Illumination Cycle

by
Lei Wang
1,2,†,
Carol M. Foster
3,†,
Wieslawa I. Mentzen
3,
Rezwan Tanvir
2,
Yan Meng
4,
Basil J. Nikolau
5,6,
Eve Syrkin Wurtele
3,6,* and
Ling Li
2,*
1
College of Life Sciences, Shihezi University, Shihezi 832003, China
2
Department of Biological Sciences, Mississippi State University, Mississippi State, MS 39762, USA
3
Department of Genetics, Development and Cell Biology, Iowa State University, Ames, IA 50011, USA
4
Department of Agriculture, Alcorn State University, Lorman, MS 39096, USA
5
Roy J. Carver Department of Biochemistry, Biophysics, and Molecular Biology, Iowa State University, Ames, IA 50011, USA
6
Center for Metabolic Biology, Iowa State University, Ames, IA 50011, USA
*
Authors to whom correspondence should be addressed.
These authors have contributed equally to this work.
Int. J. Mol. Sci. 2024, 25(19), 10850; https://doi.org/10.3390/ijms251910850
Submission received: 14 September 2024 / Revised: 2 October 2024 / Accepted: 4 October 2024 / Published: 9 October 2024
(This article belongs to the Section Molecular Plant Sciences)

Abstract

:
The starch metabolic network was investigated in relation to other metabolic processes by examining a mutant with altered single-gene expression of ATP citrate lyase (ACL), an enzyme responsible for generating cytosolic acetyl-CoA pool from citrate. Previous research has shown that transgenic antisense plants with reduced ACL activity accumulate abnormally enlarged starch granules. In this study, we explored the underlying molecular mechanisms linking cytosolic acetyl-CoA generation and starch metabolism under short-day photoperiods. We performed transcriptome and quantification of starch accumulation in the leaves of wild-type and antisense seedlings with reduced ACL activity. The antisense-ACLA mutant accumulated more starch than the wild type under short-day conditions. Zymogram analyses were conducted to compare the activities of starch-metabolizing enzymes with transcriptomic changes in the seedling. Differential expression between wild-type and antisense-ACLA plants was detected in genes implicated in starch and acetyl-CoA metabolism, and cell wall metabolism. These analyses revealed a strong correlation between the transcript levels of genes responsible for starch synthesis and degradation, reflecting coordinated regulation at the transcriptomic level. Furthermore, our data provide novel insights into the regulatory links between cytosolic acetyl-CoA metabolism and starch metabolic pathways.

1. Introduction

In plants, storage of carbohydrate, in the form of starch granules, provides a mechanism by which carbon and energy are stored and subsequently remobilized to sustain respiration, metabolism, growth, and development [1,2,3]. The complex regulatory mechanisms that direct the net accumulation of starch, and the integration of this metabolic network with central metabolism are key to the flow of carbon in planta. In leaves, diurnal synthesis and degradation of sugars and starch is thought to mitigate changes in the net pool of carbon metabolites [4]. However, many questions remain about the mechanisms of starch granule production and degradation and its integration with central metabolism [5,6,7,8,9,10,11,12,13,14,15]. Ultimately, clarifying the process of granule biosynthesis and unraveling interactions between starch metabolism and other metabolic pathways may broaden the functionality of starch for human use.
Starch granules accumulate and degrade in leaf chloroplasts during the light and dark cycles, respectively. Only a small amount of starch is retained at the end of a dark period [16,17,18,19,20]. Furthermore, starch accumulation is environmentally regulated, particularly by the length of the photoperiod. Thus, more starch accumulates when plants are grown in a short day (SD) photoperiod than in a long day (LD) photoperiod [17,21,22], providing for more carbon/energy resources during a longer night period [2].
Starch synthesis is initiated by the formation of ADP-glucose, the photosynthetically generated precursor. The accumulation of starch is modulated by the metabolic status of the plant and is sensitive to external and endogenous stimuli. Glucose and sucrose levels [23,24], illumination status [25,26,27], and the circadian clock [28,29] influence regulatory mechanisms that control the expression of genes implicated in balancing the metabolic production and consumption of starch. Turnover of starch in different tissues and organs in response to environmental fluctuations and nutrient availability is integrated by this regulatory network, thus maintaining the carbon balance throughout the plant [30,31,32].
One approach to understanding starch metabolism and its regulation in the context of other metabolic processes is to investigate single-gene mutants that perturb metabolism and characterize how starch accumulation is affected. One such mutation is in gene(s) that affect ATP citrate lyase (ACL) expression. ACL is the hetero-octomeric enzyme, composed of four A subunits and four B subunits (called ACLA and ACLB, respectively) [33,34,35]. ACL is an enzyme component of the citrate shuttle, which produces the cytosolic acetyl-CoA pool from exported mitochondrial citrate [36,37]. The cytosolic acetyl-CoA is the precursor for many biochemical pathways crucial to plant growth and development. Transgenic Arabidopsis antisense-ACLA plants that exhibit lower levels of ACL activity exhibit a distinct “bonsai” phenotype [33]. When these plants are grown in LD conditions, the leaves contain abnormally enlarged starch granules [33], indicating an imbalance between starch biosynthesis and mobilization.
To elucidate underlying molecular events involved in starch metabolism and its connection to cytosolic acetyl-CoA metabolism, we analyzed starch accumulation, starch metabolism enzyme activities, and global gene-expression patterns in WT and antisense-ACLA plants grown in an SD photoperiod. Our objectives were to determine how decreased cytosolic ACL activity affects the pathways involved in carbon metabolism and may lead to subsequent changes in metabolism throughout the plant.

2. Results

2.1. Phenotype of Antisense-ACLA Plants Is Dependent on the Length of the Growth Photoperiod

The antisense-ACLA plants grown under an LD photoperiod present a miniature and bushy “bonsai” phenotype, with very small dark leaves, which accumulate enhanced starch levels [33]. The experiments presented herein indicate that day length affects the penetrance of the antisense-ACLA phenotype. Specifically, when antisense-ACLA plants were grown under SD conditions, the plants at 42 days after planting (DAP) were smaller than the WT plants (Figure 1A,B). However, the difference between the mutants and WT was less pronounced than under LD conditions. Despite this, starch accumulation in the mutants remained significantly increased, more than doubling that found in WT plants (Figure 1C, p < 0.01).

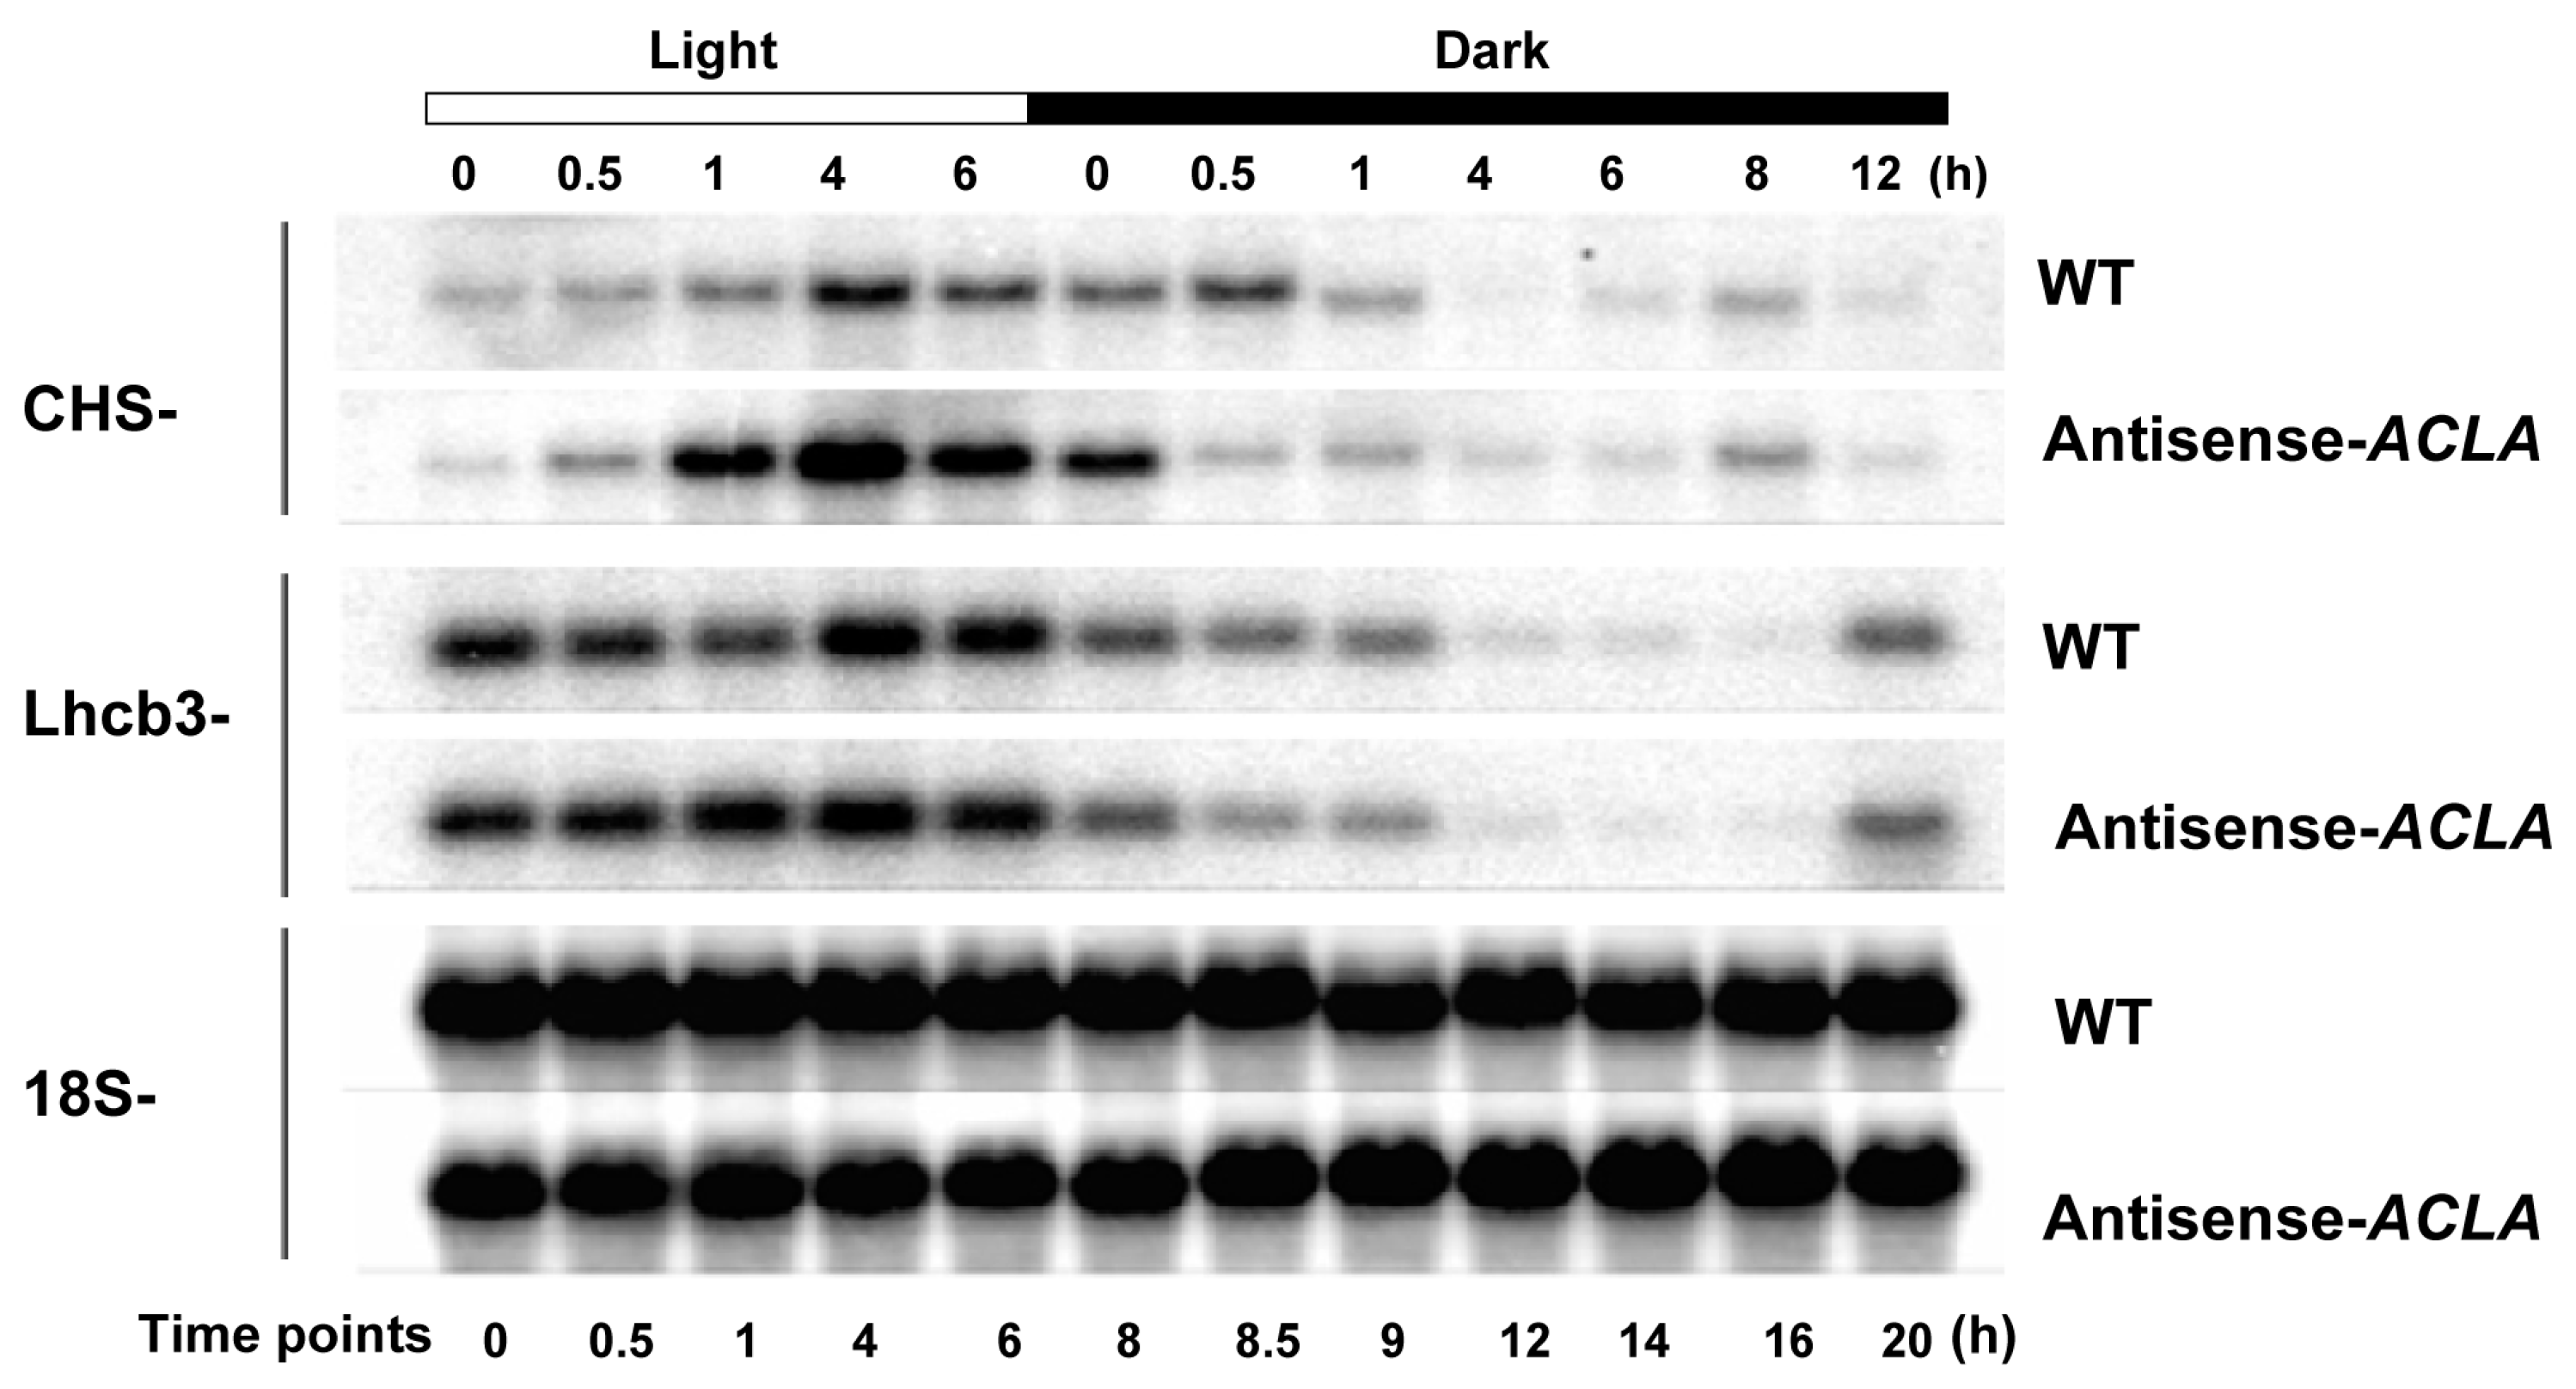
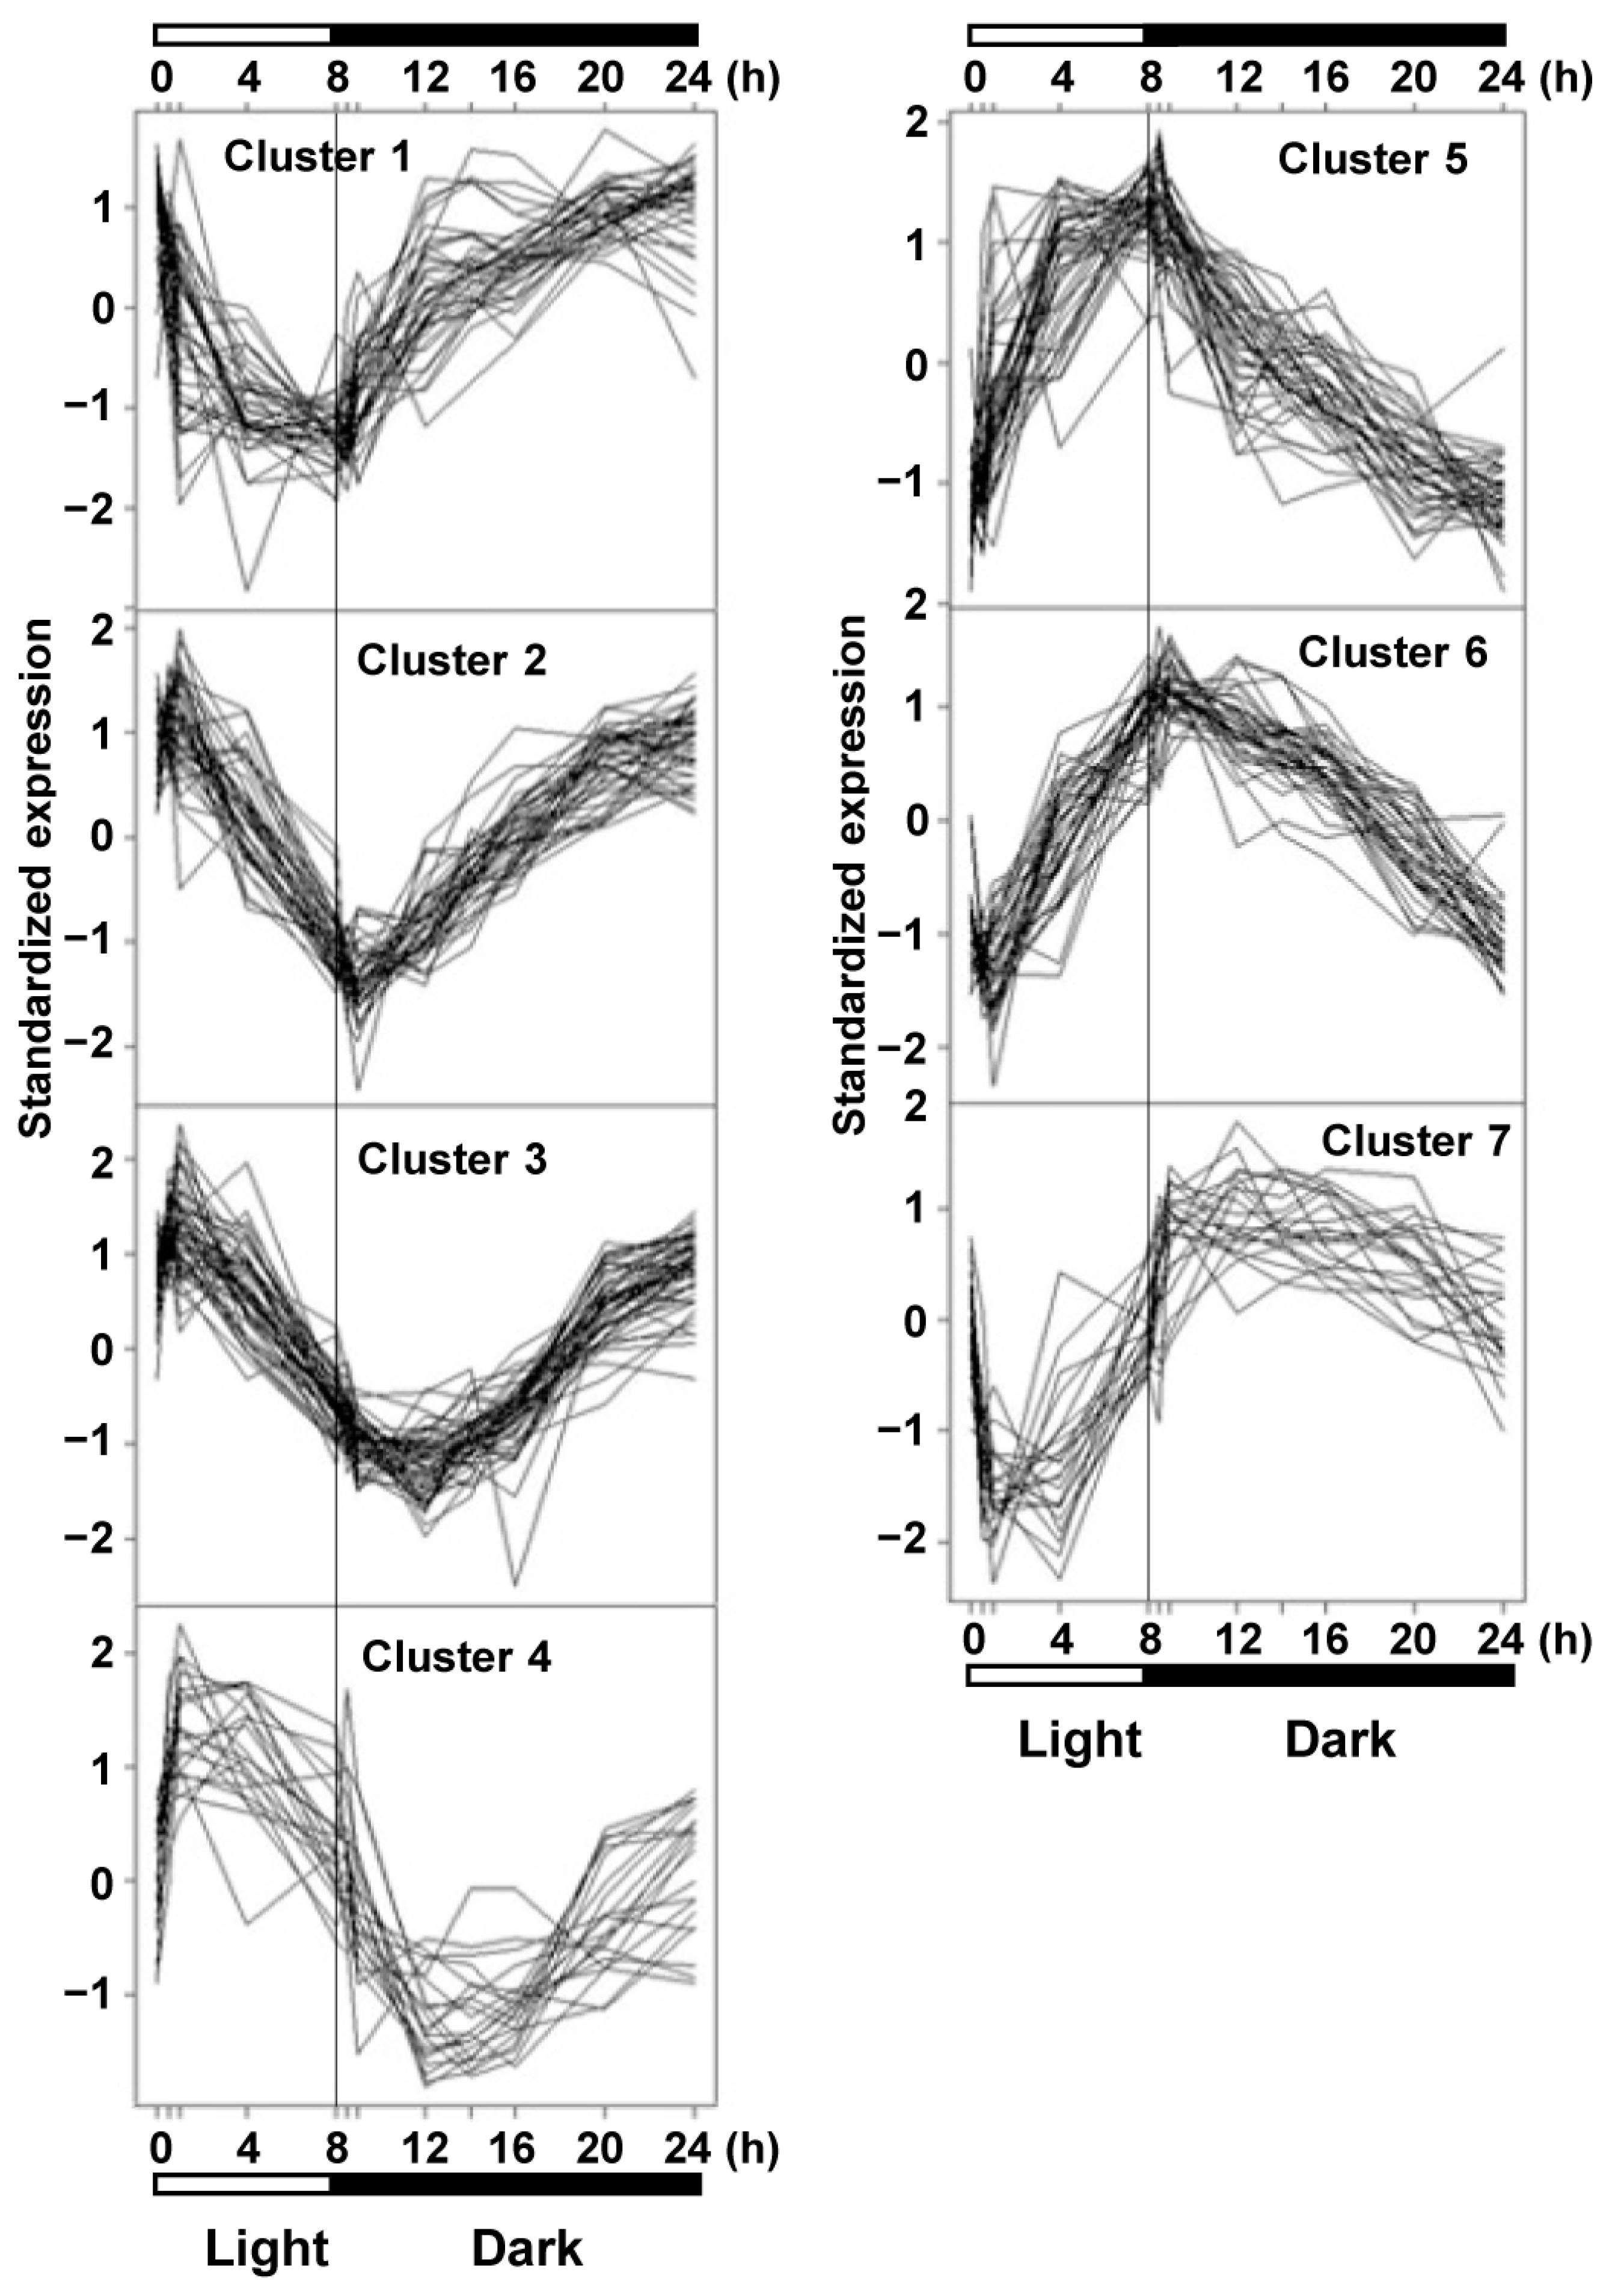
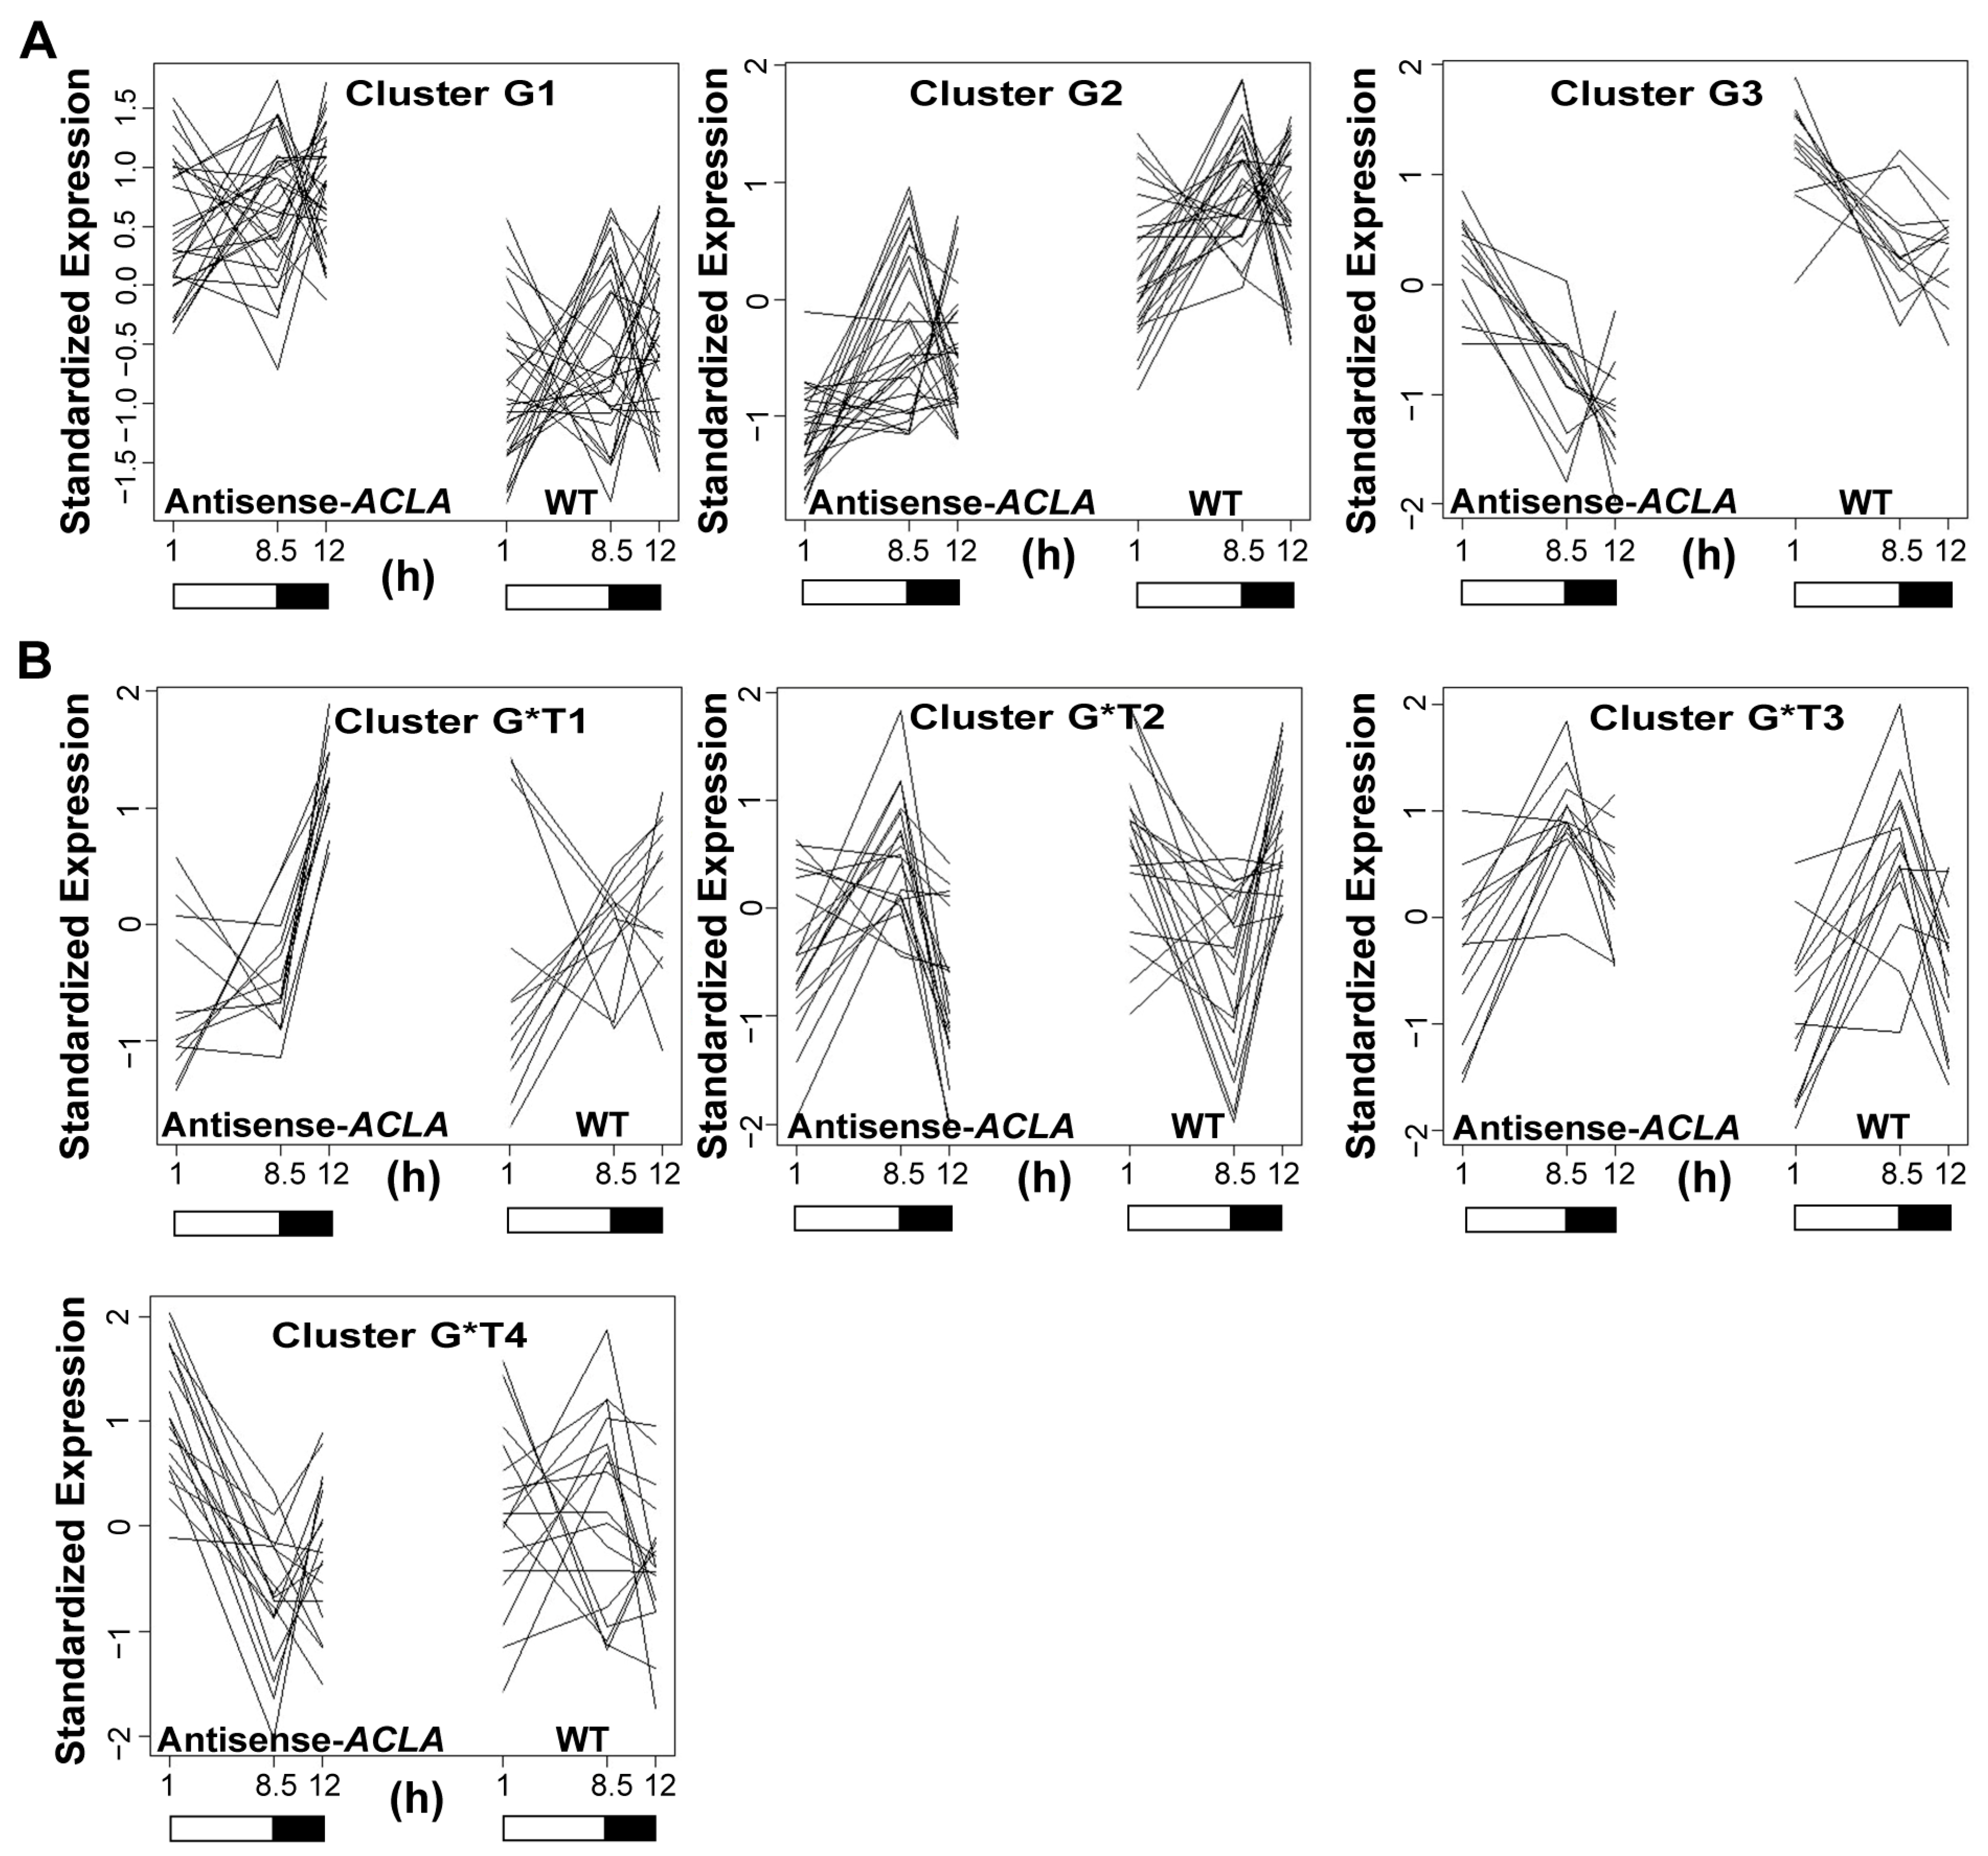
2.2. Fluctuation in Transcriptome under SD Diurnal Cycle: The Circadian Rhythm Is Not Altered by ACL Reduction

We monitored the accumulation of light-harvesting complex (Lhcb3) and chalcone synthase (CHS) mRNAs in an SD diurnal cycle in both WT and antisense-ACLA plants. These two light-regulated genes are known to show a diurnal or circadian rhythm under an LD photoperiod [28], but their expression pattern is unknown in an SD photoperiod. Northern blot analyses showed that both the Lhcb3 and CHS mRNAs display diurnal rhythms under SD, and their circadian expression behavior is unaffected by the antisense-ACLA mutation (Figure 2).
Previous studies reported diurnal changes in the transcriptome of starch metabolic genes in plants grown under an LD photoperiod [35]. Because the penetrance of the antisense-ACLA phenotype is reduced when plants are grown in the SD photoperiod, we compared gene expression in the WT plants grown in the SD photoperiod. Using statistical methods [36] that evaluate a p-value threshold of 0.00001, and false discovery rate (FDR) controlled at 0.00031, we identified 270 genes that showed significantly differential expressions over the 11 time points that were evaluated in the WT plants. We grouped these genes into seven clusters based on their accumulation patterns, as calculated by the K-medoids clustering method [37] (Figure 3 and Supplementary Table S1).
Clusters with genes showing different diurnal patterns of expression may represent distinct biological processes. This is illustrated, for example, by the genes that occur in Clusters 4 and 7. Specifically, Cluster 4 contains genes with the peak expression occurring in the light period; 25% of these genes code for chloroplast-localized proteins, and none code for mitochondrially localized proteins. In contrast, only ~10% of the Cluster 7 genes, which show their peak expression in the dark period, encode for chloroplast-localized proteins, and ~7.5% of these genes encoding mitochondrial-localized proteins (Supplementary Table S1).

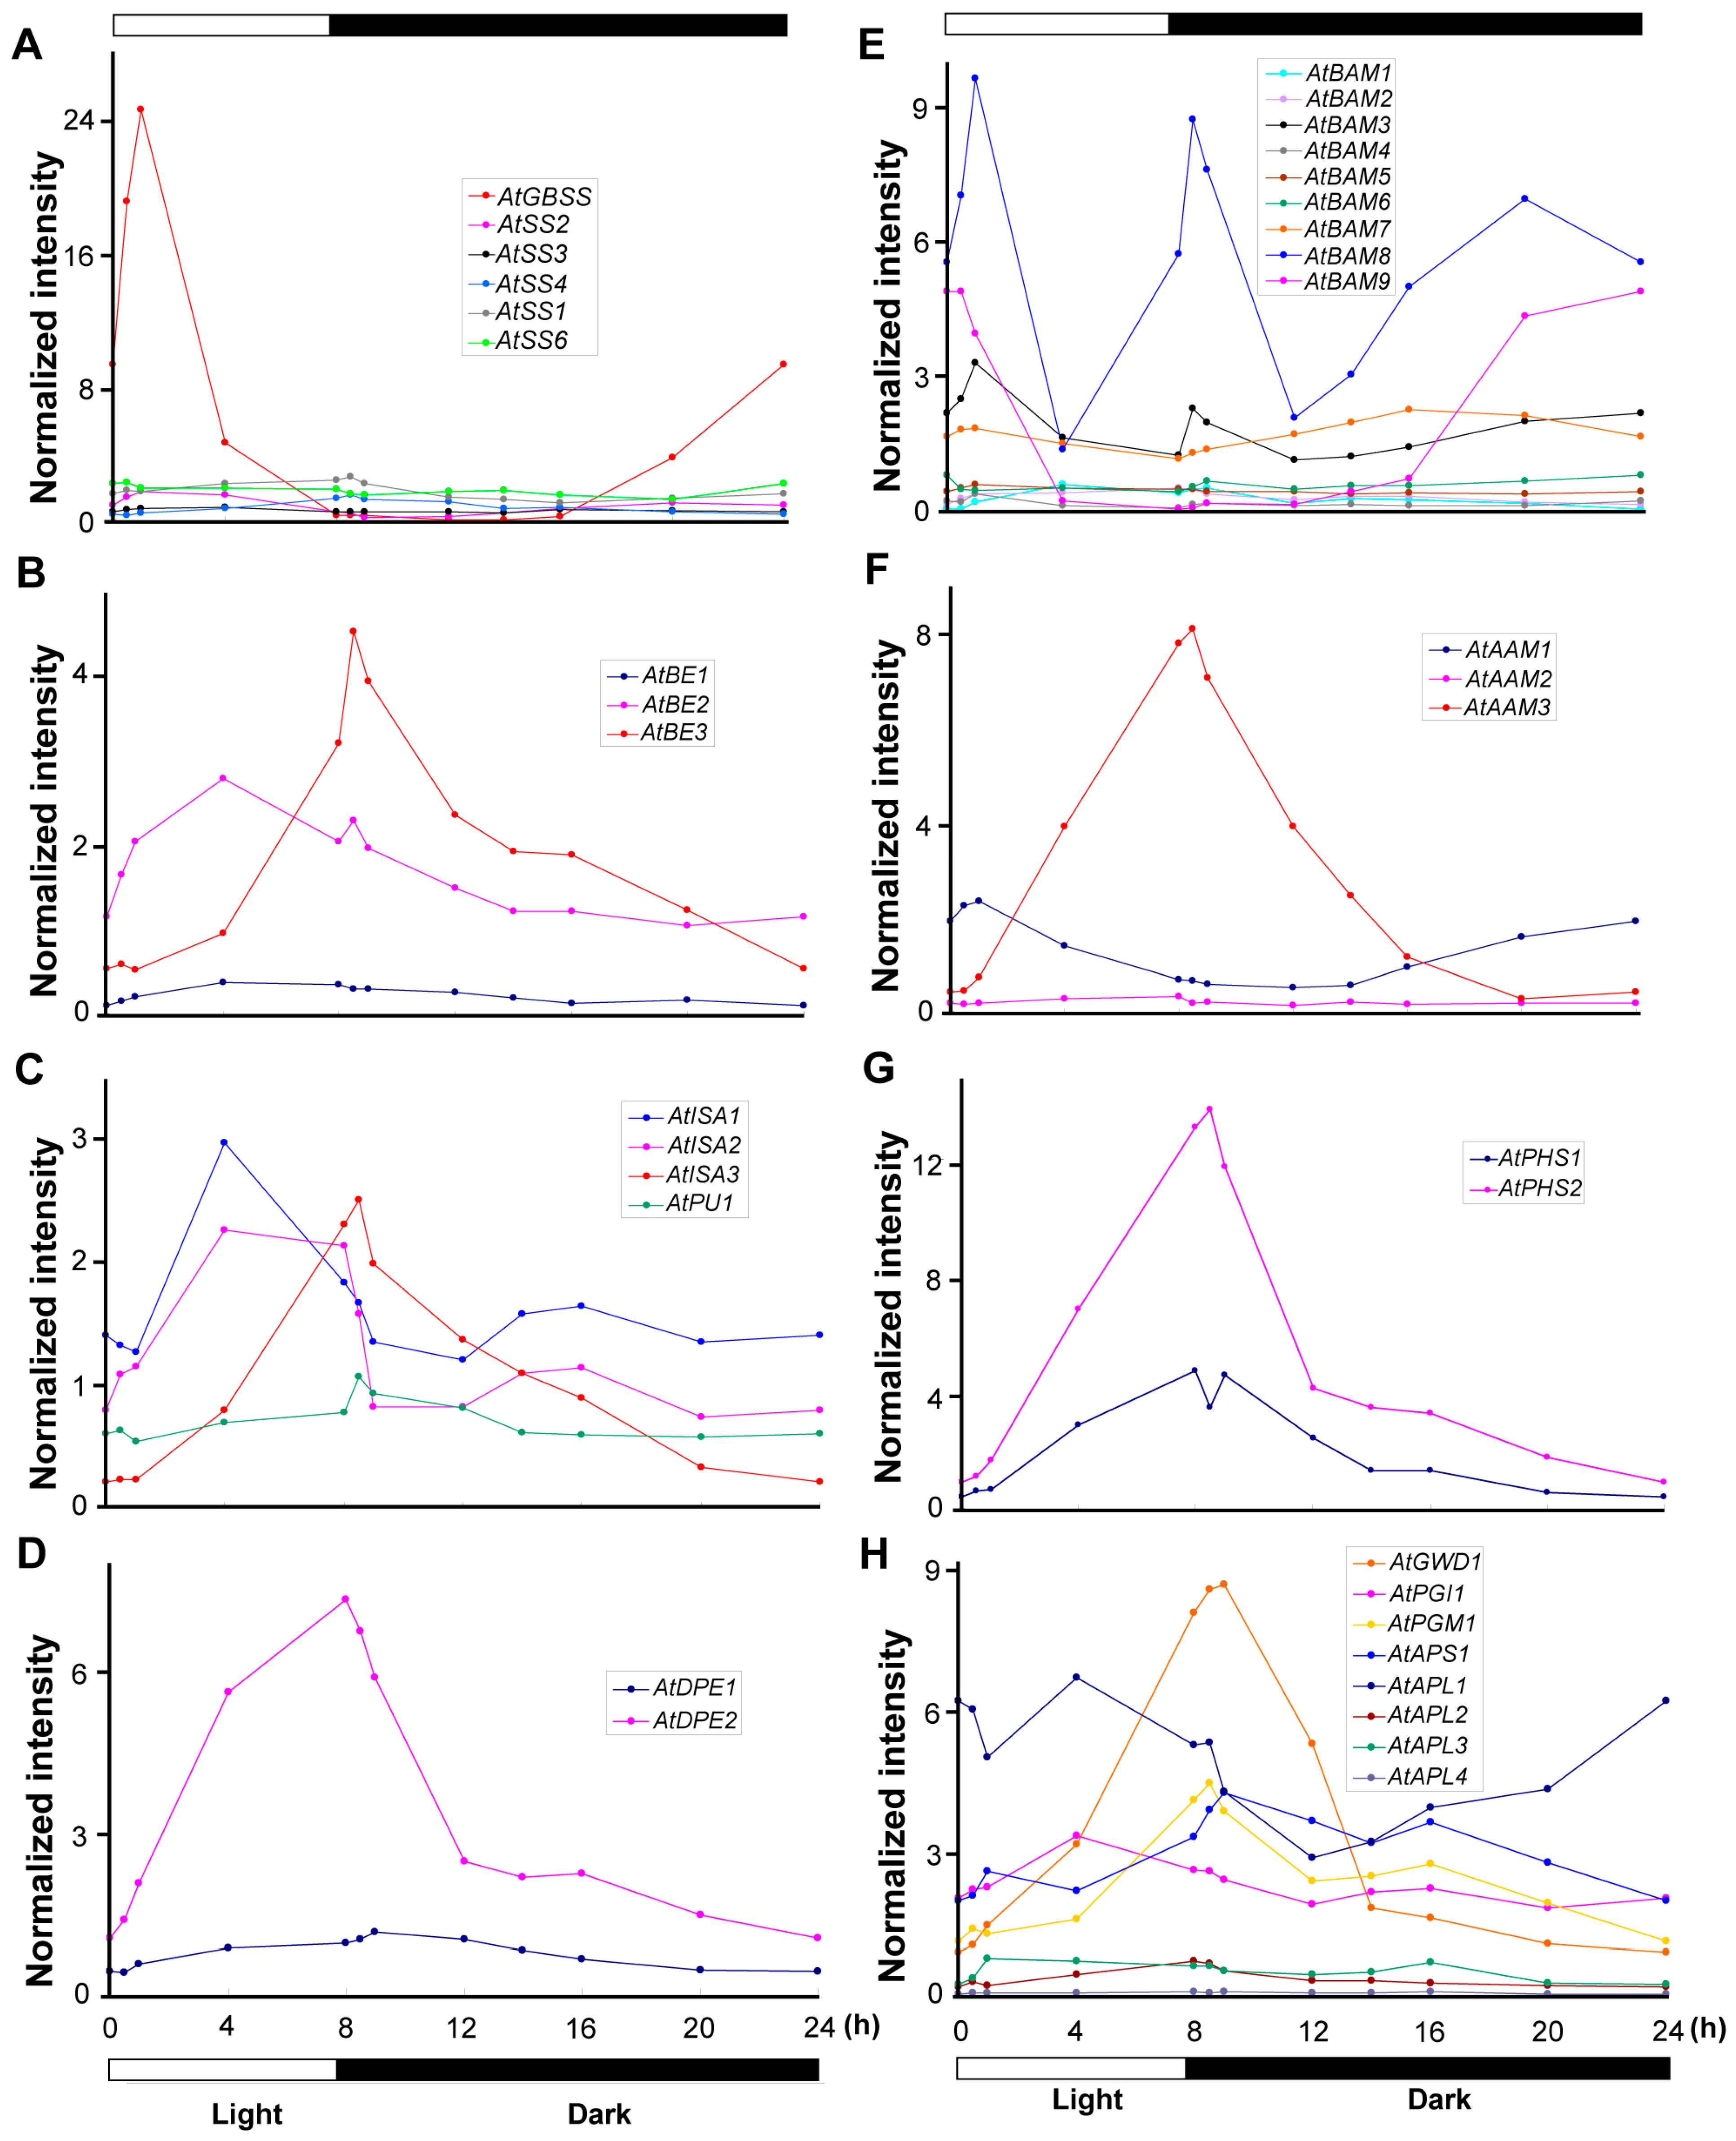
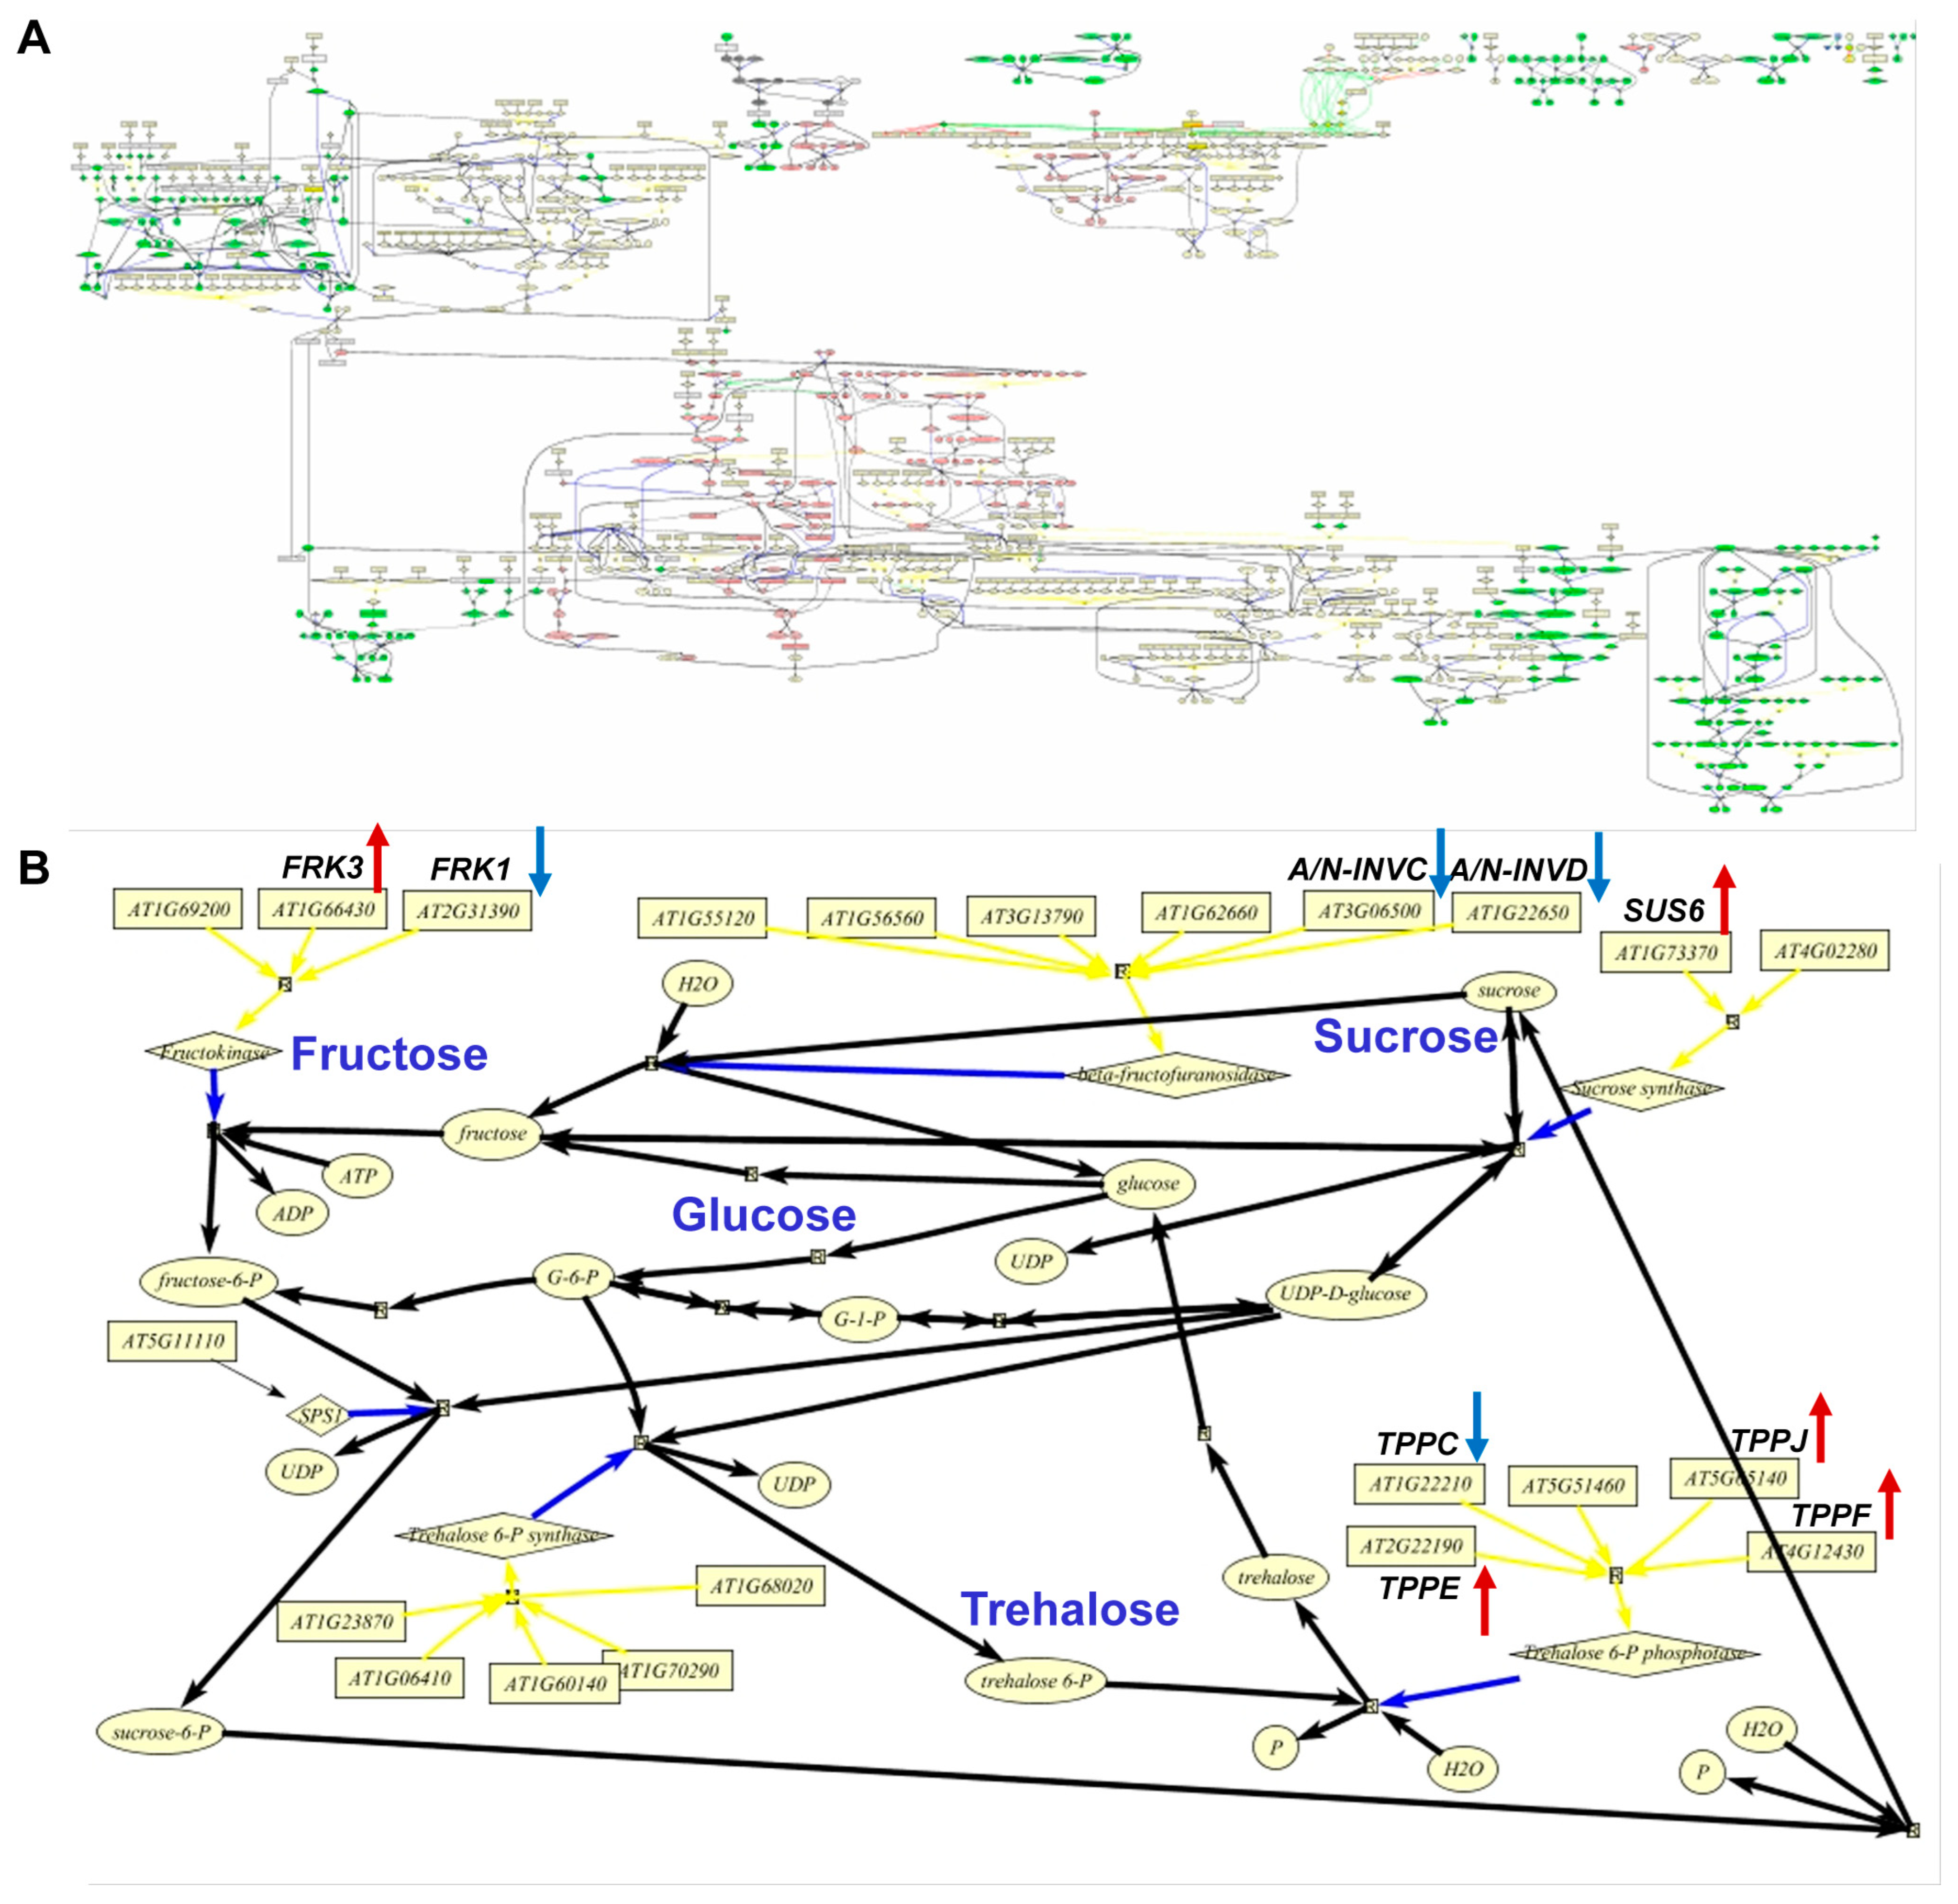
2.3. Expression of Genes Coding for Starch Biosynthesis and Degradation Enzymes in an SD Diurnal Cycle

The expression of genes encoding enzymes involved in starch metabolism fit into three patterns: (1) those that peak in the light period, (2) those that peak in the dark period, and (3) those that peak both in the light and dark periods (Supplementary Figure S1A–C and Table S2). Figure 4 shows the accumulation profiles of mRNAs coding for such starch metabolism enzymes, grouped by their biochemical activity (Supplementary Table S2).
Of particular interest, genes that are in Clusters 5 and 6, which show peak expression at the beginning of the dark period, include multiple genes that are responsive to cold stress (Supplementary Table S1). Specifically, this includes the DREB1 and DREB2 gene families, which activate cold-regulated genes or induce drought and/or osmotic stress genes [38] (Supplementary Table S1).
Starch synthases (SSs) transfer a glucosyl unit from ADP-glucose to a growing glucan chain, forming a new α-(1 → 4) linkage [39]. The accumulation patterns of SS mRNAs are distinct from one another (Figure 4A). AtGBSS produces amylose [40], and has a clear induction early in light period. Other SSs are expressed at much lower levels, and there is very little variation over the diurnal cycle. These latter enzymes include those that construct the linear glucan chains of starch (i.e., SS1, SS2, and SS3), as well as the starch initiating enzyme, SS4. Starch branching enzymes (BEs) hydrolyze α-(1 → 4) linkages and introduce α-(1 → 6) linkages into the starch polymer [39]. BE expression correlates with starch accumulation, peaking in the light period (Figure 4B).
Starch debranching enzymes (DBEs) hydrolyze α-(1 → 6) linkages [39]. AtISA1, AtISA2, and AtISA3 encode isoamylase-type DBEs, and AtPU1 encodes a pullulanase-type DBE. Figure 4C shows that AtISA3 expression peaks at the start of the dark period, which is consistent with its degradative function. AtISA1 and AtISA2 show a single mRNA accumulation peak that occurs at the beginning of the dark phase (0.5 h into the dark); this pattern of expression is consistent with their biosynthetic function in the light phase. The AtPU1 mRNA shows the lowest abundance among the DBEs, and its expression is not affected by the diurnal change in illumination.
Starch disproportionating enzymes (DPEs) catalyze the transfer of glucan residues between linear chains by cleaving and reforming α-(1 → 4) linkages. Thus, in the absence of DPE expression, less amylopectin accumulates [39]. AtDPE1 mRNA accumulation peaks at the onset of the dark phase, and it is expressed at much higher levels than AtDPE2 (Figure 4D).
Beta-amylases (BAMs) are α-(1 → 4)-specific hydrolases that remove glucan units from the non-reducing end of the starch polymer, stopping at α-(1 → 6) branch linkages. Although primarily involved in starch breakdown [5], elevated transcript levels during both light and dark periods may suggest alternative functions for AtBAM isoforms (Figure 4E). AtBAM8 has the highest mRNA accumulation of the BAM family, with three peaks—early light phase, beginning of the dark phase, and later hours of the dark phase. AtBAM9, a plastidial regulator involved in leaf starch degradation [41], peaks at the end of the dark and beginning of the light phase, with the lowest levels at the end of the light phase.
Alpha-amylases (AAMs) are also α-(1 → 4)-specific hydrolases that cleave within linear chains, attacking the starch granule surface to release soluble glucans for further degradation [5]. Of the three AAM isoforms, AtAAM3 shows the highest mRNA accumulation, which peaks in the transition from the light to dark photoperiod (Figure 4F).
Starch phosphorylases (PHSs) are involved in starch degradation by catalyzing the insertion of a phosphoryl group from inorganic pyrophosphate into an α-(1 → 4) glycosidic bond of the starch polymer, releasing glucose-1-phosphate [5]. AtPHS2 mRNA accumulation increases throughout the light phase, peaking at the onset of the dark phase, when starch granule disassembly begins (Figure 4G). Subsequently, levels diminish slowly during the dark phase, reaching the lowest level at the end of the dark period. AtPHS1 mRNA follows a similar pattern, but at lower levels than AtPHS2.
Other genes related to starch metabolism include the plastidial glucose-6-phosphate isomerase (PGI1), which catalyzes the interconversion of glucose-6-phosphate and fructose-6-phosphate; glucan water dikinase (GWD1), which catalyzes the addition of phosphate to starch through a dikinase-type reaction mechanism; phosphoglucomutase (PGM1), which catalyzes the interconversion of glucose-1-phosphate and glucose-6-phosphate; and ADP-glucose pyrophosphorylase (ADPG-PP), an allosteric enzyme that catalyzes the synthesis of the starch precursor, ADP-glucose [42,43,44]. Figure 4H shows that most of these enzymes show small diurnal modulations in the SD photoperiod, with the exception of AtPGI1 and AtPGM1, both of which show peak expression at the light-to-dark transition.

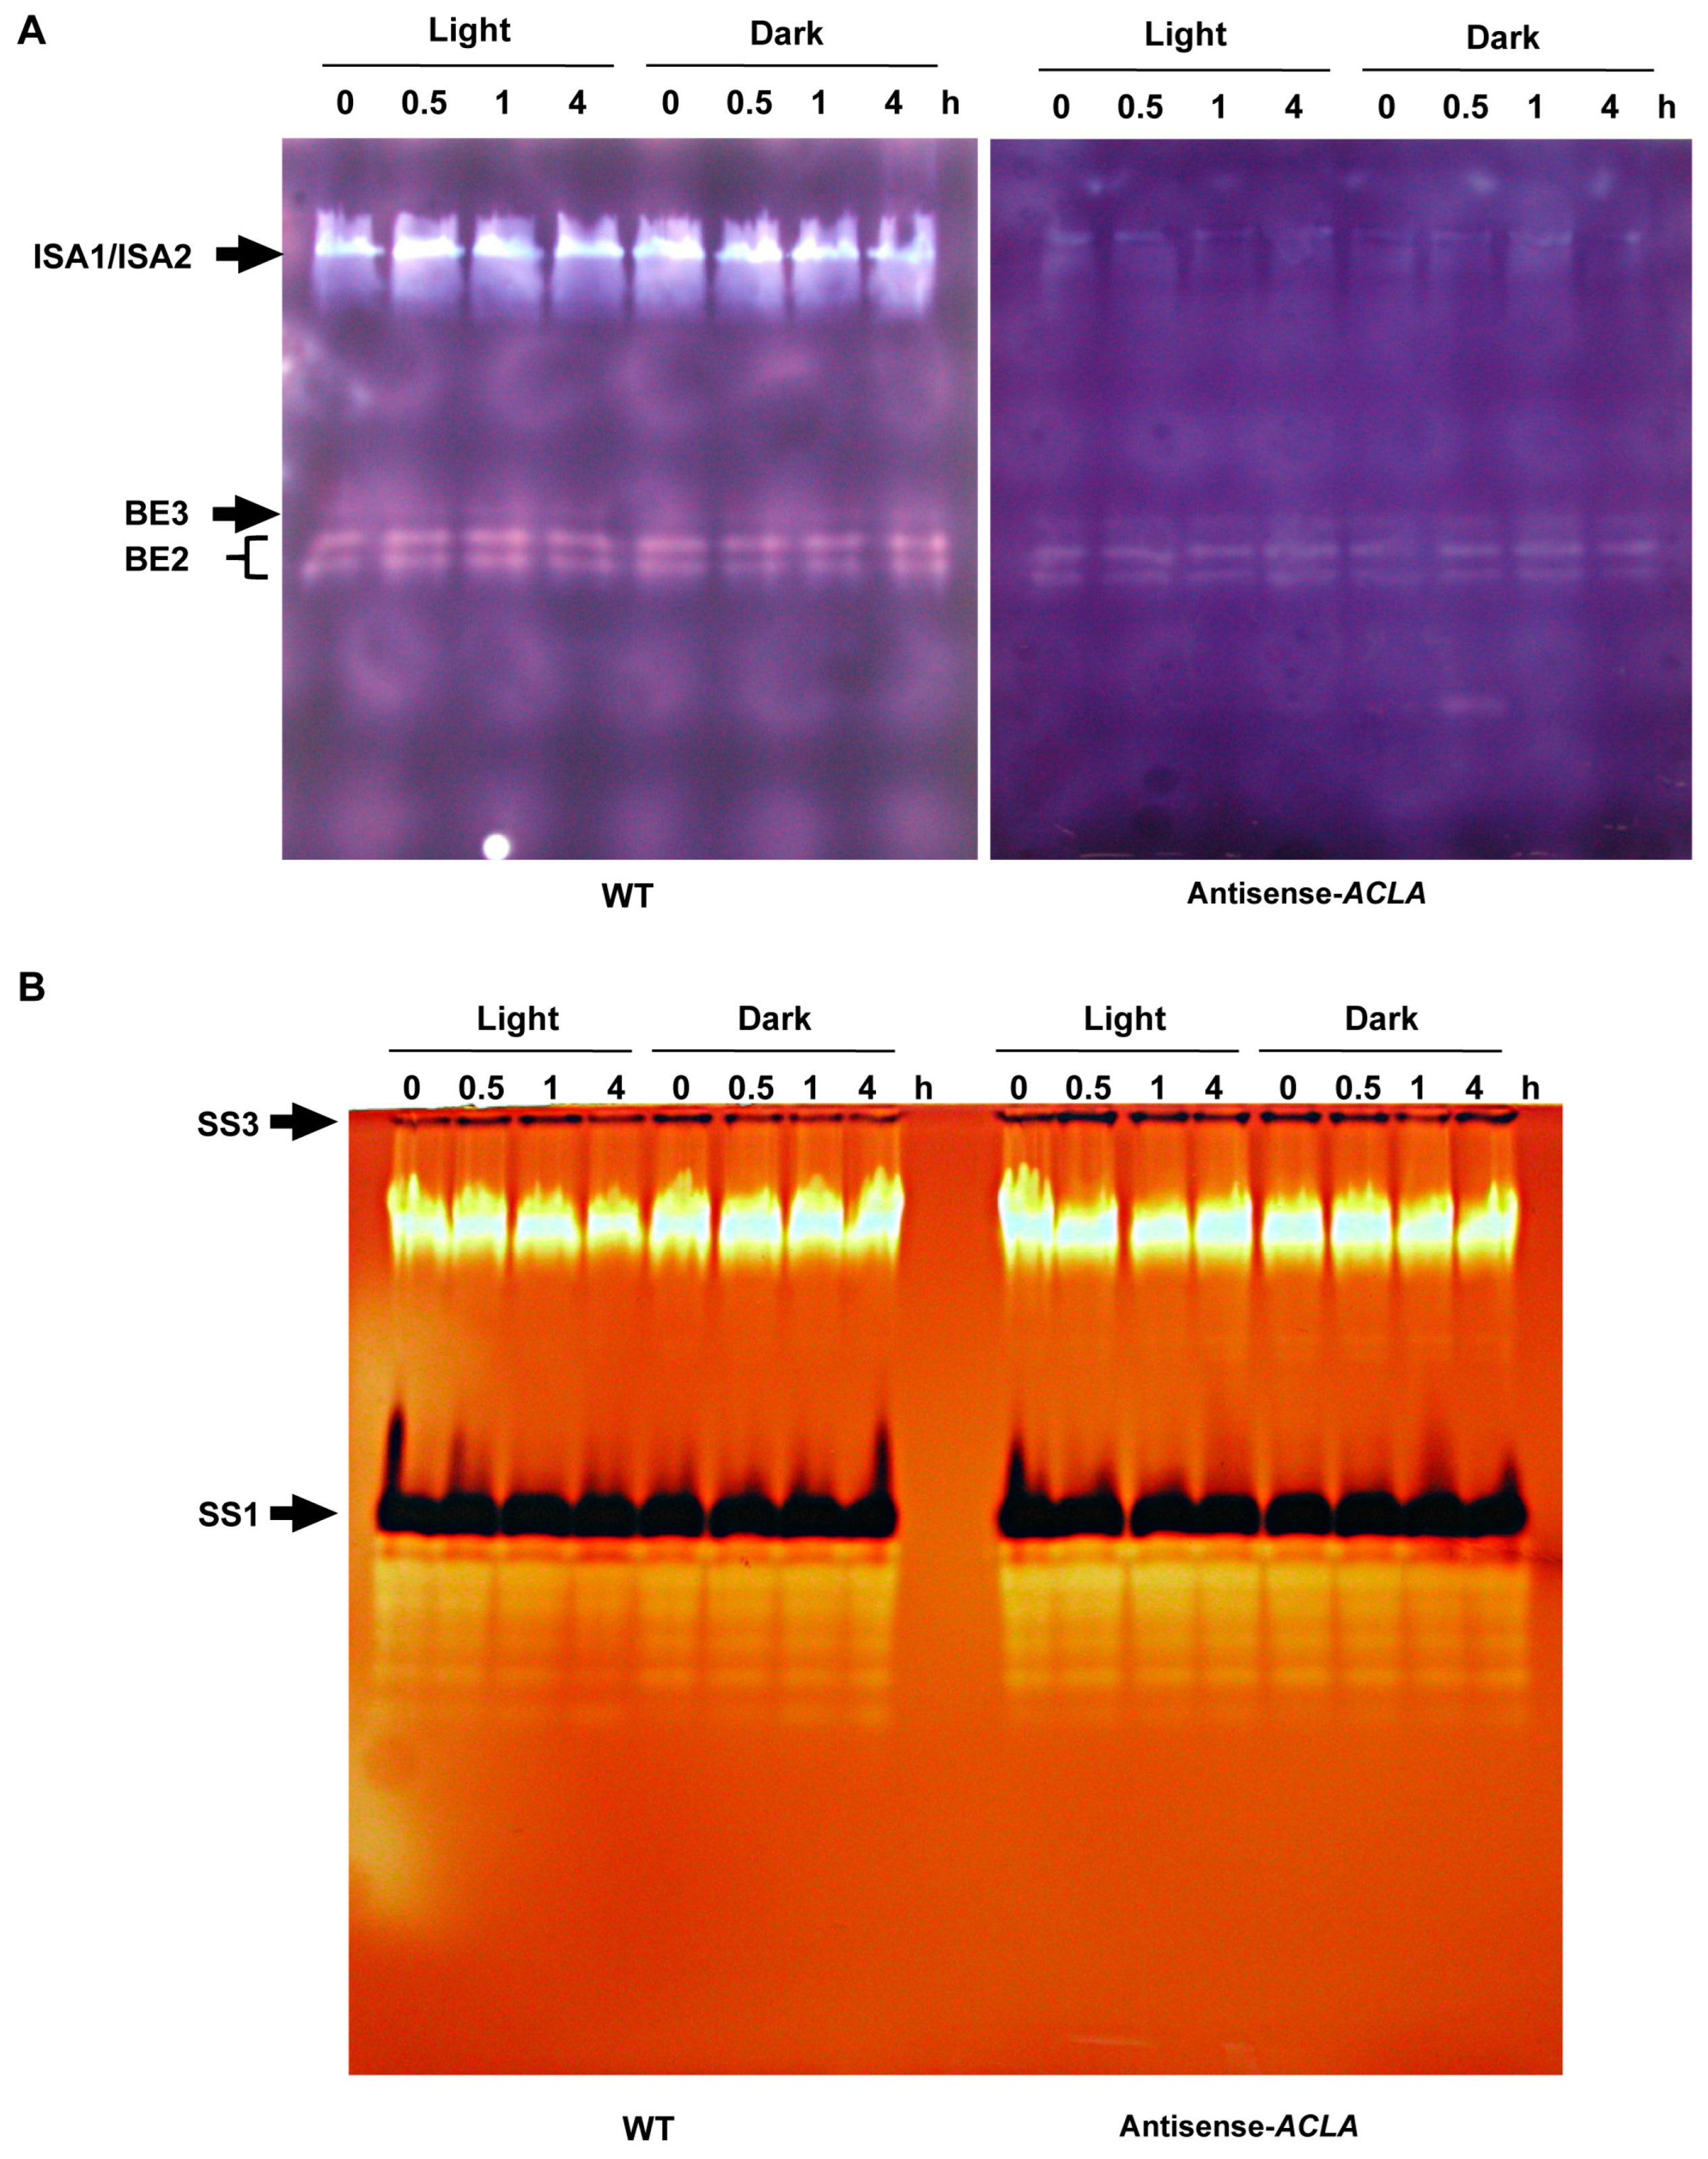
2.4. Antisense-ACLA Allele Affects Activities of Starch Metabolic Enzymes, without Affecting Their Diurnal Expression Pattern

The effect of the dominant antisense-ACLA allele on starch metabolic enzyme activities was visualized by the use of zymograms [45]. Specifically, protein extracts prepared from the rosette leaves of plants grown under the SD photoperiod were fractionated by electrophoresis in polyacrylamide gels containing solubilized potato starch. By staining the resulting gels with I2/KI, the relative migration distances and changes in the color of I2/KI-stained starch allowed for the detection and identification of DBEs and BEs [46]. Figure 5A illustrates the identification of the debranching enzymes (AtISA1/AtISA2) and branching enzymes (AtBE1 and AtBE2) [47,48]. The activities of these enzymes appeared unchanged across all time points during the diurnal light–dark cycle. Thus, these enzymes are equally active at night, when net starch degradation occurs, as during the day period, when starch is being synthesized. However, and more significantly, the activities of these starch degradation enzymes are significantly reduced in the antisense-ACLA mutant plants.
Analogous experiments conducted with glycogen-containing polyacrylamide gels detected soluble starch synthesis activities [49]. Specifically, such gels were incubated with the starch biosynthesis substrate, ADP-glucose, and stained with I2/KI. The dark blue bands in the light brown gel are due to starch, indicating starch synthase activity, with multiple colorless bands representing glycogen-hydrolyzing enzymes. These analyses identified two starch synthase isoforms, AtSS3 and AtSS1 [50,51,52], and several unknown glycogen-hydrolyzing enzymes (Figure 5B). None of these activities was affected by the diurnal light–dark cycle or by the antisense-ACLA allele.

2.5. The Antisense-ACLA Allele Causes Complex Alterations in Seedling Transcriptome

We profiled the transcriptome of antisense-ACLA plants as compared to the WT by microarray. Antisense-ACLA mutant and WT plants were grown in parallel under SD conditions and harvested at 42 DAI, and then RNA was extracted at set time points, with two replicates for each time point, in a split-plot experiment design (see Methods section for detail). Due to the diurnal fluctuations in gene expression, we selected three time points for analysis: (1) 1 h after the start of the light period, (2) 0.5 h after the start of the dark period, and (3) 4 h after the start of the dark period. Our comparative analysis focused on genes differentially expressed across all three time points, as well as at individual time points.
While comparing the global gene-expression profiles across the three time points (i.e., the Genotype comparison), we identified 69 genes that were significantly differentially expressed between the antisense-ACLA and WT plants when FDR was controlled at 0.2 [53]. These genes were grouped into three clusters (G1, G2, and G3) using the K-medoids clustering method (Figure 6A and Supplementary Table S3). Although about 15% of the genes within each cluster have unknown functions (i.e., annotated as “expressed protein” or “functions unknown”), we were able to extract biological meanings associated with each cluster, based on the remainder of the genes whose functions had been characterized. Specifically, genes in Cluster G1 showed increased expression in the antisense-ACLA plants relative to the WT, and these genes are involved in such processes as transcription regulation, protein post-translational modification, cell wall metabolism, secondary metabolism (e.g., flavonoids), lipid metabolism (e.g., steroids), hormone metabolism (e.g., auxin and ethylene), and stress response. Genes in Clusters G2 and G3 were expressed at lower levels in the antisense-ACLA plants than WT, and they are involved in such processes as stress response, transcription regulation, cell wall metabolism, secondary metabolism (e.g., flavonoids), hormone metabolism (e.g., auxin), and protein metabolism.
In the “Genotype*Time” comparison, which examines the interaction between genotype (wild type vs. antisense-ACLA) and various time points in the diurnal cycle, 61 genes showed significant differences in expression when FDR was restricted at 0.45 [53]. This analysis helps determine how gene-expression changes over time differ between the two genotypes. The K-medoids clustering method identified four gene clusters, labeled G*T1, G*T2, G*T3, and G*T4 (Figure 6B and Supplementary Table S4). These clusters contain genes that show expression patterns that differ from the “Genotype” comparison. The genes in Clusters G*T1, G*T2, and G*T4 show expression patterns in which the diurnal cycle pattern is flipped by the antisense-ACLA mutation, as compared to that shown in the WT plants. These genes are annotated as being involved in protein post-translational modification, cell wall metabolism, hormone metabolism, and stress response. Cluster G*T3 contains genes encoding glycosyl hydrolase family of proteins.
In addition, we used MetNetDB [55] to analyze these transcriptomics data in the context of annotated metabolic pathways. A gene was considered to have altered expression between the antisense-ACLA and WT plants if, at any single time point, the error bars in the expression level of that gene did not overlap between the two genotypes. Based on the resulting lists of the up-regulated and down-regulated genes, several metabolic pathways were identified to be affected by the antisense-ACLA allele (Table 1). These included pathways of fatty acid elongation, cutin biosynthesis, mevalonate pathway, biotin biosynthesis, brassinosteroid biosynthesis, and chlorophyll biosynthesis, which were up-regulated. And pathways that were down-regulated included brassinosteroids signaling; abscisic acid/Indole-3-acetic acid/jasmonic acid biosynthesis; sulfur-containing amino acid biosynthesis (e.g., homocysteine and cysteine interconversion and cysteine biosynthesis); APX1 (ascorbate peroxidase) signal transduction; pathways that regulate active oxygen levels, including ascorbate glutathione pathway (cytosol, mitochondria, and plastid stroma); ascorbate biosynthesis; and the ascorbate glutathione cycle.
Moreover, we focused on metabolic pathways that direct carbon to sugars and starch accumulation and on pathways that are sensitive to carbon signaling. These analyses identified 35 genes that are involved in trehalose and cell wall metabolism, which showed altered expression over the three time points that were evaluated (Table 2). These genes exhibited at least a 2-fold change in expression between antisense-ACLA and WT at one or more time points. Collectively, therefore, these differentially expressed genes identify processes involved in cell wall, trehalose, starch, sucrose, and acetyl-CoA metabolism pathways, which can be integrated into a small network (Figure 7A), as illustrated by the data shown in Figure 7B.

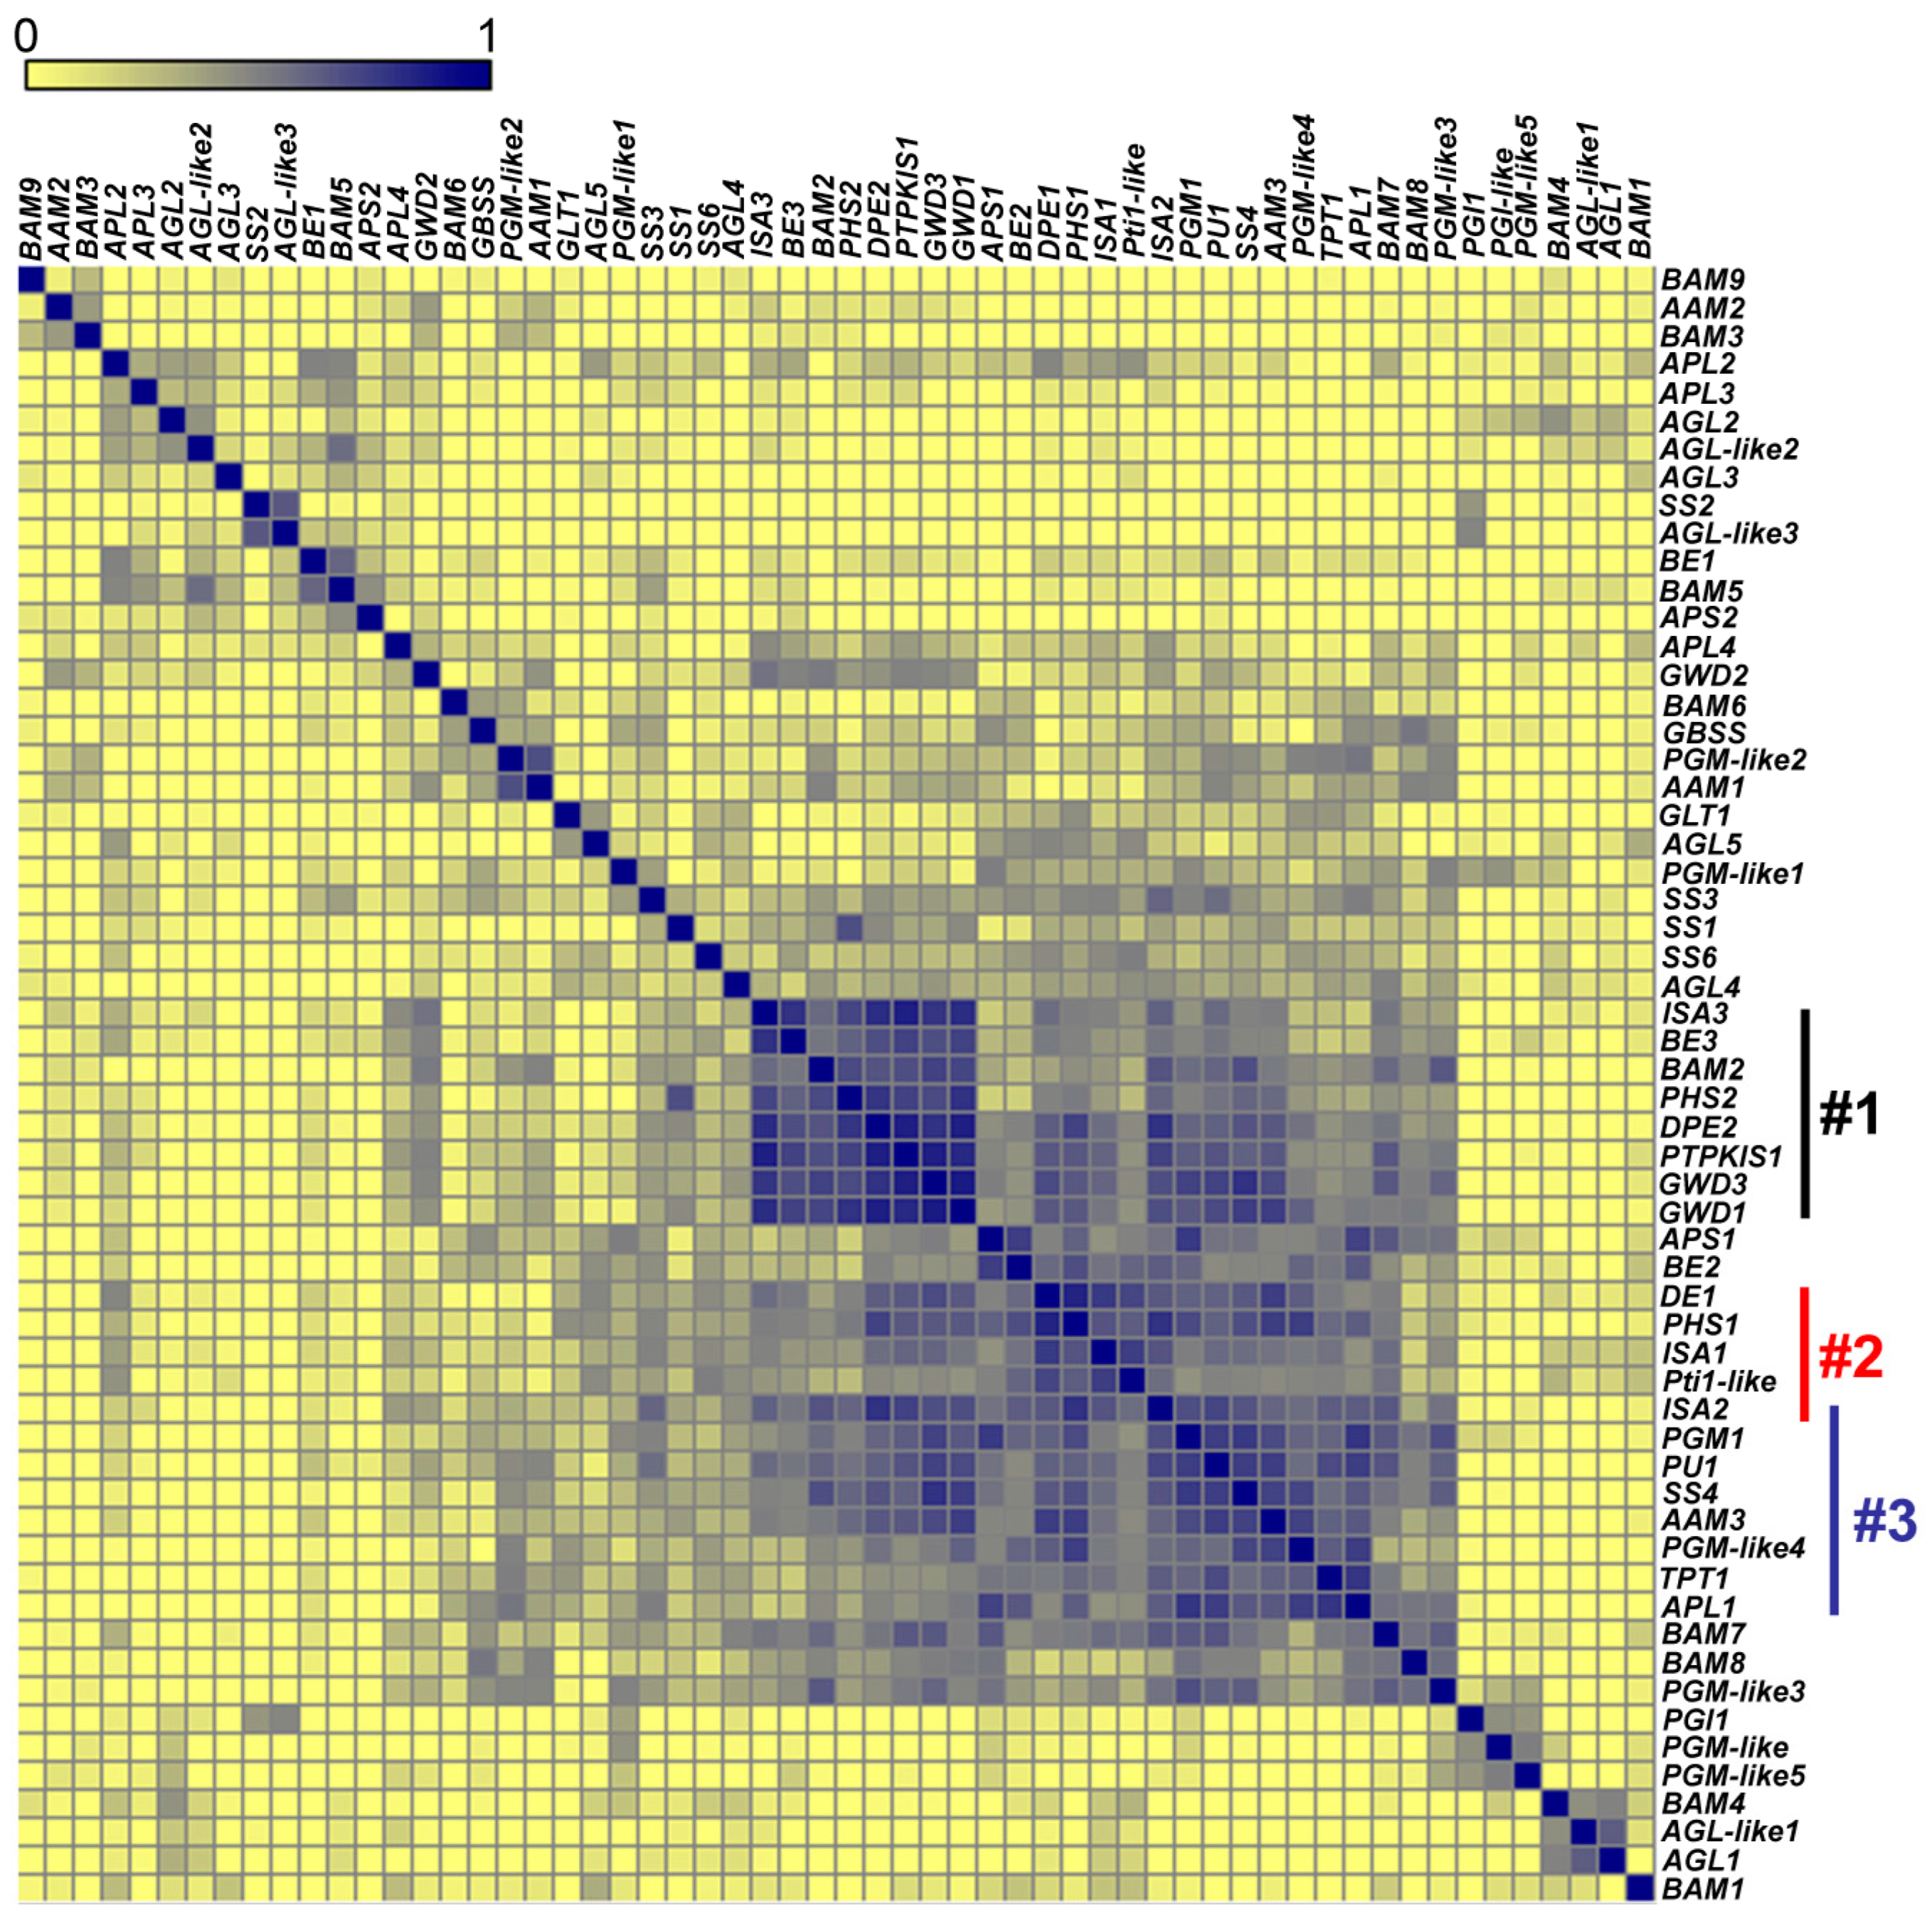
2.6. Co-Expression of Starch Metabolic Genes across Diverse Microarray Experiments

We also compared expression profiles of starch metabolism genes from a co-normalized set of publicly available microarray data available at the Nottingham Arabidopsis Stock Centre microarray (NASCArray) database [56,57]. These data were collected from nearly 1000 chips representing 70 Arabidopsis Affymetrix ATH1 microarray experiments. These experiments assessed the expression pattern of ~23,000 Arabidopsis genes, whose expression was modified by numerous perturbations, including mutations, organ types, stage of development, and in response to biotic and abiotic stresses. To facilitate the custom analysis of such a large number of microarray chip data and the associated metadata of each experiment, we used an open-source software, MetaOmGraph (MOG, accessed on 2 January 2020) [58].
Initially, using Pearson correlation as a similarity measure, we compared the expression patterns of 58 genes that are known to be members of the starch metabolic network, which would be expected to show high correlations. These included starch metabolic genes and putative regulators of starch metabolism (i.e., PTPKIS1 and Pti-like protein). The majority of the selected genes (53 out of the 58 genes) showed the expected high correlation (Figure 8). The five genes that showed low correlations with the other members of the starch metabolic network included (BAM9, AAM2, BAM3, BAM6, and BAM1).
These correlation calculations identified three distinct groups of strongly co-expressing genes (Figure 8):
Group 1:
DPE2, GWD1, GWD3, PHS2, SEX4, ISA3, BAM2, and BE3.
Group 2:
The starch synthesis genes (ISA1 and ISA2), DPE1, PHS1, and the gene encoding Pti1-like protein.
Group 3:
ISA2, SS4, and APL1 (At5g19220) involved in starch synthesis; PU1 and AAM3 (chloroplastic, glycogen catabolism) linked to degradation; and triose phosphate/phosphate translocator gene (TPT1, At5g46110), phosphoglucomutase 1 (PGM1, At5g51820), and a PGM-like4 (At1g70820) critical to carbon flux.
Genes in Group 1 are primarily involved in starch degradation, whereas Group 2 genes are associated with starch synthesis and its regulation, and Group 3 genes are a mixture of both starch synthesis and degradation genes, as well as genes associated with broader carbohydrate metabolic processes. Collectively, these genes represent distinct yet interconnected roles in the metabolic processes governing starch synthesis, degradation, and overall carbohydrate metabolism in plants.
Similarly, using Pearson correlation as a similarity measure, we searched for genes with expression patterns similar to ISA1 (At2g39930). We chose the ISA1 gene for these analyses because it plays an important role in starch biosynthesis, possibly as a member of a protein complex with ISA2 (At1g03310) [59]. In addition, in plants grown in SD conditions, the accumulation for both ISA1 and ISA2 mRNA peaked during the light phase (Figure 4C). These analyses enabled us to identify potential starch synthesis genes by the correlation with ISA1 expression, and this would include the expected high correlation with the ISA2 mRNA.
Indeed, the expression of ISA2 showed the highest correlations with the ISA1 mRNA (Table 3). In addition, eight genes showed a correlation coefficient with ISA1 mRNA that was higher than 0.66 (Table 3). Notably, three of these genes, DPE1 (At5g64860), PHS1 (At3g29320), and ROOT CAP 1 (RCP1, At5g17520), are known to participate in starch degradation [60,61]. RCP1, previously known as MEX1, is a chloroplastic maltose transporter that is critical during starch degradation. Pti1 (At1g26150) encodes a putative serine/threonine kinase, similar to Pto kinase interactor 1 [62], which is involved in plant–pathogen interactions [62,63]. The high correlation between the Pti1 kinase and ISA1 suggests that phosphorylation is important during starch metabolism. Other genes that co-express with ISA1 include D-cysteine desulfhydrase (At1g48420), which breaks down cysteine to produce pyruvate, ammonia, and sulfuric acid in mitochondrion [64], and two genes with unknown functions, mitochondrial At3g60810 and chloroplastic At4g10470.
An additional expression correlation study was conducted with the DPE2 gene (Figure 9). We selected the DPE2 gene because the DPE2 mRNA accumulates during the dark phase of growth [65,66]. Using MOG-based analysis, we found expression profiles for nine genes (correlation coefficients from 0.72 to 0.84) to be similar to DPE2 (Figure 9). Six of these genes—GWD1 (At1g10760), GWD3 (At5g26570), ISA2 (At1g03310), ISA3 (At4g09020), PHS1 (At3g29320), and PHS2 (At3g46970)—are also involved in starch degradation. DPE2 showed the highest correlation with PTPKIS1/SEX4, At3g52180, a novel tyrosine phosphatase that dephosphorylates proteins associated with the SnRK complex [67]. Inactivation of the SnRK complex affects vital metabolic enzymes, such as sucrose synthase and sucrose phosphate synthase, and may alter global responses to carbon and stress signaling [68]. Our data align with previous findings [69] from the Stanford Microarray Facility, showing that PTPKIS1 and PHS2 have similar expression profiles. The strong correlation of PTPKIS1 expression with the DPE2 co-expression group suggests a link between PTPKIS1 and carbohydrate metabolism, a hypothesis confirmed by experimental data [70]. SEX4 is involved in starch degradation.

3. Discussion

At the biochemical level, a metabolic process can be defined as a network of enzymes and their regulators that collectively results in the net conversion or accumulation of defined metabolites. Additionally, the advent of whole-genome expression profiling technologies has provided a means of defining biological processes as a collection of co-expressing genes [71,72,73,74]. In this paper, we considered these two definitions in the context of the starch metabolic network. Starch accumulation is the balance between anabolic processes that assemble the polymer from ADP-glucose and catabolic processes that depolymerize starch to generate sugar monomers. In photosynthetic leaf tissue, the balance between anabolic and catabolic divisions of the starch network is diurnally regulated [75,76], resulting in the net accumulation of starch during the light period, which is degraded during the dark period in order to maintain cellular respiration, metabolism, growth, and development. In this context, starch anabolism requires the following gene-products: ADP-glucose pyrophosphorylase (AGPase), SS, BE, and DBE. And starch catabolism requires the following gene products: AAM, BAM, DBE, DPE, and PHS.
In this study, we sought to expand the starch metabolic network by applying global transcriptomic analysis to a genetic mutant (i.e., the antisense-ACLA mutant) and environmental modifiers (i.e., SD diurnal photoperiod), which perturb the normal patterns of starch accumulation. Specifically, we followed up on the discovery that reducing the supply of the cytosolic acetyl-CoA-pool by the transgenic expression of a dominant antisense-ACLA allele results in the hyperaccumulation of leaf starch [33]. Hence, because the cytosolic acetyl-CoA metabolic network is distinct from the starch metabolic network, we hypothesized that genes whose expressions are altered by the antisense-ACLA allele and whose expressions are correlated with the known members of the starch metabolic network could be considered as members of an expanded starch metabolic network. However, the transgenic antisense-ACLA allele affects not only starch accumulation but also a range of other morphological traits, which could complicate the analysis. In this study, we found that when the antisense-ACLA plants were grown in an SD photoperiod, their abnormal morphological phenotypes were nearly eliminated, yet the hyperaccumulation of leaf starch was still maintained.
It is well known that there are major metabolic changes that occur in the light–dark transition during a diurnal cycle, particularly associated with photosynthetically derived central carbon metabolism, including the accumulation of starch [76], amino acids [77], and fatty acids [78]. Indeed, a prior transcriptomic analysis performed during an LD diurnal cycle identified that both transcriptional and post-translational regulatory mechanisms modulate the expression of the starch metabolic network genes and thereby affect the cyclical daily pattern of starch accumulation in leaves [38]. In the study presented herein, with plants grown in an SD diurnal cycle, the genes that showed the most modulation during the diurnal cycle were grouped into seven co-expressing gene clusters. Many of these clusters appear to be enriched with genes that are associated with stress responses. For example, the co-expressing genes COR, ERD, CCR, and AtGRP in Clusters 5 and 6 are known to be cold-regulated [79,80,81].
In contrast to the seven patterns of co-expression obtained with the genes that show the most modulation during the diurnal cycle, the genes of the starch metabolic network showed three patterns of co-expression. Two of these patterns are consistent with the diurnal cycle of starch accumulation and degradation. Namely, genes of starch degradation (i.e., DPE2, GWD1, GWD3, PHS2, SEX4, ISA3, BAM2, and BE3) are co-expressed and showed peak expression in the dark period, whereas the genes involved in starch biosynthesis (i.e., ISA1, ISA2, PHS1, and DPE1) are co-expressed and showed peak expression in the light period. The zymogram analysis of starch anabolic and catabolic enzymes does not necessarily reflect the diurnal changes observed for the transcript of these genes, suggesting that a post-transcriptional mechanism regulates the processes of starch biosynthesis and catabolism. Moreover, these zymograms indicate that the increased accumulation of starch in the antisense-ACLA plants is due to diminished starch degradation activity, while starch synthase activity remains unchanged.
The antisense-ACLA allele caused changes in the expression of genes involved in pathways that rely on acetyl-CoA as a substrate. These include the up-regulation of several genes involved in fatty acid elongation, secondary metabolite production (e.g., cutin), and hormone biosynthesis (e.g., brassinosteroids). However, the antisense-ACLA allele also generated the down-regulation of genes involved in stress-induced hormone pathways (e.g., jasmonic acid and abscisic acid synthesis and cytokinin degradation), suggesting a complex interplay between acetyl-CoA availability and stress response pathways.
Several changes in gene expression in the antisense-ACLA plants suggest additional modulators of stress pathways. These include the down-regulation of the APX1 and PMSR2 (peptide methionine sulfoxide reductase 2) genes, which are involved in the oxidative stress response [82,83,84,85], and the up-regulation of the TPP gene that is involved in trehalose metabolism, a known stress indicator [86,87,88]. These indicators of altered redox-state stress may be a mechanism of the redox-mediated activation of AGPase, leading to increased starch accumulation. Additionally, the reduced expression of ACL activity induced changes in cell wall metabolism, indicated by the altered expression of genes involved in cell wall synthesis, modification, and degradation. Thus, the reduced supply of cytosolic acetyl-CoA may not only affect starch metabolism but other critical cellular processes.
In summary, the reduced expression of ACL caused by the antisense-ACLA allele leads to a complex cascade of metabolic and regulatory changes, resulting in increased starch accumulation, altered stress responses, and modified cell wall metabolism. These findings underscore the intricate interconnections between cytosolic acetyl-CoA metabolism, starch synthesis and degradation, and plant stress responses, offering new insights into the regulatory networks that govern plant metabolism.

4. Materials and Methods

4.1. Plant Materials, Growth Conditions, and Experimental Design

All Arabidopsis thaliana plants used in this study were of the ecotype Columbia (Lehle Seeds, Round Rock, TX, USA). Transgenic plants expressing the antisense ACLA sequence, which is using the constitutive CaMV 35S promoter, have previously been described [36]. Seeds were surface-sterilized in a 50% (v/v) bleach and 0.02% (v/v) Triton X-100 solution for 7 min and were rinsed three times with sterile distilled H2O. Antisense-ACLA and wild-type seeds were germinated on a solid growth medium in (100 mm × 15 mm) Petri dishes, with and without 30 mg/mL kanamycin, respectively. The growth medium was buffered with 2.56 mM MES at pH 5.7 and contained 4.3 g/L Murashige and Skoog salts (GibcoBRL, Life Technologies, Rockville, MD, USA), 1% (w/v) sucrose (Sigma, St. Louis, MO, USA), 1X B5 vitamins (100 mg/mL myo-inositol, 1 mg/mL pyridoxine hydrochloride, 1 mg/mL nicotinic acid, 10 mg/mL thiamine hydrochloride), and 0.6% (w/v) agar gel (Sigma, St. Louis, MO, USA). The Petri dishes were placed in a growth chamber (73% RH at 22 ± 1 °C) (Model LT105; Percival Scientific, Perry, IA, USA) under a short day (SD) photoperiod (8 h light /16 h dark), with illumination provided by fluorescent lamps (129 ± 16 µM·m−2·s−1 PAR). After 21 d, seedlings were transplanted to a sterile potting medium (LC1 Sunshine Mix, Sun Gro, Horticulture, Inc., Bellevue, WA, USA) and fertilized with 1X Nutriculture Grower’s Special Blend 21-8-18PLUS (Plant Marvel Labs, Chicago, IL, USA). The antisense-ACLA seedlings exhibiting features characteristic of the antisense “bonsai” phenotype [36] were transplanted to 3-inch square pots, two seedlings per pot.
Pots were arranged in 16 randomized blocks (flats), using PROC PLAN of SAS (SAS Institute, Cary, NC, USA), and returned to the same growth chamber and environmental conditions that were used for germinating the seeds. Each flat consisted of plants of the same genotype (8 flats of WT and 8 flats of antisense-ACL), and with 21 pots in one flat. At 6 weeks after germination (prior to flower bolting), rosette leaves (#5 to #8 according to Bowman (1994)) that are mature and photosynthetically active [89,90] were harvested from 2 plants from one pot from each flat. These tissue harvests occurred at 0, 0.5, 1, 4, 6, 8, 8.5, 9, 12, 14, 16, and 20 h during the SD photoperiod; the zero time point was at the start of the photoperiod. Thus, 0, 0.5, 1, 4, and 6 h time points were collected during the light cycle, and the 8, 8.5, 9, 12, 14, 16, and 20 h time points were collected during the dark cycle. During these latter harvests, plants were illuminated with a faint green light. Samples were frozen in liquid N2 immediately after harvest and stored at −80 °C for RNA and protein extraction. For each time point, two samples were harvested of each genotype, and each sample consisted of leaves from sixteen plants. The entire process was completed on two separate occasions to obtain two replications for all genotype and time combinations. This can be viewed as a split-plot experimental design, with genotype as the whole-plot factor and time as the split-plot factor.

4.2. Starch Quantification

Plants grown in parallel and in the same conditions as described above were used to generate tissue for starch analysis. At 6 h into the light phase of the photoperiod, just prior to the transition into the dark phase, when starch content is at a maximum, rosette leaf samples, weighing between 250 and 500 mg fresh weight, were harvested from randomly selected plants of each genotype. Three samples, consisting of leaves from five plants, were collected per genotype. Harvested samples were immediately frozen in liquid N2 and stored at −80 °C. Starch content of leaf samples was determined as previously described [18], with slight modification as follows. Leaf samples were immersed in 35 mL 80% (v/v) ethanol and incubated in a boiling water bath for 30 min or until completely de-pigmented. After removal of the solvent, the leaf samples were homogenized in a Kontes tissue grinder and extracted with a second aliquot of 35 mL 80% (v/v) ethanol. After homogenizing the insoluble material a second time, it was resuspended in water and incubated in a boiling water bath for 30 min. The suspended mixture was digested with amyloglucosidase, and the released α-glucan polymer (soluble and insoluble) was quantified with a commercial assay kit (catalog no. E0207748, R-BioPharm, Darmstadt, Germany). The statistical significance of differences among samples were evaluated with Student’s t-test by using JMP 18 software (SAS Institute).

4.3. RNA Blot Analysis

RNA was extracted from frozen leaf samples using GibcoBRL TRIzol reagent (Life Technologies, Rockville, MD, USA) according to the protocol provided by the manufacturer, as previously described [91]. RNA concentrations were determined using a Genesys spectrophotometer (Spectronic Instruments, Rochester, NY, USA). RNA samples (10 mg) were denatured for 15 min at 65 °C and subjected to RNA blot analysis, as previously described [92]. The blots were hybridized with a 32P-labeled denatured DNA probe. DNA probes of Lhcb3, CHS, and 18S RNAs were labeled with [32P]dCTP by random priming, using GibcoBRL reagents and protocol (Life Technologies, Rockville, MD, USA). The analysis was performed in triplicate to ensure reproducibility. Washed membranes were exposed to a phosphor screen (Molecular Dynamics, Sunnyvale, CA, USA) for 4 d, scanned with a Storm 840 PhosphorImager (Amersham Biosciences, Piscataway, NJ, USA), and visualized with ImageQuant TL 10.1 software (Global Life Sciences Solutions USA LLC, Wilmington, DE, USA).

4.4. In Gel Enzyme Activity Analyses of Starch Metabolic Enzymes

Zymogram analyses of starch metabolic enzymes were conducted as previously described [49], with a few modifications. Specifically, to determine starch synthase activity, leaf samples were homogenized with a buffer consisting of 50 mM Tris acetate (Thermo Fisher Scientific, Waltham, MA, USA), pH 7.5, and 10 mM DTT (Thermo Fisher Scientific, Waltham, MA, USA). Extracts, consisting of 200 mg protein, were subjected to electrophoresis in 7% polyacrylamide gels containing 0.3% (w/v) glycogen, using a Protean II cell (Bio-Rad Laboratories, Hercules, CA, USA). Following electrophoresis for 4.5 h at 4 °C, with a current of 75 mA, starch synthase activity was visualized by incubating the glycogen-containing gel at room temperature for 36 h in a buffer consisting of 100 mM Bicine (pH 8.0), 0.5 M citrate, 25 mM potassium acetate, 0.5 mg/mL BSA, 5 mM ADP-glucose, 5 mM 2-mercaptoethanol, and 20 mg/mL glycogen. After incubation, the gel was stained with 0.2% iodine and 2% potassium iodide (Thermo Fisher Scientific, Waltham, MA, USA) in 10 mM HCl to detect enzymatic activity. In parallel, starch-modifying enzyme activities were visualized by electroblotting proteins onto a polyacrylamide gel containing 0.3% (w/v) starch, followed by iodine staining to detect the enzymatic activity. Stained gels were scanned immediately with a GS-800 Calibrated Densiometer (Bio-Rad Laboratories, Hercules, CA, USA) and visualized with MagicScan 4.71 software (UMAX Technologies, Dallas, TX, USA). These experiments were repeated three times.

4.5. GeneChip Analysis of SD Experiments

RNA was extracted from leaves as described for Northern blot analysis. Northern blot analysis showed that expression patterns were well characterized by 11 of the 12 time points because the 6 h in light time point consistently fell near a line segment connecting the adjacent points. To identify the expression of the genes that might have different temporal patterns over the SD diurnal cycle (especially the starch metabolic genes), the transcript abundance was monitored at 11 time points (time point 6 h in the light was not selected based on the Northern blots analysis), with two biological replicates. Synthesis of labeled cRNAs, hybridization with Affymetrix Arabidopsis ATH1 arrays (22,810 Arabidopsis probe sets, Affymetrix, Santa Clara, CA, USA), and scanning of the probe arrays were performed at the Iowa State University Gene Chip Facility (Ames, IA, USA). Hybridization intensities were collected by an Agilent GeneArray Scanner (Agilent Technologies, Palo Alto, CA, USA). For data analysis, relative expression intensities were generated and normalized with Microarray Suite (MAS) 5.0 software (Affymetrix) in the form of signal values. The signal value, a robust weighted mean of probe fluorescence for a probe set (corrected for nonspecific signal by subtracting mismatch probe values), was calculated using the One-step Tukey’s Biweight Estimate. Global scaling (Affymetrix) was used to normalize the data by adjusting the mean expression level of each chip to a value of 500. Scatter plot analyses of the two replicates were linear, indicating similarity to each other; we thus used the mean value of expression (normalized intensity). FCModeler (Iowa State University, Ames, IA, USA) was used to model and visualize metabolic networks.

4.6. Clustering

The data from each Affymetrix Arabidopsis ATH1 chip were normalized by log (signal + 1) transformation. For each gene, we fitted a mixed linear model with fixed effects for time and random effects for replicate to identify genes that exhibited a significant change in expression across 11 time points for WT. We also fitted another mixed linear model with fixed effects for time and genotype, and random effects for replicate to identify genes that exhibited significant changes in expression over the 3 time points per genotype and 2 genotypes surveyed, respectively. When testing for differences over time, we used the more conservative method previously reported [93] to estimate the false discovery rate (FDR) because a large number of genes exhibited significant differences over time. We used the method previously reported [53] to estimate FDR to gain more power for detecting differences in expression when comparing the WT and mutant genotypes. Thresholds for significance based on q-values were selected to maintain false discovery below desired rates. After the matrix of estimated expression means was obtained, the matrix of means was standardized so that Euclidean distance would be related to 1-correlation distance. K-medoids clustering was conducted in R (https://www.r-project.org/, accessed 2 January 2020) with the cluster number that Gap analysis recommended. The Gap statistic method [94] calculates the number of clusters by comparing the degree of clustering of the data to that of a simulated uniform (cluster-free) reference distribution.

4.7. Correlation Analysis

Arabidopsis Affymetrix ATH1 data from 963 chips were obtained from Nottingham Arabidopsis Stock Centre microarray database [56,57]. The data represent a large number of experiments that studied the effect of development, stress, and different mutations [56,57] using MAS 5.0 (Affymetrix); the data from all the chips were individually scaled to a common mean = 100, excluding top and bottom 2% signal intensities. We averaged the expression values on chips coming from biological replicates after assessing their replicability by comparing the interquartile range of each data set. Pair-wise Pearson correlation coefficients were computed for 58 genes of the starch metabolism pathway across all probes on the Arabidopsis Affymetrix ATH1 chips by using our custom software, MetaOmGraph [58]. From among the 22 K genes represented on the chips, genes correlated above a specified cut-off to a gene of interest were identified and visualized with MOG [58]. Correlation data, generated in R software (http://www.r-project.org/index.html) [95], for starch metabolism genes were clustered by columns and rows in CIMMaker and visualized in Matrix2png [96].

4.8. Statistical Analysis

Qualitative and quantitative composition data were collected from a minimum of three biological determinations for each independent transgenic line and each control. Data are presented as mean ± S.D. (Standard Deviation). Statistical significance relative to the control was calculated with Student’s t-test or analysis of variance (ANOVA), ** p < 0.01.

5. Conclusions

Our study demonstrates that reduced cytosolic ACL activity in antisense-ACLA plants leads to significant changes in starch metabolism and related biochemical pathways. The observed increase in starch content suggests an imbalance between starch biosynthesis and degradation, affected by up-regulated genes involved in starch synthesis and down-regulated genes involved in starch degradation. The transcriptional analysis revealed that several pathways, including those for fatty acid elongation, secondary metabolite synthesis, and hormone biosynthesis, are also affected, indicating a broader impact on plant metabolism. The altered expression of genes in the APX1 signal transduction pathway and other oxidative stress-related genes points to a potential oxidative imbalance, which may further influence starch metabolism through redox regulation. These findings provide insights into the metabolic interconnections between starch accumulation and cytosolic acetyl-CoA metabolism, highlighting the complex regulatory networks that coordinate plant growth and development. Future studies should explore these interactions in greater detail to elucidate the mechanisms driving these metabolic changes.

Supplementary Materials

The following supporting information can be downloaded at: https://www.mdpi.com/article/10.3390/ijms251910850/s1, Refs. [12,13,15,20,39,41,52,97,98,99,100,101,102,103,104,105,106,107,108,109,110,111,112,113,114,115,116,117,118] are included in Supplementary Materials.

Author Contributions

L.L. and E.S.W. conceived and designed the experiments; L.L. and C.M.F. conducted the experiments and performed the data analysis; L.L., L.W., C.M.F., W.I.M., R.T. and Y.M. performed investigations into the phenotypic traits of Arabidopsis and transcriptomic analysis; B.J.N. provided helpful discussion; L.L., C.M.F. and L.W. wrote the draft; L.L., E.S.W. and B.J.N. revised the manuscript. All authors have read and agreed to the published version of the manuscript.

Funding

This research was funded by awards from the National Science Foundation: award MCB-0951170 (to E.S.W. and L.L.), and award MCB-2238942 (to L.L.). Additional support was provided by Mississippi State University (to L.L.); and the Tianchiyingcai Program (CZ001616) and Shihezi University (RCZK202468) (to L.W.).

Institutional Review Board Statement

Not applicable.

Informed Consent Statement

Not applicable.

Data Availability Statement

All relevant data are within the manuscript and its Supporting Information files. Accession numbers: Sequence data from this article can be found under the following accession numbers in The Arabidopsis Genome Information Resource: ACLA1 (At1g10670) (access date: 2 October 2024). GeneChip data presented in this publication were deposited in NCBI’s Gene Expression Omnibus and are accessible through GEO Series accession number GSE254150.

Acknowledgments

We would like to thank Christophe Colleoni, Jennifer Walker-Daniels, Tracie Hennen-Bierwagen, and Alan M. Myers for helpful discussions regarding starch metabolism and zymogram. We are particularly grateful to Alan M. Myers for his thoughtful comments that helped improve our manuscript, to Dan Nettleton for help with the statistical analysis, and to Pan Du and Jie Li for a valuable discussion of FCModeler and MetNetDB. The LHCB3 cDNA was purchased from RIKEN.

Conflicts of Interest

The authors declare no conflicts of interest.

References

  1. Feugier, F.G.; Satake, A. Dynamical feedback between circadian clock and sucrose availability explains adaptive response of starch metabolism to various photoperiods. Front. Plant Sci. 2013, 3, 305. [Google Scholar] [CrossRef] [PubMed]
  2. Gibon, Y.; Blasing, O.E.; Palacios-Rojas, N.; Pankovic, D.; Hendriks, J.H.; Fisahn, J.; Hohne, M.; Gunther, M.; Stitt, M. Adjustment of diurnal starch turnover to short days: Depletion of sugar during the night leads to a temporary inhibition of carbohydrate utilization, accumulation of sugars and post-translational activation of ADP-glucose pyrophosphorylase in the following light period. Plant J. 2004, 39, 847–862. [Google Scholar] [PubMed]
  3. Halford, N.; Curtis, T.; Muttucumaru, N.; Postles, J.; Mottram, D. Sugars in crop plants. Ann. Appl. Biol. 2011, 158, 1–25. [Google Scholar] [CrossRef]
  4. Fox, T.C.; Geiger, D.R. Effects of decreased net carbon exchange on carbohydrate metabolism in sugar beet source leaves. Plant Physiol. 1984, 76, 763–768. [Google Scholar] [CrossRef]
  5. Smith, A.M.; Zeeman, S.C.; Smith, S.M. Starch degradation. Annu. Rev. Plant Biol. 2005, 56, 73–98. [Google Scholar] [CrossRef]
  6. Niu, S.; Li, X.-Q.; Tang, R.; Zhang, G.; Li, X.; Cui, B.; Mikitzel, L.; Haroon, M. Starch granule sizes and degradation in sweet potatoes during storage. Postharvest Biol. Technol. 2019, 150, 137–147. [Google Scholar] [CrossRef]
  7. Smith, A.M. The biosynthesis of starch granules. Biomacromolecules 2001, 2, 335–341. [Google Scholar] [CrossRef]
  8. Szydlowski, N.; Ragel, P.; Raynaud, S.; Lucas, M.M.; Roldán, I.; Montero, M.; Muñoz, F.J.; Ovecka, M.; Bahaji, A.; Planchot, V. Starch granule initiation in Arabidopsis requires the presence of either class IV or class III starch synthases. Plant Cell 2009, 21, 2443–2457. [Google Scholar] [CrossRef]
  9. Lu, K.-J.; Pfister, B.; Jenny, C.; Eicke, S.; Zeeman, S.C. Distinct functions of STARCH SYNTHASE 4 domains in starch granule formation. Plant Physiol. 2018, 176, 566–581. [Google Scholar] [CrossRef]
  10. Crumpton-Taylor, M.; Pike, M.; Lu, K.J.; Hylton, C.M.; Feil, R.; Eicke, S.; Lunn, J.E.; Zeeman, S.C.; Smith, A.M. Starch synthase 4 is essential for coordination of starch granule formation with chloroplast division during Arabidopsis leaf expansion. New Phytol. 2013, 200, 1064–1075. [Google Scholar] [CrossRef]
  11. Wang, J.; Hu, P.; Lin, L.; Chen, Z.; Liu, Q.; Wei, C. Gradually decreasing starch branching enzyme expression is responsible for the formation of heterogeneous starch granules. Plant Physiol. 2018, 176, 582–595. [Google Scholar] [CrossRef] [PubMed]
  12. Mérida, A.; Fettke, J. Starch granule initiation in Arabidopsis thaliana chloroplasts. Plant J. 2021, 107, 688–697. [Google Scholar] [CrossRef] [PubMed]
  13. Singh, A.; Compart, J.; AL-Rawi, S.A.; Mahto, H.; Ahmad, A.M.; Fettke, J. LIKE EARLY STARVATION 1 alters the glucan structures at the starch granule surface and thereby influences the action of both starch-synthesizing and starch-degrading enzymes. Plant J. 2022, 111, 819–835. [Google Scholar] [CrossRef]
  14. Shen, L.; Li, J.; Li, Y. Resistant starch formation in rice: Genetic regulation and beyond. Plant Commun. 2022, 3, 100329. [Google Scholar] [CrossRef]
  15. Bürgy, L.; Eicke, S.; Kopp, C.; Jenny, C.; Lu, K.J.; Escrig, S.; Meibom, A.; Zeeman, S.C. Coalescence and directed anisotropic growth of starch granule initials in subdomains of Arabidopsis thaliana chloroplasts. Nature Commun. 2021, 12, 1–10. [Google Scholar] [CrossRef]
  16. Geiger, D.R.; Servaites, J.C. Diurnal regulation of photosynthetic carbon metabolism in C3 plants. Annu. Rev. Plant Biol. 1994, 45, 235–256. [Google Scholar] [CrossRef]
  17. Matt, P.; Schurr, U.; Klein, D.; Krapp, A.; Stitt, M. Growth of tobacco in short-day conditions leads to high starch, low sugars, altered diurnal changes in the Nia transcript and low nitrate reductase activity, and inhibition of amino acid synthesis. Planta 1998, 207, 27–41. [Google Scholar] [CrossRef]
  18. Zeeman, S.C.; Northrop, F.; Smith, A.M.; Rees, T.A. A starch-accumulating mutant of Arabidopsis thaliana deficient in a chloroplastic starch-hydrolysing enzyme. Plant J. 1998, 15, 357–365. [Google Scholar] [CrossRef]
  19. Fernandez, O.; Ishihara, H.; George, G.M.; Mengin, V.; Flis, A.; Sumner, D.; Arrivault, S.; Feil, R.; Lunn, J.E.; Zeeman, S.C. Leaf starch turnover occurs in long days and in falling light at the end of the day. Plant Physiol. 2017, 174, 2199–2212. [Google Scholar] [CrossRef]
  20. Abt, M.R.; Pfister, B.; Sharma, M.; Eicke, S.; Bürgy, L.; Neale, I.; Seung, D.; Zeeman, S.C. STARCH SYNTHASE5, a noncanonical starch synthase-like protein, promotes starch granule initiation in Arabidopsis. Plant Cell 2020, 32, 2543–2565. [Google Scholar] [CrossRef]
  21. Lu, Y.; Gehan, J.P.; Sharkey, T.D. Daylength and circadian effects on starch degradation and maltose metabolism. Plant Physiol. 2005, 138, 2280–2291. [Google Scholar] [CrossRef] [PubMed]
  22. Baerenfaller, K.; Massonnet, C.; Hennig, L.; Russenberger, D.; Sulpice, R.; Walsh, S.; Stitt, M.; Granier, C.; Gruissem, W. A long photoperiod relaxes energy management in Arabidopsis leaf six. Curr. Plant Biol. 2015, 2, 34–45. [Google Scholar] [CrossRef]
  23. Koch, K.E. Carbohydrate-modulated gene expression in plants. Annu. Rev. Plant Physiol. Plant Mol. Biol. 1996, 47, 509–540. [Google Scholar] [CrossRef] [PubMed]
  24. Meng, L.S.; Bao, Q.X.; Mu, X.R.; Tong, C.; Cao, X.Y.; Huang, J.J.; Xue, L.N.; Liu, C.Y.; Fei, Y.; Loake, G.J. Glucose- and sucrose-signaling modules regulate the Arabidopsis juvenile-to-adult phase transition. Cell Rep. 2021, 36, 109348. [Google Scholar] [CrossRef] [PubMed]
  25. Neff, M.M.; Fankhauser, C.; Chory, J. Light: An indicator of time and place. Genes Dev. 2000, 14, 257–271. [Google Scholar] [CrossRef] [PubMed]
  26. Horrer, D.; Flutsch, S.; Pazmino, D.; Matthews, J.S.; Thalmann, M.; Nigro, A.; Leonhardt, N.; Lawson, T.; Santelia, D. Blue light induces a distinct starch degradation pathway in guard cells for stomatal opening. Curr. Biol. 2016, 26, 362–370. [Google Scholar] [CrossRef]
  27. Mengin, V.; Pyl, E.T.; Alexandre Moraes, T.; Sulpice, R.; Krohn, N.; Encke, B.; Stitt, M. Photosynthate partitioning to starch in Arabidopsis thaliana is insensitive to light intensity but sensitive to photoperiod due to a restriction on growth in the light in short photoperiods. Plant Cell Environ. 2017, 40, 2608–2627. [Google Scholar] [CrossRef]
  28. Harmer, S.L.; Hogenesch, J.B.; Straume, M.; Chang, H.S.; Han, B.; Zhu, T.; Wang, X.; Kreps, J.A.; Kay, S.A. Orchestrated transcription of key pathways in Arabidopsis by the circadian clock. Science 2000, 290, 2110–2113. [Google Scholar] [CrossRef]
  29. Izumi, M. Roles of the Clock in Controlling Starch Metabolism. Plant Physiol. 2019, 179, 1441–1443. [Google Scholar] [CrossRef]
  30. Baier, M.; Hemmann, G.; Holman, R.; Corke, F.; Card, R.; Smith, C.; Rook, F.; Bevan, M.W. Characterization of mutants in Arabidopsis showing increased sugar-specific gene expression, growth, and developmental responses. Plant Physiol. 2004, 134, 81–91. [Google Scholar] [CrossRef]
  31. Coruzzi, G.; Bush, D.R. Nitrogen and carbon nutrient and metabolite signaling in plants. Plant Physiol. 2001, 125, 61–64. [Google Scholar] [CrossRef] [PubMed]
  32. Haro, D.; Marrero, P.F.; Relat, J. Nutritional regulation of gene expression: Carbohydrate-, Fat- and Amino Acid-Dependent modulation of transcriptional activity. Int. J. Mol. Sci. 2019, 20, 1386. [Google Scholar] [CrossRef]
  33. Fatland, B.L.; Nikolau, B.J.; Wurtele, E.S. Reverse genetic characterization of cytosolic acetyl-CoA generation by ATP-citrate lyase in Arabidopsis. Plant Cell. 2005, 17, 182–203. [Google Scholar] [CrossRef] [PubMed]
  34. Xing, S.; van Deenen, N.; Magliano, P.; Frahm, L.; Forestier, E.; Nawrath, C.; Schaller, H.; Gronover, C.S.; Prüfer, D.; Poirier, Y. ATP citrate lyase activity is post-translationally regulated by sink strength and impacts the wax, cutin and rubber biosynthetic pathways. Plant J. 2014, 79, 270–284. [Google Scholar] [CrossRef]
  35. Zhong, R.; Cui, D.; Richardson, E.A.; Phillips, D.R.; Azadi, P.; Lu, G.; Ye, Z.-H. Cytosolic Acetyl-CoA generated by ATP-citrate lyase is essential for acetylation of cell wall polysaccharides. Plant Cell Physiol. 2020, 61, 64–75. [Google Scholar] [CrossRef]
  36. Fatland, B.L.; Ke, J.; Anderson, M.D.; Mentzen, W.I.; Cui, L.W.; Allred, C.C.; Johnston, J.L.; Nikolau, B.J.; Wurtele, E.S. Molecular characterization of a heteromeric ATP-citrate lyase that generates cytosolic acetyl-coenzyme A in Arabidopsis. Plant Physiol. 2002, 130, 740–756. [Google Scholar] [CrossRef]
  37. Chen, C.; Li, C.; Wang, Y.; Renaud, J.; Tian, G.; Kambhampati, S.; Saatian, B.; Nguyen, V.; Hannoufa, A.; Marsolais, F. Cytosolic acetyl-CoA promotes histone acetylation predominantly at H3K27 in Arabidopsis. Nat. Plants 2017, 3, 814–824. [Google Scholar] [CrossRef]
  38. Smith, S.M.; Fulton, D.C.; Chia, T.; Thorneycroft, D.; Chapple, A.; Dunstan, H.; Hylton, C.; Zeeman, S.C.; Smith, A.M. Diurnal changes in the transcriptome encoding enzymes of starch metabolism provide evidence for both transcriptional and posttranscriptional regulation of starch metabolism in Arabidopsis leaves. Plant Physiol. 2004, 136, 2687–2699. [Google Scholar] [CrossRef]
  39. Myers, A.M.; Morell, M.K.; James, M.G.; Ball, S.G. Recent progress toward understanding biosynthesis of the amylopectin crystal. Plant Physiol. 2000, 122, 989–997. [Google Scholar] [CrossRef]
  40. Tenorio, G.; Orea, A.; Romero, J.M.; Merida, A. Oscillation of mRNA level and activity of granule-bound starch synthase I in Arabidopsis leaves during the day/night cycle. Plant Mol. Biol. 2003, 51, 949–958. [Google Scholar] [CrossRef]
  41. David, L.C.; Lee, S.K.; Bruderer, E.; Abt, M.R.; Fischer-Stettler, M.; Tschopp, M.A.; Solhaug, E.M.; Sanchez, K.; Zeeman, S.C. BETA-AMYLASE9 is a plastidial nonenzymatic regulator of leaf starch degradation. Plant Physiol. 2022, 188, 191–207. [Google Scholar] [CrossRef] [PubMed]
  42. Baroja-Fernandez, E.; Munoz, F.J.; Zandueta-Criado, A.; Moran-Zorzano, M.T.; Viale, A.M.; Alonso-Casajus, N.; Pozueta-Romero, J. Most of ADP x glucose linked to starch biosynthesis occurs outside the chloroplast in source leaves. Proc. Natl. Acad. Sci. USA 2004, 101, 13080–13085. [Google Scholar] [CrossRef] [PubMed]
  43. Cross, J.M.; Clancy, M.; Shaw, J.R.; Greene, T.W.; Schmidt, R.R.; Okita, T.W.; Hannah, L.C. Both subunits of ADP-glucose pyrophosphorylase are regulatory. Plant Physiol. 2004, 135, 137–144. [Google Scholar] [CrossRef] [PubMed]
  44. Hendriks, J.H.; Kolbe, A.; Gibon, Y.; Stitt, M.; Geigenberger, P. ADP-glucose pyrophosphorylase is activated by posttranslational redox-modification in response to light and to sugars in leaves of Arabidopsis and other plant species. Plant Physiol. 2003, 133, 838–849. [Google Scholar] [CrossRef]
  45. Dinges, J.R.; Colleoni, C.; Myers, A.M.; James, M.G. Molecular structure of three mutations at the maize sugary1 locus and their allele-specific phenotypic effects. Plant Physiol. 2001, 125, 1406–1418. [Google Scholar] [CrossRef]
  46. Kakefuda, G.; Duke, S.H. Electrophoretic transfer as a technique for the detection and identification of plant amylolytic enzymes in polyacrylamide gels. Plant Physiol. 1984, 75, 278–280. [Google Scholar] [CrossRef]
  47. Lu, K.J.; Streb, S.; Meier, F.; Pfister, B.; Zeeman, S.C. Molecular genetic analysis of glucan branching enzymes from plants and bacteria in arabidopsis reveals marked differences in their functions and capacity to mediate starch granule formation. Plant Physiol. 2015, 169, 1638–1655. [Google Scholar] [CrossRef]
  48. Dumez, S.; Wattebled, F.; Dauvillee, D.; Delvalle, D.; Planchot, V.; Ball, S.G.; D’Hulst, C. Mutants of Arabidopsis lacking starch branching enzyme II substitute plastidial starch synthesis by cytoplasmic maltose accumulation. Plant Cell 2006, 18, 2694–2709. [Google Scholar] [CrossRef]
  49. Cao, H.; Imparl-Radosevich, J.; Guan, H.; Keeling, P.L.; James, M.G.; Myers, A.M. Identification of the soluble starch synthase activities of maize endosperm. Plant Physiol. 1999, 120, 205–216. [Google Scholar] [CrossRef]
  50. Hayashi, M.; Crofts, N.; Oitome, N.F.; Fujita, N. Analyses of starch biosynthetic protein complexes and starch properties from developing mutant rice seeds with minimal starch synthase activities. BMC Plant Biol. 2018, 18, 59. [Google Scholar] [CrossRef]
  51. Zhang, X.; Szydlowski, N.; Delvalle, D.; D’Hulst, C.; James, M.G.; Myers, A.M. Overlapping functions of the starch synthases SSII and SSIII in amylopectin biosynthesis in Arabidopsis. BMC Plant Biol. 2008, 8, 96. [Google Scholar] [CrossRef] [PubMed]
  52. Zhang, X.; Myers, A.M.; James, M.G. Mutations affecting starch synthase III in Arabidopsis alter leaf starch structure and increase the rate of starch synthesis. Plant Physiol. 2005, 138, 663–674. [Google Scholar] [CrossRef] [PubMed]
  53. Kaufman, L.; Rousseeuw, P.J. An Introduction to Cluster Analysis; John Wiley and Sons, Incorporated: Hoboken, NJ, USA, 1990. [Google Scholar]
  54. Storey, J.D.; Tibshirani, R. Statistical significance for genomewide studies. Proc. Natl. Acad. Sci. USA 2003, 100, 9440–9445. [Google Scholar] [CrossRef] [PubMed]
  55. Wurtele, E.S.; Li, J.; Diao, L.; Zhang, H.; Foster, C.M.; Fatland, B.; Dickerson, J.; Brown, A.; Cox, Z.; Cook, D. MetNet: Software to build and model the biogenetic lattice of Arabidopsis. Comp. Funct. Genom. 2003, 4, 239–245. [Google Scholar] [CrossRef]
  56. Mentzen, W.I. From Pathway to Regulon in Arabidopsis; Iowa State University: Ames, IA, USA, 2006. [Google Scholar]
  57. Craigon, D.J.; James, N.; Okyere, J.; Higgins, J.; Jotham, J.; May, S. NASCArrays: A repository for microarray data generated by NASC’s transcriptomics service. Nucleic Acids Res. 2004, 32, D575–D577. [Google Scholar] [CrossRef]
  58. Singh, U.; Hur, M.; Dorman, K.; Wurtele, E.S. MetaOmGraph: A workbench for interactive exploratory data analysis of large expression datasets. Nucleic Acids Res. 2020, 48, e23. [Google Scholar] [CrossRef]
  59. Hussain, H.; Mant, A.; Seale, R.; Zeeman, S.; Hinchliffe, E.; Edwards, A.; Hylton, C.; Bornemann, S.; Smith, A.M.; Martin, C.; et al. Three isoforms of isoamylase contribute different catalytic properties for the debranching of potato glucans. Plant Cell 2003, 15, 133–149. [Google Scholar] [CrossRef]
  60. Smith, A.M.; Zeeman, S.C.; Thorneycroft, D.; Smith, S.M. Starch mobilization in leaves. J. Exp. Bot. 2003, 54, 577–583. [Google Scholar] [CrossRef]
  61. Niittyla, T.; Messerli, G.; Trevisan, M.; Chen, J.; Smith, A.M.; Zeeman, S.C. A previously unknown maltose transporter essential for starch degradation in leaves. Science 2004, 303, 87–89. [Google Scholar] [CrossRef]
  62. Zhou, J.; Loh, Y.-T.; Bressan, R.A.; Martin, G.B. The tomato gene Pti1 encodes a serine/threonine kinase that is phosphorylated by Pto and is involved in the hypersensitive response. Cell 1995, 83, 925–935. [Google Scholar] [CrossRef]
  63. Bogdanove, A.J.; Martin, G.B. AvrPto-dependent Pto-interacting proteins and AvrPto-interacting proteins in tomato. Proc. Natl. Acad. Sci. USA 2000, 97, 8836–8840. [Google Scholar] [CrossRef] [PubMed]
  64. Riemenschneider, A.; Wegele, R.; Schmidt, A.; Papenbrock, J. Isolation and characterization of ad-cysteine desulfhydrase protein from Arabidopsis thaliana. FEBS J. 2005, 272, 1291–1304. [Google Scholar] [CrossRef] [PubMed]
  65. Chia, T.; Thorneycroft, D.; Chapple, A.; Messerli, G.; Chen, J.; Zeeman, S.C.; Smith, S.M.; Smith, A.M. A cytosolic glucosyltransferase is required for conversion of starch to sucrose in Arabidopsis leaves at night. Plant J. 2004, 37, 853–863. [Google Scholar] [CrossRef]
  66. Lu, Y.; Sharkey, T.D. The role of amylomaltase in maltose metabolism in the cytosol of photosynthetic cells. Planta 2004, 218, 466–473. [Google Scholar] [CrossRef]
  67. Fordham-Skelton, A.P.; Chilley, P.; Lumbreras, V.; Reignoux, S.; Fenton, T.R.; Dahm, C.C.; Pages, M.; Gatehouse, J.A. A novel higher plant protein tyrosine phosphatase interacts with SNF1-related protein kinases via a KIS (kinase interaction sequence) domain. Plant J. 2002, 29, 705–715. [Google Scholar] [CrossRef] [PubMed]
  68. Halford, N.G.; Hardie, D.G. SNF1-related protein kinases: Global regulators of carbon metabolism in plants? Plant Mol. Biol. 1998, 37, 735–748. [Google Scholar] [CrossRef]
  69. Schaffer, R.; Landgraf, J.; Accerbi, M.; Simon, V.; Larson, M.; Wisman, E. Microarray analysis of diurnal and circadian-regulated genes in Arabidopsis. Plant Cell 2001, 13, 113–123. [Google Scholar] [CrossRef]
  70. Niittyla, T.; Comparot-Moss, S.; Lue, W.L.; Messerli, G.; Trevisan, M.; Seymour, M.D.; Gatehouse, J.A.; Villadsen, D.; Smith, S.M.; Chen, J.; et al. Similar protein phosphatases control starch metabolism in plants and glycogen metabolism in mammals. J. Biol. Chem. 2006, 281, 11815–11818. [Google Scholar] [CrossRef]
  71. Eisen, M.B.; Spellman, P.T.; Brown, P.O.; Botstein, D. Cluster analysis and display of genome-wide expression patterns. Proc. Natl. Acad. Sci. USA 1998, 95, 14863–14868. [Google Scholar] [CrossRef]
  72. Segal, E.; Shapira, M.; Regev, A.; Pe’er, D.; Botstein, D.; Koller, D.; Friedman, N. Module networks: Identifying regulatory modules and their condition-specific regulators from gene expression data. Nat. Genet. 2003, 34, 166–176. [Google Scholar] [CrossRef]
  73. Stuart, J.M.; Segal, E.; Koller, D.; Kim, S.K. A gene-coexpression network for global discovery of conserved genetic modules. Science 2003, 302, 249–255. [Google Scholar] [CrossRef] [PubMed]
  74. Razin, S.V.; Ioudinkova, E.S.; Kantidze, O.L.; Iarovaia, O.V. Co-Regulated genes and gene clusters. Genes 2021, 12, 907. [Google Scholar] [CrossRef] [PubMed]
  75. Keeling, P.L.; Myers, A.M. Biochemistry and genetics of starch synthesis. Annu. Rev. Food Sci. Technol. 2010, 1, 271–303. [Google Scholar] [CrossRef] [PubMed]
  76. Zeeman, S.C.; Smith, S.M.; Smith, A.M. The diurnal metabolism of leaf starch. Biochem. J. 2007, 401, 13–28. [Google Scholar] [CrossRef] [PubMed]
  77. Stitt, M.; Muller, C.; Matt, P.; Gibon, Y.; Carillo, P.; Morcuende, R.; Scheible, W.R.; Krapp, A. Steps towards an integrated view of nitrogen metabolism. J. Exp. Bot. 2002, 53, 959–970. [Google Scholar] [CrossRef]
  78. Browse, J.; Roughan, P.G.; Slack, C.R. Light control of fatty acid synthesis and diurnal fluctuations of fatty acid composition in leaves. Biochem. J. 1981, 196, 347–354. [Google Scholar] [CrossRef] [PubMed]
  79. Gilmour, S.J.; Sebolt, A.M.; Salazar, M.P.; Everard, J.D.; Thomashow, M.F. Overexpression of the Arabidopsis CBF3 transcriptional activator mimics multiple biochemical changes associated with cold acclimation. Plant Physiol. 2000, 124, 1854–1865. [Google Scholar] [CrossRef]
  80. Liu, Y.; Dang, P.; Liu, L.; He, C. Cold acclimation by the CBF-COR pathway in a changing climate: Lessons from Arabidopsis thaliana. Plant Cell Rep. 2019, 38, 511–519. [Google Scholar] [CrossRef]
  81. Kim, J.Y.; Kim, W.Y.; Kwak, K.J.; Oh, S.H.; Han, Y.S.; Kang, H. Glycine-rich RNA-binding proteins are functionally conserved in Arabidopsis thaliana and Oryza sativa during cold adaptation process. J. Exp. Bot. 2010, 61, 2317–2325. [Google Scholar] [CrossRef]
  82. Davletova, S.; Rizhsky, L.; Liang, H.; Shengqiang, Z.; Oliver, D.J.; Coutu, J.; Shulaev, V.; Schlauch, K.; Mittler, R. Cytosolic ascorbate peroxidase 1 is a central component of the reactive oxygen gene network of Arabidopsis. Plant Cell 2005, 17, 268–281. [Google Scholar] [CrossRef]
  83. Barros, J.; Escamilla-Trevino, L.; Song, L.; Rao, X.; Serrani-Yarce, J.C.; Palacios, M.D.; Engle, N.; Choudhury, F.K.; Tschaplinski, T.J.; Venables, B.J.; et al. 4-Coumarate 3-hydroxylase in the lignin biosynthesis pathway is a cytosolic ascorbate peroxidase. Nat. Commun. 2019, 10, 1994. [Google Scholar] [CrossRef] [PubMed]
  84. Bechtold, U.; Murphy, D.J.; Mullineaux, P.M. Arabidopsis peptide methionine sulfoxide reductase2 prevents cellular oxidative damage in long nights. Plant Cell 2004, 16, 908–919. [Google Scholar] [CrossRef] [PubMed]
  85. Rey, P.; Tarrago, L. Physiological Roles of Plant Methionine Sulfoxide Reductases in Redox Homeostasis and Signaling. Antioxidants 2018, 7, 114. [Google Scholar] [CrossRef]
  86. Fichtner, F.; Lunn, J.E. The Role of Trehalose 6-Phosphate (Tre6P) in plant metabolism and development. Annu. Rev. Plant Biol. 2021, 72, 737–760. [Google Scholar] [CrossRef] [PubMed]
  87. Hwang, G.; Kim, S.; Cho, J.Y.; Paik, I.; Kim, J.I.; Oh, E. Trehalose-6-phosphate signaling regulates thermoresponsive hypocotyl growth in Arabidopsis thaliana. EMBO Rep. 2019, 20, e47828. [Google Scholar] [CrossRef] [PubMed]
  88. Avonce, N.; Leyman, B.; Mascorro-Gallardo, J.O.; Van Dijck, P.; Thevelein, J.M.; Iturriaga, G. The Arabidopsis trehalose-6-P synthase AtTPS1 gene is a regulator of glucose, abscisic acid, and stress signaling. Plant Physiol. 2004, 136, 3649–3659. [Google Scholar] [CrossRef]
  89. Bowman, J. Reproductive structures in Arabidopsis. In Arabidopsis: An Atlas of Morphology and Development; Springer: Berlin/Heidelberg, Germany, 1994; pp. 156–161. [Google Scholar]
  90. Stessman, D.; Miller, A.; Spalding, M.; Rodermel, S. Regulation of photosynthesis during Arabidopsis leaf development in continuous light. Photosynth. Res. 2002, 72, 27–37. [Google Scholar] [CrossRef]
  91. Li, L.; Foster, C.M.; Gan, Q.; Nettleton, D.; James, M.G.; Myers, A.M.; Wurtele, E.S. Identification of the novel protein QQS as a component of the starch metabolic network in Arabidopsis leaves. Plant J. 2009, 58, 485–498. [Google Scholar] [CrossRef] [PubMed]
  92. Ke, J.; Wen, T.N.; Nikolau, B.J.; Wurtele, E.S. Coordinate regulation of the nuclear and plastidic genes coding for the subunits of the heteromeric acetyl-coenzyme A carboxylase. Plant Physiol. 2000, 122, 1057–1071. [Google Scholar] [CrossRef]
  93. Benjamini, Y.; Hochberg, Y. Controlling false discovery rate: A practical and powerful approach to multiple testing. J. R. Stat. Soc. B Stat. Methodol. 1995, 57, 289–300. [Google Scholar] [CrossRef]
  94. Tibshirani, R.; Walther, G.; Hastie, T. Estimating the number of clusters in a data set via the gap statistic. J. R. Stat. Soc. Ser. B 2001, 63, 411–423. [Google Scholar] [CrossRef]
  95. Team, R.C. R: A language and environment for statistical computing. Found. Stat. Comput. Vienna Austria 2013. [Google Scholar]
  96. Pavlidis, P.; Noble, W.S. Matrix2png: A utility for visualizing matrix data. Bioinformatics 2003, 19, 295–296. [Google Scholar] [CrossRef]
  97. Pfister, B.; Lu, K.J.; Eicke, S.; Feil, R.; Lunn, J.E.; Streb, S.; Zeeman, S.C. Genetic Evidence That Chain Length and Branch Point Distributions Are Linked Determinants of Starch Granule Formation in Arabidopsis. Plant Physiol. 2014, 165, 1457–1474. [Google Scholar] [CrossRef]
  98. Vandromme, C.; Spriet, C.; Putaux, J.L.; Dauvillee, D.; Courseaux, A.; D’Hulst, C.; Wattebled, F. Further insight into the involvement of PII1 in starch granule initiation in Arabidopsis leaf chloroplasts. New Phytol. 2023, 239, 132–145. [Google Scholar] [CrossRef]
  99. Wang, X.; Xue, L.; Sun, J.; Zuo, J. The Arabidopsis BE1 gene, encoding a putative glycoside hydrolase localized in plastids, plays crucial roles during embryogenesis and carbohydrate metabolism. J. Integr. Plant Biol. 2010, 52, 273–288. [Google Scholar] [CrossRef]
  100. Bossi, F.; Cordoba, E.; Dupre, P.; Mendoza, M.S.; Roman, C.S.; Leon, P. The Arabidopsis ABA-INSENSITIVE (ABI) 4 factor acts as a central transcription activator of the expression of its own gene, and for the induction of ABI5 and SBE2.2 genes during sugar signaling. Plant J. 2009, 59, 359–374. [Google Scholar] [CrossRef]
  101. Boyer, L.; Roussel, X.; Courseaux, A.; Ndjindji, O.M.; Lancelon-Pin, C.; Putaux, J.L.; Tetlow, I.J.; Emes, M.J.; Pontoire, B.; C, D.H.; et al. Expression of Escherichia coli glycogen branching enzyme in an Arabidopsis mutant devoid of endogenous starch branching enzymes induces the synthesis of starch-like polyglucans. Plant Cell Environ. 2016, 39, 1432–1447. [Google Scholar] [CrossRef]
  102. Yan, H.; Zhang, W.; Wang, Y.; Jin, J.; Xu, H.; Fu, Y.; Shan, Z.; Wang, X.; Teng, X.; Li, X.; et al. Rice LIKE EARLY STARVATION1 cooperates with FLOURY ENDOSPERM6 to modulate starch biosynthesis and endosperm development. Plant Cell 2024, 36, 1892–1912. [Google Scholar] [CrossRef]
  103. Nagler, M.; Nukarinen, E.; Weckwerth, W.; Nagele, T. Integrative molecular profiling indicates a central role of transitory starch breakdown in establishing a stable C/N homeostasis during cold acclimation in two natural accessions of Arabidopsis thaliana. BMC Plant Biol. 2015, 15, 284. [Google Scholar] [CrossRef]
  104. Delatte, T.; Umhang, M.; Trevisan, M.; Eicke, S.; Thorneycroft, D.; Smith, S.M.; Zeeman, S.C. Evidence for distinct mechanisms of starch granule breakdown in plants. J. Biol. Chem. 2006, 281, 12050–12059. [Google Scholar] [CrossRef] [PubMed]
  105. Backstrom, S.; Elfving, N.; Nilsson, R.; Wingsle, G.; Bjorklund, S. Purification of a plant mediator from Arabidopsis thaliana identifies PFT1 as the Med25 subunit. Mol. Cell 2007, 26, 717–729. [Google Scholar] [CrossRef] [PubMed]
  106. Li, X.; Ahmad, A.M.; Zhong, Y.; Ding, L.; Blennow, A.; Fettke, J. Starch phosphorylation regulates starch granule morphological homogeneity in Arabidopsis thaliana. Plant Physiol. 2024, 194, 2600–2615. [Google Scholar] [CrossRef] [PubMed]
  107. Monroe, J.D.; Storm, A.R.; Badley, E.M.; Lehman, M.D.; Platt, S.M.; Saunders, L.K.; Schmitz, J.M.; Torres, C.E. beta-Amylase1 and beta-amylase3 are plastidic starch hydrolases in Arabidopsis that seem to be adapted for different thermal, pH, and stress conditions. Plant Physiol. 2014, 166, 1748–1763. [Google Scholar] [CrossRef]
  108. Soyk, S.; Simkova, K.; Zurcher, E.; Luginbuhl, L.; Brand, L.H.; Vaughan, C.K.; Wanke, D.; Zeeman, S.C. The Enzyme-Like domain of Arabidopsis nuclear beta-Amylases is critical for dna sequence recognition and transcriptional activation. Plant Cell 2014, 26, 1746–1763. [Google Scholar] [CrossRef]
  109. Schreier, T.B.; Umhang, M.; Lee, S.K.; Lue, W.L.; Shen, Z.; Silver, D.; Graf, A.; Muller, A.; Eicke, S.; Stadler-Waibel, M.; et al. LIKE SEX4 1 acts as a beta-Amylase-Binding Scaffold on starch granules during starch degradation. Plant Cell 2019, 31, 2169–2186. [Google Scholar] [CrossRef]
  110. Krokida, A.; Delis, C.; Geisler, K.; Garagounis, C.; Tsikou, D.; Pena-Rodriguez, L.M.; Katsarou, D.; Field, B.; Osbourn, A.E.; Papadopoulou, K.K. A metabolic gene cluster in Lotus japonicus discloses novel enzyme functions and products in triterpene biosynthesis. New Phytol. 2013, 200, 675–690. [Google Scholar] [CrossRef]
  111. Doyle, E.A.; Lane, A.M.; Sides, J.M.; Mudgett, M.B.; Monroe, J.D. An alpha-amylase (At4g25000) in Arabidopsis leaves is secreted and induced by biotic and abiotic stress. Plant Cell Environ. 2007, 30, 388–398. [Google Scholar] [CrossRef]
  112. Schopper, S.; Muhlenbock, P.; Sorensson, C.; Hellborg, L.; Lenman, M.; Widell, S.; Fettke, J.; Andreasson, E. Arabidopsis cytosolic alpha-glycan phosphorylase, PHS2, is important during carbohydrate imbalanced conditions. Plant Biol. 2015, 17, 74–80. [Google Scholar] [CrossRef]
  113. Liu, H.C.; Chen, H.C.; Huang, T.H.; Lue, W.L.; Chen, J.; Suen, D.F. Cytosolic phosphoglucose isomerase is essential for microsporogenesis and embryogenesis in Arabidopsis. Plant Physiol. 2023, 191, 177–198. [Google Scholar] [CrossRef]
  114. Flutsch, S.; Horrer, D.; Santelia, D. Starch biosynthesis in guard cells has features of both autotrophic and heterotrophic tissues. Plant Physiol. 2022, 189, 541–556. [Google Scholar] [CrossRef] [PubMed]
  115. Funfgeld, M.; Wang, W.; Ishihara, H.; Arrivault, S.; Feil, R.; Smith, A.M.; Stitt, M.; Lunn, J.E.; Niittyla, T. Sucrose synthases are not involved in starch synthesis in Arabidopsis leaves. Nat. Plants 2022, 8, 574–582. [Google Scholar] [CrossRef] [PubMed]
  116. Tsai, H.L.; Lue, W.L.; Lu, K.J.; Hsieh, M.H.; Wang, S.M.; Chen, J. Starch synthesis in Arabidopsis is achieved by spatial cotranscription of core starch metabolism genes. Plant Physiol. 2009, 151, 1582–1595. [Google Scholar] [CrossRef] [PubMed]
  117. Ventriglia, T.; Ballicora, M.A.; Crevillen, P.; Preiss, J.; Romero, J.M. Regulatory properties of potato-Arabidopsis hybrid ADP-glucose pyrophosphorylase. Plant Cell Physiol. 2007, 48, 875–880. [Google Scholar] [CrossRef]
  118. Ventriglia, T.; Kuhn, M.L.; Ruiz, M.T.; Ribeiro-Pedro, M.; Valverde, F.; Ballicora, M.A.; Preiss, J.; Romero, J.M. Two Arabidopsis ADP-glucose pyrophosphorylase large subunits (APL1 and APL2) are catalytic. Plant Physiol. 2008, 148, 65–76. [Google Scholar] [CrossRef]
Figure 1. The phenotype of antisense-ACLA plants is affected by the length of the light–dark photoperiod. (A) Phenotype of antisense-ACLA and WT plants grown under SD conditions at 42 days after imbibition. Bar = 1 cm. (B) Rosette diameter of antisense-ACLA and WT plants grown under SD conditions for 42 days, and LD conditions at 26 days after imbibition. Mean ± S.D., n = 16 plants. (C) Starch content of antisense-ACLA and WT plants grown under SD conditions for 42 days and LD conditions at 26 days after imbibition. Mean ± S.D., n = 5 plants, three individual experiments were repeated for analysis. Data under LD conditions in (B,C) are from a previous publication [33]. Student’s t-test was used to compare antisense-ACLA and WT plants in (B,C) (** p < 0.01).
Ijms 25 10850 g001
Figure 2. The antisense-ACLA mutation does not affect the circadian behavior in the expression of the Lhcb3 and CHS genes. Northern blot analyses of the Lhcb3, CHS, and 18S RNAs were conducted in antisense-ACLA and WT plants at 42 DAI, grown under an SD diurnal cycle. The analysis was repeated in two independent experiments.
Ijms 25 10850 g002
Figure 3. Clustering analysis of 272 differentially expressed genes affected by the circadian rhythm during an SD diurnal cycle in the WT seedlings at 42 DAI. These 272 genes were identified based on the most significant changes in expression during the SD diurnal cycle, with the FDR controlled at 0.00031. The 272 genes were grouped into seven clusters using the K-medoids clustering method [37]. Gene designations are provided in Supplementary Table S1. RNA was analyzed using GeneChip. The analysis was repeated in two independent experiments.
Ijms 25 10850 g003
Figure 4. Expression profiles of genes encoding enzymes related to starch metabolism during the SD diurnal cycle. Genes are grouped by their biochemical activity: (A) starch synthases (SSs), (B) starch branching enzymes (BEs), (C) starch debranching enzymes (DBEs), (D) starch disproportionating enzymes (DPEs), (E) β-amylases (BAMs), (F) α-amylases (AAMs), (G) starch phosphorylases (PHSs), and (H) other enzymes related to starch metabolism. Leaves from WT plants cultivated under short day (SD) conditions, consisting of 8 h of light followed by 16 h of dark, were collected at various times throughout the 24-h cycle. RNA from these samples was then examined using the Affymetrix Arabidopsis ATH1 chip. The average normalized intensity for each microarray chip is 1. RNA was analyzed using GeneChip. The analysis was repeated in two independent experiments.
Ijms 25 10850 g004
Figure 5. Zymogram analyses of starch modifying and synthesizing activities in extracts from leaves of WT and antisense-ACLA plants. (A) Protein extracts from 42-DAI leaves were subjected to electrophoresis in a polyacrylamide gel. Proteins were electroblotted to a starch-containing gel. Starch modifying enzyme activities were visualized by staining the gel with I2/KI. Activity of DBEs (AtISA1 and AtISA2; light blue bands) and BEs (AtBE3 and AtBE2; red/orange bands). (B) Protein extracts were fractionated by electrophoresis in a polyacrylamide gel containing 0.3% glycogen. The gel was incubated with ADP-glucose and stained with I2/KI. Dark bands identify the soluble starch synthases (AtSS3 and AtSS1). These experiments were repeated three times, showing very similar results.
Ijms 25 10850 g005
Figure 6. Clustering analysis of gene-expression profiles, with the highest expression differences between WT and antisense-ACLA plants grown under an SD diurnal cycle. (A) “Genotype” comparison between WT and antisense-ACLA plants; gene information is in Supplementary Table S3. (B) “Genotype*Time” comparison between WT and antisense-ACLA plants; gene information is in Supplementary Table S4. K-medoids clustering method [54] was used to identify the clusters. RNA was analyzed using GeneChip. The analysis was repeated in two independent experiments.
Ijms 25 10850 g006
Figure 7. Metabolic networks from FCModeler. (A) Metabolic network of carbohydrate and cell wall metabolism. (B) Selected pathway to show genes with altered RNA accumulation in sucrose and trehalose metabolism. Red arrows indicate genes that are up-regulated, and blue arrows indicate genes that are down-regulated in antisense-ACLA plants grown under an SD diurnal cycle. RNA was analyzed using GeneChip. The analysis was repeated in two independent experiments.
Ijms 25 10850 g007
Figure 8. Expression correlations among genes within the starch metabolic network. Expression correlations among starch metabolic genes were evaluated by 963 Affymetrix ATH1 microarray chips representing 70 different Arabidopsis experiments and analyzed by MOG [58]. Pearson correlation values are color-coded. Vertical bars (labeled #1, group 1; #2, group 2; and #3, group 3) denote the three groups of genes with the highest correlations. Group 1 represents genes involved in starch degradation, Group 2 includes genes primarily associated with starch synthesis, and Group 3 comprises genes involved in both starch synthesis and carbohydrate metabolism. Details for each group are described in the text.
Ijms 25 10850 g008
Figure 9. Gene expression correlated with the expression of the DPE2 gene. Gene-expression profiles of nine genes (PTPKIS1/SEX4, GWD1, ISA3, GWD3, ISA2, PHS2, PHS1, AT1G06460, and AT2G31040) correlated to the expression profile of DPE2 (Pearson’s correlation coefficients of between 0.72 and 0.84). Gene expression was evaluated at the level of RNA accumulation from 963 Affymetrix ATH1 microarray chips representing 70 different Arabidopsis experiments and analyzed by MOG [58]; the average expression level for each chip is 6.6.
Ijms 25 10850 g009
Table 1. Pathways with up- or down-regulated genes in 42-DAI seedlings of antisense-ACLA mutant grown in an SD diurnal cycle. Parentheses indicate the number of genes with differentially accumulated mRNA in a pathway compared to the total number of genes in that pathway. Pathways are from MetNetDB [55].
Pathways with Up-Regulated Genes (41/173)Pathways with Down-Regulated Genes (71/227)
Cell wall metabolism (7/24)Cell wall metabolism (17/42)
Xylose degradation (1/3)Mannose degradation (1/2)
Xylulose-monophosphate cycle (1/4)GDP-D-rhamnose biosynthesis (5/16)
D-arabinose catabolism (1/4)(Deoxy)ribose phosphate metabolism (4/10)
Dolichyl-diphosphooligosaccharide biosynthesis (2/10)Glucosinolate biosynthesis from homomethionine (2/5)
Sinapate ester biosynthesis (2/3)Monoterpene biosynthesis (2/3)
Fatty acid elongation (12/32)Phenylpropanoid biosynthesis (3/6)
Fatty acid elongation (3/5)Fatty acid oxidation (2/17)
Fatty acid omega-oxidation (1/2)Fatty acid beta-oxidation (2/17)
Cutin biosynthesis (1/1)Sulfur containing amino acid biosynthesis (17/63)
Mannosyl-chito-dolichol biosynthesis (2/3)Sulfur assimilation (6/21)
Mevalonate pathway (5/21)Homocysteine and cysteine interconversion (3/8)
Amino acid metabolism (8/33)Cysteine biosynthesis (2/13)
Phenylalanine biosynthesis I (2/3)Methionine biosynthesis (3/12)
Tyrosine biosynthesis II (2/4)Threonine biosynthesis from homoserine (3/9)
Lysine biosynthesis (2/19)Hormone metabolism and signal transduction (27/74)
Serine biosynthesis (2/7)Jasmonic acid biosynthesis (5/18)
Hormone metabolism (2/8)Abscisic acid biosynthesis (4/6)
Brassinosteroid biosynthesis (2/8)Cytokinins degradation (3/6)
Vitamins (3/11)Brassinosteroids signaling (4/12)
Biotin biosynthesis (3/11)APX1 signal transduction pathway (5/13)
Other (9/65)Lipoxygenase pathway (4/11)
Chlorophyll Biosynthesis (3/17)Autophagy (2/8)
Glyoxylate cycle (2/17)Other (8/31)
Glucose 1-phosphate metabolism (1/4)Glutamate degradation III (1/3)
De novo biosynthesis of pyrimidine ribonucleotides (3/27)Tryptophan biosynthesis (7/28)
Table 2. Differentially expressed carbohydrate- and cell wall-metabolism genes in the antisense-ACLA mutant. Fold-change values (shown in bold) were calculated by comparing expression of each gene in the WT plants at three time points: 1 h in the light (L1); and 0.5 h (D0.5) and 4 h (D4) in the dark. Only genes with greater than 2-fold changes in values, and with error bars that do not overlap between genotypes, are listed. Expression in antisense-ACLA mutant is up-regulated (red fold-change) or down-regulated (blue fold-change).
Genes Up-Regulated Genes Down-Regulated
Starch synthesisStarch degradation
ADPGlu-PP (APL4, At4g39210) 2 (L1)AAM2 (At4g25000)-2 (L1)
ADPGlu-PP (APL3, At2g21590) 3.4 (D0.5)BAM1 (At4g15210)-3 (D0.5)
TrehaloseTrehalose
Trehalose-6-P phosphatase (At5g65140) 3 (L1) Trehalose-6-P phosphatase (At1g22210)-3 (L1, D4)
Trehalose-6-P phosphatase (At4g12430) 2.1 (D0.5)
Cell wall synthesisCell wall synthesis
UDP-galactose 4-epimerase (At2g34850) 6.2 (D0.5) UDP-glucose/galactose 4-epimerase-like protein (At4g20460)-2 (D0.5)
Cellulose synthase like gene (AtCslA10, At1g24070) 3.2 (D0.5) Mannose-6-phosphate isomerase 1 (At3g02570)-2 (D0.5)
Cellulose synthase like gene (AtCslA03, At1g23480) 2 (D4) Rhamnosyltransferase, hemicellulose (At1g64910)-2 (D0.5)
Cell wall modificationCell wall modification
Beta-expansin (EXPB1, At2g20750) 2 (L1) Xyloglucan endotransglycosylase (At5g65730)-2 (L1)
Beta-expansin (EXPB3, At4g28250) 3 (L1) 2.4 (D0.5) Pectinesterase (At2g26440)-3 (D0.5)
Invertase/pectin methylesterase inhibitor (At2g47670) 3.7 (D0.5) Pectinesterase (At4g33220)-2 (D0.5)
Expansin, putative (EXP9, At5g02260) 3 (D4) Pectinesterase (At2g47550)-2 (D4)
Xyloglucan endotransglycosylase 1 (At3g23730) 5 (D4) Pectinacetylesterase (At3g09410)-2 (D4)
Xyloglucan endotransglycosylase (At4g03210) 5 (D4) Invertase/pectin methylesterase inhibitor (At1g10770)-3 (D4)
Xyloglucan endotransglycosylase (At1g10550) 4 (D4)
Endo-xyloglucan transferase (XTR7) (At4g14130) 3 (D4)
Pectin methylesterase (At5g47500) 2 (D4)
Invertase/pectin methylesterase inhibitor (At3g47380) 2 (D4)
Cell wall degradationCell wall degradation
(1-4)-beta-mannan endohydrolase (At5g66460) 3 (L1) Xyloglucan endo-1,4-beta-D-glucanase (SEN4, At4g30270)-4 (L1)
Polygalacturonase (At1g10640) 3 (L1) Xyloglucan endo-1,4-beta-D glucanase (XTR-3, At4g30280)-3 (L1)
Pectate lyase (At1g67750) 2 (L1) 2.1 (D0.5) Pectate lyase (At4g13210)-2 (L1)
Beta-xylosidase (At1g02640) 2 (D4) Polygalacturonase inhibiting protein 2 (PGIP2, At5g06870)-2 (D0.5)
Xyloglucan endo-1,4-beta-D-glucanase (XTR-6, At4g25810)-2 (D0.5)
Xyloglucan endo-1,4-beta-D-glucanase (At5g48070)-2 (D4)
Table 3. Genes that are highly correlated with ISA1 expression at the level of RNA accumulation, as analyzed by MOG [58].
GeneCorrelation CoefficientLocus ID
ISA11.00At2g39930
ISA20.74At1g03310
Pti10.73At1g26150
DPE10.72At5g64860
Expressed protein0.72At4g10470
RCP1/MEX10.68At5g17520
Desulfhydrase0.67At1g48420
Expressed protein0.67At3g60810
PHS10.66At3g29320
Disclaimer/Publisher’s Note: The statements, opinions and data contained in all publications are solely those of the individual author(s) and contributor(s) and not of MDPI and/or the editor(s). MDPI and/or the editor(s) disclaim responsibility for any injury to people or property resulting from any ideas, methods, instructions or products referred to in the content.

