Article

Exploring Immune Cell Diversity in the Lacrimal Glands of Healthy Mice: A Single-Cell RNA-Sequencing Atlas

1
Department of Pathology, School of Medicine, Jinan University, Guangzhou 510632, China
2
International Ocular Surface Research Center, Key Laboratory for Regenerative Medicine, Institute of Ophthalmology, Jinan University, Guangzhou 510632, China
3
Department of Ophthalmology, The First Affiliated Hospital of Jinan University, Jinan University, Guangzhou 510630, China
*
Author to whom correspondence should be addressed.
Int. J. Mol. Sci. 2024, 25(2), 1208; https://doi.org/10.3390/ijms25021208
Submission received: 26 November 2023 / Revised: 5 January 2024 / Accepted: 9 January 2024 / Published: 19 January 2024
(This article belongs to the Section Molecular Immunology)

Abstract

:
The lacrimal gland is responsible for maintaining the health of the ocular surface through the production of tears. However, our understanding of the immune system within the lacrimal gland is currently limited. Therefore, in this study, we utilized single-cell RNA sequencing and bioinformatic analysis to identify and analyze immune cells and molecules present in the lacrimal glands of normal mice. A total of 34,891 cells were obtained from the lacrimal glands of mice and classified into 18 distinct cell clusters using Seurat clustering. Within these cell populations, 26 different immune cell subpopulations were identified, including T cells, innate lymphocytes, macrophages, mast cells, dendritic cells, and B cells. Network analysis revealed complex cell-cell interactions between these immune cells, with particularly significant interactions observed among T cells, macrophages, plasma cells, and dendritic cells. Interestingly, T cells were found to be the main source of ligands for the Thy1 signaling pathway, while M2 macrophages were identified as the primary target of this pathway. Moreover, some of these immune cells were validated using immunohistological techniques. Collectively, these findings highlight the abundance and interactions of immune cells and provide valuable insights into the complexity of the lacrimal gland immune system and its relevance to associated diseases.

1. Introduction

The lacrimal gland, located in the human orbital cavity, is a versatile exocrine gland that plays a central role in maintaining the physiological balance of the eye [1]. The primary secretory function of the lacrimal gland is the production of tears, which serve as a lubricant for the ocular surface, protecting it from desiccation and abrasion caused by friction with the eyelids [2]. Tears contain a variety of antimicrobial components, including antimicrobial peptides, immunoglobulin A (IgA), and complement components [3]. These molecular fortifications, complemented by the mechanical action of the blink, collectively act as sentinels to protect the ocular surface from microbial invasion. In addition, tears contain a wealth of essential nutrients that promote the proliferation and differentiation of ocular surface cells [4]. Notably, tears are also recognized as a physiological response to emotional stimuli, such as grief, joy, or fear, and serve as a conduit for emotional expression [5]. Thus, a thorough understanding of the cellular makeup of the lacrimal gland is paramount to unraveling its physiological functions.
Like other exocrine glands, the lacrimal gland harbors a diverse repertoire of immune cells, each contributing to its normal function through a spectrum of mechanisms [6]. Equipped with an arsenal of immune defense, pathogen recognition, and resistance to microbial invasion, these immune sentinels provide a bulwark against microbial invasion. In addition, these immune cells participate in tissue regeneration and repair by orchestrating the elimination of senescent, damaged, or deceased cells and cellular debris, thereby facilitating tissue homeostasis. The immunological orchestra is further enriched by the secretion of immunoregulatory factors, such as cytokines and antibodies, which orchestrate immune responses and avert the dangers of excessive activation or immunological dysfunction. In addition, immune cells orchestrate a symphony of metabolic regulators that actively participate in the orchestration of energy metabolism and nutrient homeostasis within the lacrimal gland.
The lacrimal gland contains a variety of immune cell subpopulations [6,7], including B lymphocytes [8], T lymphocytes [7], natural killer (NK) cells [8], γδ T cells [7], macrophages (MΦ) [9,10], and dendritic cells (DCs) [11,12], each with its own unique mechanism of physiological regulation. B lymphocytes, which specialize in antibody production, play a central role in the exocrine glands, particularly in the production of mucosal IgA. Meanwhile, T lymphocytes, characterized by their exquisite specificity, spearhead the recognition and elimination of invading pathogens within the exocrine glands. Notably, NK cells have the remarkable ability to destroy pathogens and tumor cells independently of specific recognition, primarily clearing the lacrimal gland of invading pathogens and cellular intruders. Finally, DCs, acting as master antigen-presenters, capture and present invading pathogens and antigens, thereby recruiting other immune cohorts within the lacrimal gland, as exemplified by the activation of T lymphocytes.
Recently, single-cell RNA sequencing (scRNA-seq) technology has provided unprecedented insights into cellular heterogeneity, enabling the identification of unexpected cell characteristics. In particular, the construction of cellular atlases for normal tissues based on scRNA-seq data lays the foundation for the analysis of cells in pathological states, leading to a deeper understanding of the pathological mechanisms underlying the lacrimal gland. While some recent scRNA-seq studies have focused on the analysis of secretory cells within glandular acini [13,14,15], our knowledge of immune cells within the stromal layer of the mouse lacrimal gland remains limited. Therefore, the aim of our study was to further analyze the immune cell populations within the lacrimal gland, along with their characteristics, at the resolution offered by scRNA-seq and thereby gain deeper insights into the diversity of immune cells within the lacrimal gland.

2. Results

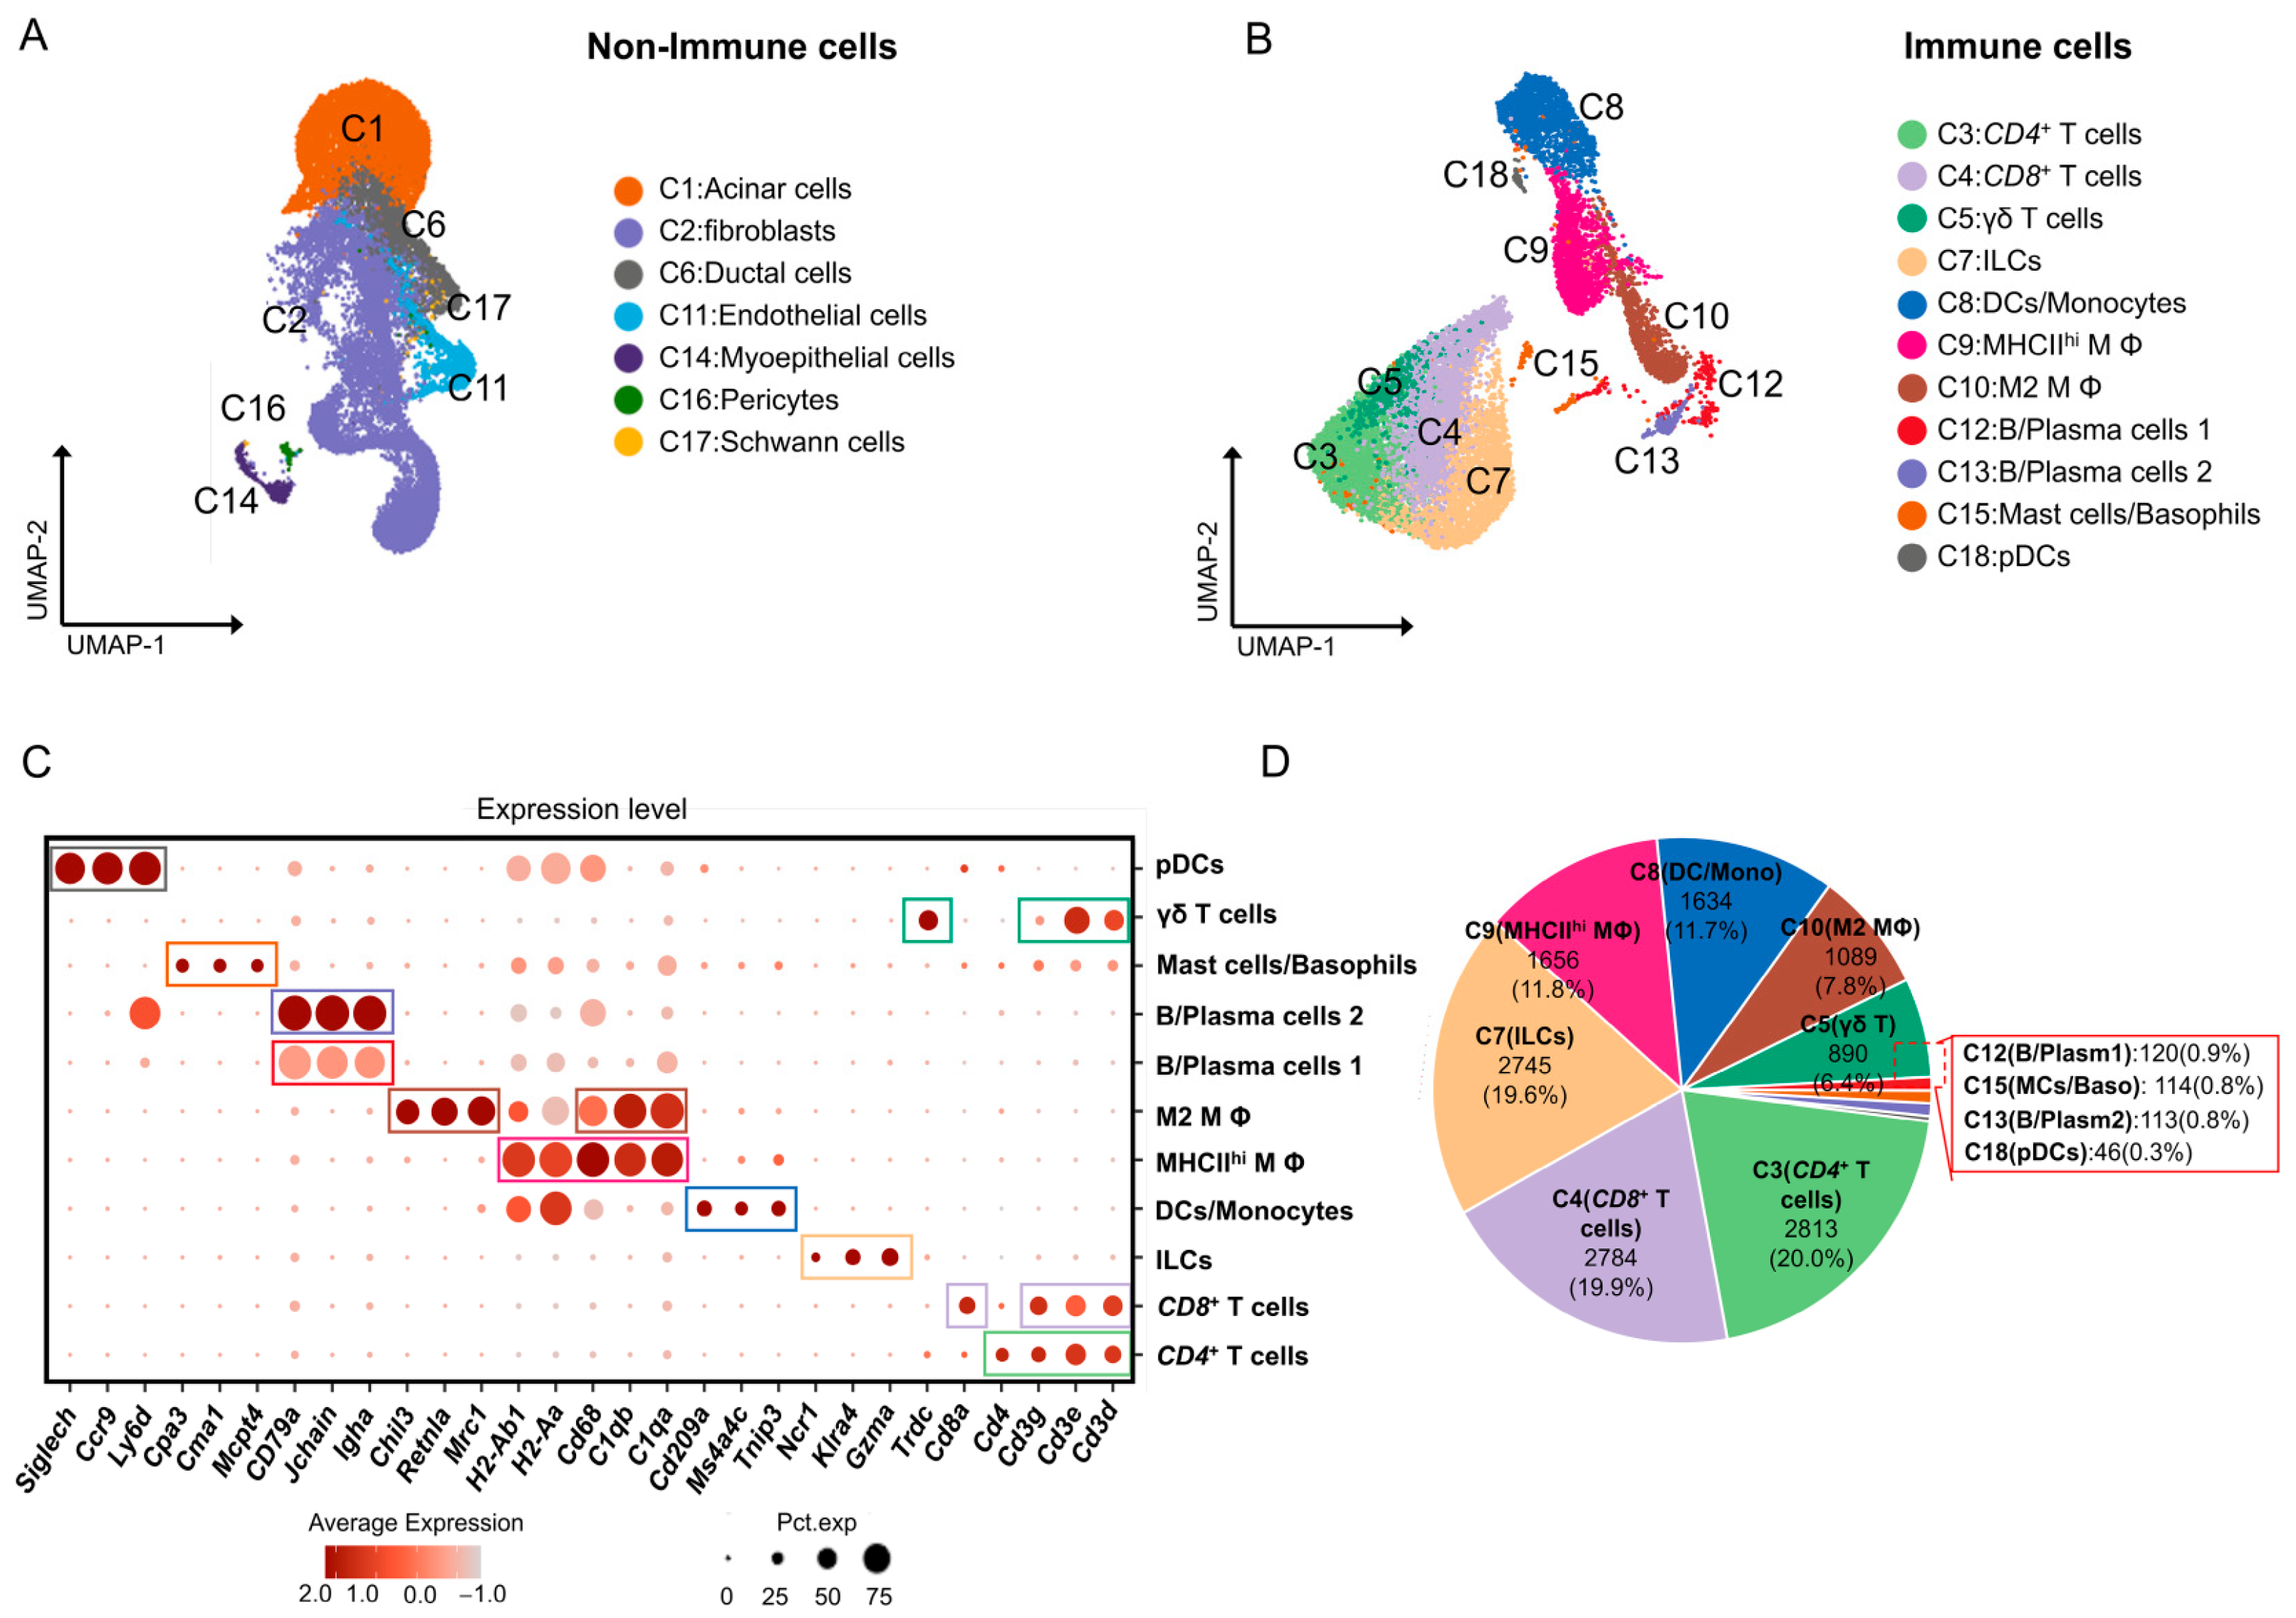
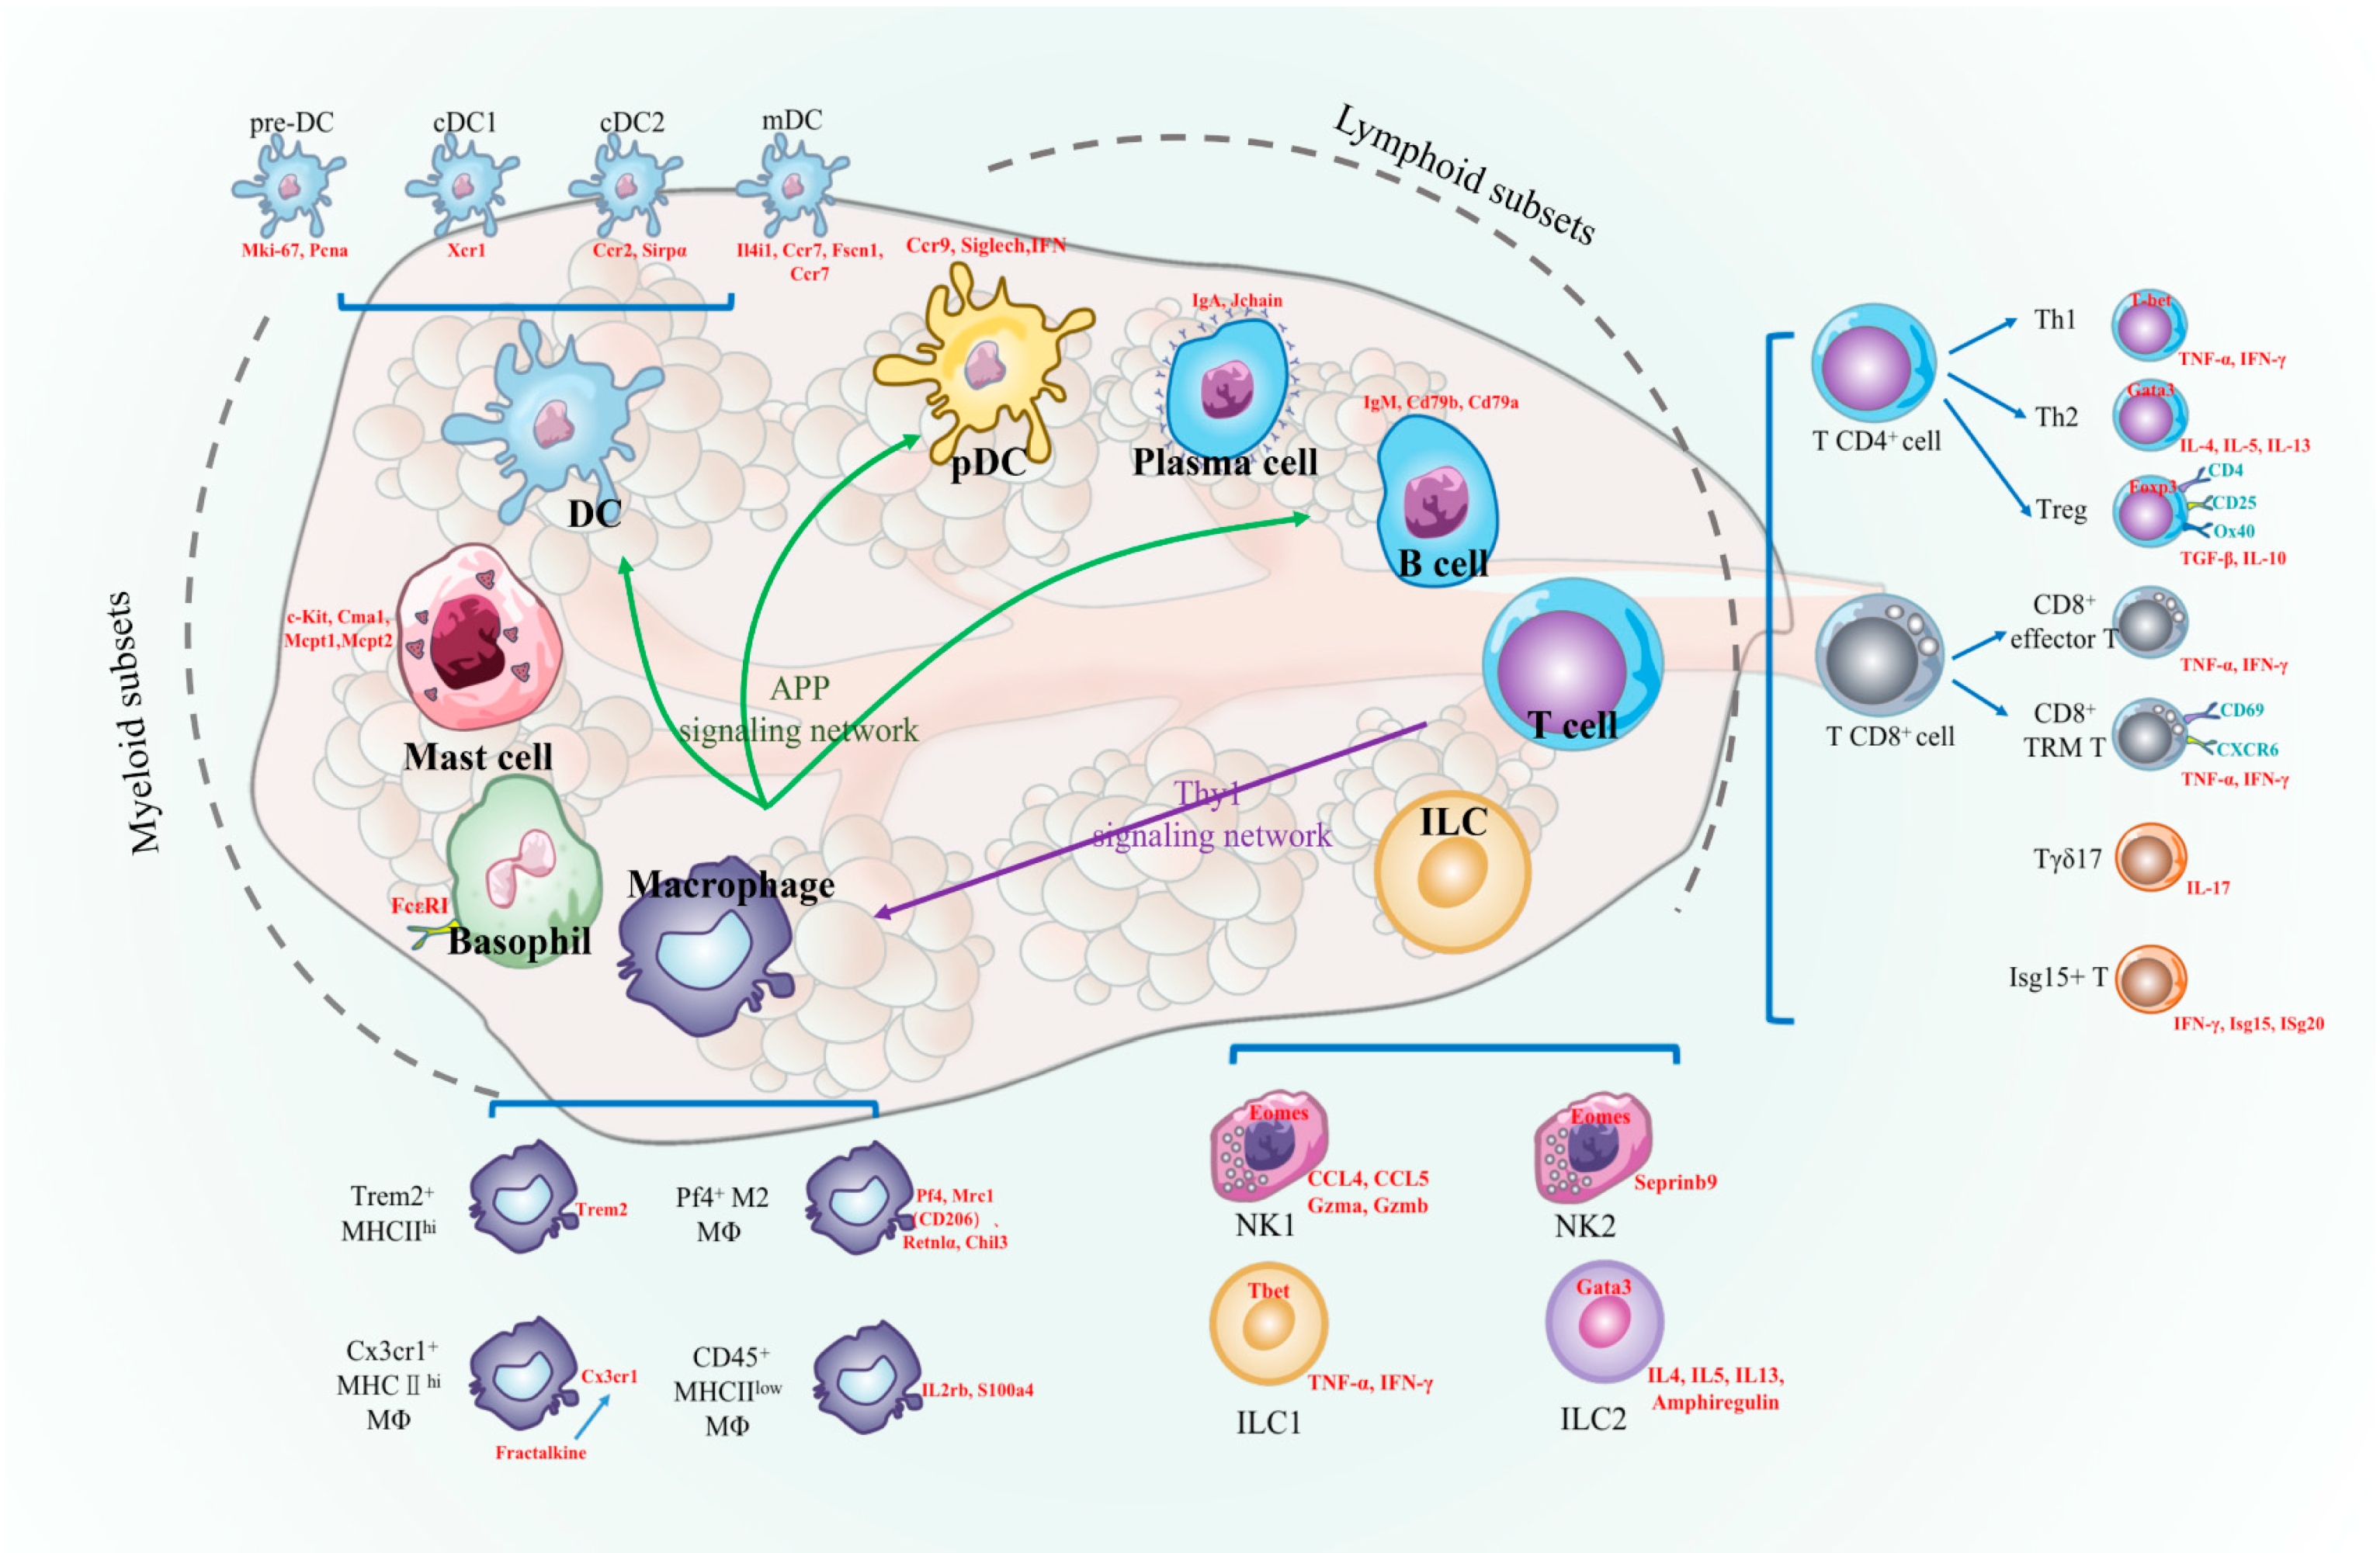
2.1. Single-Cell Transcription of Immune Cell Subpopulations in Mouse ELGs

We collected four fresh ELG samples from 12–14-week-old male C57/B6J mice, pooling bilateral lacrimal glands from the same mice into one sample to ensure an adequate number of cells was collected. The collected samples were then subjected to scRNA-seq using the 10× Genomics platform (Figure S1A). To ensure data quality, we implemented quality control measures to remove double/multiple cells and apoptotic cells (Figure S1B,C). This resulted in a total of 34,891 mouse ELG cell samples for further analysis.
Using Seurat, a graph-based cluster analysis tool, we performed unsupervised clustering and UMAP dimensionality reduction analysis on the collected cell samples; this allowed us to identify 18 transcriptionally defined cell subpopulations (Figure S1D). To determine the general location of each subpopulation, we utilized classical marker genes and UMAP visualization (Figure S1D).
To categorize the cells based on gene expression, we focused on the leukocyte common antigen gene Ptprc. By doing so, we were able to classify the cells into two main categories: nonimmune and immune cells (Figure 1). Within the nonimmune cell category, we identified several distinct subpopulations, including epithelial cells characterized by the expression of Espam and Fxyd3 [13,16]; myoepithelial cells characterized by the expression of Acta2 and Krt14 [17]; vascular endothelial cells characterized by the expression of Cyyr1, Esam, and Flt1 [18]; fibroblasts characterized by the expression of Col1a1, Gsn, and Apod [19]; pericytes characterized by the expression of Kcnj8, Vtn, and Abcc9 [20]; and Schwann cells characterized by the expression of Foxd3, Plp1, and Kcna1 [21] (Figure S1C–E). Importantly, we identified seven immune cell subpopulations in adult male mouse ELGs, each with well-defined characteristics [22]. These subpopulations included T cells expressing Cd3d, Cd3e, and Cd3g [23], including CD4+ T cells, CD8+ T cells, and γδ T cells with high expression of Trdc [24,25,26], innate lymphoid cells (ILCs) expressing Klra4, Ncr1, and Gzma [27,28,29], macrophages (MΦ) expressing C1qa, C1qb, and CD68 [30,31], including MHC IIhi MΦ with high expression of MHC class II molecules (H2-Ab1, H2Aa) and M2 MΦ with high expression of Mrc1 (encoding CD206), Retnlα (Fizz1), and Chil3 (Chi3l3, Ym1) [32], DCs expressing Cd209a, Ms4a4c, and Tnip3 [33,34], plasmacytoid dendritic cells (pDCs) expressing Siglech, Ccr9, and Ly6d [35,36,37], B cells and plasma cells expressing Igha, Jchain, and Igkc [19,38], and mast cells expressing Mcpt4, Cma1, and Cpa3 [39,40,41] (Figure 1C).
To determine the distribution of these immune cell subpopulations, we calculated their number and percentage in the total immune cell population of the ELGs. Our results showed that the T-cell subpopulation had the highest percentage, accounting for 46.1% of the total cell population, followed by ILCs (18.3%), MΦs (18.4%), and DCs (11.1%) (Figure 1D). In conclusion, our scRNA-seq analysis revealed distinct immune cell subpopulations in adult male mouse ELGs. Further investigation of these subpopulations may provide valuable insights into their roles and functions in the immune response within ELGs.

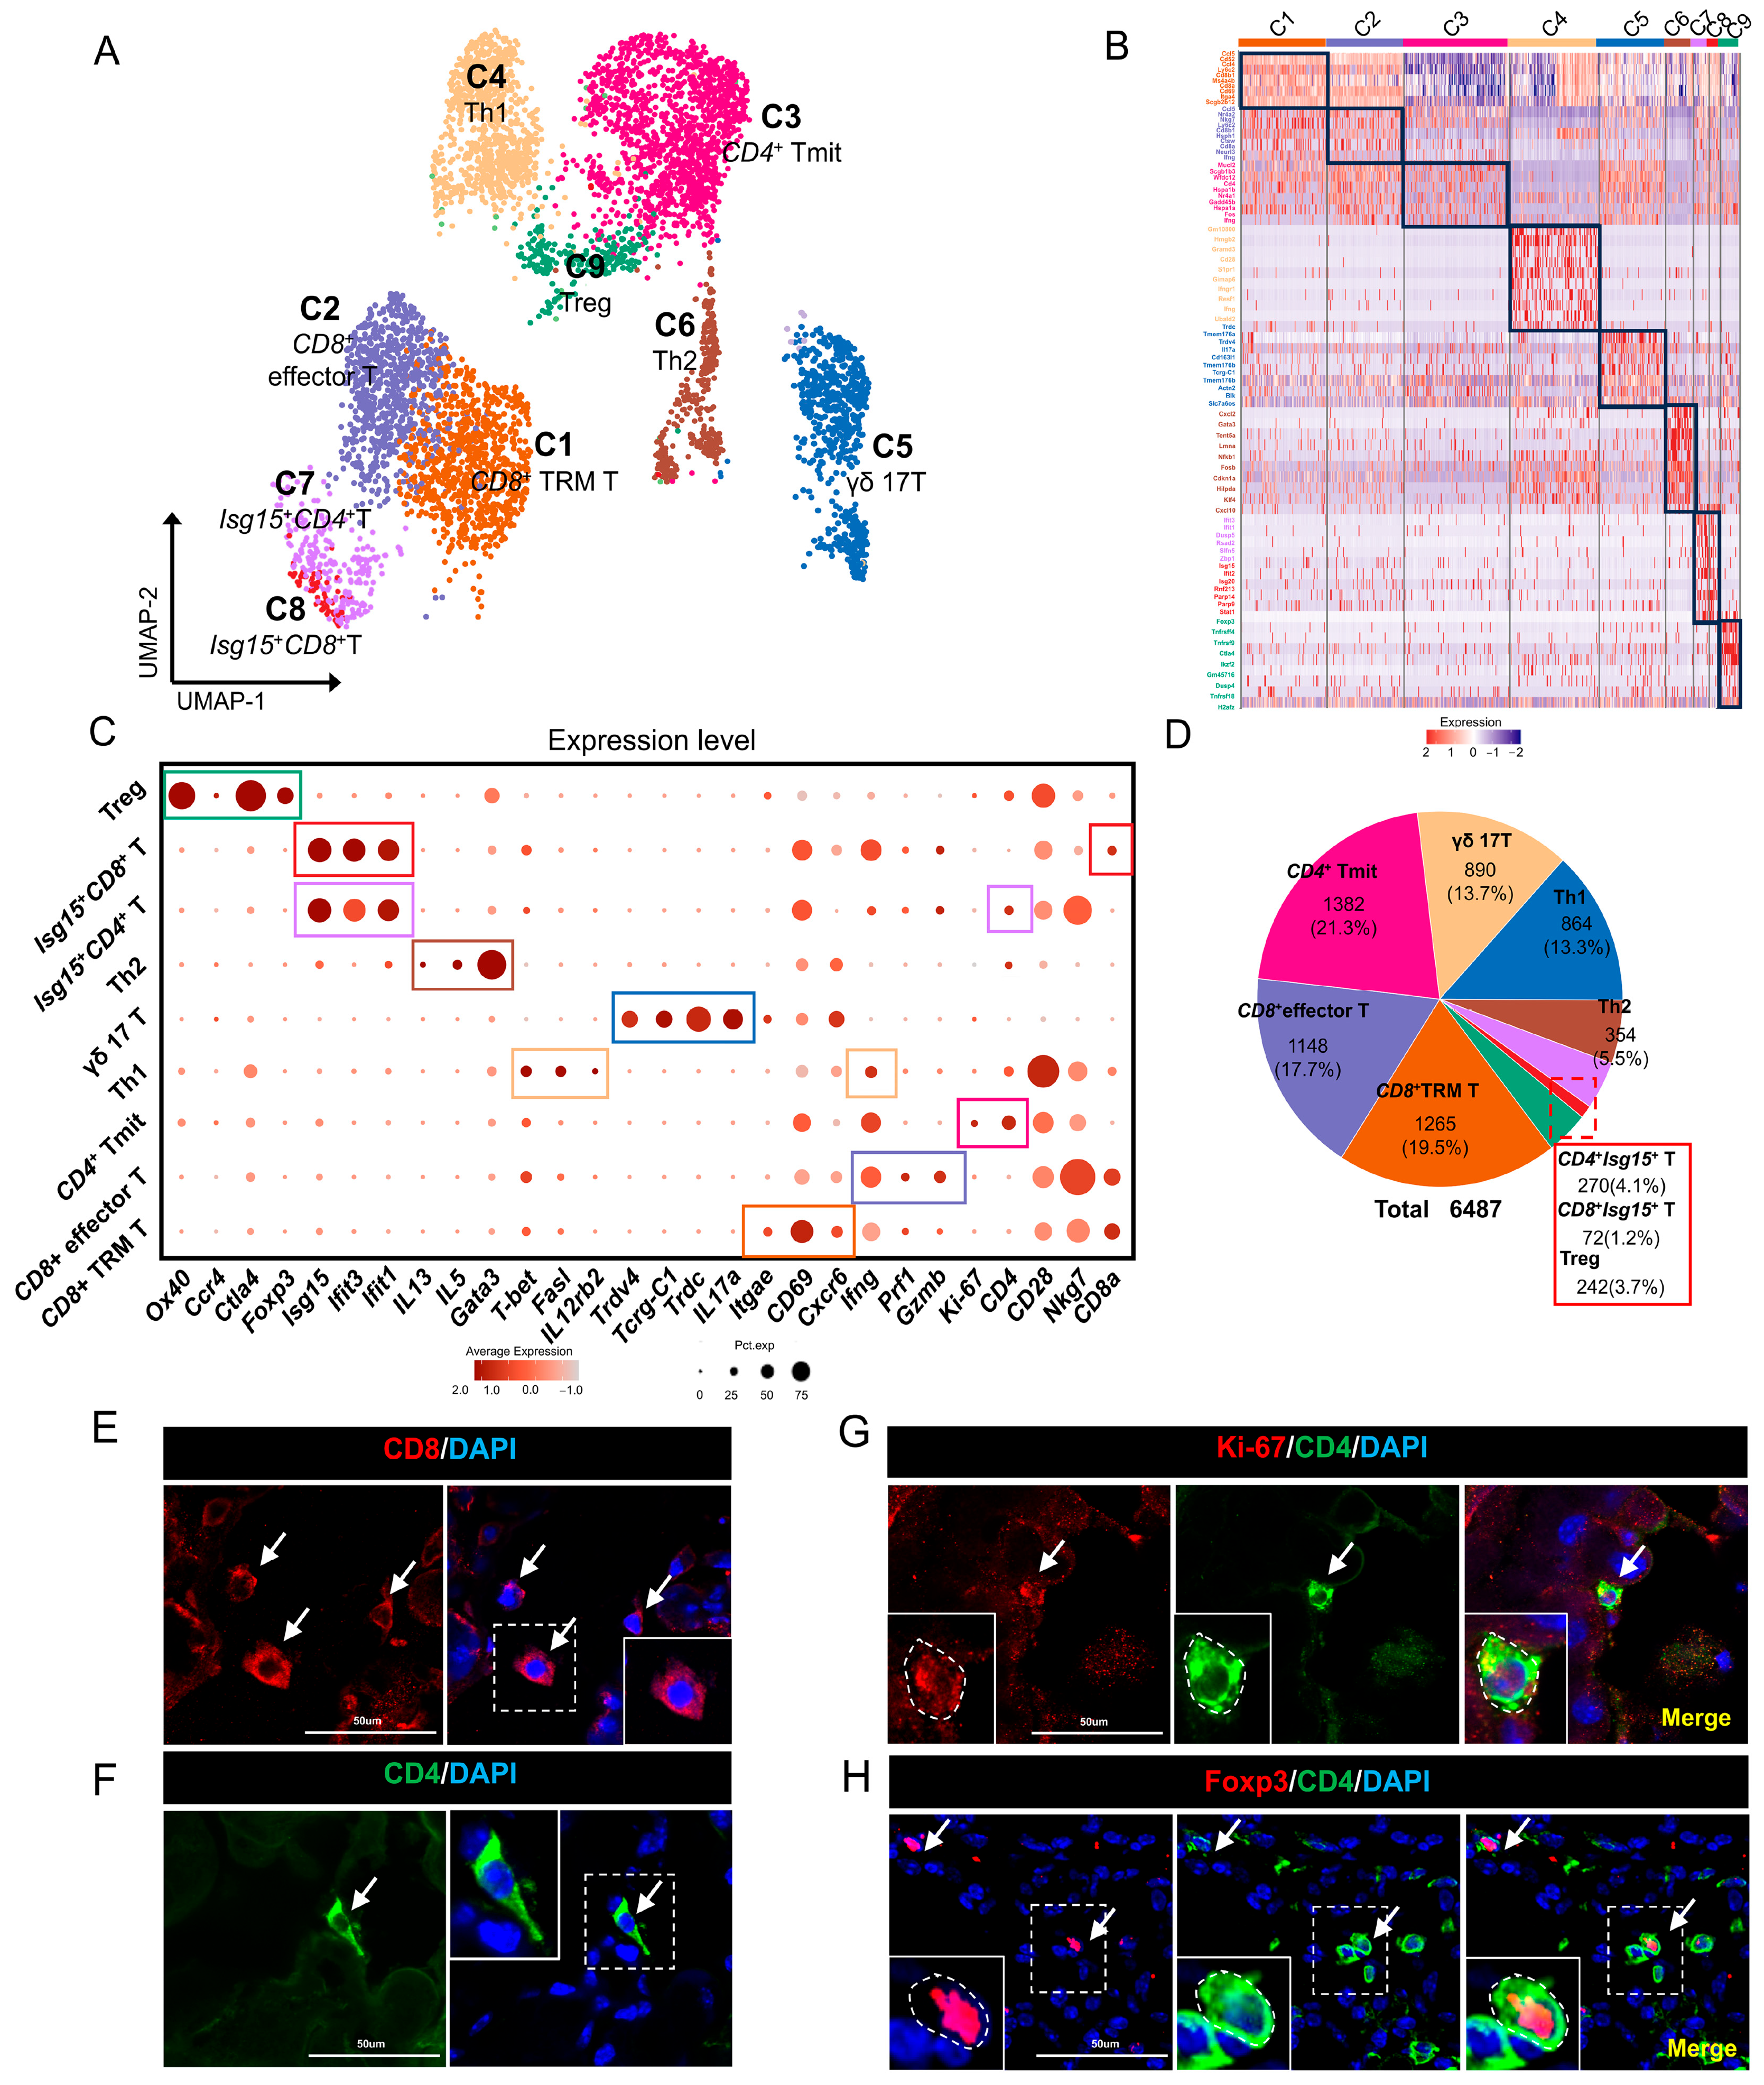
2.2. T Cells in Mouse ELGs

To investigate the characteristics of T-cell subpopulations in the mouse lacrimal glands, we further analyzed 6487 T cells selected from four samples using UMAP dimensional reduction analysis after a second round of clustering analysis (Figure 2A,B).
Among the cell clusters, Cluster 1 was identified as CD8+ tissue-resident memory (TRM) T cells due to its high expression of CD8a, CD28, CD69, Cxcr6, and Itgae [42]. In contrast to Cluster 1, Cluster 2 represented a distinct group of CD8-positive T cells. These cells were classified as CD8+ effector T cells based on their high expression of effector T-cell marker genes such as Gzmb, Prf1, and Ifng [43] (Figure 2C). Further analysis of Cluster 2 cells revealed elevated levels of the cytotoxicity-related genes Nkg7, Gzmk, and Ctla2a, supporting their annotation as CD8+ cytotoxic T cells [44,45].
Immunofluorescence validation confirmed the presence of CD8+ T cells in the lacrimal glands (Figure 2E). Figure S2 displays the functional KEGG pathways and GO-BP analysis of gene expression in CD8+ TRM T cells and CD8+ effector T cells. Cluster 3 was characterized by the expression of CD4 and the proliferation-related gene Mki67 (encoding Ki-67) and was identified as proliferating CD4+ T_mit cells [46] (Figure 2C). Immunofluorescence analysis further confirmed the presence of Mki67+CD4+ T_mit cells (Figure 2G). Cluster 4, in addition to expressing CD4, also specifically expressed IL12rb2, T-bet and FasL, suggesting that these cells are Th1 cells [47,48,49]. Cluster 5 expressed Trdc (encoding T-cell receptor δ constant chain), Il17a, and Tcrg-C1 (encoding T-cell receptor γ constant chain-1) [26,50,51]. Additionally, this group of cells only expressed the variable region gene Trdv4 of the T-cell receptor (TCR) γ chain. Therefore, Cluster 5 was annotated as IL-17a-producing Vγ4 γδ T cells (Figure 2C). Functional KEGG and GO-BP analyses showed that genes expressed by the IL-17a-producing Vγ4 γδ T-cell population were mainly enriched in IL-17A, protein export, and Fc gamma R-mediated phagocytosis and were relatively abundant in biological processes such as response to oxygen-containing compound, response to endogenous stimulus, and cell activation involved in immune response (Figure S2). Cluster 6, while expressing CD4, also showed high expression of the Th2-specific markers Gata3, IL5, and IL13 [52,53,54]. Therefore, Cluster 6 was identified as Th2 cells. Cluster 7, while expressing CD8, also demonstrated significant upregulation of the Ifit1, Ifit2, Isg15, and Isg20 genes. Therefore, this specific T-cell population was characterized as Isg15+ CD8+ T cells [55,56,57] (Figure 2C). In contrast, Cluster 8 exhibited high expression of the interferon (IFN)-related genes Ifit1, Ifit2, Isg15, and Isg20, but unlike Cluster 7, these cells were CD4 positive; consequently, they were classified as Isg15+ CD4+ T cells.
Finally, Cluster 9 showed high expression of CD4, Foxp3, Ccr4, and Ox40 and was classified as regulatory T cells (Tregs) [58,59,60,61]. In addition, Tregs in the lacrimal glands also showed high expression of the marker genes Ctla4 (encoding cytotoxic T lymphocyte-associated protein 4) and Nrp1 (encoding neuropilin-1), one of the receptors of semaphorin3A associated with Treg immunosuppressive function. Immunofluorescence analysis confirmed the presence of CD4+Foxp3+ Tregs in the lacrimal glands (Figure 2H). Functional KEGG and GO-BP analyses showed that genes expressed by the Treg cell population were mainly enriched in the T-cell receptor signaling pathway, Jak-STAT signaling pathway, and chemokine signaling pathway and were relatively abundant in biological processes such as apoptotic processes and cytokine-mediated signaling pathways (Figure S2). Overall, the results of this study demonstrate the heterogeneous distribution of T-cell subpopulations in the mouse lacrimal glands.

2.3. ILCs in Mouse ELGs

To understand the characteristics of ILC subpopulations in the mouse ELGs, we further divided the 2745 ILCs screened in the four samples into subpopulations by a second round of combined clustering analysis. UMAP dimensionality reduction analysis yielded four clusters of ILCs (Figure 3A,B). Among these four clusters, Cluster 1 and Cluster 2 were annotated as NKs due to the expression of the NK-specific transcription factor Eomes [62]. In agreement with the literature, Cluster 1 was annotated as NK1s due to the relatively high expression of Itgae (encoding CD11b) and low expression of CD27, while Cluster 2 was annotated as NK2s due to the low expression of Itgae and high expression of CD27. Functional enrichment analysis using KEGG revealed that the genes expressed in the NK1 cell cluster were primarily enriched in signaling pathways related to natural killer cell cytotoxicity, apoptosis, and necroptosis. GO-BP analysis further demonstrated enrichment in biological processes associated with NK cell function, such as cell activation involved in immune response, response to cytokine, and positive regulation of gene expression (Figure S3). Functional KEGG analysis of the NK2 cell cluster revealed that the genes expressed predominantly in this cluster were enriched in pathways related to natural killer cell-mediated cytotoxicity and interactions with cytokines (viral protein interaction with cytokine and cytokine receptor, cytokine-cytokine receptor interaction). GO-BP analysis showed that the genes expressed in the NK2 cluster were primarily enriched in biological processes such as viral gene expression and establishment of protein localization at the membrane (Figure S3).
Cluster 3 highly expresses the ILC1 marker genes Klrb1c (encoding CD161, Nk1.1) and Ncr1 (encoding Nkp46) [63] and was therefore annotated as an ILC1 subset (Figure 3C,D). Functional analysis using KEGG revealed that the genes expressed in the ILC1 cell cluster were primarily enriched in signaling pathways related to apoptosis, NF-kappa B, and TNF. GO-BP analysis further demonstrated that genes expressed in the ILC1 cell cluster are involved in biological processes related to immune cell adhesion and activation (Figure S3).
Cluster 4 expresses the classical ILC2 markers Areg, Csf2, and Gata3 [23,64] and therefore belongs to the ILC2 subgroup (Figure 3C,D). Functional enrichment analysis using KEGG revealed that the genes expressed in the ILC2 cell cluster were primarily enriched in TNF- and IL-17-associated signaling pathways. GO-BP analysis further demonstrated enrichment in biological processes such as the apoptotic process, positive regulation of the nucleobase-containing compound metabolic process, and positive regulation of the biosynthetic process (Figure S3). Figure 3E shows the total number of cell clusters of these four groups and their respective percentages of all ILC cell populations in mouse ELGs. In conclusion, our research findings demonstrate the heterogeneous distribution of ILCs in mouse lacrimal glands, suggesting their potential involvement in various immunological physiological processes.

2.4. MΦs in Mouse ELGs

To characterize the MΦ subpopulations in the mouse ELGs, we first utilized UMAP downconversion to analyze the 2745 MΦs obtained from the four samples. Through a second round of cluster analysis, our dataset identified four distinct clusters (Figure 4A,B). Cluster 1, referred to as Trem2+ MHC IIhi MΦ, was characterized by its high expression of MHC class II antigens, specifically H2-Aa and H2-Ab1. Additionally, this cluster exhibited elevated expression of Tyrobp (encoding DAP12), Trem2 (encoding TREM-2), and Fth1 (Figure 4C). These molecular signatures were indicative of the Trem2+ MHC-IIhi MΦ subpopulation [31,65,66]. Functional KEGG enrichment analysis revealed that the genes expressed in the Trem2+ MHC IIhi MΦ cluster were mainly enriched in cell engulfment and death-related signaling pathways, such as the lysosome, phagosome, ferroptosis, and pentose phosphate pathways. Additionally, GO-BP analysis showed that these cells were predominantly enriched in the cellular amide metabolic process, cellular macromolecule catabolic process, and peptide metabolic process, indicating their involvement in cellular molecular degradation and metabolic processes (Figure S4).
Cluster 2 demonstrated pronounced expression of 44 as well as high expression of the M2 MΦ marker genes Mrc1 (encoding mannose receptor 1, CD206), Cd163 (encoding macrophage scavenger receptor CD163), Retnla (encoding resistin-like molecule alpha (RELMα)), and Chil3 (Chi3l3, Ym1) [67,68,69,70], leading to its classification as a Pf4+ M2 MΦ (Figure 4C). Functional KEGG enrichment analysis revealed that the genes expressed in this subpopulation of cells were mainly enriched in cell-engulfment-related signaling pathways, such as endocytosis and phagosomes, as well as the MAPK signaling pathway. Additionally, GO-BP analysis showed that these cells were enriched in immune effector processes, such as the defense response, regulation of immune system processes, and response to oxygen-containing compounds (Figure S4).
Cluster 3, characterized by its high expression of Cx3cr1 and MHC-II class II antigens, was designated Cx3cr1+MHCIIhi MΦ [71] (Figure 4C). Functional KEGG enrichment analysis revealed that the genes expressed in the Cx3cr1+MHCIIhi MΦ cluster were mainly enriched in Toll-like receptor and MAPK signaling pathways. Additionally, GO-BP analysis showed that these cells were enriched in apoptotic signaling pathways, regulation of cell death, and response to abiotic stimulus biological processes (Figure S4).
Finally, Cluster 4 was identified as the CD45+ MHCIIlow MΦ subpopulation [25,72]. This classification was based on its elevated expression levels of Serpinb2 and Ptprc, along with lower levels of MHC-II class antigen (Figure 4C). Functional KEGG enrichment analysis revealed that the genes expressed in this subpopulation of cells were predominantly enriched in signaling pathways related to spliceosomes and NF-κB. Conversely, GO-BP analysis demonstrated significant enrichment in cellular processes involved in the metabolic breakdown of biological substances, such as the mRNA metabolic process, macromolecule catabolic process, and organic cyclic compound catabolic process (Figure S4). Figure 4D provides an overview of the total number and respective percentages of these four MΦ clusters within the overall MΦ population. Furthermore, we validated the presence of MΦs using immunofluorescence and the MΦ-specific marker CD64 (Figure 4E) [73]. In conclusion, our findings have revealed the presence of heterogeneous subpopulations of MΦs in the mouse ELG, which are probably involved in various immunological processes.

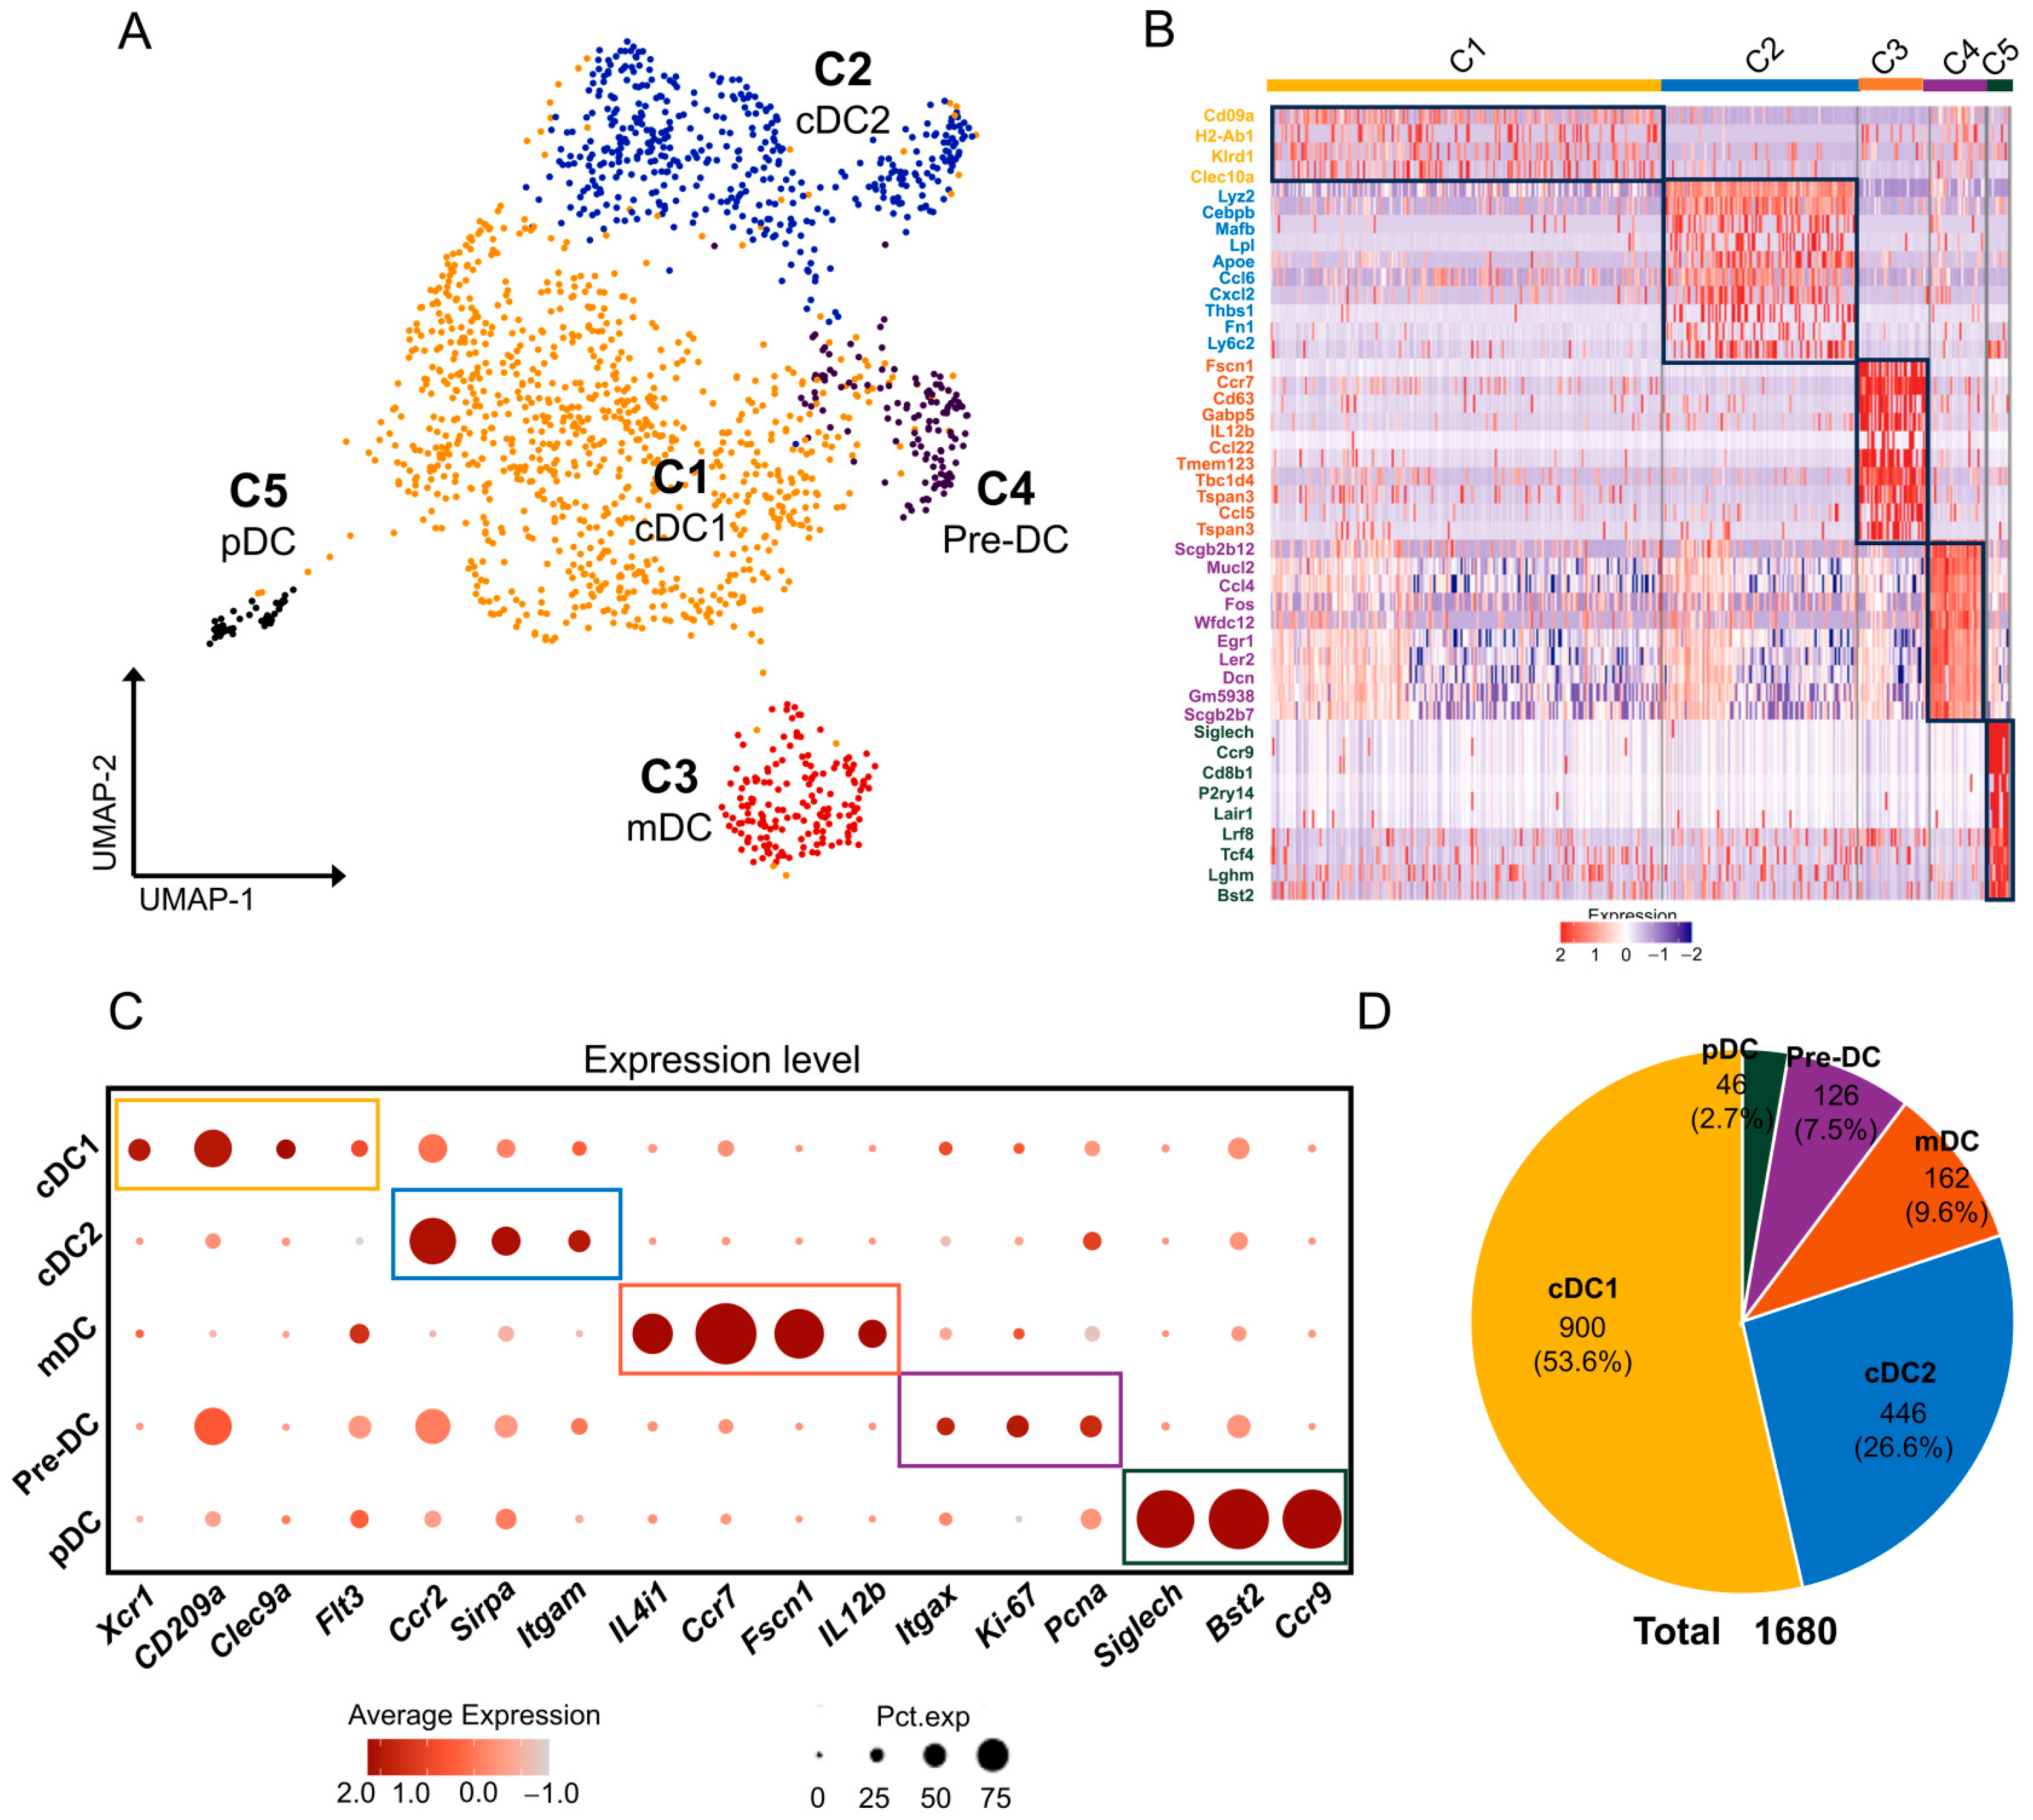
2.5. DCs/pDCs in Mouse ELGs

To gain a better understanding of the characteristics of DC/pDC subpopulations in mouse exocrine lacrimal glands (ELGs), we conducted a comprehensive analysis by examining 1680 DC/pDC cells from four samples using a second round of clustering analysis. Through UMAP downscaling analysis, we were able to identify five distinct clusters (Figure 5A,B). Cluster 1 was classified as conventional type 1 dendritic cells (cDC1) based on the expression of Xcr1 (encoding chemokine receptor 1), CD209a, Clec9a (encoding C-type lectin domain family 9 member A), and Flt3 (encoding Fms-related tyrosine kinase 3), which are well-established markers of cDC1 [74,75] (Figure 5C). KEGG analysis of the expressed genes in this cluster showed significant enrichment in antigen processing and presentation, apelin, and prolactin signaling pathways, while GO-BP analysis revealed a predominant involvement of cDC1 cells in biosynthetic and metabolic processes such as the cellular amide metabolic process, peptide metabolic process, and mRNA metabolic process (Figure S5).
Cluster 2 was identified as conventional type 2 dendritic cells (cDC2) due to the high expression levels of Sirpα, Ccr2, and Itgam [76] (Figure 5C). KEGG analysis of the expressed genes in this cluster showed significant enrichment in cell-engulfment-related signaling pathways such as lysosome, phagosome, and F gamma R-mediated phagocytosis, while GO-BP analysis revealed predominant enrichment in inflammatory and immune response processes such as the immune effector process, cell activation involved in the immune response, myeloid-leukocyte-mediated immunity, the innate immune response, and the inflammatory response (Figure S5).
Cluster 3 exhibited characteristics of migratory dendritic cells (mDCs), as it specifically overexpressed Ccr7, Il4i1, IL12b, and Fscn1 [75] (Figure 5C). KEGG analysis of the expressed genes in this cluster showed significant enrichment in C-type lectin receptor, chemokine, and NF-kappa B signaling pathways, while GO-BP analysis revealed predominant enrichment in immune effector processes and antigen processing as well as presentation biological processes such as the immune effector process, regulation of the immune response, antigen processing, and presentation of exogenous peptide antigen via MHCII (Figure S5).
In contrast, Cluster 4 was designated a pre-DC subpopulation due to the high expression of the proliferative genes Mki67 (encoding Ki-67), Pcna, and Itgax [77,78] (Figure 5C). KEGG analysis of the expressed genes in this cluster showed significant enrichment in antigen processing and presentation, MAPK, and TNF signaling pathways, while GO-BP analysis revealed a predominant involvement in biological processes such as the response to cytokine, regulation of the cellular response to stress, and the apoptotic process (Figure S5).
Finally, Cluster 5 exhibited characteristics of plasmacytoid dendritic cells (pDCs), as it specifically expressed the genes Siglech, Bst2, and Ccr9 [35,79,80,81] (Figure 5C). KEGG analysis of the expressed genes in this cluster showed significant enrichment in the Toll-like receptor signaling pathway, while GO-BP analysis revealed predominant enrichment in immune response processes such as the innate immune response, regulation of the immune response, and the defense response to viruses (Figure S5). Figure 5D demonstrates the total count and corresponding proportions of these five cell clusters among the DC population. Taken together, our results suggest the presence of a diverse subset of DCs within the mouse lacrimal gland. These distinct cell subpopulations may play roles in various immune regulatory processes and immunological biological events within the lacrimal gland.

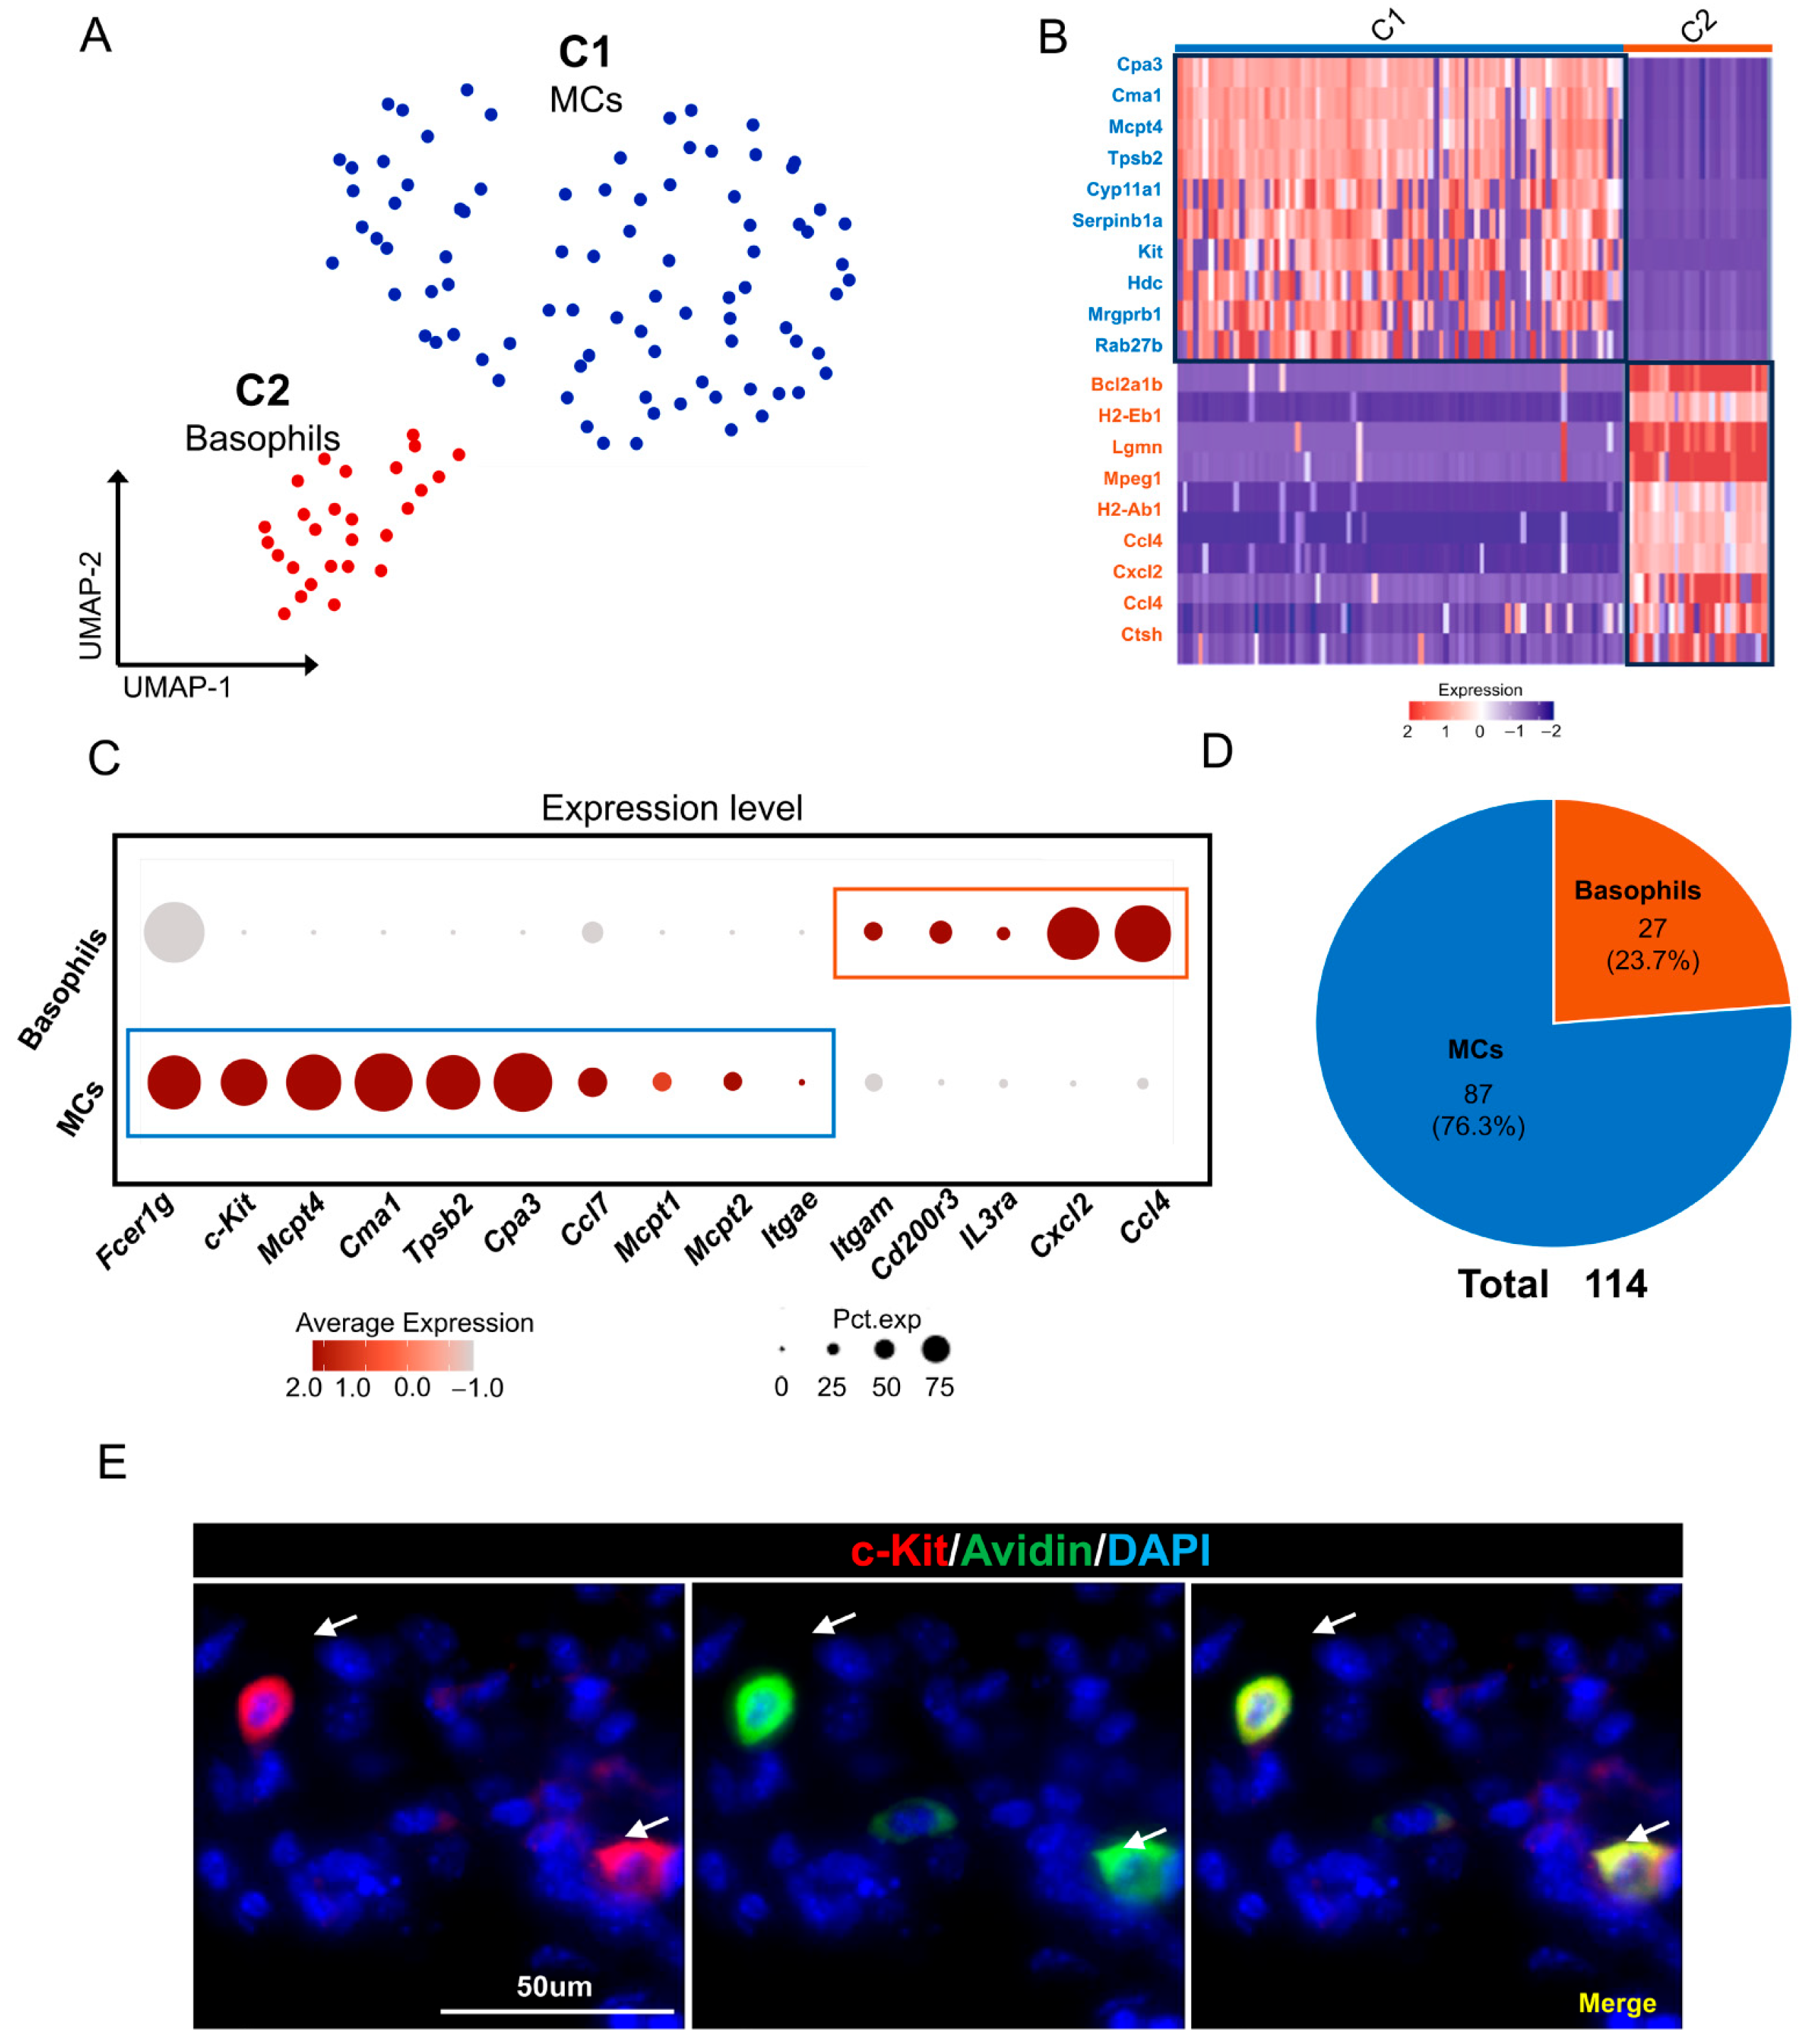
2.6. MC/Basophils in Mouse ELGs

We conducted a comprehensive analysis to elucidate the characteristics of the MC/basophil subpopulation in the mouse ELGs. A total of 114 MC/basophils were screened from four samples, and a second round of cluster analysis was performed. This analysis resulted in the generation of two distinct clusters through UMAP dimensionality reduction analysis (Figure 6A,B). Cluster 1 cells were found to express FcεRI and c-Kit (CD177), indicating their mast cell identity. These cells also exhibited high expression levels of classical mast cell proteases, such as Mcpt4, Mcpt5, Mcpt6, variant carboxypeptidase A3 (Cpa3), Mcpt1, Mcpt2, and Itgae (Figure 6C) [82]. Additionally, Cluster 1 cells displayed significant expression of the chemokine ligand Ccl7 [83,84] (Figure 6C). Thus, these cells were designated mast cells (MCs). The KEGG functional enrichment analysis of the MC-expressed genes revealed significant enrichment in signaling pathways related to dopaminergic synapses and serotonergic synapses, as well as hormone-related pathways such as parathyroid hormone synthesis, secretion, and action and the estrogen signaling pathway. Additionally, analysis of the gene ontology biological process indicated significant enrichment in biological processes associated with various stimulus responses, including response to endogenous stimulus, response to oxygen-containing compound, and response to hormone (Figure S6).
Cluster 2 cells shared several coexpressed genes with mast cells, but they exhibited stronger expression of Il3rα (CD123) and c-Kit (CD177) than mast cells [85]. Moreover, Cluster 2 cells displayed high expression levels of the chemokines Ccl4 and Cxcl2 [86,87] (Figure 6C). Therefore, Cluster 2 was identified as a basophil subpopulation. KEGG functional enrichment analysis of genes expressed in this cell population revealed significant enrichment in pathways associated with cell engulfment processes such as phagosome, lysosome, and apoptosis. Conversely, GO-BP analysis revealed enrichment in biological processes associated with the immune response, defense and response to bacterial stimuli, such as the defense response, immune effector process, cell activation involved in the immune response, and the cellular response to molecules of bacterial origin (Figure S6). To validate the presence of mast cells in the lacrimal gland tissue, we further performed immunofluorescence staining using an anti-c-Kit antibody in conjunction with avidin staining (Figure 6E). This analysis further confirmed the presence of c-Kit-positive mast cells throughout the lacrimal gland tissue. In conclusion, our findings indicate the existence of a distinct subpopulation of MCs/basophils in the mouse ELG.

2.7. B Cells/Plasma Cells in Mouse ELGs

To elucidate the characteristics of the B-cell/plasma cell subpopulation in the mouse ELG, we screened 233 B cells/plasma cells from four samples using a second round of clustering analysis. This analysis, which involved UMAP nonlinear dimensionality reductions, resulted in the identification of two distinct cell clusters (Figure 7A,B). Cluster 1, which expressed high levels of Jchain and Igha (encoding IgA), was labeled Igha+ plasma cells [88,89]. On the other hand, Cluster 2 cells exhibited high levels of Ms4a1, Cd79a, Cd79b, Ighm, and Ighd but low levels of Chchd10 [90,91,92,93]. These cells were therefore labeled Ighm+ naive B cells (Figure 7C). Figure 7D illustrates the total number and percentages of these two cell subsets within the B-cell/plasma cell population in the mouse ELGs. Further analysis using GO-BP revealed that genes expressed by Igha+ plasma cells were primarily associated with an inflammatory response, response to endogenous stimulus, response to oxygen-containing compound, blood vessel morphogenesis, and other processes (Figure S7). In contrast, IgM+ naive B cells were enriched for nuclear-transcribed mRNA catabolic processes, B-cell receptor signaling pathways, cotranslational protein targeting to membrane defense response to bacteria, and other biological processes (Figure S7). Collectively, our findings suggest the presence of a distinct B-cell/plasma subpopulation in mouse ELGs.

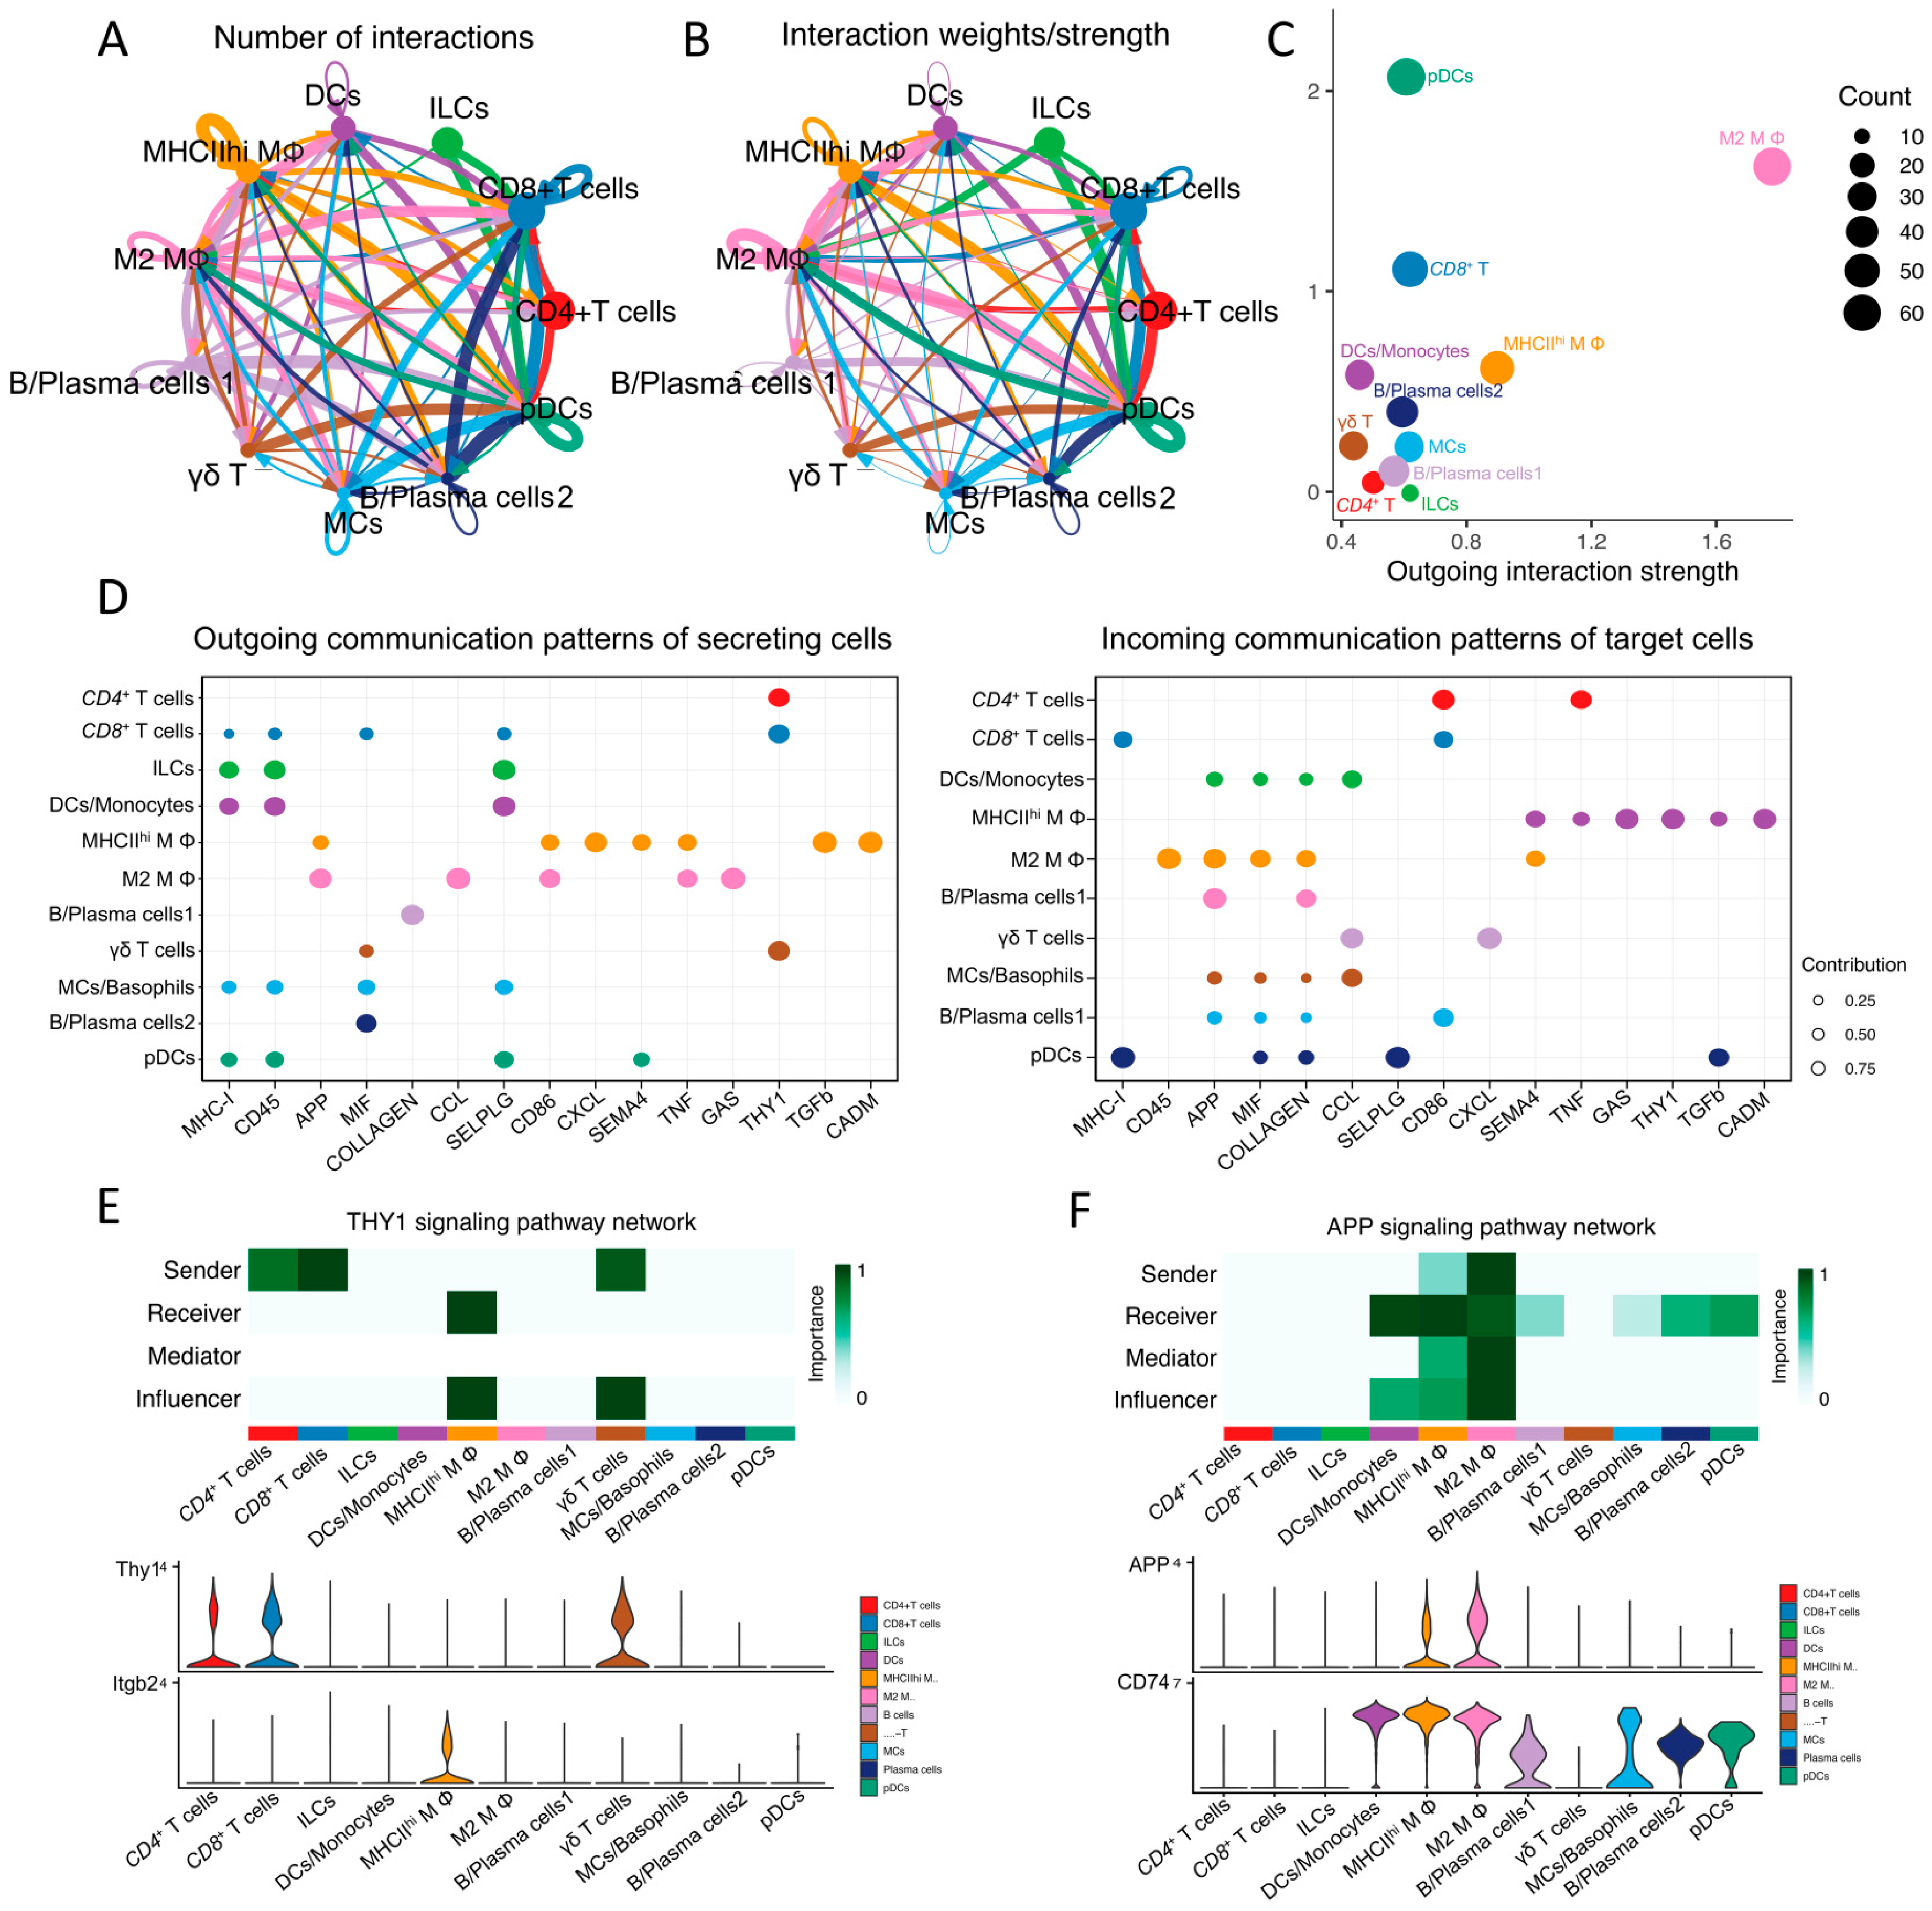
2.8. Analysis of Cell-Cell Communication between Immune Cell Populations in Mouse Lacrimal Glands

To elucidate the qualitative and quantitative aspects of potential interactions among immune cells in mouse lacrimal glands (ELGs), we initially uploaded the Seurat object to construct and quantify the global signaling cross-talk atlases using CellChat [94]. As depicted in Figure 8A,B, a complex and intricate network of intercellular interactions exists among immune cell subpopulations within mouse ELGs. Furthermore, we employed scatter plots to visualize the primary cell signaling senders and receivers within a 2D spatial context. The results revealed that the interactions between pDCs, M2 MΦs, and CD8+ T cells were the most prominent (Figure 8C).
To investigate the signaling pathways involved in intercellular communication among ELG immune cell populations, pattern recognition analysis was employed. This analysis aimed to study the most significant outgoing and incoming signaling pathways in these populations, as shown in Figure 8D. In particular, we focused on one major signaling pathway with high communication strength for T cells (CD4+ T cells, CD8+ T cells, and γδ T cells) and MΦ populations, as depicted in Figure 8E,F.
The heatmap of the inferred thymus cell antigen 1 (Thy1, CD90) signaling network revealed interesting findings. This result indicated that T cells were the most prominent sources of Thy1 signaling pathway ligands, while MΦs were the major signaling targets of the Thy1 signaling pathway. This information is visually represented in Figure 8E. Furthermore, the expression of Thy1 signaling genes was predominantly observed in T-cell subgroups, as shown in the violin plots (Figure 8E).
Moving on to another signaling pathway, the heatmap of the inferred amyloid precursor protein (APP) signaling network highlighted MΦs as the most prominent sources of this pathway. Interestingly, MΦs were also major targets of the APP signaling pathway. Additionally, the APP signaling targets included DCs, pDCs, and B cells/plasma cells, as depicted in Figure 8F.

3. Discussion

By employing single-cell RNA sequencing, we have effectively ascertained and characterized the distinct subsets of immune cells that exist in the lacrimal glands (ELGs) of mice under normal conditions. Our observations unveil a significant and heterogeneous assemblage of immune cells within the lacrimal gland (Figure 9). These findings not only provide unprecedented insights into the immune microenvironment of the lacrimal gland but also present potential avenues for comprehending the underlying mechanisms of lacrimal gland-related disorders and devising novel preventive and therapeutic strategies in the future.

3.1. T Cells in Mouse Lacrimal Glands

Consistent with previous findings [7,95], our research confirms a variety of T-cell subsets within the mouse lacrimal gland at a single-cell resolution. We discovered mitotic CD4+ T cells, which probably serve as precursors to diverse CD4+ lineages critical for local immune modulation. These precursor cells are poised to differentiate into distinct subsets—Th1, Th2, Th17, and Treg—each with a specialized role: Th1 cells drive cellular immunity, Th2 cells propel antibody production, Th17 cells mediate inflammatory processes, and Treg cells maintain immune balance by preventing overactive responses [96].
Our study discovered two distinct populations of CD8+ T cells in the lacrimal glands of mice: CD8+ cytotoxic T cells and CD8+ tissue-resident memory T cells. The significance of the former is evident in their ability to control viral infections and eliminate tumors [97]. On the other hand, the latter represents a specific subset of memory T cells that reside in nonlymphoid tissues and provide rapid and long-lasting protection against reinfection via rapid immune response, cytotoxicity, cytokine production, and tissue repair [98]. This division of CD8+ T-cell functionality highlights the complexity and sophistication of the immune landscape within the lacrimal gland, revealing potential pathways for antiviral and immunoregulatory mechanisms.
Our study also identified the presence of CD4+ and CD8+ Isg15+ T-cell clusters in the mouse lacrimal gland, in addition to the classical cell subsets. The classification of Isg15+ T-cell clusters as a specific subset is not universally recognized, however. Typically in the research, the observation of Isg15 expression in T cells aims to explore how T cells respond to IFN signaling in the context of inflammation and tumors [56,99]. Despite this, the physiological and pathological significance of this particular population appearing in the lacrimal gland remains unclear.
Unlike αβT cells that acquire peripheral effector functions, γδ T cells undergo primary development within the thymus, attaining maturity and differentiating into effector cells. Within the thymus, the recombination of different types of Vγ (Vγ2,3,4,5,8,9) and Vδ chains of TCRs in γδ T cells gives rise to subsets with distinct functionalities and characteristics [100]. Subsequently, upon thymic maturation, these subsets of γδ T cells exit the thymus and settle in various tissues and organs at different developmental stages [101]. Thus, γδ T cells can rapidly respond to pathogen infections, inflammation, and tissue damage [102]. To date, the γδ T cells we recognize mainly fall into two categories: Tγδ1 cells that produce IFN-γ and Tγδ17 cells that produce IL-17 [103]. These cells express the key transcription factors T-bet and RORγt [102]. In our study, we identified a predominant population of Tγδ17 cells in the lacrimal glands, chiefly belonging to the Vγ4 subset. This corresponds with the γδ T cells distributed in the lungs, dermis, and lymph nodes, which share the same origins and features [102,104]. Previous research has indicated that the Vγ4 subset exhibits immunoregulatory inhibitory effects [105]. However, the exact physiological roles of these cells in the lacrimal glands remain elusive.

3.2. ILCs in Mouse Lacrimal Glands

ILCs constitute a family of lymphocytes originating from common lymphoid progenitors in the bone marrow [106]. They are considered the innate counterpart of T cells, as they lack antigen-specific receptors such as T cells but can rapidly respond to pathogens and tissue damage. ILCs are widely distributed throughout various tissues and organs, including the cornea and conjunctiva [25,107]. ILCs comprise five different subsets: cytotoxic natural killer cells (NK cells), lymphoid tissue inducer cells, and three helper-like subsets, ILC1s, ILC2s, and ILC3s [108,109]. Notably, we identified NKs, ILC1s, and ILC2s in the mouse lacrimal gland. These lacrimal gland NK cells could be further subdivided into two distinct groups, NK1s and NK2s, exhibiting similarities to findings in both human and mouse spleens and blood [62]. Among these, NK1 cells displayed elevated expression levels of key genes, including chemokines (Ccl4 and Ccl5), the IFN regulatory factor Irf8, and NK activation receptors (Klrb1c, Klra8, and Klra4). Additionally, NK1s exhibited higher levels of Gzma and Gzmb, indicating increased cytotoxicity and a more active phenotype compared with NK2 cells. Interestingly, our data also unveiled a subset of NK2 cells characterized by high expression of Serpinb 9, an inhibitor of endogenous granzyme B. This particular protein plays a crucial role in safeguarding NK/T cells from granzyme B-induced cell death [110].
ILC1s, which are a specific type of innate lymphoid cell, play a vital role in protecting the host against intracellular pathogens [111]. When stimulated by specific cytokines, such as IL-12 and IL-18, ILC1s produce IFN-γ. These cells are primarily located at epithelial barrier sites and exhibit a rapid response to infection, often preceding the activation of cytotoxic NKs [112]. This suggests that ILC1s in the lacrimal gland contribute to the defense against intracellular pathogens, highlighting their significance in the initial stages of host defense.
In contrast, ILC2s are known for their ability to produce certain cytokines, including IL-4, IL-5, and IL-13, in response to various cytokines, namely, thymic stromal lymphopoietin, IL-25, and IL-33 [113]. These cytokines secreted by ILC2s play a critical role in promoting mucosal and barrier immunity, providing protection against parasites and acting as triggers for allergic reactions [114]. ILC2s also produce amphiregulin, a member of the epidermal growth factor family. Amphiregulin stimulates the proliferation and differentiation of epithelial cells, thereby facilitating tissue repair after injury [115]. It is therefore plausible that ILC2s present in the lacrimal gland may perform similar functions. However, further research is needed to clarify this hypothesis.

3.3. MΦs in Mouse Lacrimal Glands

MΦs play a critical role in various biological processes, including immune responses, inflammation, tissue repair, and immune regulation [116]. In this study, we identified four distinct subpopulations of MΦs within the lacrimal glands of mice. Among these subpopulations, the Trem2+MHCIIhi MΦ group stands out due to its high Trem2 expression. Research indicates that Trem2, expressed in microglia, plays a key role in clearing neuronal debris and exhibits anti-inflammatory properties [117,118]. Additionally, Trem2+ MΦs have been found to enhance NK cell activity and suppress tumor cell growth by modulating interleukin interactions and production in pathological conditions [66,119]. Notably, the loss of Trem2 function in MΦs leads to increased IFN-γ-induced immune activation, a proinflammatory shift, and enhanced tumor-cell-killing capacity [66].
Another notable group of MΦs is the Pf4+ M2 MΦ subset, which can be found in various normal organs and tissues [120,121,122]. This subset is classified as M2 MΦs due to its high expression of key M2 marker genes, such as Mrc1 (CD206), Retnlα (Fizz1), and Chil3 (Chi3l3, Ym1) [67,68]. M2 MΦs play a crucial role in maintaining homeostasis, tissue remodeling, and metabolic adaptation [123].
The Cx3cr1+MHCIIhi MΦ subpopulation, characterized by its high Cx3cr1 expression as a receptor for the chemokine fractalkine, plays a critical role in MΦ function at sites of inflammation and tissue damage [124,125]. Fractalkine, a chemokine expressed on endothelial cells, is involved in the recruitment and retention of Cx3cr1+ MΦs at inflammatory sites. These MΦs are known to have a proinflammatory phenotype and are involved in the clearance of apoptotic cells and debris [126,127]. Additionally, the Cx3cr1+ subset has been shown to promote tissue repair and regeneration through the production of growth factors and cytokines [71,128].
Furthermore, we identified a CD45+ MHCIIlow MΦ subset in the lacrimal gland. This subset is characterized by high expression of IL2rb (encoding CD122), S100 calcium binding protein A4 (S100a4), and Thy1. IL2rb, the receptor for interleukin-2 (IL2), is expressed in a high-affinity form on activated MΦs and is involved in regulating autoimmune responses and normal lymphocyte development [129,130]. Additionally, S100a4 influences the chemotaxis of MΦs under inflammatory conditions and their infiltration toward inflammatory sites [131]. Furthermore, Thy1 plays a crucial role not only in MΦ-driven inflammatory responses but also in other physiological processes [132].
Overall, the identification and characterization of these distinct subpopulations of MΦs provide valuable insights into their diverse functions and potential therapeutic targets for various pathological conditions. Despite these findings, the specific physiological roles of these MΦ populations in the lacrimal gland remain unclear.

3.4. DC/pDCs in Mouse Lacrimal Glands

DCs, a diverse group of immune cells, play a critical role in antigen presentation and immune response regulation. These cells are present in various tissues, including lacrimal glands [11,133]. In our studies of mouse lacrimal glands, we first discovered the presence of predendritic cells (pre-DCs), which are the precursors of DCs. These cells exist in the tissue and develop into mature dendritic cells, specifically cDC1 and cDC2, during the maturation process [134]. These cell populations are characterized by the expression of proliferation-related genes, particularly mki67. Additionally, we predictively identified two major subpopulations of cDCs, cDC1 and cDC2, based on their marker gene expression profiles. cDC1s excel in cross-presentation, a process in which they capture exogenous antigens and present them on MHC class I molecules to activate CD8+ T cells [135,136]. They are particularly effective in initiating cytotoxic T-cell responses against viral and tumor antigens. On the other hand, cDC2s participate in antigen presentation to CD4+ T cells, playing a pivotal role in promoting immune responses mediated by Th1, Th2, and Th17 cells under specific circumstances [137,138,139,140].
mDCs have the unique ability to migrate from peripheral tissues to draining lymph nodes, carry tissue autoantigens, and play distinct roles in immune responses, particularly in inflammatory conditions. In our observations of mDCs in mouse lacrimal glands, we noted high expression of Il4i1, Ccr7, and Fscn1 in these cell populations [25]. Il4i1, a signature gene of IL-4, is considered a marker of regulatory DCs and has the capacity to inhibit the appearance of IFN-γ-secreting T cells. Moreover, migratory DCs express CC-chemokine receptor 7 (CCR7), a crucial molecule involved in their migration to draining lymph nodes [141]. This suggests that migratory DCs in the lacrimal glands may have a regulatory role, as indicated by the expression of Il4i1 and Ccr7. Additionally, the presence of Fascin-1 (Fscn1), an actin-bundling protein, in migratory DCs suggests their potential involvement in antigen presentation and T-cell activation [142]. Therefore, based on the expression of these markers, it is likely that the migratory DCs in mouse lacrimal glands are regulatory in nature and contribute to immune regulation and tolerance.
In contrast, pDCs represent a rare and specialized subgroup of DCs primarily located in peripheral blood and lymphoid tissues [143]. These distinctive cells play a pivotal role in the immune response against viral infections by producing substantial quantities of type I IFNs [79]. Moreover, pDCs actively participate in interactions with other immune cells, aiding in the initiation of adaptive immune responses. They also contribute to immune regulation and tolerance mechanisms [144]. Interestingly, our data revealed the presence of a small pDC population in the lacrimal gland, characterized by the expression of classical markers such as Siglech and Ccr9. However, the physiological significance of these pDCs within the lacrimal gland remains unexplored. Therefore, further investigation is warranted to elucidate the functional role of pDCs within the lacrimal gland and their potential impact on ocular immunity.

3.5. Mast Cells and Eosinophils in Mouse Lacrimal Glands

MCs have their origins in hematopoietic progenitor cells situated within the bone marrow; they subsequently traverse the bloodstream to infiltrate various tissues, where they undergo differentiation and acquire distinctive granular MC phenotypes, a process heavily influenced by the local microenvironment. MCs are categorized among tissue-resident immune cells, primarily localized in proximity to blood vessels, nerves, secretory glands, connective tissues, and mucosal barriers. Notably, MCs have also been observed in tissues such as the lacrimal gland in both humans and mammals, where they play essential roles in the normal development and maintenance of these tissues [145,146] and contribute to age-related responses and disease processes [145,146,147]. In this study, a distinct population of MCs with prominent features was identified within the lacrimal glands of mice at single-cell resolution.
In contrast, basophils, while also originating from the bone marrow, undergo maturation within the confines of the bone marrow itself before their release into the peripheral circulation. Basophils express high-affinity IgE receptors (FcεRI) on their cell surfaces and exhibit rapid release of granule contents upon receptor cross-linking. While the presence of basophils within the lacrimal gland was established in the present study, their exact roles in maintaining lacrimal gland homeostasis and their involvement in certain disease processes require further rigorous investigation and elucidation.

3.6. B Cells/Plasma Cells in Mouse Lacrimal Glands

B cells and plasma cells residing within secretory glands, including the lacrimal glands, play pivotal roles in orchestrating local immune responses and antibody production [8]. This study delineates two distinct subsets within the lacrimal gland: IgM+ naive B cells and IgA+ plasma cells. IgM+ naive B cells constitute a distinct subset within the spectrum of B lymphocytes. These cells originate from B-cell precursors in the bone marrow and undergo a series of differentiation and maturation stages before their establishment. Upon encountering extraneous antigens, IgM+ naive B cells can be activated through the engagement of their B-cell receptors with these antigens. Once activated, they commence a process of proliferation and differentiation, eventually transforming into plasma cells responsible for antibody production. Moreover, B cells regulate the magnitude and direction of immune responses by secreting cytokines and antibodies into exocrine glands. In contrast, plasma cells act as effector cells within the lacrimal gland niche, secreting antibodies directly into the tear fluid. This secretion facilitates pathogen neutralization, antigen clearance, and the promotion of inflammatory responses, among other essential functions [148]. However, it must be emphasized that further research is needed to fully understand the differentiation processes of these two distinct B-cell subpopulations in the lacrimal gland and clarify their specific functional repertoires.

3.7. Cell–Cell Signaling among Immune Cells

CellChat provides a state-of-the-art method for inferring intercellular signaling networks from scRNA-seq data [94]. Similar to other ocular tissues [25,149], there is sophisticated crosstalk between immune cells in the context of ELGs. In particular, M2-MΦ, CD8+ T cells, and pDCs emerge as the key cell groups involved in both incoming and outgoing signals. Looking more closely, the Thy1 signaling network, particularly within lacrimal gland T cells, shows strong intercellular communication. Within this network, three specific T-cell subtypes—CD4+, CD8+ and γδ T cells—are the primary producers of Thy1 ligands, mainly targeting MΦs. This differentiation in the signaling pathway suggests that T cells and MΦs have different roles within the Thy1 network. Turning to the amyloid precursor protein (APP) signaling network, MΦs are identified as the main source of APP ligands. Interestingly, APP predominantly affects DCs, pDCs, MΦs, and B/plasma cells, with dendritic cells and MΦs orchestrating and modulating the APP signaling pathway. Notably, mouse lacrimal gland cells have high levels of APP expression and release it into the tear fluid, contributing significantly to ocular surface health [150]. Taken together, these findings shed light on the diverse functions of immune cell subtypes in the lacrimal gland.

3.8. Study Limitations

There are several limitations to this study that should be acknowledged. First, our observations were limited to immune cells in the one male C57BL/six mouse ELGs. Obtaining data from female mice could provide valuable insights into the gender dimorphism of lacrimal gland immune cells [151]. Additionally, due to the complexity of immune cell phenotypes, subpopulation analysis was not validated by histological immunofluorescence techniques for the majority of the immune cells. Further investigation using flow cytometry may contribute to a more comprehensive analysis of these subpopulations. Most gene expression and some immune cell recruitment to the lacrimal glands are influenced by light phase and age [7,152,153]. This study only focused on single diurnal time and age points. Finally, future research employing spatial transcriptomics could provide valuable information on the tissue localization of the aforementioned immune cell subpopulations.

3.9. Future Research Directions

Increasing evidence suggests that different populations of immune cells in the lacrimal gland play different roles in disease onset and progression. For example, increased numbers of Tregs have been observed in the lacrimal glands of ageing individuals [154,155]. In Sjögren’s syndrome (SS), an autoimmune disease that primarily affects the exocrine glands, including the lacrimal gland, T cells predominate early in the disease. Th1 and Th17 cells are the initiators of SS, whereas Th2 and Tfh cells become predominant as the disease progresses [156]. In addition, B cells dominate in the later stages. Furthermore, the infiltration of macrophages and monocytes in the lacrimal gland is strongly correlated with the severity of Sjögren’s syndrome [157,158]. In the mouse model of dry eye disease, cDCs in the lacrimal gland are approximately spherical and have increased migration [11]. In conclusion, the different immune cell populations in the lacrimal gland interact to coordinate the onset and development of the immune response. Based on the information obtained in this study, the lacrimal gland appears to have a specific immune microenvironment. In the future, drugs could be designed to specifically modulate the local immune response of the lacrimal gland by targeting specific receptors or signaling pathways of the immune cell populations in the lacrimal gland to treat specific ocular diseases (e.g., dry eye and ocular inflammatory diseases). In addition, a better understanding of the interactions between these immune cell populations is important to elucidate the pathogenesis of inflammatory diseases of the lacrimal gland.

4. Materials and Methods

4.1. Experimental Animals

Pathogen-free 12- to 14-week-old male C57/B6J mice were purchased from the Guangdong Medical Laboratory Animal Center (Foshan, Guangdong, China). All mice were housed in an environment with a standard 12 h light/dark cycle and appropriate temperature (23 ± 2 °C) and humidity. In addition, all animal experiments were approved by the Animal Ethics Review Committee of Jinan University (JN-A-20210303-32) and followed the guidelines provided by the Association for Research in Vision and Ophthalmology (ARVO) Statement on the Use of Animals in Ophthalmic and Vision Research.

4.2. Tissue Collection and Single-Cell Sample Preparation

To minimize the influence of circadian rhythm, all experimental mice were euthanized at the ZT4 time point using excess CO2 inhalation followed by cervical dislocation. Subsequently, we harvested bilateral ELGs, centrifuged them (4 °C, 500× g), and removed the supernatant, and they were then subjected to two washes with Eagle’s minimal essential medium. The ELG tissue was then swiftly sectioned into 2–3 mm fragments and subjected to incubation in a digestion solution consisting of 2 mg/mL collagenase I, 2 mg/mL collagenase IV, and 1 mg/mL DNAas I enzymes. These tissue sections were placed in C-tubes and processed in a tissue processor for 1–2 h at 37 °C.
The resultant cell suspension was collected using a 40 μm filter. To eliminate erythrocytes, we introduced erythrocyte lysis buffer (Cat# 8570396, QIAGEN, Shanghai, China) into the supernatant of the filtered cell suspension. This supernatant was then subjected to centrifugation at 220× g for 8 min at 4 °C, effectively removing the supernatant. We further employed the Dead Cell Removal Kit (Cat# 130-090-101, Miltenyi Biotec, Auburn, CA, USA) to eliminate dead cells and debris. Finally, the cells were thoroughly washed with phosphate-buffered saline (PBS), resuspended in an appropriate volume, and quantified using a hemocytometer.

4.3. Single-Cell RNA Sequencing

For the scRNA-seq experiments, we used a method that pooled two ELGs into a single sample from each male mouse, resulting in a total of four ELG samples from four young mice (n = 4). After dissociation of the lacrimal gland tissue, individual cells were appropriately diluted and suspended in calcium- and magnesium-free PBS supplemented with 0.04% w/v bovine serum albumin. Approximately 10,000 cells per sample were loaded into each channel, and the expected cell recovery rate was estimated to be 8000 cells. To generate single-cell gel beads-in-emulsions (GEMs), we introduced the single-cell suspension into the Chromium Single Cell Controller (10× Genomics, Pleasanton, CA, USA).
After GEM generation, reverse transcription reactions were performed using full-length cDNA coupled to barcodes. The emulsion was then disrupted with a recovery agent, and the cDNA was purified using DynaBeads Myone Silane beads (Thermo Fisher Scientific, Waltham, MA, USA). This cDNA underwent an amplification process consisting of 14 PCR cycles corresponding to the cDNA concentration. The amplified cDNA was then subjected to fragmentation, end repair, A-tailing, and ligation with indexed articulators for library amplification. These libraries were then sequenced on the Illumina HiSeq X Ten platform (Illumina, San Diego, CA, USA).
For each sample, we meticulously processed the Fastq files of scRNA-seq data derived from Chromium 10× libraries using Cell Ranger software (version 5.0.0, 10× Genomics, https://github.com/10XGenomics/cellranger, accessed on 11 November 2023). This involved a number of essential steps, including single-cell barcode identification, genome mapping, and quantification of unique molecular identifiers (UMIs) associated with transcripts. We then used the R package DoubletFinder (version 2.0.3) to detect and eliminate potential doublet cells within each sample to ensure the integrity of downstream analyses, and we used the Seurat package (version 4.3.0) for comprehensive analysis of the resulting filtered feature–barcode matrices.
To maintain data quality and accuracy, we implemented stringent quality control measures by excluding samples with nFeature RNA counts greater than 2500. This threshold was applied to mitigate the inclusion of samples containing an excessive number of genes, which may have resulted from doublets or multiple cells failing to form a single-cell suspension.
We further refined the data by normalizing using default parameters and the FindVariableFeatures function, which effectively filtered out highly variable genes (parameters set to selection.method = “vst” and nfeatures = 2500). These genes are used for downstream analyses such as downscaling and clustering. Dimensionality reduction analysis was then performed to select the most relevant dimensions; this involved performing principal component analysis using the RunPCA function to construct a linear dimensionality reduction of the dataset that contained most of the complexity of the dataset and evaluating the standard deviation using the ElbowPlot function. We then performed data clustering using the FindClusters function, systematically testing different resolution values from 0.4 to 1 to determine the optimal number of clusters (final resolution = 0.8). Finally, we applied nonlinear dimensionality reduction using the RunUMAP function for improved visualization.
The software resources and versions used for data analysis in this study are described above and summarized in Table S3, and all original R scripts are available at https://github.com/Qwei777/Singlecell.git, accessed on 5 January 2024.

4.4. Identification of Cell Types

The initial characterization of cell types within each cluster was conducted using the SingleR package as a preliminary reference. Subsequently, differential expression analysis was primarily executed using the Seurat FindMarkers function. This allowed us to visualize cluster-specific marker genes and generate a heatmap featuring the top 10 marker genes for each cluster. Cell types were ascertained based on the marker gene expression profiles associated with each cluster, supplemented by specific identity markers for each cell type, as elucidated in the previously published literature. Additionally, to delve deeper into the heterogeneity of immune cells, we carried out further dimensionality reduction, clustering, and classification for each subgroup of immune cells.

4.5. Analysis of Cell-Cell Interactions and Communication

Cell-to-cell communication analysis was performed using the R package CellChat 1.6.1 (http://www.cellchat.org/, accessed on 12 November 2022). Our investigation focused on deciphering cell-to-cell interactions between different immune cell types within adult mouse ELGs. An integral aspect of this analysis was to assess the importance of cell-to-cell communication by examining ligand-receptor interactions between different cell populations. To assign biological relevance to these cell-cell communications, we adopted a probabilistic approach by assigning probability values to each interaction. A permutation test was then used to validate the significance of these interactions. Notably, we set a gene expression threshold of 0.2 as the effective cutoff point for inclusion in our analysis. This rigorous methodology ensures robust and credible insights into the intricate network of cell-to-cell interactions within the system under study.

4.6. Functional Signaling Pathway Enrichment Analysis

Gene Ontology (GO) enrichment analysis of the dataset was performed using the R package ClusterProfiler (version 4.2.2). The main objective of this analysis was to identify pathways that showed significant enrichment for genes associated with different immune cell populations in the study. To ensure the reliability and robustness of our findings, we implemented a strict significance threshold for enrichment. Specifically, only pathways with an adjusted p value < 0.05 were considered statistically significant. By adopting this rigorous approach, we aimed to increase the confidence in our results. By focusing on pathways that showed substantial enrichment, we were able to prioritize those that were more likely to have a biologically relevant role in characterizing immune cell populations.

4.7. Immunohistological Staining of Mouse ELGs

For immunohistological staining of mouse ELGs, a series of meticulously performed steps were followed. First, mouse ELG tissues were sectioned and thoroughly washed with 0.01 M phosphate-buffered saline (PBS) at room temperature using a shaker. The sections were then fixed through immersion in a 5% bovine serum albumin (BSA) solution for 15 min. A mixture of BSA and 0.3% Triton X-100 was then added to the samples to promote permeabilization and allowed to interact for an additional 15 min at room temperature. To facilitate specific antibody binding, slides containing the sections were immersed in a primary antibody solution. This solution, appropriately diluted in BSA supplemented with 0.3% Triton X-100, was applied and incubated overnight at a controlled temperature of 4 °C. For reference, details of the primary antibodies, including concentrations and accession numbers, are documented in Table S1. After overnight incubation with primary antibodies, the samples were thoroughly washed with PBS. They were then subjected to secondary antibody treatment for 3 h at room temperature in a light-restricted environment. Alexa Fluor secondary antibodies (Cat No: A32727, Life Technologies in Carlsbad, CA, USA) were used at a dilution of 1:500 in a solution containing 0.3% Triton X-100 in BSA. As a final step, the nuclei of the samples were stained and blocked with a blocking agent supplemented with 4′,6-diamidino-2-phenylindole (DAPI) (Cat#: 28718-90-3; Sigma-Aldrich, St. Louis, MO, USA) at a ratio of 1:500. The DAPI used in this procedure was purchased from Sigma-Aldrich, St. Louis, MO, USA. This extensive procedure was carried out meticulously to ensure accurate and reliable immunohistological staining of mouse ELGs.

4.8. Statistical Analysis

Statistical analyses were performed using R software 4.1.3 (http://www.r-project.org, accessed on 10 March 2022). Seurat’s standard nonparametric Wilcoxon rank sum test was used, and p values were corrected using Bonferroni correction across all features in the dataset. Data are expressed as the mean and standard error of the mean (SEM). Only p values < 0.05 were considered statistically significant.

5. Conclusions

In conclusion, our study provides a comprehensive understanding of the immune system within the ELGs of normal mice. These data provide new insights regarding not only the structural and functional aspects of the lacrimal gland but also the pathogenesis of inflammatory diseases associated with the lacrimal gland; these include conditions such as dry eye syndrome, Sjogren’s syndrome, and various autoimmune diseases. In addition, our findings may contribute to the development of novel therapeutic strategies for these conditions.

Supplementary Materials

The following supporting information can be downloaded at: https://www.mdpi.com/article/10.3390/ijms25021208/s1.

Author Contributions

Conceptualization, Z.L.; Methodology, Z.L.; Software, Q.F; Validation, Q.F.; Data curation, Q.F., R.Y., Y.L., L.L., J.L. (Jiangman Liu), S.L., T.F., Y.X. and J.L.(Jun Liu); Writing—original draft, Q.F. and Z.L.; Writing—review & editing, Z.L.; Visualization, Q.F.; Supervision, Z.L.; Project administration, Z.L.; Funding acquisition, Z.L. All authors have read and agreed to the published version of the manuscript.

Funding

This research was funded by the National Natural Science Foundation of China (grant numbers 82171014, 82101089, and 81770962).

Institutional Review Board Statement

The animal study protocol was approved by the Animal Ethics Review Committee of Jinan University (JN-A-20210303-32 and date of approval 3 March 2021).

Informed Consent Statement

Not applicable.

Data Availability Statement

All raw sequencing data reported have been deposited at this accession URL: https://singlecell.broadinstitute.org/single_cell/study/SCP2459. All data were analyzed with standard programs and packages; original code has been deposited at https://github.com/Qwei777/Singlecell.git, accessed on 5 January 2024.

Conflicts of Interest

The authors declare that there are no conflicts of interest.

Abbreviations

APPamyloid precursor protein
BPbiological process
cDCconventional dendritic cell
CCLCC-chemokine ligand
CCRCC-chemokine receptor
CXCLchemokine (C-X-C motif) ligand
CXCRchemokine (C-X-C motif) receptor
DCsdendritic cells
ELGextraorbital lacrimal gland
GOgene ontology
IFNinterferon
IgAimmunoglobulin A
ILCsinnate lymphoid cells
Jak-STATthe Janus kinase/signal transducers and activators of transcription
MCsmast cells
mDCsmigratory dendritic cells
NKsnatural killers
pDCsplasmacytoid dendritic cells
Thy1thymus cell antigen 1
Tregsregulatory T cells
TRMtissue-resident memory
UMAPuniform manifold approximation and projection

References

  1. Stevenson, W.; Pugazhendhi, S.; Wang, M. Is the main lacrimal gland indispensable? Contributions of the corneal and conjunctival epithelia. Surv. Ophthalmol. 2016, 61, 616–627. [Google Scholar] [CrossRef] [PubMed]
  2. Pflugfelder, S.C.; Stern, M.E. Biological functions of tear film. Exp. Eye Res. 2020, 197, 108115. [Google Scholar] [CrossRef] [PubMed]
  3. McDermott, A.M. Antimicrobial compounds in tears. Exp. Eye Res. 2013, 117, 53–61. [Google Scholar] [CrossRef] [PubMed]
  4. Klenkler, B.; Sheardown, H.; Jones, L. Growth factors in the tear film: Role in tissue maintenance, wound healing, and ocular pathology. Ocul. Surf. 2007, 5, 228–239. [Google Scholar] [CrossRef] [PubMed]
  5. Bylsma, L.M.; Gracanin, A.; Vingerhoets, A. The neurobiology of human crying. Clin. Auton. Res. 2019, 29, 63–73. [Google Scholar] [CrossRef] [PubMed]
  6. Wieczorek, R.; Jakobiec, F.A.; Sacks, E.H.; Knowles, D.M. The immunoarchitecture of the normal human lacrimal gland. Relevancy for understanding pathologic conditions. Ophthalmology 1988, 95, 100–109. [Google Scholar] [CrossRef] [PubMed]
  7. Liu, J.; Si, H.; Huang, D.; Lu, D.; Zou, S.; Qi, D.; Pei, X.; Huang, S.; Li, Z. Mechanisms of Extraorbital Lacrimal Gland Aging in Mice: An Integrative Analysis of the Temporal Transcriptome. Investig. Ophthalmol. Vis. Sci. 2023, 64, 18. [Google Scholar] [CrossRef]
  8. Saitoh-Inagawa, W.; Hiroi, T.; Yanagita, M.; Iijima, H.; Uchio, E.; Ohno, S.; Aoki, K.; Kiyono, H. Unique characteristics of lacrimal glands as a part of mucosal immune network: High frequency of IgA-committed B-1 cells and NK1.1+ alphabeta T cells. Investig. Ophthalmol. Vis. Sci. 2000, 41, 138–144. [Google Scholar]
  9. Schechter, J.E.; Warren, D.W.; Mircheff, A.K. A lacrimal gland is a lacrimal gland, but rodent’s and rabbit’s are not human. Ocul. Surf. 2010, 8, 111–134. [Google Scholar] [CrossRef]
  10. Pappo, J.; Ebersole, J.L.; Taubman, M.A. Phenotype of mononuclear leucocytes resident in rat major salivary and lacrimal glands. Immunology 1988, 64, 295–300. [Google Scholar]
  11. Ortiz, G.; Chao, C.; Jamali, A.; Seyed-Razavi, Y.; Kenyon, B.; Harris, D.L.; Zoukhri, D.; Hamrah, P. Effect of Dry Eye Disease on the Kinetics of Lacrimal Gland Dendritic Cells as Visualized by Intravital Multi-Photon Microscopy. Front. Immunol. 2020, 11, 1713. [Google Scholar] [CrossRef]
  12. Jamali, A.; Kenyon, B.; Ortiz, G.; Abou-Slaybi, A.; Sendra, V.G.; Harris, D.L.; Hamrah, P. Plasmacytoid dendritic cells in the eye. Prog. Retin. Eye Res. 2021, 80, 100877. [Google Scholar] [CrossRef]
  13. Farmer, D.T.; Nathan, S.; Finley, J.K.; Shengyang Yu, K.; Emmerson, E.; Byrnes, L.E.; Sneddon, J.B.; McManus, M.T.; Tward, A.D.; Knox, S.M. Defining epithelial cell dynamics and lineage relationships in the developing lacrimal gland. Development 2017, 144, 2517–2528. [Google Scholar] [CrossRef]
  14. Bannier-Helaouet, M.; Post, Y.; Korving, J.; Trani Bustos, M.; Gehart, H.; Begthel, H.; Bar-Ephraim, Y.E.; van der Vaart, J.; Kalmann, R.; Imhoff, S.M.; et al. Exploring the human lacrimal gland using organoids and single-cell sequencing. Cell Stem Cell 2021, 28, 1221–1232. [Google Scholar] [CrossRef]
  15. Delcroix, V.; Mauduit, O.; Lee, H.S.; Ivanova, A.; Umazume, T.; Knox, S.M.; de Paiva, C.S.; Dartt, D.A.; Makarenkova, H.P. The First Transcriptomic Atlas of the Adult Lacrimal Gland Reveals Epithelial Complexity and Identifies Novel Progenitor Cells in Mice. Cells 2023, 12, 1435. [Google Scholar] [CrossRef] [PubMed]
  16. Basova, L.; Parfitt, G.J.; Richardson, A.; Delcroix, V.; Umazume, T.; Pelaez, D.; Tse, D.T.; Kalajzic, I.; Di Girolamo, N.; Jester, J.V.; et al. Origin and Lineage Plasticity of Endogenous Lacrimal Gland Epithelial Stem/Progenitor Cells. iScience 2020, 23, 101230. [Google Scholar] [CrossRef]
  17. Song, E.C.; Che, M.; Osinski, J.; Smalley, K.; Horeth, E.; Sinha, S.; Romano, R.A. DeltaNp63 maintains the fidelity of the myoepithelial cell lineage and directs cell differentiation programs in the murine salivary gland. Cell Death Differ. 2023, 30, 515–526. [Google Scholar] [CrossRef] [PubMed]
  18. Rosenberg, A.B.; Roco, C.M.; Muscat, R.A.; Kuchina, A.; Sample, P.; Yao, Z.; Graybuck, L.T.; Peeler, D.J.; Mukherjee, S.; Chen, W.; et al. Single-cell profiling of the developing mouse brain and spinal cord with split-pool barcoding. Science 2018, 360, 176–182. [Google Scholar] [CrossRef]
  19. Kan, H.; Zhang, K.; Mao, A.; Geng, L.; Gao, M.; Feng, L.; You, Q.; Ma, X. Single-cell transcriptome analysis reveals cellular heterogeneity in the ascending aortas of normal and high-fat diet-fed mice. Exp. Mol. Med. 2021, 53, 1379–1389. [Google Scholar] [CrossRef] [PubMed]
  20. He, L.; Vanlandewijck, M.; Mae, M.A.; Andrae, J.; Ando, K.; Del Gaudio, F.; Nahar, K.; Lebouvier, T.; Lavina, B.; Gouveia, L.; et al. Single-cell RNA sequencing of mouse brain and lung vascular and vessel-associated cell types. Sci. Data 2018, 5, 180160. [Google Scholar] [CrossRef]
  21. He, D.; Mao, A.; Zheng, C.B.; Kan, H.; Zhang, K.; Zhang, Z.; Feng, L.; Ma, X. Aortic heterogeneity across segments and under high fat/salt/glucose conditions at the single-cell level. Natl. Sci. Rev. 2020, 7, 881–896. [Google Scholar] [CrossRef]
  22. Rattner, A.; Heng, J.S.; Winer, B.L.; Goff, L.A.; Nathans, J. Normal and Sjogren’s syndrome models of the murine lacrimal gland studied at single-cell resolution. Proc. Natl. Acad. Sci. USA 2023, 120, e2311983120. [Google Scholar] [CrossRef]
  23. Saliba, A.E.; Li, L.; Westermann, A.J.; Appenzeller, S.; Stapels, D.A.; Schulte, L.N.; Helaine, S.; Vogel, J. Single-cell RNA-seq ties macrophage polarization to growth rate of intracellular Salmonella. Nat. Microbiol. 2016, 2, 16206. [Google Scholar] [CrossRef]
  24. Li, Z.; Yang, Q.; Tang, X.; Chen, Y.; Wang, S.; Qi, X.; Zhang, Y.; Liu, Z.; Luo, J.; Liu, H.; et al. Single-cell RNA-seq and chromatin accessibility profiling decipher the heterogeneity of mouse γδ T cells. Sci. Bull. 2022, 67, 408–426. [Google Scholar] [CrossRef]
  25. Alam, J.; Yazdanpanah, G.; Ratnapriya, R.; Borcherding, N.; de Paiva, C.S.; Li, D.; Pflugfelder, S.C. Single-cell transcriptional profiling of murine conjunctival immune cells reveals distinct populations expressing homeostatic and regulatory genes. Mucosal Immunol. 2022, 15, 620–628. [Google Scholar] [CrossRef]
  26. Lai, W.; Wang, X.; Liu, L.; Xu, L.; Mao, L.; Tan, J.; Zha, X.; Zhan, H.; Lei, W.; Lan, Y.; et al. Single-cell profiling of T cells uncovers a tissue-resident memory-like T-cell subset associated with bidirectional prognosis for B-cell acute lymphoblastic leukemia. Front. Immunol. 2022, 13, 957436. [Google Scholar] [CrossRef]
  27. Zhang, X.; Feng, J.; Chen, S.; Yang, H.; Dong, Z. Synergized regulation of NK cell education by NKG2A and specific Ly49 family members. Nat. Commun. 2019, 10, 5010. [Google Scholar] [CrossRef]
  28. Fehniger, T.A.; Cai, S.F.; Cao, X.; Bredemeyer, A.J.; Presti, R.M.; French, A.R.; Ley, T.J. Acquisition of murine NK cell cytotoxicity requires the translation of a pre-existing pool of granzyme B and perforin mRNAs. Immunity 2007, 26, 798–811. [Google Scholar] [CrossRef]
  29. Jelenčić, V.; Šestan, M.; Kavazović, I.; Lenartić, M.; Marinović, S.; Holmes, T.D.; Prchal-Murphy, M.; Lisnić, B.; Sexl, V.; Bryceson, Y.T.; et al. NK cell receptor NKG2D sets activation threshold for the NCR1 receptor early in NK cell development. Nat. Immunol. 2018, 19, 1083–1092. [Google Scholar] [CrossRef]
  30. Locati, M.; Curtale, G.; Mantovani, A. Diversity, Mechanisms, and Significance of Macrophage Plasticity. Annu. Rev. Pathol. 2020, 15, 123–147. [Google Scholar] [CrossRef]
  31. Mauduit, O.; Delcroix, V.; Umazume, T.; de Paiva, C.S.; Dartt, D.A.; Makarenkova, H.P. Spatial transcriptomics of the lacrimal gland features macrophage activity and epithelium metabolism as key alterations during chronic inflammation. Front. Immunol. 2022, 13, 1011125. [Google Scholar] [CrossRef] [PubMed]
  32. Wu, Y.; Yang, S.; Ma, J.; Chen, Z.; Song, G.; Rao, D.; Cheng, Y.; Huang, S.; Liu, Y.; Jiang, S.; et al. Spatiotemporal Immune Landscape of Colorectal Cancer Liver Metastasis at Single-Cell Level. Cancer Discov. 2022, 12, 134–153. [Google Scholar] [CrossRef] [PubMed]
  33. Flores, A.M.; Hosseini-Nassab, N.; Jarr, K.U.; Ye, J.; Zhu, X.; Wirka, R.; Koh, A.L.; Tsantilas, P.; Wang, Y.; Nanda, V.; et al. Pro-efferocytic nanoparticles are specifically taken up by lesional macrophages and prevent atherosclerosis. Nat. Nanotechnol. 2020, 15, 154–161. [Google Scholar] [CrossRef]
  34. Schaum, N.; Karkanias, J.; Neff, N.F.; May, A.P.; Quake, S.R.; Wyss-Coray, T.; Darmanis, S.; Batson, J.; Botvinnik, O.; Chen, M.B. Single-cell transcriptomics of 20 mouse organs creates a Tabula Muris. Nature 2018, 562, 367–372. [Google Scholar] [CrossRef]
  35. Zhang, J.; Raper, A.; Sugita, N.; Hingorani, R.; Salio, M.; Palmowski, M.J.; Cerundolo, V.; Crocker, P.R. Characterization of Siglec-H as a novel endocytic receptor expressed on murine plasmacytoid dendritic cell precursors. Blood 2006, 107, 3600–3608. [Google Scholar] [CrossRef]
  36. Lutz, K.; Musumeci, A.; Sie, C.; Dursun, E.; Winheim, E.; Bagnoli, J.; Ziegenhain, C.; Rausch, L.; Bergen, V.; Luecken, M.D.; et al. Ly6D(+)Siglec-H(+) precursors contribute to conventional dendritic cells via a Zbtb46(+)Ly6D(+) intermediary stage. Nat. Commun. 2022, 13, 3456. [Google Scholar] [CrossRef]
  37. Hadeiba, H.; Sato, T.; Habtezion, A.; Oderup, C.; Pan, J.; Butcher, E.C. CCR9 expression defines tolerogenic plasmacytoid dendritic cells able to suppress acute graft-versus-host disease. Nat. Immunol. 2008, 9, 1253–1260. [Google Scholar] [CrossRef]
  38. Davis, R.E.; Ngo, V.N.; Lenz, G.; Tolar, P.; Young, R.M.; Romesser, P.B.; Kohlhammer, H.; Lamy, L.; Zhao, H.; Yang, Y.; et al. Chronic active B-cell-receptor signalling in diffuse large B-cell lymphoma. Nature 2010, 463, 88–92. [Google Scholar] [CrossRef]
  39. Ma, X.; Deng, J.; Han, L.; Song, Y.; Miao, Y.; Du, X.; Dang, G.; Yang, D.; Zhong, B.; Jiang, C.; et al. Single-cell RNA sequencing reveals B cell-T cell interactions in vascular adventitia of hyperhomocysteinemia-accelerated atherosclerosis. Protein Cell 2022, 13, 540–547. [Google Scholar] [CrossRef]
  40. Sun, J.; Zhang, J.; Lindholt, J.S.; Sukhova, G.K.; Liu, J.; He, A.; Abrink, M.; Pejler, G.; Stevens, R.L.; Thompson, R.W.; et al. Critical role of mast cell chymase in mouse abdominal aortic aneurysm formation. Circulation 2009, 120, 973–982. [Google Scholar] [CrossRef]
  41. Duque-Wilckens, N.; Teis, R.; Sarno, E.; Stoelting, F.; Khalid, S.; Dairi, Z.; Douma, A.; Maradiaga, N.; Hench, S.; Dharshika, C.D.; et al. Early life adversity drives sex-specific anhedonia and meningeal immune gene expression through mast cell activation. Brain Behav. Immun. 2022, 103, 73–84. [Google Scholar] [CrossRef]
  42. Zheng, M.Z.M.; Wakim, L.M. Tissue resident memory T cells in the respiratory tract. Mucosal Immunol. 2022, 15, 379–388. [Google Scholar] [CrossRef]
  43. Tiberti, S.; Catozzi, C.; Croci, O.; Ballerini, M.; Cagnina, D.; Soriani, C.; Scirgolea, C.; Gong, Z.; He, J.; Macandog, A.D.; et al. GZMK(high) CD8(+) T effector memory cells are associated with CD15(high) neutrophil abundance in non-metastatic colorectal tumors and predict poor clinical outcome. Nat. Commun. 2022, 13, 6752. [Google Scholar] [CrossRef]
  44. Brunet, J.F.; Denizot, F.; Golstein, P. A differential molecular biology search for genes preferentially expressed in functional T lymphocytes: The CTLA genes. Immunol. Rev. 1988, 103, 21–36. [Google Scholar] [CrossRef] [PubMed]
  45. Ng, S.S.; De Labastida Rivera, F.; Yan, J.; Corvino, D.; Das, I.; Zhang, P.; Kuns, R.; Chauhan, S.B.; Hou, J.; Li, X.Y.; et al. The NK cell granule protein NKG7 regulates cytotoxic granule exocytosis and inflammation. Nat. Immunol. 2020, 21, 1205–1218. [Google Scholar] [CrossRef]
  46. Luo, Y.; Xu, C.; Wang, B.; Niu, Q.; Su, X.; Bai, Y.; Zhu, S.; Zhao, C.; Sun, Y.; Wang, J.; et al. Single-cell transcriptomic analysis reveals disparate effector differentiation pathways in human T(reg) compartment. Nat. Commun. 2021, 12, 3913. [Google Scholar] [CrossRef] [PubMed]
  47. Cencioni, M.T.; Santini, S.; Ruocco, G.; Borsellino, G.; De Bardi, M.; Grasso, M.G.; Ruggieri, S.; Gasperini, C.; Centonze, D.; Barila, D.; et al. FAS-ligand regulates differential activation-induced cell death of human T-helper 1 and 17 cells in healthy donors and multiple sclerosis patients. Cell Death Dis. 2015, 6, e1741. [Google Scholar] [CrossRef]
  48. Zhang, X.; Brunner, T.; Carter, L.; Dutton, R.W.; Rogers, P.; Bradley, L.; Sato, T.; Reed, J.C.; Green, D.; Swain, S.L. Unequal death in T helper cell (Th)1 and Th2 effectors: Th1, but not Th2, effectors undergo rapid Fas/FasL-mediated apoptosis. J. Exp. Med. 1997, 185, 1837–1849. [Google Scholar] [CrossRef]
  49. Dzialo-Hatton, R.; Milbrandt, J.; Hockett, R.D., Jr.; Weaver, C.T. Differential expression of Fas ligand in Th1 and Th2 cells is regulated by early growth response gene and NF-AT family members. J. Immunol. 2001, 166, 4534–4542. [Google Scholar] [CrossRef] [PubMed]
  50. Papotto, P.H.; Ribot, J.C.; Silva-Santos, B. IL-17(+) gammadelta T cells as kick-starters of inflammation. Nat. Immunol. 2017, 18, 604–611. [Google Scholar] [CrossRef]
  51. Castillo-Gonzalez, R.; Cibrian, D.; Sanchez-Madrid, F. Dissecting the complexity of gammadelta T-cell subsets in skin homeostasis, inflammation, and malignancy. J. Allergy Clin. Immunol. 2021, 147, 2030–2042. [Google Scholar] [CrossRef] [PubMed]
  52. Fang, D.; Cui, K.; Hu, G.; Gurram, R.K.; Zhong, C.; Oler, A.J.; Yagi, R.; Zhao, M.; Sharma, S.; Liu, P.; et al. Bcl11b, a novel GATA3-interacting protein, suppresses Th1 while limiting Th2 cell differentiation. J. Exp. Med. 2018, 215, 1449–1462. [Google Scholar] [CrossRef]
  53. Hosokawa, H.; Tanaka, T.; Endo, Y.; Kato, M.; Shinoda, K.; Suzuki, A.; Motohashi, S.; Matsumoto, M.; Nakayama, K.I.; Nakayama, T. Akt1-mediated Gata3 phosphorylation controls the repression of IFNgamma in memory-type Th2 cells. Nat. Commun. 2016, 7, 11289. [Google Scholar] [CrossRef] [PubMed]
  54. Maggi, L.; Mazzoni, A.; Capone, M.; Liotta, F.; Annunziato, F.; Cosmi, L. The dual function of ILC2: From host protection to pathogenic players in type 2 asthma. Mol. Asp. Med. 2021, 80, 100981. [Google Scholar] [CrossRef]
  55. Burchill, M.A.; Salomon, M.P.; Golden-Mason, L.; Wieland, A.; Maretti-Mira, A.C.; Gale, M., Jr.; Rosen, H.R. Single-cell transcriptomic analyses of T cells in chronic HCV-infected patients dominated by DAA-induced interferon signaling changes. PLoS Pathog. 2021, 17, e1009799. [Google Scholar] [CrossRef] [PubMed]
  56. Zheng, L.; Qin, S.; Si, W.; Wang, A.; Xing, B.; Gao, R.; Ren, X.; Wang, L.; Wu, X.; Zhang, J.; et al. Pan-cancer single-cell landscape of tumor-infiltrating T cells. Science 2021, 374, abe6474. [Google Scholar] [CrossRef]
  57. Fu, G.; Chen, T.; Wu, J.; Jiang, T.; Tang, D.; Bonaroti, J.; Conroy, J.; Scott, M.J.; Deng, M.; Billiar, T.R. Single-Cell Transcriptomics Reveals Compartment-Specific Differences in Immune Responses and Contributions for Complement Factor 3 in Hemorrhagic Shock Plus Tissue Trauma. Shock 2021, 56, 994–1008. [Google Scholar] [CrossRef] [PubMed]
  58. Saito, T.; Nishikawa, H.; Wada, H.; Nagano, Y.; Sugiyama, D.; Atarashi, K.; Maeda, Y.; Hamaguchi, M.; Ohkura, N.; Sato, E.; et al. Two FOXP3(+)CD4(+) T cell subpopulations distinctly control the prognosis of colorectal cancers. Nat. Med. 2016, 22, 679–684. [Google Scholar] [CrossRef]
  59. Ohkura, N.; Sakaguchi, S. Transcriptional and epigenetic basis of Treg cell development and function: Its genetic anomalies or variations in autoimmune diseases. Cell Res. 2020, 30, 465–474. [Google Scholar] [CrossRef]
  60. Feng, G.; Bajpai, G.; Ma, P.; Koenig, A.; Bredemeyer, A.; Lokshina, I.; Lai, L.; Förster, I.; Leuschner, F.; Kreisel, D.; et al. CCL17 Aggravates Myocardial Injury by Suppressing Recruitment of Regulatory T Cells. Circulation 2022, 145, 765–782. [Google Scholar] [CrossRef]
  61. Fu, Y.; Lin, Q.; Zhang, Z.; Zhang, L. Therapeutic strategies for the costimulatory molecule OX40 in T-cell-mediated immunity. Acta Pharm. Sinica. B 2020, 10, 414–433. [Google Scholar] [CrossRef] [PubMed]
  62. Crinier, A.; Milpied, P.; Escaliere, B.; Piperoglou, C.; Galluso, J.; Balsamo, A.; Spinelli, L.; Cervera-Marzal, I.; Ebbo, M.; Girard-Madoux, M.; et al. High-Dimensional Single-Cell Analysis Identifies Organ-Specific Signatures and Conserved NK Cell Subsets in Humans and Mice. Immunity 2018, 49, 971–986.e975. [Google Scholar] [CrossRef] [PubMed]
  63. McFarland, A.P.; Yalin, A.; Wang, S.Y.; Cortez, V.S.; Landsberger, T.; Sudan, R.; Peng, V.; Miller, H.L.; Ricci, B.; David, E.; et al. Multi-tissue single-cell analysis deconstructs the complex programs of mouse natural killer and type 1 innate lymphoid cells in tissues and circulation. Immunity 2021, 54, 1320–1337. [Google Scholar] [CrossRef] [PubMed]
  64. Zeis, P.; Lian, M.; Fan, X.; Herman, J.S.; Hernandez, D.C.; Gentek, R.; Elias, S.; Symowski, C.; Knöpper, K.; Peltokangas, N.; et al. In Situ Maturation and Tissue Adaptation of Type 2 Innate Lymphoid Cell Progenitors. Immunity 2020, 53, 775–792. [Google Scholar] [CrossRef] [PubMed]
  65. Cochain, C.; Vafadarnejad, E.; Arampatzi, P.; Pelisek, J.; Winkels, H.; Ley, K.; Wolf, D.; Saliba, A.E.; Zernecke, A. Single-Cell RNA-Seq Reveals the Transcriptional Landscape and Heterogeneity of Aortic Macrophages in Murine Atherosclerosis. Circ. Res. 2018, 122, 1661–1674. [Google Scholar] [CrossRef] [PubMed]
  66. Nakamura, K.; Smyth, M.J. TREM2 marks tumor-associated macrophages. Signal Transduct. Target. Ther. 2020, 5, 233. [Google Scholar] [CrossRef]
  67. Sica, A.; Mantovani, A. Macrophage plasticity and polarization: In vivo veritas. J. Clin. Investig. 2012, 122, 787–795. [Google Scholar] [CrossRef]
  68. Szanto, A.; Balint, B.L.; Nagy, Z.S.; Barta, E.; Dezso, B.; Pap, A.; Szeles, L.; Poliska, S.; Oros, M.; Evans, R.M.; et al. STAT6 transcription factor is a facilitator of the nuclear receptor PPARgamma-regulated gene expression in macrophages and dendritic cells. Immunity 2010, 33, 699–712. [Google Scholar] [CrossRef]
  69. Soldano, S.; Trombetta, A.C.; Contini, P.; Tomatis, V.; Ruaro, B.; Brizzolara, R.; Montagna, P.; Sulli, A.; Paolino, S.; Pizzorni, C.; et al. Increase in circulating cells coexpressing M1 and M2 macrophage surface markers in patients with systemic sclerosis. Ann. Rheum. Dis. 2018, 77, 1842–1845. [Google Scholar] [CrossRef]
  70. Mushenkova, N.V.; Nikiforov, N.G.; Melnichenko, A.A.; Kalmykov, V.; Shakhpazyan, N.K.; Orekhova, V.A.; Orekhov, A.N. Functional Phenotypes of Intraplaque Macrophages and Their Distinct Roles in Atherosclerosis Development and Atheroinflammation. Biomedicines 2022, 10, 452. [Google Scholar] [CrossRef]
  71. He, J.; Song, Y.; Li, G.; Xiao, P.; Liu, Y.; Xue, Y.; Cao, Q.; Tu, X.; Pan, T.; Jiang, Z.; et al. Fbxw7 increases CCL2/7 in CX3CR1hi macrophages to promote intestinal inflammation. J. Clin. Investig. 2019, 129, 3877–3893. [Google Scholar] [CrossRef] [PubMed]
  72. Shea-Donohue, T.; Zhao, A.; Antalis, T.M. SerpinB2 mediated regulation of macrophage function during enteric infection. Gut Microbes 2014, 5, 254–258. [Google Scholar] [CrossRef] [PubMed]
  73. Zlatanova, I.; Pinto, C.; Bonnin, P.; Mathieu, J.R.R.; Bakker, W.; Vilar, J.; Lemitre, M.; Voehringer, D.; Vaulont, S.; Peyssonnaux, C.; et al. Iron Regulator Hepcidin Impairs Macrophage-Dependent Cardiac Repair After Injury. Circulation 2019, 139, 1530–1547. [Google Scholar] [CrossRef] [PubMed]
  74. Guilliams, M.; Dutertre, C.A.; Scott, C.L.; McGovern, N.; Sichien, D.; Chakarov, S.; Van Gassen, S.; Chen, J.; Poidinger, M.; De Prijck, S.; et al. Unsupervised High-Dimensional Analysis Aligns Dendritic Cells across Tissues and Species. Immunity 2016, 45, 669–684. [Google Scholar] [CrossRef]
  75. Brown, C.C.; Gudjonson, H.; Pritykin, Y.; Deep, D.; Lavallee, V.P.; Mendoza, A.; Fromme, R.; Mazutis, L.; Ariyan, C.; Leslie, C.; et al. Transcriptional Basis of Mouse and Human Dendritic Cell Heterogeneity. Cell 2019, 179, 846–863. [Google Scholar] [CrossRef]
  76. Villani, A.C.; Satija, R.; Reynolds, G.; Sarkizova, S.; Shekhar, K.; Fletcher, J.; Griesbeck, M.; Butler, A.; Zheng, S.; Lazo, S.; et al. Single-cell RNA-seq reveals new types of human blood dendritic cells, monocytes, and progenitors. Science 2017, 356, eaah4573. [Google Scholar] [CrossRef]
  77. Cabeza-Cabrerizo, M.; van Blijswijk, J.; Wienert, S.; Heim, D.; Jenkins, R.P.; Chakravarty, P.; Rogers, N.; Frederico, B.; Acton, S.; Beerling, E.; et al. Tissue clonality of dendritic cell subsets and emergency DCpoiesis revealed by multicolor fate mapping of DC progenitors. Sci. Immunol. 2019, 4, eaaw1941. [Google Scholar] [CrossRef] [PubMed]
  78. Czepielewski, R.S.; Randolph, G.J. Resident dendritic cell density in the lymph node paracortex is preDC-estined. Immunity 2023, 56, 1699–1701. [Google Scholar] [CrossRef]
  79. Reizis, B. Plasmacytoid Dendritic Cells: Development, Regulation, and Function. Immunity 2019, 50, 37–50. [Google Scholar] [CrossRef]
  80. Schlitzer, A.; Loschko, J.; Mair, K.; Vogelmann, R.; Henkel, L.; Einwachter, H.; Schiemann, M.; Niess, J.H.; Reindl, W.; Krug, A. Identification of CCR9- murine plasmacytoid DC precursors with plasticity to differentiate into conventional DCs. Blood 2011, 117, 6562–6570. [Google Scholar] [CrossRef]
  81. Blasius, A.L.; Giurisato, E.; Cella, M.; Schreiber, R.D.; Shaw, A.S.; Colonna, M. Bone marrow stromal cell antigen 2 is a specific marker of type I IFN-producing cells in the naive mouse, but a promiscuous cell surface antigen following IFN stimulation. J. Immunol. 2006, 177, 3260–3265. [Google Scholar] [CrossRef] [PubMed]
  82. St John, A.L.; Rathore, A.P.S.; Ginhoux, F. New perspectives on the origins and heterogeneity of mast cells. Nat. Rev. Immunol. 2023, 23, 55–68. [Google Scholar] [CrossRef]
  83. Kuo, C.H.; Collins, A.M.; Boettner, D.R.; Yang, Y.; Ono, S.J. Role of CCL7 in Type I Hypersensitivity Reactions in Murine Experimental Allergic Conjunctivitis. J. Immunol. 2017, 198, 645–656. [Google Scholar] [CrossRef] [PubMed]
  84. Tai, W.-C.; Wang, S.-T.; Wu, C.-S.; Lin, T.-Y.; Wu, M.-T. Chemokine receptor CCR3 is important for migration of mast cells in neurofibroma. Dermatol. Sin. 2010, 28, 146–153. [Google Scholar] [CrossRef]
  85. Hennersdorf, F.; Florian, S.; Jakob, A.; Baumgärtner, K.; Sonneck, K.; Nordheim, A.; Biedermann, T.; Valent, P.; Bühring, H.J. Identification of CD13, CD107a, and CD164 as novel basophil-activation markers and dissection of two response patterns in time kinetics of IgE-dependent upregulation. Cell Res. 2005, 15, 325–335. [Google Scholar] [CrossRef] [PubMed]
  86. Cohen, M.; Giladi, A.; Gorki, A.D.; Solodkin, D.G.; Zada, M.; Hladik, A.; Miklosi, A.; Salame, T.M.; Halpern, K.B.; David, E.; et al. Lung Single-Cell Signaling Interaction Map Reveals Basophil Role in Macrophage Imprinting. Cell 2018, 175, 1031–1044.e1018. [Google Scholar] [CrossRef] [PubMed]
  87. Hu, S.; Di, G.; Cao, X.; Liu, Y.; Wang, Y.; Zhao, H.; Wang, D.; Chen, P. Lacrimal gland homeostasis is maintained by the AQP5 pathway by attenuating endoplasmic reticulum stress inflammation in the lacrimal gland of AQP5 knockout mice. Mol. Vis. 2021, 27, 679–690. [Google Scholar]
  88. Xu, A.Q.; Barbosa, R.R.; Calado, D.P. Genetic timestamping of plasma cells in vivo reveals tissue-specific homeostatic population turnover. eLife 2020, 9, e59850. [Google Scholar] [CrossRef]
  89. Isho, B.; Florescu, A.; Wang, A.A.; Gommerman, J.L. Fantastic IgA plasma cells and where to find them. Immunol. Rev. 2021, 303, 119–137. [Google Scholar] [CrossRef]
  90. Heidt, S.; Vergunst, M.; Anholts, J.D.H.; Swings, G.; Gielis, E.M.J.; Groeneweg, K.E.; Witkamp, M.J.; de Fijter, J.W.; Reinders, M.E.J.; Roelen, D.L.; et al. Presence of intragraft B cells during acute renal allograft rejection is accompanied by changes in peripheral blood B cell subsets. Clin. Exp. Immunol. 2019, 196, 403–414. [Google Scholar] [CrossRef]
  91. Weston-Bell, N.; Townsend, M.; Di Genova, G.; Forconi, F.; Sahota, S.S. Defining origins of malignant B cells: A new circulating normal human IgM(+)D(+) B-cell subset lacking CD27 expression and displaying somatically mutated IGHV genes as a relevant memory population. Leukemia 2009, 23, 2075–2080. [Google Scholar] [CrossRef] [PubMed]
  92. Enders, A.; Short, A.; Miosge, L.A.; Bergmann, H.; Sontani, Y.; Bertram, E.M.; Whittle, B.; Balakishnan, B.; Yoshida, K.; Sjollema, G.; et al. Zinc-finger protein ZFP318 is essential for expression of IgD, the alternatively spliced Igh product made by mature B lymphocytes. Proc. Natl. Acad. Sci. USA 2014, 111, 4513–4518. [Google Scholar] [CrossRef] [PubMed]
  93. Zhang, Z.; Ji, W.; Huang, J.; Zhang, Y.; Zhou, Y.; Zhang, J.; Dong, Y.; Yuan, T.; Yang, Q.; Ding, X.; et al. Characterization of the tumour microenvironment phenotypes in malignant tissues and pleural effusion from advanced osteoblastic osteosarcoma patients. Clin. Transl. Med. 2022, 12, e1072. [Google Scholar] [CrossRef] [PubMed]
  94. Jin, S.; Guerrero-Juarez, C.F.; Zhang, L.; Chang, I.; Ramos, R.; Kuan, C.H.; Myung, P.; Plikus, M.V.; Nie, Q. Inference and analysis of cell-cell communication using CellChat. Nat. Commun. 2021, 12, 1088. [Google Scholar] [CrossRef] [PubMed]
  95. Huang, S.; Si, H.; Liu, J.; Qi, D.; Pei, X.; Lu, D.; Zou, S.; Li, Z. Sleep Loss Causes Dysfunction in Murine Extraorbital Lacrimal Glands. Investig. Ophthalmol. Vis. Sci. 2022, 63, 19. [Google Scholar] [CrossRef]
  96. Lieberman, S.M.; Kreiger, P.A.; Koretzky, G.A. Reversible lacrimal gland-protective regulatory T-cell dysfunction underlies male-specific autoimmune dacryoadenitis in the non-obese diabetic mouse model of Sjogren syndrome. Immunology 2015, 145, 232–241. [Google Scholar] [CrossRef] [PubMed]
  97. Bantug, G.R.; Galluzzi, L.; Kroemer, G.; Hess, C. The spectrum of T cell metabolism in health and disease. Nat. Rev. Immunol. 2018, 18, 19–34. [Google Scholar] [CrossRef] [PubMed]
  98. Crowl, J.T.; Heeg, M.; Ferry, A.; Milner, J.J.; Omilusik, K.D.; Toma, C.; He, Z.; Chang, J.T.; Goldrath, A.W. Tissue-resident memory CD8(+) T cells possess unique transcriptional, epigenetic and functional adaptations to different tissue environments. Nat. Immunol. 2022, 23, 1121–1131. [Google Scholar] [CrossRef]
  99. Wu, X.; Liu, Y.; Jin, S.; Wang, M.; Jiao, Y.; Yang, B.; Lu, X.; Ji, X.; Fei, Y.; Yang, H.; et al. Single-cell sequencing of immune cells from anticitrullinated peptide antibody positive and negative rheumatoid arthritis. Nat. Commun. 2021, 12, 4977. [Google Scholar] [CrossRef]
  100. Carding, S.R.; Egan, P.J. Gammadelta T cells: Functional plasticity and heterogeneity. Nat. Rev. Immunol. 2002, 2, 336–345. [Google Scholar] [CrossRef]
  101. Fahl, S.P.; Coffey, F.; Wiest, D.L. Origins of gammadelta T cell effector subsets: A riddle wrapped in an enigma. J. Immunol. 2014, 193, 4289–4294. [Google Scholar] [CrossRef] [PubMed]
  102. Ribot, J.C.; Lopes, N.; Silva-Santos, B. gammadelta T cells in tissue physiology and surveillance. Nat. Rev. Immunol. 2021, 21, 221–232. [Google Scholar] [CrossRef]
  103. Ciofani, M.; Zuniga-Pflucker, J.C. Determining gammadelta versus alphass T cell development. Nat. Rev. Immunol. 2010, 10, 657–663. [Google Scholar] [CrossRef] [PubMed]
  104. Narayan, K.; Sylvia, K.E.; Malhotra, N.; Yin, C.C.; Martens, G.; Vallerskog, T.; Kornfeld, H.; Xiong, N.; Cohen, N.R.; Brenner, M.B.; et al. Intrathymic programming of effector fates in three molecularly distinct gammadelta T cell subtypes. Nat. Immunol. 2012, 13, 511–518. [Google Scholar] [CrossRef]
  105. Liang, D.; Zuo, A.; Shao, H.; Born, W.K.; O’Brien, R.L.; Kaplan, H.J.; Sun, D. IL-23 receptor expression on gammadelta T cells correlates with their enhancing or suppressive effects on autoreactive T cells in experimental autoimmune uveitis. J. Immunol. 2013, 191, 1118–1125. [Google Scholar] [CrossRef] [PubMed]
  106. Artis, D.; Spits, H. The biology of innate lymphoid cells. Nature 2015, 517, 293–301. [Google Scholar] [CrossRef]
  107. Liu, J.; Xiao, C.; Wang, H.; Xue, Y.; Dong, D.; Lin, C.; Song, F.; Fu, T.; Wang, Z.; Chen, J.; et al. Local Group 2 Innate Lymphoid Cells Promote Corneal Regeneration after Epithelial Abrasion. Am. J. Pathol. 2017, 187, 1313–1326. [Google Scholar] [CrossRef]
  108. Bal, S.M.; Golebski, K.; Spits, H. Plasticity of innate lymphoid cell subsets. Nat. Rev. Immunol. 2020, 20, 552–565. [Google Scholar] [CrossRef]
  109. Tsymala, I.; Kuchler, K. Innate lymphoid cells-Underexplored guardians of immunity. PLoS Pathog. 2023, 19, e1011678. [Google Scholar] [CrossRef]
  110. Bird, C.H.; Christensen, M.E.; Mangan, M.S.; Prakash, M.D.; Sedelies, K.A.; Smyth, M.J.; Harper, I.; Waterhouse, N.J.; Bird, P.I. The granzyme B-Serpinb9 axis controls the fate of lymphocytes after lysosomal stress. Cell Death Differ. 2014, 21, 876–887. [Google Scholar] [CrossRef]
  111. Friedrich, C.; Taggenbrock, R.; Doucet-Ladeveze, R.; Golda, G.; Moenius, R.; Arampatzi, P.; Kragten, N.A.M.; Kreymborg, K.; Gomez de Aguero, M.; Kastenmuller, W.; et al. Effector differentiation downstream of lineage commitment in ILC1s is driven by Hobit across tissues. Nat. Immunol. 2021, 22, 1256–1267. [Google Scholar] [CrossRef] [PubMed]
  112. Weizman, O.E.; Adams, N.M.; Schuster, I.S.; Krishna, C.; Pritykin, Y.; Lau, C.; Degli-Esposti, M.A.; Leslie, C.S.; Sun, J.C.; O’Sullivan, T.E. ILC1 Confer Early Host Protection at Initial Sites of Viral Infection. Cell 2017, 171, 795–808. [Google Scholar] [CrossRef]
  113. Vivier, E.; Artis, D.; Colonna, M.; Diefenbach, A.; Di Santo, J.P.; Eberl, G.; Koyasu, S.; Locksley, R.M.; McKenzie, A.N.J.; Mebius, R.E.; et al. Innate Lymphoid Cells: 10 Years On. Cell 2018, 174, 1054–1066. [Google Scholar] [CrossRef] [PubMed]
  114. Cao, Y.; Li, Y.; Wang, X.; Liu, S.; Zhang, Y.; Liu, G.; Ye, S.; Zheng, Y.; Zhao, J.; Zhu, X.; et al. Dopamine inhibits group 2 innate lymphoid cell-driven allergic lung inflammation by dampening mitochondrial activity. Immunity 2023, 56, 320–335. [Google Scholar] [CrossRef] [PubMed]
  115. Tsou, A.M.; Yano, H.; Parkhurst, C.N.; Mahlakoiv, T.; Chu, C.; Zhang, W.; He, Z.; Jarick, K.J.; Zhong, C.; Putzel, G.G.; et al. Neuropeptide regulation of non-redundant ILC2 responses at barrier surfaces. Nature 2022, 611, 787–793. [Google Scholar] [CrossRef]
  116. Murray, P.J.; Wynn, T.A. Protective and pathogenic functions of macrophage subsets. Nat. Rev. Immunol. 2011, 11, 723–737. [Google Scholar] [CrossRef] [PubMed]
  117. Takahashi, K.; Rochford, C.D.; Neumann, H. Clearance of apoptotic neurons without inflammation by microglial triggering receptor expressed on myeloid cells-2. J. Exp. Med. 2005, 201, 647–657. [Google Scholar] [CrossRef] [PubMed]
  118. Binnewies, M.; Pollack, J.L.; Rudolph, J.; Dash, S.; Abushawish, M.; Lee, T.; Jahchan, N.S.; Canaday, P.; Lu, E.; Norng, M.; et al. Targeting TREM2 on tumor-associated macrophages enhances immunotherapy. Cell Rep. 2021, 37, 109844. [Google Scholar] [CrossRef]
  119. Park, M.D.; Reyes-Torres, I.; LeBerichel, J.; Hamon, P.; LaMarche, N.M.; Hegde, S.; Belabed, M.; Troncoso, L.; Grout, J.A.; Magen, A.; et al. TREM2 macrophages drive NK cell paucity and dysfunction in lung cancer. Nat. Immunol. 2023, 24, 792–801. [Google Scholar] [CrossRef]
  120. Park, I.; Goddard, M.E.; Cole, J.E.; Zanin, N.; Lyytikainen, L.P.; Lehtimaki, T.; Andreakos, E.; Feldmann, M.; Udalova, I.; Drozdov, I.; et al. C-type lectin receptor CLEC4A2 promotes tissue adaptation of macrophages and protects against atherosclerosis. Nat. Commun. 2022, 13, 215. [Google Scholar] [CrossRef]
  121. Yeo, L.; Adlard, N.; Biehl, M.; Juarez, M.; Smallie, T.; Snow, M.; Buckley, C.D.; Raza, K.; Filer, A.; Scheel-Toellner, D. Expression of chemokines CXCL4 and CXCL7 by synovial macrophages defines an early stage of rheumatoid arthritis. Ann. Rheum. Dis. 2016, 75, 763–771. [Google Scholar] [CrossRef] [PubMed]
  122. Pitsilos, S.; Hunt, J.; Mohler, E.R.; Prabhakar, A.M.; Poncz, M.; Dawicki, J.; Khalapyan, T.Z.; Wolfe, M.L.; Fairman, R.; Mitchell, M.; et al. Platelet factor 4 localization in carotid atherosclerotic plaques: Correlation with clinical parameters. Thromb. Haemost. 2003, 90, 1112–1120. [Google Scholar] [CrossRef] [PubMed]
  123. Pollard, J.W. Trophic macrophages in development and disease. Nat. Rev. Immunol. 2009, 9, 259–270. [Google Scholar] [CrossRef]
  124. Li, L.; Huang, L.; Sung, S.S.; Vergis, A.L.; Rosin, D.L.; Rose, C.E., Jr.; Lobo, P.I.; Okusa, M.D. The chemokine receptors CCR2 and CX3CR1 mediate monocyte/macrophage trafficking in kidney ischemia-reperfusion injury. Kidney Int. 2008, 74, 1526–1537. [Google Scholar] [CrossRef]
  125. Ishida, Y.; Gao, J.L.; Murphy, P.M. Chemokine receptor CX3CR1 mediates skin wound healing by promoting macrophage and fibroblast accumulation and function. J. Immunol. 2008, 180, 569–579. [Google Scholar] [CrossRef] [PubMed]
  126. Zheng, J.; Yang, M.; Shao, J.; Miao, Y.; Han, J.; Du, J. Chemokine receptor CX3CR1 contributes to macrophage survival in tumor metastasis. Mol. Cancer 2013, 12, 141. [Google Scholar] [CrossRef] [PubMed]
  127. Lee, M.; Lee, Y.; Song, J.; Lee, J.; Chang, S.Y. Tissue-specific Role of CX(3)CR1 Expressing Immune Cells and Their Relationships with Human Disease. Immune Netw. 2018, 18, e5. [Google Scholar] [CrossRef] [PubMed]
  128. Zaid, A.; Tharmarajah, K.; Mostafavi, H.; Freitas, J.R.; Sheng, K.C.; Foo, S.S.; Chen, W.; Vider, J.; Liu, X.; West, N.P.; et al. Modulation of Monocyte-Driven Myositis in Alphavirus Infection Reveals a Role for CX(3)CR1(+) Macrophages in Tissue Repair. mBio 2020, 11, 10-1128. [Google Scholar] [CrossRef]
  129. Zhang, Z.; Gothe, F.; Pennamen, P.; James, J.R.; McDonald, D.; Mata, C.P.; Modis, Y.; Alazami, A.M.; Acres, M.; Haller, W.; et al. Human interleukin-2 receptor beta mutations associated with defects in immunity and peripheral tolerance. J. Exp. Med. 2019, 216, 1311–1327. [Google Scholar] [CrossRef]
  130. Chinen, T.; Kannan, A.K.; Levine, A.G.; Fan, X.; Klein, U.; Zheng, Y.; Gasteiger, G.; Feng, Y.; Fontenot, J.D.; Rudensky, A.Y. An essential role for the IL-2 receptor in T(reg) cell function. Nat. Immunol. 2016, 17, 1322–1333. [Google Scholar] [CrossRef]
  131. Abdelfattah, N.; Kumar, P.; Wang, C.; Leu, J.S.; Flynn, W.F.; Gao, R.; Baskin, D.S.; Pichumani, K.; Ijare, O.B.; Wood, S.L.; et al. Single-cell analysis of human glioma and immune cells identifies S100A4 as an immunotherapy target. Nat. Commun. 2022, 13, 767. [Google Scholar] [CrossRef] [PubMed]
  132. Marangoni, R.G.; Datta, P.; Paine, A.; Duemmel, S.; Nuzzo, M.; Sherwood, L.; Varga, J.; Ritchlin, C.; Korman, B.D. Thy-1 plays a pathogenic role and is a potential biomarker for skin fibrosis in scleroderma. JCI Insight 2022, 7, e149426. [Google Scholar] [CrossRef] [PubMed]
  133. Jung, Y.H.; Ryu, J.S.; Yoon, C.H.; Kim, M.K. Age-Dependent Distinct Distributions of Dendritic Cells in Autoimmune Dry Eye Murine Model. Cells 2021, 10, 1857. [Google Scholar] [CrossRef] [PubMed]
  134. See, P.; Dutertre, C.A.; Chen, J.; Gunther, P.; McGovern, N.; Irac, S.E.; Gunawan, M.; Beyer, M.; Handler, K.; Duan, K.; et al. Mapping the human DC lineage through the integration of high-dimensional techniques. Science 2017, 356, eaag3009. [Google Scholar] [CrossRef] [PubMed]
  135. Haniffa, M.; Shin, A.; Bigley, V.; McGovern, N.; Teo, P.; See, P.; Wasan, P.S.; Wang, X.N.; Malinarich, F.; Malleret, B.; et al. Human tissues contain CD141hi cross-presenting dendritic cells with functional homology to mouse CD103+ nonlymphoid dendritic cells. Immunity 2012, 37, 60–73. [Google Scholar] [CrossRef] [PubMed]
  136. Bachem, A.; Guttler, S.; Hartung, E.; Ebstein, F.; Schaefer, M.; Tannert, A.; Salama, A.; Movassaghi, K.; Opitz, C.; Mages, H.W.; et al. Superior antigen cross-presentation and XCR1 expression define human CD11c+CD141+ cells as homologues of mouse CD8+ dendritic cells. J. Exp. Med. 2010, 207, 1273–1281. [Google Scholar] [CrossRef]
  137. Dudziak, D.; Kamphorst, A.O.; Heidkamp, G.F.; Buchholz, V.R.; Trumpfheller, C.; Yamazaki, S.; Cheong, C.; Liu, K.; Lee, H.W.; Park, C.G.; et al. Differential antigen processing by dendritic cell subsets in vivo. Science 2007, 315, 107–111. [Google Scholar] [CrossRef]
  138. Soares, H.; Waechter, H.; Glaichenhaus, N.; Mougneau, E.; Yagita, H.; Mizenina, O.; Dudziak, D.; Nussenzweig, M.C.; Steinman, R.M. A subset of dendritic cells induces CD4+ T cells to produce IFN-gamma by an IL-12-independent but CD70-dependent mechanism in vivo. J. Exp. Med. 2007, 204, 1095–1106. [Google Scholar] [CrossRef]
  139. Tussiwand, R.; Everts, B.; Grajales-Reyes, G.E.; Kretzer, N.M.; Iwata, A.; Bagaitkar, J.; Wu, X.; Wong, R.; Anderson, D.A.; Murphy, T.L.; et al. Klf4 expression in conventional dendritic cells is required for T helper 2 cell responses. Immunity 2015, 42, 916–928. [Google Scholar] [CrossRef]
  140. Schlitzer, A.; McGovern, N.; Teo, P.; Zelante, T.; Atarashi, K.; Low, D.; Ho, A.W.; See, P.; Shin, A.; Wasan, P.S.; et al. IRF4 transcription factor-dependent CD11b+ dendritic cells in human and mouse control mucosal IL-17 cytokine responses. Immunity 2013, 38, 970–983. [Google Scholar] [CrossRef]
  141. Zhang, Y.; Xu, Y.; Liu, S.; Guo, X.; Cen, D.; Xu, J.; Li, H.; Li, K.; Zeng, C.; Lu, L.; et al. Scaffolding protein Gab1 regulates myeloid dendritic cell migration in allergic asthma. Cell Res. 2016, 26, 1226–1241. [Google Scholar] [CrossRef] [PubMed]
  142. Randolph, G.J.; Ochando, J.; Partida-Sanchez, S. Migration of dendritic cell subsets and their precursors. Annu. Rev. Immunol. 2008, 26, 293–316. [Google Scholar] [CrossRef] [PubMed]
  143. Swiecki, M.; Colonna, M. The multifaceted biology of plasmacytoid dendritic cells. Nat. Rev. Immunol. 2015, 15, 471–485. [Google Scholar] [CrossRef] [PubMed]
  144. Martin-Gayo, E.; Sierra-Filardi, E.; Corbi, A.L.; Toribio, M.L. Plasmacytoid dendritic cells resident in human thymus drive natural Treg cell development. Blood 2010, 115, 5366–5375. [Google Scholar] [CrossRef]
  145. Lilla, J.N.; Werb, Z. Mast cells contribute to the stromal microenvironment in mammary gland branching morphogenesis. Dev. Biol. 2010, 337, 124–133. [Google Scholar] [CrossRef]
  146. Lilla, J.N.; Joshi, R.V.; Craik, C.S.; Werb, Z. Active plasma kallikrein localizes to mast cells and regulates epithelial cell apoptosis, adipocyte differentiation, and stromal remodeling during mammary gland involution. J. Biol. Chem. 2009, 284, 13792–13803. [Google Scholar] [CrossRef]
  147. Williams, R.M.; Singh, J.; Sharkey, K.A. Innervation and mast cells of the rat exorbital lacrimal gland: The effects of age. J. Auton. Nerv. Syst. 1994, 47, 95–108. [Google Scholar] [CrossRef]
  148. Franklin, R.M. The ocular secretory immune system: A review. Curr. Eye Res. 1989, 8, 599–606. [Google Scholar] [CrossRef]
  149. Wu, Y.F.; Chang, N.W.; Chu, L.A.; Liu, H.Y.; Zhou, Y.X.; Pai, Y.L.; Yu, Y.S.; Kuan, C.H.; Wu, Y.C.; Lin, S.J.; et al. Single-Cell Transcriptomics Reveals Cellular Heterogeneity and Complex Cell-Cell Communication Networks in the Mouse Cornea. Investig. Ophthalmol. Vis. Sci. 2023, 64, 5. [Google Scholar] [CrossRef]
  150. Van Setten, G.B.; Nilsson, L.; Hahne, S.; Johnston, J.A.; Kvanta, A.; Gandy, S.E.; Naslund, J.; Nordstedt, C. Beta-amyloid protein protein precursor expression in lacrimal glands and tear fluid. Investig. Ophthalmol. Vis. Sci. 1996, 37, 2585–2593. [Google Scholar]
  151. Semanjski, K.; Majdic, G.; Kozina, V.; Jezek, D. Sexual dimorphism of the extraorbital lacrimal glands in SF-1 knockout mice. Acta Histochem. 2021, 123, 151669. [Google Scholar] [CrossRef] [PubMed]
  152. Huang, S.; Jiao, X.; Lu, D.; Pei, X.; Qi, D.; Li, Z. Light cycle phase advance as a model for jet lag reprograms the circadian rhythms of murine extraorbital lacrimal glands. Ocul. Surf. 2021, 20, 95–114. [Google Scholar] [CrossRef] [PubMed]
  153. El-Fadaly, A.B.; El-Shaarawy, E.A.; Rizk, A.A.; Nasralla, M.M.; Shuaib, D.M. Age-related alterations in the lacrimal gland of adult albino rat: A light and electron microscopic study. Ann. Anat. 2014, 196, 336–351. [Google Scholar] [CrossRef] [PubMed]
  154. Coursey, T.G.; Bian, F.; Zaheer, M.; Pflugfelder, S.C.; Volpe, E.A.; de Paiva, C.S. Age-related spontaneous lacrimal keratoconjunctivitis is accompanied by dysfunctional T regulatory cells. Mucosal Immunol. 2017, 10, 743–756. [Google Scholar] [CrossRef]
  155. Trujillo-Vargas, C.M.; Mauk, K.E.; Hernandez, H.; de Souza, R.G.; Yu, Z.; Galletti, J.G.; Dietrich, J.; Paulsen, F.; de Paiva, C.S. Immune phenotype of the CD4(+) T cells in the aged lymphoid organs and lacrimal glands. Geroscience 2022, 44, 2105–2128. [Google Scholar] [CrossRef]
  156. Psianou, K.; Panagoulias, I.; Papanastasiou, A.D.; de Lastic, A.L.; Rodi, M.; Spantidea, P.I.; Degn, S.E.; Georgiou, P.; Mouzaki, A. Clinical and immunological parameters of Sjogren’s syndrome. Autoimmun. Rev. 2018, 17, 1053–1064. [Google Scholar] [CrossRef]
  157. Zhou, D.; McNamara, N.A. Macrophages: Important players in primary Sjogren’s syndrome? Expert. Rev. Clin. Immunol. 2014, 10, 513–520. [Google Scholar] [CrossRef]
  158. Sequi-Sabater, J.M.; Beretta, L. Defining the Role of Monocytes in Sjogren’s Syndrome. Int. J. Mol. Sci. 2022, 23, 12765. [Google Scholar] [CrossRef]
Figure 1. scRNA-seq of immune cells in mouse ELGs. (A,B) UMAP plot of scRNA-seq data of nonimmune cells clustered independently (A) and immune cells clustered independently from four biological replicates (B). Colors represent cell types. (C) Dot plot showing the expression of selected cell-type-specific marker genes. The dot size denotes the percentage of cells expressing the marker gene in the respective cell population, and the dot color denotes the natural logarithm of normalized RNA expression. Different colored boxes represent different cell clusters. (D) Pie chart showing the number of cells in each subpopulation and their respective percentages.
Ijms 25 01208 g001
Figure 2. T-cell subsets in mouse lacrimal glands. (A) UMAP visualization of T-cell subsets in mouse ELGs. (B) Heatmap of Z scores for scaled expression values of DEGs for each cluster. Colors are based on the natural logarithm of normalized RNA expression. The black boxes indicate the DEGs within each cluster. (C) Dot plot showing marker genes in each cluster of cells. The dot size denotes the percentage of cells expressing the marker gene in the respective cell population, and the dot color denotes the natural logarithm of normalized RNA expression. Different colored boxes represent different cell clusters. (D) Pie chart showing the number of cells in each subpopulation of T cells and their respective percentage of the total T-cell population. (E) Histological immunofluorescence staining of the lacrimal gland showing anti-CD8 labeled cells, white arrows point to positively stained cells, scale bar = 50 µm. (F) Histological immunofluorescence staining of the lacrimal gland showing anti-CD4-labeled cells, white arrows point to positively stained cells, scale bar = 50 µm. (G) Histological immunofluorescence staining of the lacrimal gland showing cells costained with PE-conjugated anti-Ki-67 and FITC-conjugated anti-CD4 costained cells, white arrows point to positively stained cells, scale bar = 50 µm. (H) Histological immunofluorescence staining of the lacrimal gland for PE-conjugated anti-Foxp3 and FITC-conjugated anti-CD4 antibody costained cells, white arrows point to positively stained cells, scale bar = 50 µm.
Ijms 25 01208 g002
Figure 3. ILCs in mouse lacrimal glands. (A) UMAP visualization of ILC subpopulations in mouse ELGs. (B) Heatmap of Z scores for scaled expression values of DEGs for each cluster. Colors are based on the natural logarithm of normalized RNA expression. The black boxes indicate the DEGs within each cluster. (C) Dot plot showing marker genes in NK1s and NK2s cells. The dot size denotes the percentage of cells expressing the marker gene in the respective cell population, and the dot color denotes the natural logarithm of normalized RNA expression. Different colored boxes represent different cell clusters. (D) Dot plot showing marker genes in each cluster of cells. The dot size represents the percentage of cells expressing the marker gene in that cell population, and the dot color is based on the natural logarithm of normalized RNA expression. Different colored boxes represent different cell clusters. (E) Pie chart showing the number of cells in each subpopulation of ILCs and their respective percentage of the ILC population.
Ijms 25 01208 g003
Figure 4. MΦs in mouse ELGs. (A) UMAP visualization of MΦ subpopulations in mouse ELGs. (B) Heatmap of Z scores for scaled expression values of DEGs for each cluster. Colors are based on the natural logarithm of normalized RNA expression. The black boxes indicate the DEGs within each cluster. (C) Dot plot showing the marker gene in each cluster. The dot size indicates the percentage of cells expressing the marker gene in the respective cell population, and the dot color indicates the natural logarithm of the normalized RNA expression. Different colored boxes represent different cell clusters. (D) Pie chart showing the number of cells in each subpopulation of MΦs and their respective percentage of the total MΦ population. (E) Histological immunofluorescence staining of the lacrimal gland showing FITC-conjugated anti-mouse CD64+ (green) antibody-positive cells. White arrows point to positively stained cells, scale bar = 50 µm and high magnification image scale is 10 µm.
Ijms 25 01208 g004
Figure 5. DC/pDCs cells in mouse ELGs. (A) UMAP visualization of a subcluster of 1680 DCs in mouse ELGs. (B) Heatmap of Z scores for scaled expression values of DEGs for each cluster. Colors are based on the natural logarithm of normalized RNA expression. The black boxes indicate the DEGs within each cluster. (C) Dot plot showing the signature marker genes in each cluster of cells. The dot size denotes the percentage of cells expressing the marker gene in the respective cell population, and the dot color denotes the natural logarithm of normalized RNA expression. Different colored boxes represent different cell clusters. (D) Pie charts showing the number of cells in each subpopulation of DC/pDCs and their respective percentages in the total DC populations.
Ijms 25 01208 g005
Figure 6. MC/basophils in mouse ELGs. (A) UMAP visualization of 114 cells of the MC/basophil subpopulation in mouse ELGs. (B) Heatmap of Z scores for scaled expression values of DEGs for each cluster. Colors are based on the natural logarithm of normalized RNA expression. The black boxes indicate the DEGs within each cluster. (C) Dot plot showing the signature marker gene in each cluster of cells. The dot size indicates the percentage of cells expressing the marker gene in the respective cell population, and the dot color indicates the natural logarithm of the normalized RNA expression. Different colored boxes represent different cell clusters. (D) Pie chart showing the number of cells in each subpopulation of MC/basophils and their respective percentages in the total MC/basophil cell population. (E) Histological immunofluorescence staining of the lacrimal gland showing mast cells stained with FITC-conjugated avidin (green) and PE-conjugated anti-c-Kit (red). White arrows point to positively stained cells, scale bar = 50 µm.
Ijms 25 01208 g006
Figure 7. B cells/plasma cells in mouse ELGs. (A) UMAP visualization of a subcluster of 233 B/plasma cells in mouse ELGs. (B) Heatmap of Z scores for scaled expression values of DEGs for each cluster. Colors are based on the natural logarithm of normalized RNA expression. The black boxes indicate the DEGs within each cluster. (C) Dot plot showing the signature marker gene in each cluster of cells. The dot size denotes the percentage of cells expressing the marker gene in the respective cell population, and the dot color denotes the natural logarithm of normalized RNA expression. Different colored boxes represent different cell clusters. (D) Pie charts showing the respective percentages of B cells and plasma cells. (E) Histological immunofluorescence staining of the lacrimal gland showing plasma cells stained with PE-conjugated anti-CD138 (red), white arrows point to positively stained cells, scale bar = 50 µm and high magnification image scale is 10 µm. (F) Histological immunofluorescence staining for the lacrimal gland, showing B cells using an anti-mouse CD19 antibody, red arrows point to positively stained cells, scale bar = 50 µm.
Ijms 25 01208 g007
Figure 8. CellChat-inferred cell–cell communication networks reveal the functional heterogeneity of ELG immune cell populations. (A) Circle network plots displaying the number of interactions between cells, generated using CellChat. The thickness of the lines is proportional to the number of interactions between cells. The size of the nodes is proportional to the number of different cell types. (B) Circle network plots display the weights/strength of interactions between cells, generated using CellChat. The thickness of the lines is proportional to the weights/strength of interactions between cells. (C) Visualization of the primary senders and receivers in a 2D spatial context generated by CellChat demonstrates the interactions between cells. (D) Dot plots display the most important outgoing (left) and incoming (right) signaling patterns in ELG immune cell clusters. The size of the dots is proportional to the contribution score obtained from pattern recognition analysis. A higher contribution score indicates a richer signaling pathway in the corresponding cell clusters. (E) Heatmaps display the inferred communication network of the Thy1 signaling pathway among all cell types, where darker colors represent stronger involvement of the corresponding signaling pathway in the cell clusters. Violin plots show the distribution of signal gene expression in each signaling network. (F) Heatmaps display the inferred communication network of the APP signaling pathway among all cell types, where darker colors represent stronger involvement of the corresponding signaling pathway in the cell clusters. Violin plots show the distribution of signal gene expression in each signaling network.
Ijms 25 01208 g008
Figure 9. Immune cell diversity in the lacrimal glands of healthy mice.
Ijms 25 01208 g009
Disclaimer/Publisher’s Note: The statements, opinions and data contained in all publications are solely those of the individual author(s) and contributor(s) and not of MDPI and/or the editor(s). MDPI and/or the editor(s) disclaim responsibility for any injury to people or property resulting from any ideas, methods, instructions or products referred to in the content.

