Article

Mapping and Screening of Candidate Gene Regulating the Biomass Yield of Sorghum (Sorghum bicolor L.)

1
Shanxi Key Laboratory of Minor Crops Germplasm Innovation and Molecular Breeding, Shanxi Agricultural University, Taigu, Jinzhong 030800, China
2
College of Life Sciences, Shanxi Agricultural University, Taigu, Jinzhong 030800, China
3
College of Agriculture, Shanxi Agricultural University, Taigu, Jinzhong 030800, China
*
Authors to whom correspondence should be addressed.
Int. J. Mol. Sci. 2024, 25(2), 796; https://doi.org/10.3390/ijms25020796
Submission received: 10 December 2023 / Revised: 1 January 2024 / Accepted: 3 January 2024 / Published: 8 January 2024
(This article belongs to the Section Molecular Plant Sciences)

Abstract

:
Biomass yield is one of the important traits of sorghum, which is greatly affected by leaf morphology. In this study, a lobed-leaf mutant (sblob) was screened and identified, and its F2 inbred segregating line was constructed. Subsequently, MutMap and whole-genome sequencing were employed to identify the candidate gene (sblob1), the locus of which is Sobic.003G010300. Pfam and homologous analysis indicated that sblob1 encodes a Cytochrome P450 protein and plays a crucial role in the plant serotonin/melatonin biosynthesis pathway. Structural and functional changes in the sblob1 protein were elucidated. Hormone measurements revealed that sblob1 regulates both leaf morphology and sorghum biomass through regulation of the melatonin metabolic pathway. These findings provide valuable insights for further research and the enhancement of breeding programs, emphasizing the potential to optimize biomass yield in sorghum cultivation.

1. Introduction

Sorghum (Sorghum bicolor L.) is the world’s fifth-largest cereal crop and a staple food for more than 500 million people, particularly in arid and semi-arid regions, where it exhibits moderate resistance to many stressors such as drought, salinity and bareness [1,2]. Sorghum is also a potential source of bioenergy, possessing excellent traits such as high biomass yield and a short growth period [3]. Sorghum’s high biomass yield translates into a substantial quantity of plant material, offering abundant feedstock for biofuel production [4]. For example, sweet-stemmed sorghum is a valuable resource when it comes to extracting sugars [5], while its leaves and stems contribute to the production of cellulose—a key component in biofuel and bioethanol manufacturing processes [1,4,5]. Therefore, the biomass yield of sorghum has important potential in energy production, in addition to economic viability and diverse agricultural applications [6]. It is particularly suitable for functional genetic studies related to various agronomic traits, such as leaf morphology, because it is characterized by 2n = 20 chromosomes as a diploid species [7].
Leaf morphology is one of the key agronomic traits affecting the biomass yield of sorghum, presenting a broad range of phenotypic variations relevant to its use as a potential energy crop [8]. It can also be used to determine the efficiency of photosynthesis, plant architecture and nutrient distribution [9,10], as larger leaf areas have been positively correlated with biomass yield characteristics in sorghum [11]. Moreover, leaf morphology can also affect nutrient uptake, which is crucial to the plant’s growth and biomass yield [12]. Although leaf morphology and biomass yield are important agronomic traits, the molecular genetic mechanism that controls these traits in sorghum has yet to be fully elucidated. Understanding the genetic basis for leaf morphology and biomass yield in sorghum facilitates the identification of key genes and genetic markers [13], enabling the application of molecular breeding techniques to introduce these traits into new crop varieties. These achievements can significantly enhance the precision and effectiveness of sorghum breeding efforts, ultimately contributing to global sustainable agriculture [6]. Thus, deciphering the genetic basis of leaf morphology and biomass yield is an essential component of breeding programs.
Leaf morphology regulation is controlled by both environmental factors and genetic regulators [14]. Several genes and pathways have been reported to be involved in leaf morphology regulation in many plants [15], and mutations in these genes frequently result in atypical leaf morphology in model plants. For example, a change in the SERRATE gene (SE) would lead to abnormal leaf morphology in Arabidopsis. The SERRATE gene encodes a zinc finger protein in Arabidopsis, and the mutant displays serrated leaves [16]. The LATE MERISTEM IDENTITY1 (LMI1, AT5G03790) gene acts as a meristem identity regulator, which is essential for serrated leaves in Arabidopsis [17]. In cereal crops, NARROW LEAF 1 and NARROW LEAF 7 regulate the leaf morphology of rice via the auxin-mediated acid growth mechanism [12,18]. GLYCINE MAX DWARF CRINKLED LEAF 1 (GmDCL1) is a promising gene involved in the morphogenesis of the crinkled leaf trait of the soybean [10]. These studies demonstrate that leaf morphology is a complex trait involved in many genetic pathways such as hormone signals, transcription factors and the interactions between them [15]. In sorghum, BY1 influences both biomass and grain yield. This influence is exerted through the regulation of the primary and secondary metabolism, particularly via the shikimate pathway [11]. Though some studies reported the regulation of leaf morphology development, in sorghum, this trait is in need of further investigation.
The MutMap technique combines whole-genome sequencing and genetic analysis to facilitate gene mapping [19]. It can be used to rapidly identify molecular markers tightly linked to causal genes underlying a given phenotype [20]. MutMap employs high-generation segregating populations as mapping populations, thereby circumventing the necessity for backcrossing between mutant and wild-type parents. Consequently, it provides notable advantages in terms of rapidity and precision [21]. Many candidate genes associated with desirable agronomic traits have been isolated using the MutMap method [22]. For example, many rice grain-size-related genes such as OML4 (Mei2-like protein 4), OSH15 (Oryza sativa homeobox 15) and PPKL1 (protein phosphatase with kelch-like domains 1) were isolated using MutMap method [23,24,25]. While numerous genes in rice have been mapped, the utilization of MutMap for identifying genes in sorghum mutants has not been documented.
In this study, we established an F2 inbred segregating line of a sorghum lobed-leaf mutant (sblob) which comprises a significant number of individuals manifesting the lobed-leaf phenotype, as well as individuals displaying the wild-type leaf phenotype. Then, NGS (next-generation sequencing)-based genotyping was performed for the mutant phenotype pool and the wild-type phenotype pool to identify the genome difference between the two pools, and 2M SNP markers were developed. Subsequently, MutMap analysis was conducted by employing the developed SNP markers and 9M candidate intervals, and 937 candidate genes were obtained. Finally, based on the functional annotation information of the developed SNPs and an analysis of the sequence differences between the two allelic pools, the candidate gene underlying the lobed leaf in sorghum was identified and predicted, and was designated as sblob1. The primary objective of this study is to identify the specific genetic locations and candidate genes associated with the development of lobed leaves in sorghum. In our work, sblob1 (Sobic.003G010300) is suggested as a strong candidate gene accounting for the regulation of the lobed-leaf phenotype observed in the sblob mutant. This study also provides valuable insights into the regulatory processes accounting for lobed leaf formation in sorghum, thus supporting subsequent investigations in the field of sorghum functional genomics.

2. Results

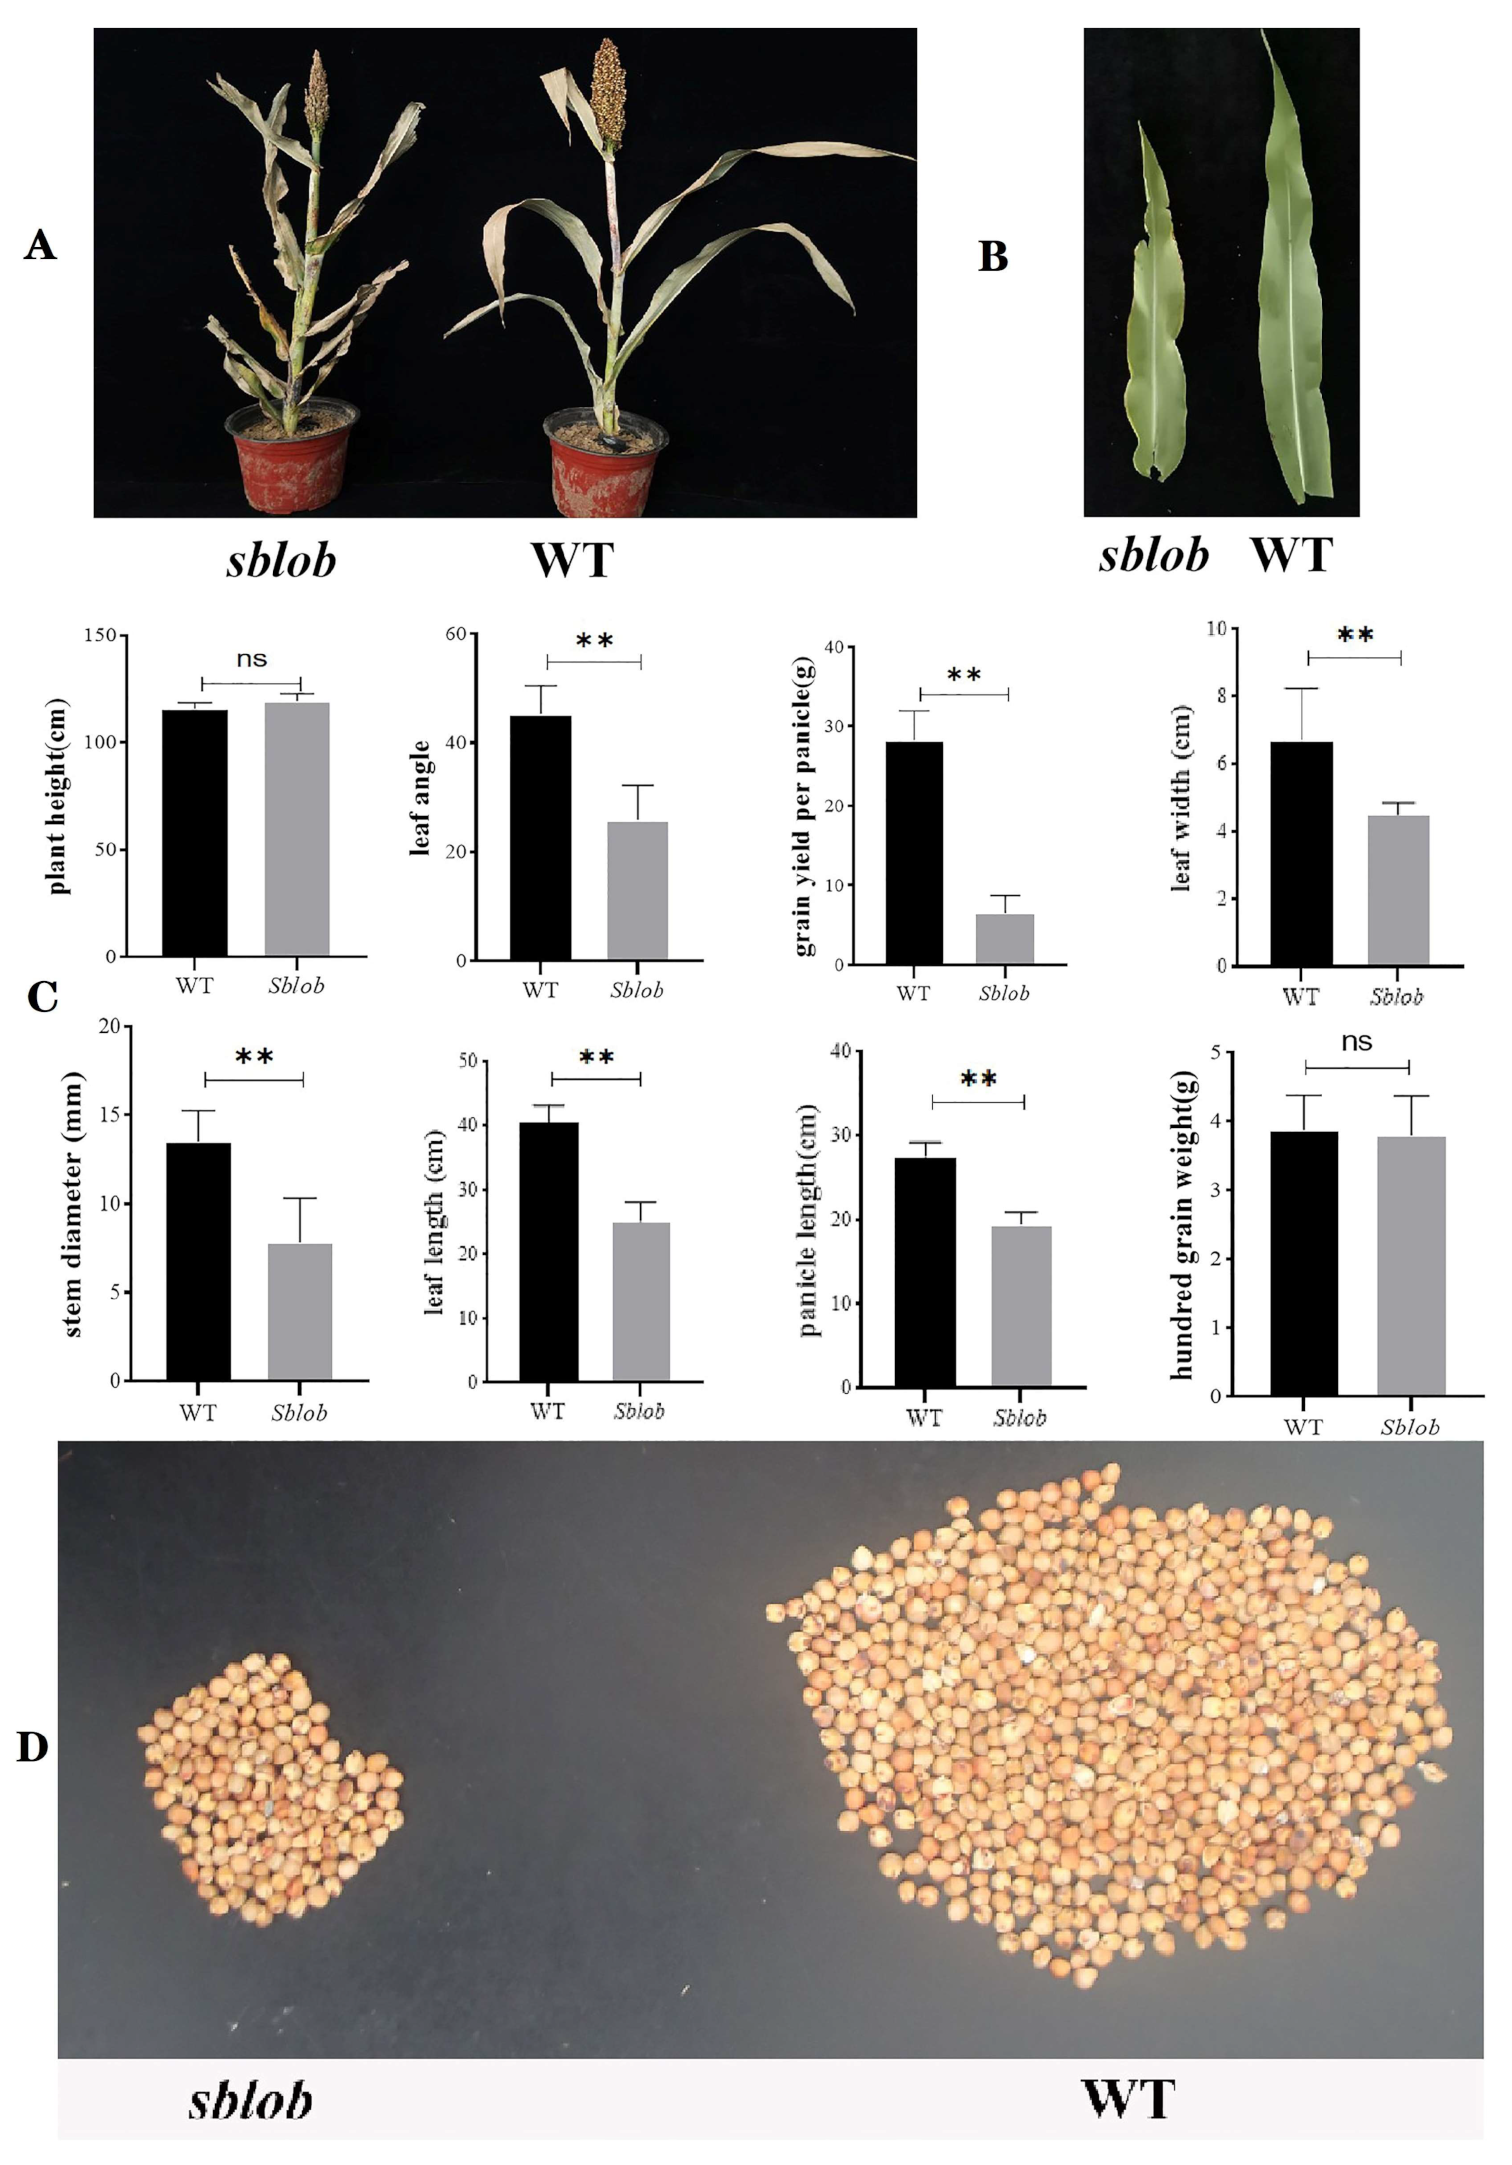
2.1. Phenotypic and Physiology Analysis of sblob and WT Plants

Phenotypic analysis showed that the sblob and WT plants exhibited significant differences in plant morphology at the mature stage (Figure 1A), and the leaves of sblob plants exhibited a lobed phenotype at the heading stage (Figure 1B). Moreover, the leaf length, leaf width, leaf angle, panicle length, stem diameter, grain yield per panicle (Figure 1C) in the vegetative and mature stage (Figure 1D and Table S1) of sblob plants decreased significantly, while differences in the plant height and hundred-grain weight between the two allelic pools showed no significance (Figure 1D and Table S1).
In the traits exhibiting differential characteristics, the mutant displayed reductions when compared to the corresponding traits in the wild type. For example, the mutant displayed more than a 42% reduction in stem diameter and leaf angle and a 37% decrease in leaf length (Figure 1D and Table S1). Nevertheless, it is worth highlighting that the sblob plants showed a decrease in leaf angle, indicating a compact plant architecture (Figure 1A).
Upon microscopic examination of leaf anatomical characteristics in both WT and sblob plants, the sblob plants exhibited an obvious decrease in the volume of leaf epidermal cells (Figure 2A and Table S1) and leaf thickness (Figure 2B and Table S1) compared to the WT plants (Figure 2A and Table S1). Furthermore, observable differences were noted in the vascular tissues of both WT and sblob plants (Figure 2A and Table S1). The vascular bundles in the sblob mutant displayed underdeveloped characteristics compared to their well-developed counterparts in WT plants (Figure 2A), while the parenchyma cell layers surrounding the vascular bundles in sblob plants exhibited less development when contrasted with those in WT plants (Figure 2D).
The assessment of chlorophyll levels in sblob and WT leaves during the shooting and heading stages revealed a potential correlation between the lobed-leaf phenotype and reduced chlorophyll content (Figure 2C), leading to diminished photosynthetic efficiency. Notably, at the heading stage, chlorophyll a levels in sblob plants decreased by over 40% compared to those of WT plants (Table S1), concomitant with a nearly 20% reduction in photosynthetic efficiency (Figure 2E and Table S1).

2.2. Genetic Analysis of the sblob Mutant

To investigate the genetic regulation of the sblob mutant, we established an F2 population comprising 412 individual plants, which was generated from a cross between sblob and 1383-2 (wild-type cultivar) plants. F1 plants were then cultivated and allowed to self-pollinate to generate F2 seeds for subsequent analyses. All F2 plants, along with the two parental cultivars, were grown in the field for segregation analysis. At the shooting stage, the distinctive mutant leaf phenotype could be clearly distinguished from the typical leaf morphology of WT plants. The segregation analysis of sblob in the F2 population was carried out using the Chi-square analysis method, as previously described [26,27]. This analysis revealed a theoretically expected Mendelian ratio of 3:1 for sblob to WT phenotype (Table 1). The segregation pattern observed in the experiment implies that the sblob phenotype is controlled by a single dominant mutation [28].

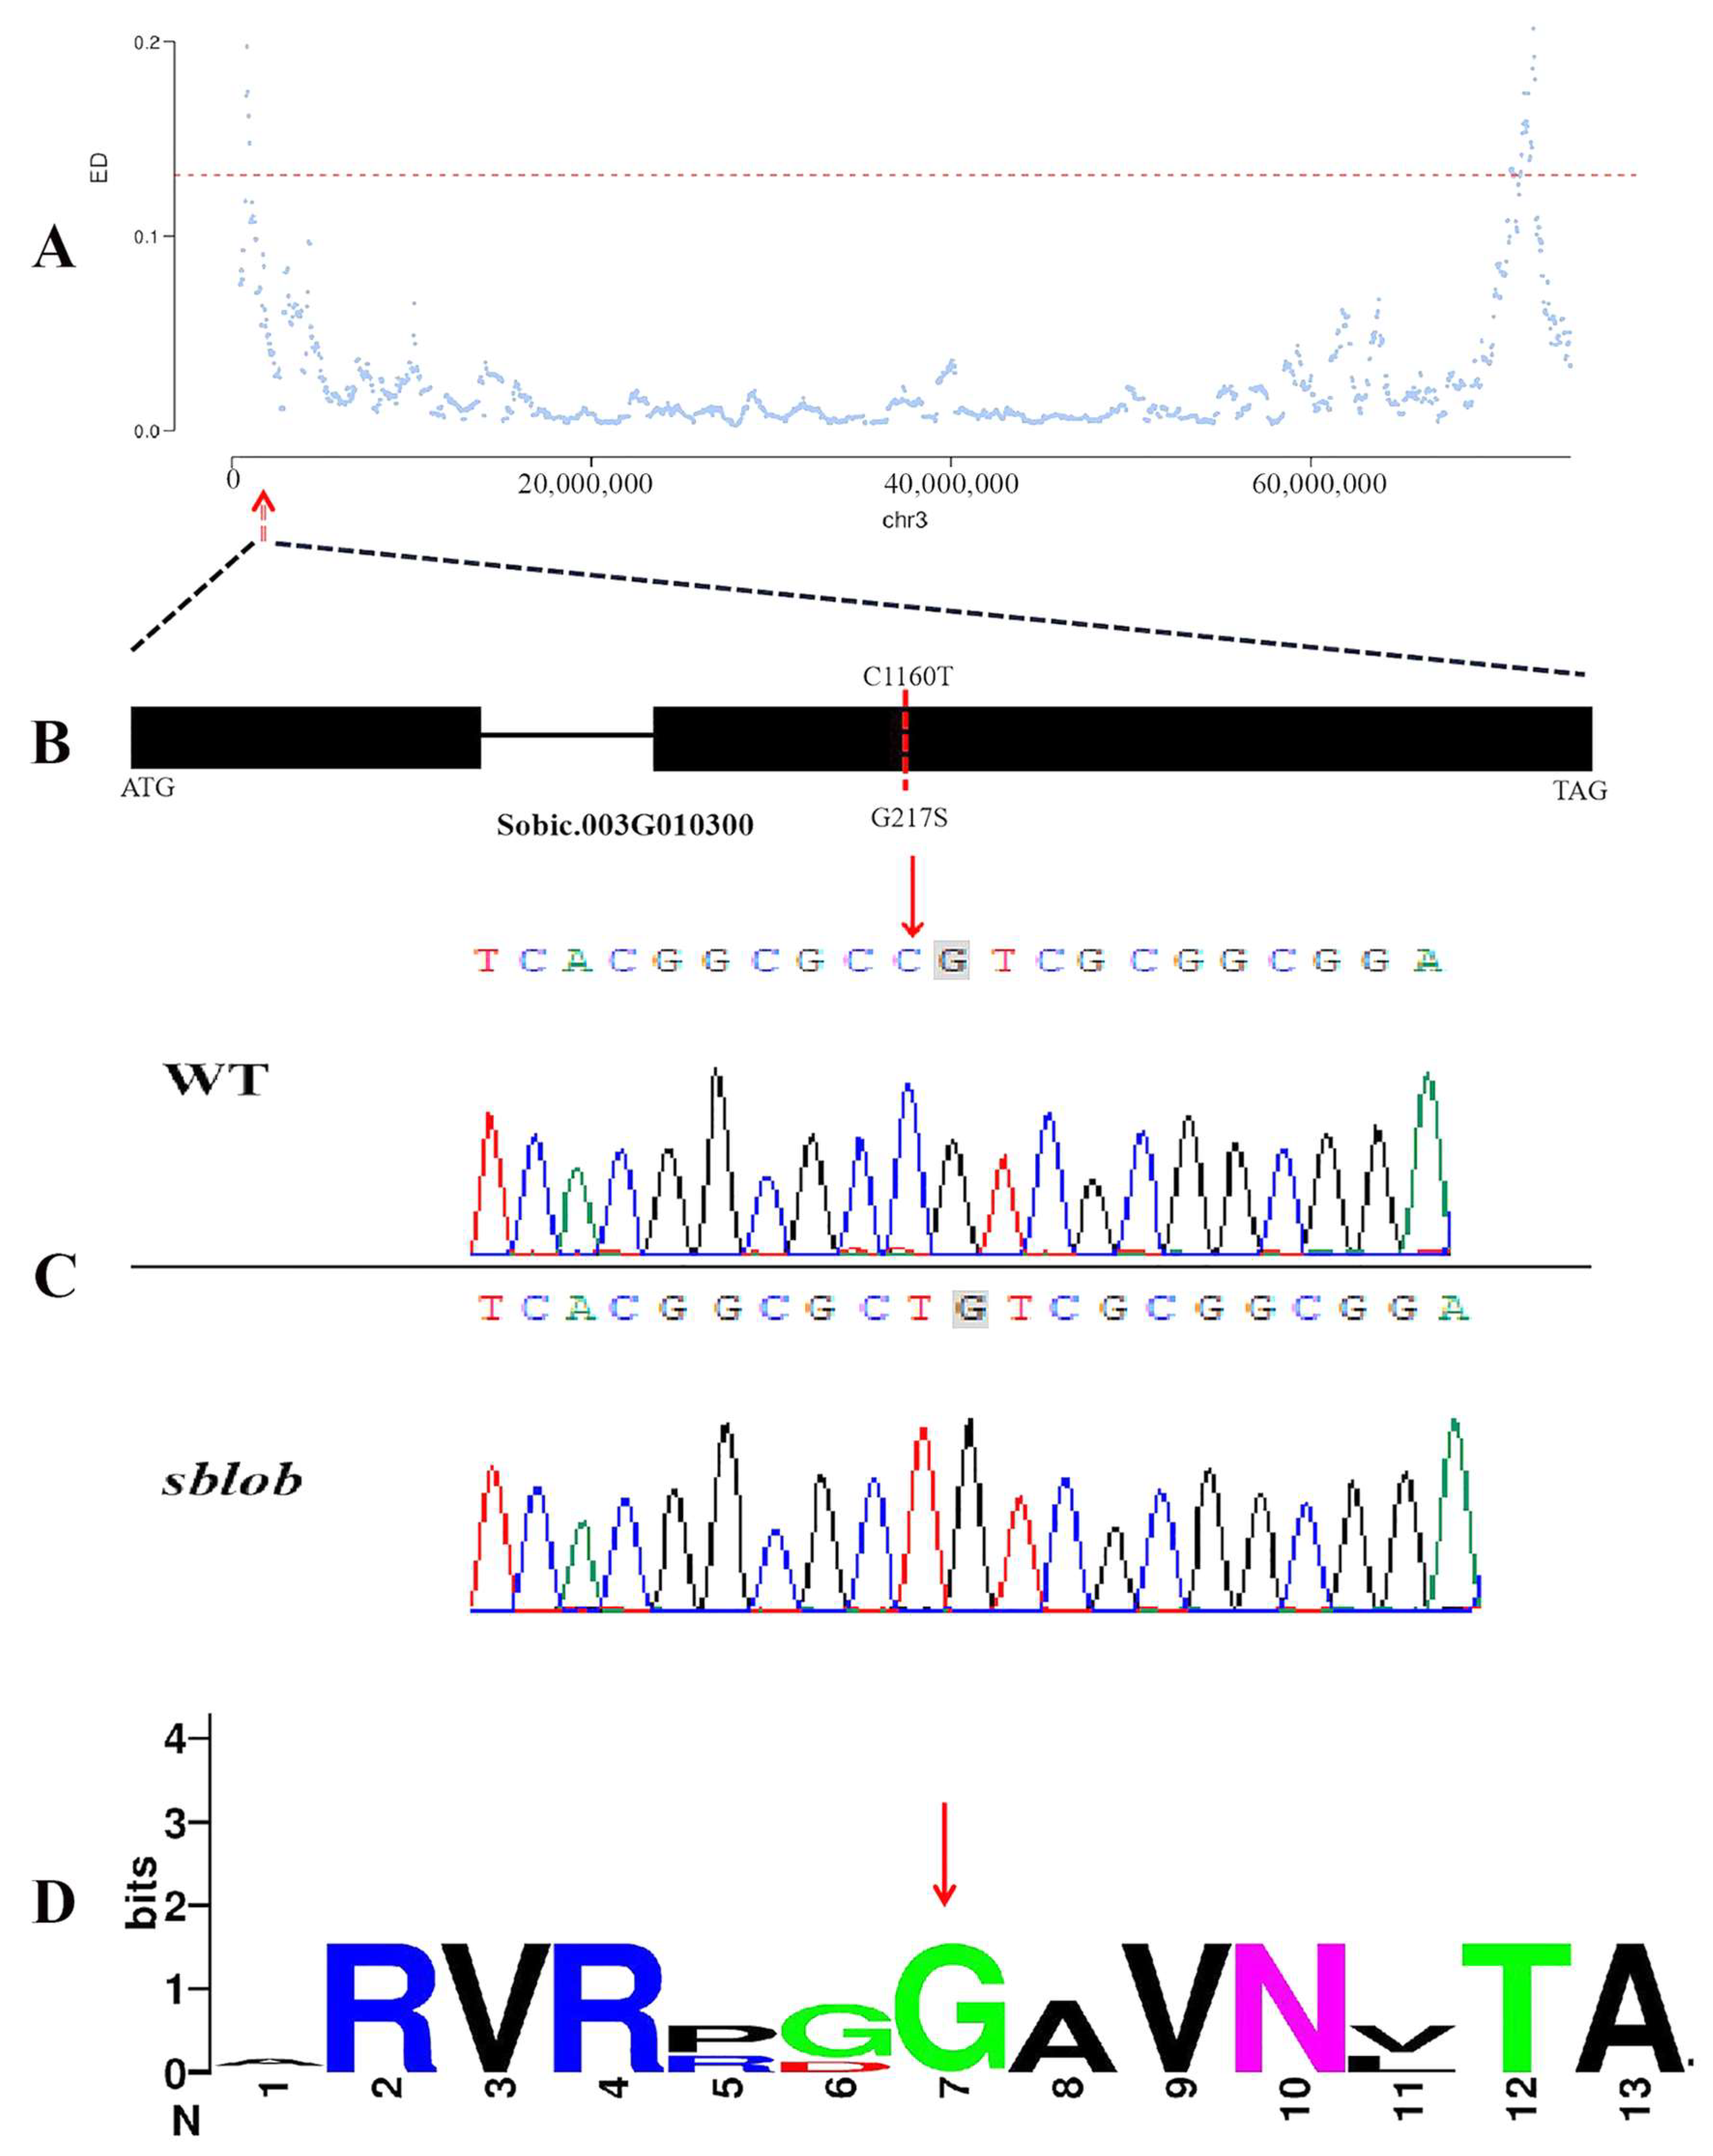
2.3. Mapping of the sblob1 Gene by Whole-Genome Resequencing

A total of 190,778,008 and 177,743,206 clean reads were generated from WT and sblob libraries, respectively, after data filtering was aligned with the sorghum reference genome. Subsequently, 28,728,254,222 and 26,767,472,954 clean bases were obtained from the clean-reads pools (Table 2). The percentage of high-quality bases (Q30) for WT and sblob pools was over 94%, which was indicative of their good quality (Table 2). Moreover, in WT and sblob pools, the mapping ratios were 99.12% and 98.49%, respectively (Figure S1), while the proper mapping ratios (%) were 95.68 and 95.13 (Table 2) and the average depths for the two pools were 44.16 and 40.98, respectively (Table 2).
After SNP calling, 2,060,083 SNPs and 418,196 indels were generated from the WT pools, while the sblob pools provided 2,061,011 SNPs and 418,310 indels, respectively (Table S3). The whole-genome MutMap analysis was performed using the ED algorithm. The results revealed that the total length of candidate regions was 9MB, comprising 22 intervals distributed on different chromosomes (Table 3 and Figure S2). Within these candidate intervals, 960 genes were annotated, accounting for 1328 transcripts (Table 3 and Table S4).

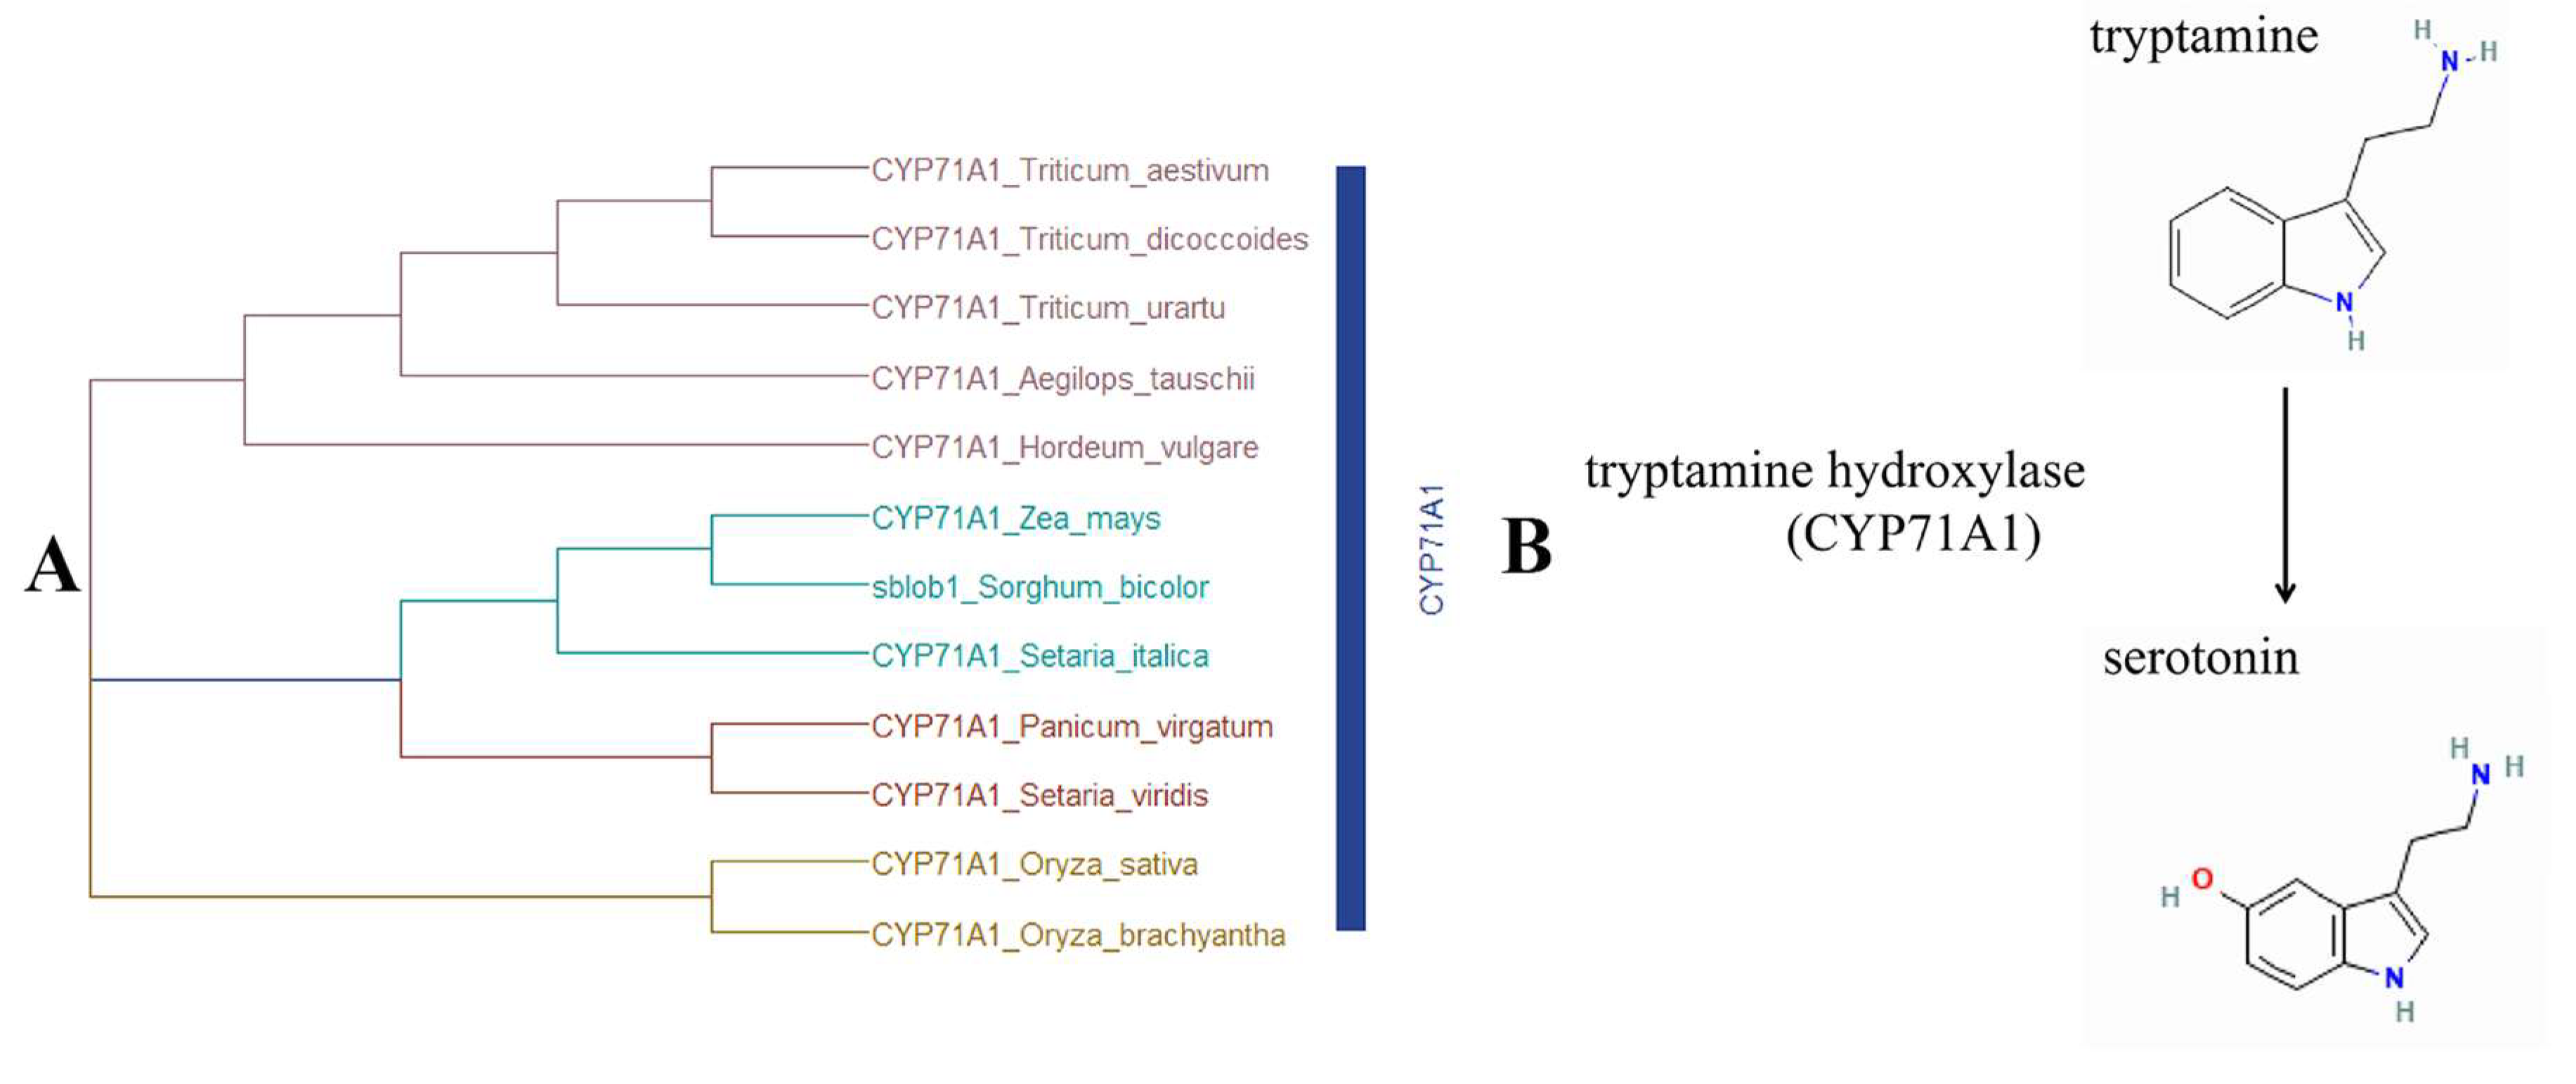
2.4. Identification and Validation of Candidate Gene Accounting for sblob Mutant

MutMap analysis sequencing was conducted on distinct pools of recessive and dominant individuals, following the approach outlined previously [29]. The results allowed us to pinpoint the candidate gene within specific regions in three chromosomes (Figure 3A). Subsequently, the candidate SNPs in the pool of recessive individuals were analyzed and were found to exhibit heterozygosity in the dominant individual pool. Only one SNP met the specified criterion within the mapped interval. This particular SNP, located in the second exon of the Sobic.003G010300 gene, manifested a G-to-A alteration at position 885631bp, resulting in a singular amino acid change (G217S) (Figure 3B). Moreover, DNA sequence analysis confirmed the mutation site in the sblob mutant, and multiple protein sequence comparison indicated that the protein site was highly conserved in different crop plants (Figure 3C,D).
Protein BLAST analysis and Pfam analysis showed that Sobic.003G010300 encodes an SbCYP71A1 protein, which belongs to the Cytochrome P450 superfamily (CYP) (Figure 4A). Homology alignment and gene annotation revealed that the CYP71A1 gene codes for the tryptamine 5-hydroxylase enzyme (Figure 4B), a crucial component in the plant serotonin/melatonin biosynthesis pathway [30,31]. This confirmed that Sobic.003G010300 is a potential candidate gene for sblob1.

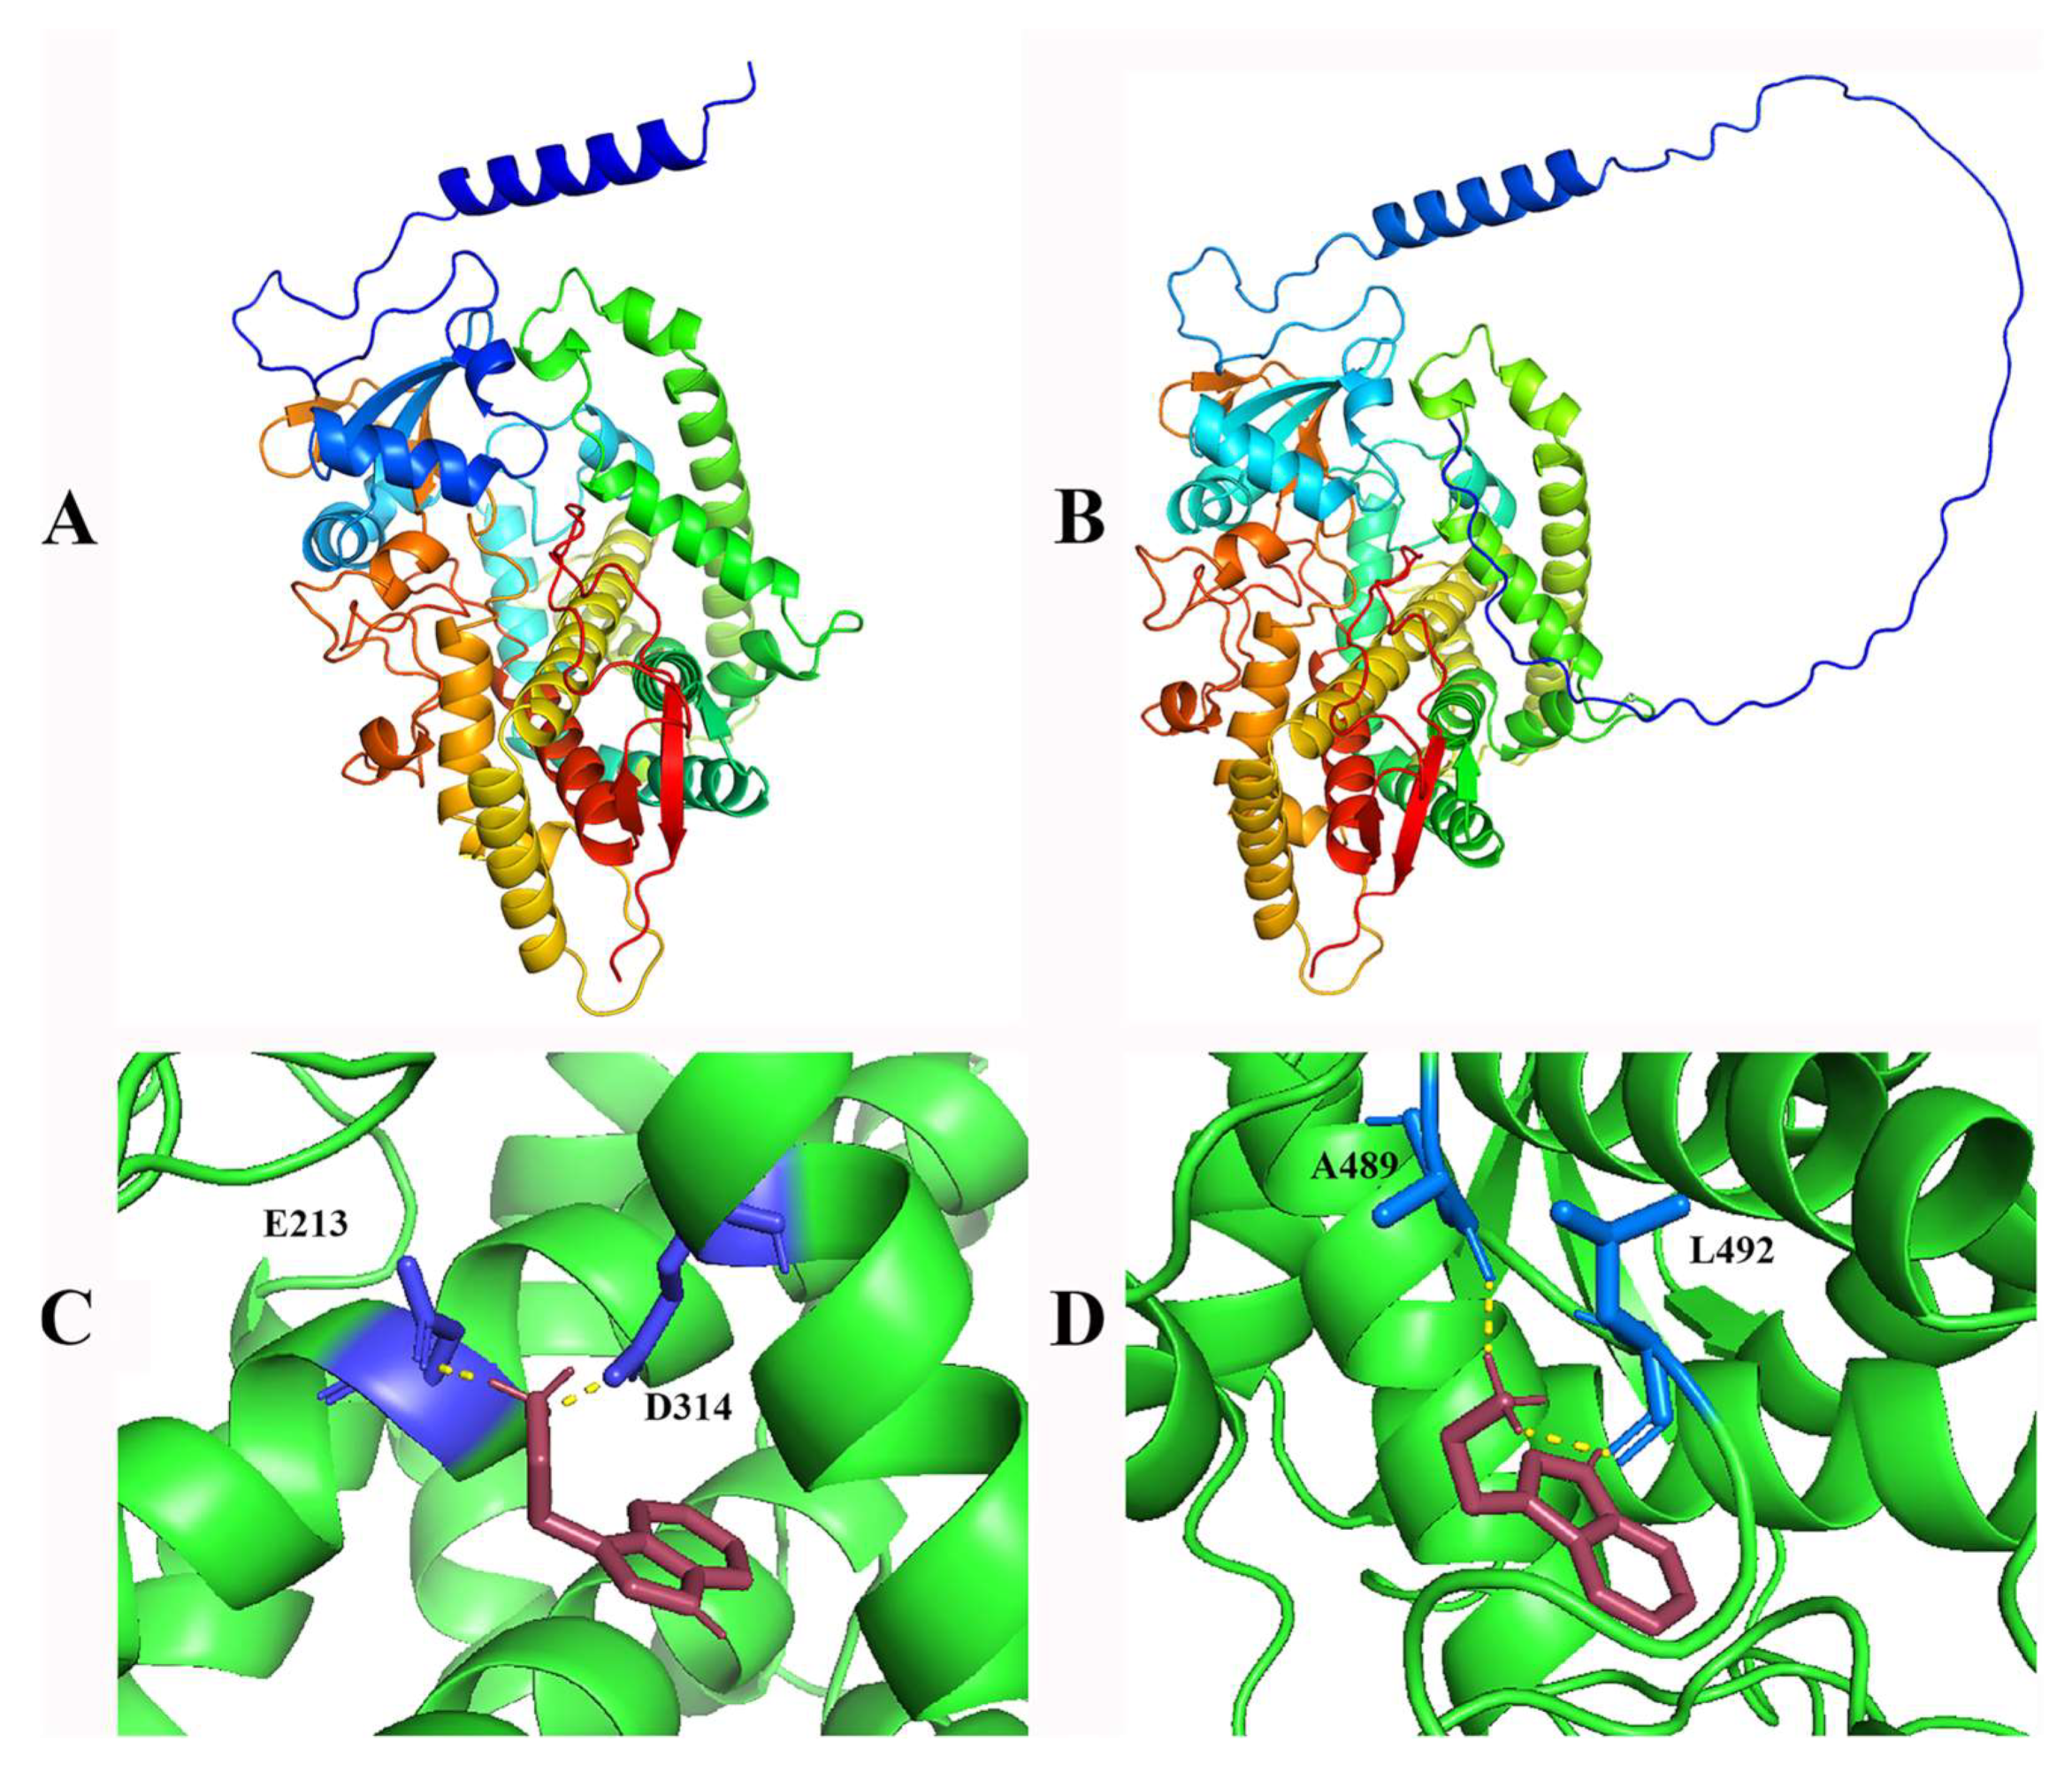
2.5. Structure Prediction and Molecular Docking

Given that the mutation site is located within the conserved domain of the sblob1 protein, and considering the distinct physical and chemical properties of Gly and Ser, this mutation could induce a structural alteration in the sblob1 protein. To verify this, Alphfold2 was employed to analyze the 3D structure. A substantial alteration was observed when the 217nd amino acid was switched from Gly to Ser (Figure 5A,B).
Furthermore, amino acids’ alteration of the conserved region of encoding enzymes generally causes structural variations, altering the binding models of the substrates. In this study, the substrate used for the sblob1 protein was tryptamine. In light of this, AutoDock 4.2.6 software was employed to perform molecular docking validations to examine the docking models of the sblob1 protein and its corresponding wild-type protein with the substrate. The results showed that the binding models of sblob1 with tryptamine changed significantly compared to the WT protein (Figure 5C,D). The WT protein interacted with tryptamine via the residues at the positions of 213(E) and 314(D), while the sblob interacted with the substrate at 489(A) and 492(L) (Figure 5C,D).

2.6. Determination of the Melatonin and Auxin Content in Both the WT Plant and sblob Mutant

For a more in-depth analysis of the physiology profile of the sblob mutant, the contents of melatonin and tryptamine in both sblob and WT plants were determined using LC-MS. No melatonin was detected in the sblob mutant plants, whereas a significant amount of melatonin was detected in the WT plants (Figure 6A and Figure S3). Comparatively, the tryptamine content in the sblob plants was significantly higher than that in the WT plants (Figure 6B and Figure S4). All types of auxins were measured, and their content displayed no significant difference between the WT and sblob plants (Figure 6C).

3. Discussion

3.1. Abnormal Leaf Phenotype and Cell Development Are Responsible for sblob Mutant

Biomass yield and leaf morphology are crucial agronomic traits in sorghum, and are key to determining crop productivity and overall plant performance [32]. Understanding the underlying molecular mechanisms that regulate these traits is essential for crop improvement and breeding programs.
The biomass yield of sorghum refers to the amount of above-ground plant material produced, which directly influences forage production [33]. It is directly influenced by leaf morphology, another important trait in sorghum [34] that affects photosynthetic efficiency, water use efficiency, and overall plant growth and development [35]. Although biomass yield and leaf morphology are key agronomic traits in sorghum, their molecular mechanisms remain poorly understood. Deciphering these mechanisms is crucial for enhancing crop productivity and developing improved sorghum varieties.
The biomass of the sblob mutant exhibited a reduction compared to the wild-type (WT) plant. This change could be attributed to various factors, including morphological abnormalities such as diminished stem diameter and shorter leaves (Figure 1). This compromised development at the top of the panicle and decreased the panicle length. Additionally, a lower seed-setting rate in sblob plants contributed to a diminished grain yield per plant (Figure 1). Microscopic examinations involving paraffin sectioning implied that the reduction in stem diameter and shorter and thinner leaves in sblob plants was a result of inhibited cell development (Figure 2A,B), which affects the chlorophyll content and photosynthesis efficiency (Figure 2C–E). These cellular- and physiological-level alterations ultimately led to the observed reduction in biomass.

3.2. Detection of Candidate Gene Accounting for sblob by MutMap

In recent research, the whole-genome sequencing (WGS) and MutMap approach has emerged as a prominent method in gene mapping studies across various plant species [36,37]. This technique could generate comprehensive data, covering extensive genomic regions on the reference genome with heightened sequencing depth. In this study, employing WGS on the two sample bulks derived from the F2 population yielded 56 GB of clean bases, with a Q30 over 94%, indicating the high quality of the bases (Table 2). Moreover, in WT and sblob pools, the mapping ratios were 99.12% and 98.49%, respectively (Table 2, Figure S1), and the average depths for the two pools were 44.16 and 40.98 (Table 2). These results are indicative of the accuracy and high quality of the sequencing library, and it was well suited to achieving precise detection of the candidate genomic region and genes associated with the target lobed-leaf phenotype.
The SNPs were precisely positioned across the complete array of sorghum chromosomes (at least one base coverage), resulting in a more concentrated genome coverage and facilitating an optimal marker density for the identification of the pertinent candidate gene. Subsequently, the candidate region for the SNPs was analyzed, with the aim of pinpointing the most likely gene associated with a given SNP and lobed-leaf trait.

3.3. Single Nucleotide Mutations Result in Gene Functional Inactivation of sblob1

In this study, the candidate SNP was isolated using MutMap, and the sequence differences between the two allelic pools were based on the previous study [38], which demonstrated this SNP’s efficiency and accuracy in other crops such as rice (Oryza sativa) [28], soybean (Glycine max) [10] and Setaria italic [39]. In our study, sequencing verification and homologous comparison results showed that a Gly to Ser amino acid substitution in a highly conserved region of Sobic.003G010300 (Figure 3) was responsible for the low biomass yield and lobed-leaf phenotype of the sblob mutant. Pfam and homology analysis identified the candidate gene as SbCYP71A1 (Figure 4A), which was involved in the synthesis of melatonin/serotonin in plants (Figure 4B) [30]. Gly to Ser amino acid substitution in the candidate gene led to abnormal protein structure and functional loss (Figure 5); the melatonin level was reduced in the sblob mutant (Figure 6A), causing further phenotype abnormalities and decreased biomass yield.
In this study, MutMap and homolog-guided alignment were used to identify the candidate gene responsible for abnormal leaf morphology in sorghum. Compared with conventional map-based cloning, MutMap can rapidly identify candidate regions using F2 progeny derived from a cross between the mutant and its wild-type counterpart [40]. When coupled with homologous gene alignment and comprehensive gene annotation, this approach allows a more rapid screening of candidate genes [41]. This strategy has been successfully applied to the screening of candidate genes associated with high production and responses to both biotic and abiotic stress across various plant species [39,42]. Thus, we have further substantiated the reliability of MutMap and homolog-guided gene discovery in sorghum, extending the application of this methodology within the sorghum context. This expansion serves as a valuable reference for the investigation of sorghum mutants in future studies.

3.4. Sblob1 Regulates Sorghum Biomass by Influencing Melatonin Synthesis

Melatonin is involved in various aspects of the growth and development of plants, such as flowering, photosynthesis, growth rhythms, leaf and root morphogenesis, seed germination and other growth and development processes [43,44]. For example, in cereal crops, transgenic rice expressing higher levels of endogenous melatonin demonstrated increased biomass yield compared to wild-type plants [45], while in horticultural plants, the application of exogenous melatonin enhances biomass yield [46], total carbohydrates and nutritional value [47]. In bioenergy crops, such as switchgrass (Panicum virgatum), transgenic plants with elevated melatonin levels exhibited significantly improved growth characteristics and a higher biomass yield [48]. Conversely, a reduction in melatonin levels induced abnormal leaf morphology and reduced biomass and grain yield in rice, which was consistent with our findings [49].
Furthermore, several homologous genes of sblob1 (SbCYP71A1) occur in various grass species; however, many remain largely unexplored. One notable exception is OsCYP71A1 in rice. OsCYP71A1 is associated with melatonin synthesis, encoding a protein with analogous functionality in sorghum [50]. There is also evidence that OsCYP71A1 may be a promising target for enhancing rice production under adverse environmental conditions [51]. In this study, the sblob mutant also exhibited abnormal melatonin levels and reduced biomass yield, suggesting that sblob1 is a candidate gene that regulates sorghum biomass by influencing melatonin synthesis.
Although there was a difference in tryptamine content between sblob and wild-type plants (Figure 6B), the differences in total auxin content showed no significance (Figure 6C), proving that the mutant phenotype was caused by the difference in melatonin content caused by variations of sblob1. However, no similar studies and genes have been conducted for sorghum. Therefore, sblob1 has been identified as a novel gene that regulates the biomass and leaf morphology of sorghum.
Overall, our findings have identified sblob1 as a candidate gene that regulates the biomass yield of sorghum. These findings have significant implications for the development of crops with greater biomass yields. Further research is needed to explore the molecular mechanisms by which melatonin regulates biomass yield and leaf morphology and to explore its potential as a target for genetic engineering in the context of crop improvement.

4. Materials and Methods

4.1. Construction of Mapping Population

The lobed-leaf mutant sblob was isolated after multiple generations from the ethyl–methane sulfonate (EMS)-treated wild-type cultivar 1383-2. The seeds of the wild-type cultivar “1383-2” were chosen for mutagenesis based on the findings of a previous study [52] and subsequently sown to establish the mutant population, yielding more than three hundred thousand (300,000) plants in the year of 2021. The sblob mutant was identified through careful phenotypic analysis, in which a systematic and comprehensive screening process was used to identify mutants that exhibited the intended phenotype. WT (wild-type) and sblob (mutant-type) plants were used for phenotypic and genetic analyses in this study. For the WT line and sblob line, all the plants were grown in the experimental station of Shanxi Agriculture University, Taigu, China.
The sblob mutants were easily distinguishable in the shooting stage, displaying a distinctive lobed-leaf phenotype. In recent years, more than 100 independent sblob mutants have been identified within this mutant population based on the previous study [53]. These putative sblob mutants were subsequently crossed with the WT (wild-type) line. The genetic nature of the mutation (recessive or dominant) was determined in the resulting F1 plants. If the F1 plants displayed a normal leaf phenotype, the mutation was characterized as recessive. On the contrary, if the F1 plants exhibited the sblob phenotype, the mutation was classified as dominant. Notably, all the sblob mutants identified have proven to be dominant. Only those sblob mutants that displayed a consistent Mendelian segregation ratio (3 sblob: 1 WT) in the F2 progeny were confirmed as genuine sblob mutants. Then, those F2 progeny lines were chosen as the mapping population with which to generate sblob and WT pools.

4.2. Field Experiment and Phenotype Analysis

The field experiments were conducted with three planting locations as replications. Each replication consisted of 4-row plots of 2 m in length. The row spacing and plant space were 60 and 6 cm, respectively.
During the vegetative growth stage, in which the segregating phenotypes could be observed in the F2 population, the individual plants were labeled based on the segregating phenotypes. Plant phenotypes such as plant height, flag leaf length, leaf angle, leaf width and panicle length were determined and measured in the flowering stage in the field (Figure S5), while the grain weight per plant and 100-grain weight were determined during the harvest stage.
The photosynthesis efficiency of WT and sblob plants was measured using the Li-6400 portable photosynthesis system (LI-COR, Lincoln, NE, USA) at the shooting and heading stage, with three biological replicates tested for each sample. Photosynthetic determination was conducted using the flag leaf from 08:00 to 11:00 on clear days. Each experiment involved three individual plants. To assess the chlorophyll content, fresh flag leaves from sblob and WT plants at the shooting and heading stages were harvested, weighed and ground to a powder in liquid nitrogen for further analysis. The chlorophyll content was extracted using acetone and measured according to a recently reported method [54].

4.3. Histological Analysis

For histological examination, fresh flag leaf tissues were harvested from both sblob and WT plants during the heading stage. The collected tissues were then immersed and fixed in a 3.7% FAA solution containing 3.7% formaldehyde, 70% ethanol and 5% glacial acetic acid. After overnight incubation at 4 °C, the specimens underwent a series of dehydration and infiltration processes. These samples were subsequently embedded in paraffin, cut into 8 µm slices using a Leica RM2265 microtome, stained with 1% Methylene Blue and observed using a BX51 microscope (Olympus, Tokyo, Japan).

4.4. DNA Extraction and Whole-Genome Sequence

Distinctive leaf phenotypes within the F2 population were chosen, and two genomic DNA bulks (WT and sblob) were established. Genomic DNA extraction was performed on fresh young leaves from F2 individuals using the CTAB extraction kit. Each bulk consisted of genomic DNA samples from 30 individual plants with equivalent concentrations. The concentration and quality of genomic DNA in each bulk were evaluated using a NanoDrop spectrophotometer (NanoDrop, Wilmington, DE, USA) and 1.2% agarose gel electrophoresis, respectively. After that, the DNA bulks were employed for library construction and subsequent whole-genome sequencing.
The genome libraries were constructed and verified based on the previous study [10]. Whole-genome sequencing was performed using the High Throughput Illumina Library Sequencing (Illumina HiSeq X ten) (Illumina, San Diego, California, USA) Platform. The raw data were filtered by the phred score to remove adapter sequences and low-quality bases to obtain the clean data, based on the previous study [55]. The clean data were then aligned and mapped to the reference genome of sorghum using BWA-MEME2 software (accessed on 8 August 2021) [56].
As the clean data were aligned on the reference genome, the mapped ratio, sequencing depth and genome coverage were calculated and evaluated. The average alignment efficiency of the reads was evaluated based on the Q30 score (the percentage of bases with a mass value of 30 or greater), which exceeded 80%, indicating the high quality of the bases.

4.5. SNP Calling and Annotation

SNP calling was performed using GATK’s HaplotypeCaller method, and the filtering criteria were applied according to the recommended parameters. Subsequently, the SnpEff program was utilized to perform functional annotation of identified SNPs and indels based on the genome annotation of sorghum [57]. Finally, the detailed position and functional annotations of each SNP and indel were obtained.

4.6. Association Analysis Based on Euclidean Distance (ED)

To select the candidate genome region associated with the phenotype of the sblob mutant, Euclidean distance (ED) analysis was performed based on the previous study [58]. In the present study, power processing was adopted to eliminate background noise [58]. Candidate regions were detected by using 99.5% as the threshold to avoid deviation caused by uneven distribution of SNP markers. It was determined that the candidate regions must contain at least 10 variant sites above the threshold. Finally, according to the results of the ED analysis, the Manhattan map was drawn using the R program.

4.7. Candidate Mutation Site Sequence

DNA was extracted from fresh leaves of both the wild-type (WT) and sblob plants using the CTAB method. Fragments encompassing the mutation sites were then amplified via PCR for subsequent sequencing. The PCR primers were designed and employed based on the sequence of 400 bp upstream and downstream of the mutation site, resulting in an amplification fragment of 800 bp to ensure the accuracy of sequencing. All the PCR primers are listed in Table S2. Subsequently, the PCR fragment was constructed using the PMD-18T vector and sequenced by Sangon Biotech Ltd. (Sangon, Shanghai, China).

4.8. Bioinformatics Analysis and Function Prediction of Candidate Genes

A BLAST search was performed using the sblob1 protein sequence as a query in both the Phytozome (https://phytozome.jgi.doe.gov/pz/portal.html, accessed on 1 January 2023) and NCBI (https://www.ncbi.nlm.nih.gov, accessed on 1 January 2023) databases. An E-value threshold of 0.0001 was applied to identify sblob1 proteins across various species. All sblob1 protein sequences were aligned using CLUSTALX 2.1 (http://www.clustal.org/). The phylogenetic tree was constructed using MEGA 7.0 software in addition to the neighbor-joining method.

4.9. 3D Structural Prediction and Molecular Docking

In this study, the 3D structural characterization of two distinct proteins, the mutant protein (sblob1) and its wild-type counterpart (WT), was conducted using the AlphaFold algorithm (https://alphafold.com/, accessed on 15 March 2023) [59].
Then, the PDB files with the highest confidence level exported by AlphaFold were imported into AutoDockTools 1.5.6 software for molecular docking validation. The binding modes between the sblob1 protein and its wild-type counterpart (WT) protein with the substrate (tryptamine) were validated separately. Each docking validation was repeated at least twice. The 3D interaction model was then visualized by PyMOL (http://www.pymol.org/, accessed on 9 August 2022).

4.10. Detection of Tryptamine, Melatonin and Various Hormone Contents

The levels of tryptamine, melatonin and various kinds of plant auxin in both plant types were measured to further elucidate the physiological differences between the mutant plants and their corresponding wild-type counterparts. The flag leaves at the heading stage were selected and harvested as the primary material for hormone analysis. For the purpose of accuracy, the sample for each biological replicate contained at least five flag leaves of individual plants. Each experiment contained at least two biological replicates. The detection of tryptamine, melatonin and auxin was conducted at MetWare (http://www.metware.cn/, accessed on 5 May 2021) based on the AB Sciex QTRAP 6500 LC-MS/MS platform, which ensures accurate and reliable measurements [60]. The components were extracted according to the method described in a previous study [61]. The details of various kinds of auxin are listed in Table S5.

5. Conclusions

In this study, we successfully identified and characterized the sblob mutant in sorghum. The sblob1 gene underlying the sblob mutant was mapped using MutMap, and its function was predicted and investigated. The encoded protein, tryptamine 5-hydroxylase enzyme (SbCYP71A1), belongs to the Cytochrome P450 superfamily. Through bioinformatics analysis and physiology profiling, we gained insights into the role of sblob1 in regulating sorghum biomass yield by influencing the melatonin synthesis pathway. These findings contribute to an understanding of the molecular mechanisms underlying sorghum growth and productivity, with potential implications for crop improvement.

Supplementary Materials

The following supporting information can be downloaded at: https://www.mdpi.com/article/10.3390/ijms25020796/s1.

Author Contributions

Funding acquisition, H.L. and Y.H. (Yuanhuai Han); supervision, Y.H. (Yuanhuai Han) and H.L.; methodology, M.L., Y.L. and Y.Z.; investigation, Q.C.; visualization, Y.H. (Yaoshan Hao) and Y.Q.; writing—review and editing, X.Q. All authors have read and agreed to the published version of the manuscript.

Funding

This work was financially supported by the Basic Research Program of Shanxi Province (20210302124020 and 20210302124503, to Li Mao and Qin Yingying), the Science and Technology Innovation Fund Project of Shanxi Agricultural University (2020BQ78, to Li Mao), Scientific and Technological Innovation Programs of Higher Education Institutions in Shanxi (2021L114, to Qin Yingying).

Institutional Review Board Statement

Not applicable.

Informed Consent Statement

Not applicable.

Data Availability Statement

Data is contained within the article and Supplementary Materials.

Conflicts of Interest

The authors declare no conflicts of interest.

References

  1. Silva, T.N.; Thomas, J.B.; Dahlberg, J.; Rhee, S.Y.; Mortimer, J.C. Progress and challenges in sorghum biotechnology, a multipurpose feedstock for the bioeconomy. J. Exp. Bot. 2021, 73, 646–664. [Google Scholar] [CrossRef] [PubMed]
  2. Ostmeyer, T.J.; Bahuguna, R.N.; Kirkham, M.B.; Bean, S.; Jagadish, S.V.K. Enhancing Sorghum Yield Through Efficient Use of Nitrogen—Challenges and Opportunities. Front. Plant Sci. 2022, 13, 845443. [Google Scholar] [CrossRef]
  3. Bollam, S.; Romana, K.K.; Rayaprolu, L.; Vemula, A.; Das, R.R.; Rathore, A.; Gandham, P.; Chander, G.; Deshpande, S.P.; Gupta, R. Nitrogen Use Efficiency in Sorghum: Exploring Native Variability for Traits Under Variable N-Regimes. Front. Plant Sci. 2021, 12, 643192. [Google Scholar] [CrossRef]
  4. Yang, K.-W.; Chapman, S.; Carpenter, N.; Hammer, G.; McLean, G.; Zheng, B.; Chen, Y.; Delp, E.; Masjedi, A.; Crawford, M.; et al. Integrating crop growth models with remote sensing for predicting biomass yield of sorghum. In Silico Plants 2021, 3, diab001. [Google Scholar] [CrossRef]
  5. Chiluwal, A.; Bheemanahalli, R.; Perumal, R.; Asebedo, A.R.; Bashir, E.; Lamsal, A.; Sebela, D.; Shetty, N.J.; Krishna Jagadish, S.V. Integrated aerial and destructive phenotyping differentiates chilling stress tolerance during early seedling growth in sorghum. Field Crops Res. 2018, 227, 1–10. [Google Scholar] [CrossRef]
  6. Baye, W.; Xie, Q.; Xie, P. Genetic Architecture of Grain Yield-Related Traits in Sorghum and Maize. Int. J. Mol. Sci. 2022, 23, 2405. [Google Scholar] [CrossRef] [PubMed]
  7. Tao, Y.; Luo, H.; Xu, J.; Cruickshank, A.; Zhao, X.; Teng, F.; Hathorn, A.; Wu, X.; Liu, Y.; Shatte, T.; et al. Extensive variation within the pan-genome of cultivated and wild sorghum. Nat. Plants 2021, 7, 766–773. [Google Scholar] [CrossRef]
  8. Zhi, X.; Tao, Y.; Jordan, D.; Borrell, A.; Hunt, C.; Cruickshank, A.; Potgieter, A.; Wu, A.; Hammer, G.; George-Jaeggli, B.; et al. Genetic control of leaf angle in sorghum and its effect on light interception. J. Exp. Bot. 2021, 73, 801–816. [Google Scholar] [CrossRef]
  9. Zhang, B.; Qi, F.; Hu, G.; Yang, Y.; Zhang, L.; Meng, J.; Han, Z.; Zhou, X.; Liu, H.; Ayaad, M.; et al. BSA-seq-based identification of a major additive plant height QTL with an effect equivalent to that of Semi-dwarf 1 in a large rice F2 population. Crop J. 2021, 9, 1428–1437. [Google Scholar] [CrossRef]
  10. Ochar, K.; Su, B.-H.; Zhou, M.-M.; Liu, Z.-X.; Gao, H.-W.; Lamlom, S.F.; Qiu, L.-J. Identification of the genetic locus associated with the crinkled leaf phenotype in a soybean (Glycine max L.) mutant by BSA-Seq technology. J. Integr. Agric. 2022, 21, 3524–3539. [Google Scholar] [CrossRef]
  11. Chen, J.; Zhu, M.; Liu, R.; Zhang, M.; Lv, Y.; Liu, Y.; Xiao, X.; Yuan, J.; Cai, H. BIOMASS YIELD 1 regulates sorghum biomass and grain yield via the shikimate pathway. J. Exp. Bot. 2020, 71, 5506–5520. [Google Scholar] [CrossRef] [PubMed]
  12. Wang, D.; Liu, H.; Li, K.; Li, S.; Tao, Y. Genetic analysis and gene mapping of a narrow leaf mutant in rice (Oryza sativa L.). Chin. Sci. Bull. 2009, 54, 752–758. [Google Scholar] [CrossRef]
  13. Wang, T.; Crawford, M.M.; Tuinstra, M.R. A novel transfer learning framework for sorghum biomass prediction using UAV-based remote sensing data and genetic markers. Front. Plant Sci. 2023, 14, 1138479. [Google Scholar] [CrossRef] [PubMed]
  14. Chai, L.; Feng, B.; Liu, X.; Jiang, L.; Yuan, S.; Zhang, Z.; Li, H.; Zhang, J.; Fernando, D.; Xu, C.; et al. Fine Mapping of a Locus Underlying the Ectopic Blade-Like Outgrowths on Leaf and Screening Its Candidate Genes in Rapeseed (Brassica napus L.). Front. Plant Sci. 2021, 11, 616844. [Google Scholar] [CrossRef]
  15. Xia, W.; Xiao, Z.a.; Cao, P.; Zhang, Y.; Du, K.; Wang, N. Construction of a high-density genetic map and its application for leaf shape QTL mapping in poplar. Planta 2018, 248, 1173–1185. [Google Scholar] [CrossRef] [PubMed]
  16. Prigge, M.J.; Wagner, D.R. The Arabidopsis SERRATE Gene Encodes a Zinc-Finger Protein Required for Normal Shoot Development. Plant Cell 2001, 13, 1263–1280. [Google Scholar] [CrossRef] [PubMed]
  17. Saddic, L.A.; Huvermann, B.r.; Bezhani, S.; Su, Y.; Winter, C.M.; Kwon, C.S.; Collum, R.P.; Wagner, D. The LEAFY target LMI1 is a meristem identity regulator and acts together with LEAFY to regulate expression of CAULIFLOWER. Development 2006, 133, 1673–1682. [Google Scholar] [CrossRef]
  18. Lin, L.; Zhao, Y.; Liu, F.; Chen, Q.; Qi, J. Narrow leaf 1 (NAL1) regulates leaf shape by affecting cell expansion in rice (Oryza sativa L.). Biochem. Biophys. Res. Commun. 2019, 516, 957–962. [Google Scholar] [CrossRef]
  19. Abe, A.; Kosugi, S.; Yoshida, K.; Natsume, S.; Takagi, H.; Kanzaki, H.; Matsumura, H.; Yoshida, K.; Mitsuoka, C.; Tamiru, M.; et al. Genome sequencing reveals agronomically important loci in rice using MutMap. Nat. Biotechnol. 2012, 30, 174–178. [Google Scholar] [CrossRef]
  20. Fekih, R.; Takagi, H.; Tamiru, M.; Abe, A.; Natsume, S.; Yaegashi, H.; Sharma, S.; Sharma, S.; Kanzaki, H.; Matsumura, H.; et al. MutMap+: Genetic mapping and mutant identification without crossing in rice. PLoS ONE 2013, 8, e68529. [Google Scholar] [CrossRef]
  21. Takagi, H.; Tamiru, M.; Abe, A.; Yoshida, K.; Uemura, A.; Yaegashi, H.; Obara, T.; Oikawa, K.; Utsushi, H.; Kanzaki, E.; et al. MutMap accelerates breeding of a salt-tolerant rice cultivar. Nat. Biotechnol. 2015, 33, 445–449. [Google Scholar] [CrossRef]
  22. Zhang, L.; You, R.; Chen, H.; Zhu, J.; Lin, L.; Wei, C. A New SNP in AGPL2, Associated with Floury Endosperm in Rice, Is Identified Using a Modified MutMap Method. Agronomy 2023, 13, 1381. [Google Scholar] [CrossRef]
  23. Lyu, J.; Wang, D.; Duan, P.; Liu, Y.; Huang, K.; Zeng, D.; Zhang, L.; Dong, G.; Li, Y.; Xu, R.; et al. Control of Grain Size and Weight by the GSK2-LARGE1/OML4 Pathway in Rice. Plant Cell 2020, 32, 1905–1918. [Google Scholar] [CrossRef] [PubMed]
  24. Zegeye, W.A.; Zhang, Y.; Cao, L.; Cheng, S. Whole Genome Resequencing from Bulked Populations as a Rapid QTL and Gene Identification Method in Rice. Int. J. Mol. Sci. 2018, 19, 4000. [Google Scholar] [CrossRef]
  25. Liu, D.; Zhao, H.; Xiao, Y.; Zhang, G.; Cao, S.; Yin, W.; Qian, Y.; Yin, Y.; Zhang, J.; Chen, S.; et al. A cryptic inhibitor of cytokinin phosphorelay controls rice grain size. Mol. Plant 2022, 15, 293–307. [Google Scholar] [CrossRef]
  26. Zhu, X.; Pan, Y.; Liu, Z.; Liu, Y.; Zhong, D.; Duan, Z.; Tian, Z.; Zhu, B.; Zhou, G. Mutation of YL Results in a Yellow Leaf with Chloroplast RNA Editing Defect in Soybean. Int. J. Mol. Sci. 2020, 21, 4275. [Google Scholar] [CrossRef] [PubMed]
  27. Zhang, K.; Han, M.; Liu, Y.; Lin, X.; Liu, X.; Zhu, H.; He, Y.; Zhang, Q.; Liu, J. Whole-genome resequencing from bulked-segregant analysis reveals gene set based association analyses for the Vibrio anguillarum resistance of turbot (Scophthalmus maximus). Fish Shellfish Immunol. 2019, 88, 76–83. [Google Scholar] [CrossRef] [PubMed]
  28. Shen, S.; Xu, S.; Wang, M.; Ma, T.; Chen, N.; Wang, J.; Zheng, H.; Yang, L.; Zou, D.; Xin, W.; et al. BSA-Seq for the Identification of Major Genes for EPN in Rice. Int. J. Mol. Sci. 2023, 24, 14838. [Google Scholar] [CrossRef]
  29. Schneeberger, K. Using next-generation sequencing to isolate mutant genes from forward genetic screens. Nat. Rev. Genet. 2014, 15, 662–676. [Google Scholar] [CrossRef]
  30. Bhowal, B.; Bhattacharjee, A.; Goswami, K.; Sanan-Mishra, N.; Singla-Pareek, S.L.; Kaur, C.; Sopory, S. Serotonin and Melatonin Biosynthesis in Plants: Genome-Wide Identification of the Genes and Their Expression Reveal a Conserved Role in Stress and Development. Int. J. Mol. Sci. 2021, 22, 11034. [Google Scholar] [CrossRef]
  31. Shekhar, S.; Prasad, A.S.; Banjare, K.; Kaushik, A.; Mannade, A.K.; Dubey, M.; Patil, A.; Premi, V.; Vishwakarma, A.K.; Sao, A.; et al. LMT(db): A comprehensive transcriptome database for climate-resilient, nutritionally rich little millet (Panicum sumatrense). Front. Plant Sci. 2023, 14, 1106104. [Google Scholar] [CrossRef]
  32. Song, Z.; Zhang, L.; Wang, Y.; Li, H.; Li, S.; Zhao, H.; Zhang, H. Constitutive Expression of miR408 Improves Biomass and Seed Yield in Arabidopsis. Front. Plant Sci. 2017, 8, 2114. [Google Scholar] [CrossRef] [PubMed]
  33. Borrell, A.K.; Mullet, J.E.; George-Jaeggli, B.; van Oosterom, E.J.; Hammer, G.L.; Klein, P.E.; Jordan, D.R. Drought adaptation of stay-green sorghum is associated with canopy development, leaf anatomy, root growth, and water uptake. J. Exp. Bot. 2014, 65, 6251–6263. [Google Scholar] [CrossRef] [PubMed]
  34. Borrell, A.K.; van Oosterom, E.J.; Mullet, J.E.; George-Jaeggli, B.; Jordan, D.R.; Klein, P.E.; Hammer, G.L. Stay-green alleles individually enhance grain yield in sorghum under drought by modifying canopy development and water uptake patterns. New Phytol. 2014, 203, 817–830. [Google Scholar] [CrossRef] [PubMed]
  35. Mantilla Perez, M.B.; Zhao, J.; Yin, Y.; Hu, J.; Salas Fernandez, M.G. Association mapping of brassinosteroid candidate genes and plant architecture in a diverse panel of Sorghum bicolor. Theor. Appl. Genet. 2014, 127, 2645–2662. [Google Scholar] [CrossRef]
  36. Kersey, P.J. Plant genome sequences: Past, present, future. Curr. Opin. Plant Biol. 2019, 48, 1–8. [Google Scholar] [CrossRef] [PubMed]
  37. Sun, Y.; Shang, L.; Zhu, Q.-H.; Fan, L.; Guo, L. Twenty years of plant genome sequencing: Achievements and challenges. Trends Plant Sci. 2022, 27, 391–401. [Google Scholar] [CrossRef]
  38. Huo, H.; Henry, I.M.; Coppoolse, E.R.; Verhoef-Post, M.; Schut, J.W.; de Rooij, H.; Vogelaar, A.; Joosen, R.V.; Woudenberg, L.; Comai, L.; et al. Rapid identification of lettuce seed germination mutants by bulked segregant analysis and whole genome sequencing. Plant J. 2016, 88, 345–360. [Google Scholar] [CrossRef]
  39. Wang, H.; Tang, S.; Zhi, H.; Xing, L.; Zhang, H.; Tang, C.; Wang, E.; Zhao, M.; Jia, G.; Feng, B.; et al. The boron transporter SiBOR1 functions in cell wall integrity, cellular homeostasis, and panicle development in foxtail millet. Crop J. 2022, 10, 342–353. [Google Scholar] [CrossRef]
  40. Cao, Z.Z.; Lin, X.Y.; Yang, Y.J.; Guan, M.Y.; Xu, P.; Chen, M.X. Gene identification and transcriptome analysis of low cadmium accumulation rice mutant (lcd1) in response to cadmium stress using MutMap and RNA-seq. BMC Plant Biol. 2019, 19, 250. [Google Scholar] [CrossRef]
  41. Jiao, Y.; Burow, G.; Gladman, N.; Acosta-Martinez, V.; Chen, J.; Burke, J.; Ware, D.; Xin, Z. Efficient Identification of Causal Mutations through Sequencing of Bulked F2 from Two Allelic Bloomless Mutants of Sorghum bicolor. Front. Plant Sci. 2018, 8, 2267. [Google Scholar] [CrossRef] [PubMed]
  42. Zhang, S.; Abdelghany, A.M.; Azam, M.; Qi, J.; Li, J.; Feng, Y.; Liu, Y.; Feng, H.; Ma, C.; Gebregziabher, B.S.; et al. Mining candidate genes underlying seed oil content using BSA-seq in soybean. Ind. Crops Prod. 2023, 194, 116308. [Google Scholar] [CrossRef]
  43. Sun, C.; Liu, L.; Wang, L.; Li, B.; Jin, C.; Lin, X. Melatonin: A master regulator of plant development and stress responses. J. Integr. Plant Biol. 2021, 63, 126–145. [Google Scholar] [CrossRef] [PubMed]
  44. Zhang, Z.; Zhang, Y. Melatonin in plants: What we know and what we don’t. Food Qual. Saf. 2021, 5, fyab009. [Google Scholar] [CrossRef]
  45. Byeon, Y.; Back, K. An increase in melatonin in transgenic rice causes pleiotropic phenotypes, including enhanced seedling growth, delayed flowering, and low grain yield. J. Pineal Res. 2014, 56, 408–414. [Google Scholar] [CrossRef] [PubMed]
  46. Heydarnajad Giglou, R.; Torabi Giglou, M.; Esmaeilpour, B.; Padash, A.; Ghahremanzadeh, S.; Sobhanizade, A.; Hatami, M. Exogenous melatonin differentially affects biomass, total carbohydrates, and essential oil production in peppermint upon simultaneous exposure to chitosan-coated Fe3O4 NPs. S. Afr. J. Bot. 2023, 163, 135–144. [Google Scholar] [CrossRef]
  47. Agathokleous, E.; Zhou, B.; Xu, J.; Ioannou, A.; Feng, Z.; Saitanis, C.J.; Frei, M.; Calabrese, E.J.; Fotopoulos, V. Exogenous application of melatonin to plants, algae, and harvested products to sustain agricultural productivity and enhance nutritional and nutraceutical value: A meta-analysis. Environ. Res. 2021, 200, 111746. [Google Scholar] [CrossRef]
  48. Huang, Y.-H.; Liu, S.-J.; Yuan, S.; Guan, C.; Tian, D.-Y.; Cui, X.; Zhang, Y.-W.; Yang, F.-Y. Overexpression of ovine AANAT and HIOMT genes in switchgrass leads to improved growth performance and salt-tolerance. Sci. Rep. 2017, 7, 12212. [Google Scholar] [CrossRef]
  49. Ke, S.; Liu, S.; Luan, X.; Xie, X.M.; Hsieh, T.F.; Zhang, X.Q. Mutation in a putative glycosyltransferase-like gene causes programmed cell death and early leaf senescence in rice. Rice 2019, 12, 7. [Google Scholar] [CrossRef]
  50. Lee, K.; Choi, G.H.; Back, K. Inhibition of Rice Serotonin N-Acetyltransferases by MG149 Decreased Melatonin Synthesis in Rice Seedlings. Biomolecules 2021, 11, 658. [Google Scholar] [CrossRef]
  51. Mannino, G.; Pernici, C.; Serio, G.; Gentile, C.; Bertea, C.M. Melatonin and Phytomelatonin: Chemistry, Biosynthesis, Metabolism, Distribution and Bioactivity in Plants and Animals—An Overview. Int. J. Mol. Sci. 2021, 22, 9996. [Google Scholar] [CrossRef] [PubMed]
  52. Jiao, Y.; Nigam, D.; Barry, K.; Daum, C.; Yoshinaga, Y.; Lipzen, A.; Khan, A.; Parasa, S.-P.; Wei, S.; Lu, Z.; et al. A large sequenced mutant library–valuable reverse genetic resource that covers 98% of sorghum genes. Plant J. 2023. Online ahead of print. [Google Scholar] [CrossRef]
  53. Jiao, Y.; Burke, J.; Chopra, R.; Burow, G.; Chen, J.; Wang, B.; Hayes, C.; Emendack, Y.; Ware, D.; Xin, Z. A Sorghum Mutant Resource as an Efficient Platform for Gene Discovery in Grasses. Plant Cell 2016, 28, 1551–1562. [Google Scholar] [CrossRef]
  54. Wang, Y.; Wang, J.; Chen, L.; Meng, X.; Zhen, X.; Liang, Y.; Han, Y.; Li, H.; Zhang, B. Identification and function analysis of yellow-leaf mutant (YX-yl) of broomcorn millet. BMC Plant Biol. 2022, 22, 463. [Google Scholar] [CrossRef] [PubMed]
  55. Chai, L.; Li, H.; Zhang, J.; Wu, L.; Zheng, B.; Cui, C.; Jiang, J.; Zuo, S.; Jiang, L. Rapid Identification of a Genomic Region Conferring Dwarfism in Rapeseed (Brassica napus L.) YA2016-12. Agronomy 2019, 9, 129. [Google Scholar] [CrossRef]
  56. Li, H.; Durbin, R. Fast and accurate short read alignment with Burrows-Wheeler transform. Bioinformatics 2009, 25, 1754–1760. [Google Scholar] [CrossRef] [PubMed]
  57. Cingolani, P.; Platts, A.; Wang, L.L.; Coon, M.; Nguyen, T.; Wang, L.; Land, S.J.; Lu, X.; Ruden, D.M. A program for annotating and predicting the effects of single nucleotide polymorphisms, SnpEff: SNPs in the genome of Drosophila melanogaster strain w1118; iso-2; iso-3. Fly 2012, 6, 80–92. [Google Scholar] [CrossRef]
  58. Hill, J.T.; Demarest, B.L.; Bisgrove, B.W.; Gorsi, B.; Su, Y.C.; Yost, H.J. MMAPPR: Mutation mapping analysis pipeline for pooled RNA-seq. Genome Res. 2013, 23, 687–697. [Google Scholar] [CrossRef]
  59. Jumper, J.; Evans, R.; Pritzel, A.; Green, T.; Figurnov, M.; Ronneberger, O.; Tunyasuvunakool, K.; Bates, R.; Žídek, A.; Potapenko, A.; et al. Highly accurate protein structure prediction with AlphaFold. Nature 2021, 596, 583–589. [Google Scholar] [CrossRef]
  60. Xu, X.; Murphy, L.A. Fast and sensitive LC-MS/MS method for quantification of cannabinoids and their metabolites in plasma of cattle fed hemp. J. Sep. Sci. 2023, 2300630. [Google Scholar] [CrossRef]
  61. Li, Y.; Zhou, C.; Yan, X.; Zhang, J.; Xu, J. Simultaneous analysis of ten phytohormones in Sargassum horneri by high-performance liquid chromatography with electrospray ionization tandem mass spectrometry. J. Sep. Sci. 2016, 39, 1804–1813. [Google Scholar] [CrossRef]
Figure 1. Assessment of phenotypic characteristics and agronomic traits of WT and sblob plants. (A) The phenotypes of WT and sblob at the harvest stage. (B) Flag leaf phenotypes of WT and sblob at the heading stage. (C) The grain yield per panicle and grain phenotype of WT and sblob. (D) Presentation of comparative analysis of differences in plant height, panicle length, flag leaf length, flag leaf width, grain weight per panicle, and 100-grain weight between WT and sblob. All values are represented as means ± SD (n = 3). ** Indicates a significant difference between groups of 0.01, while ns indicates no significant difference.
Ijms 25 00796 g001
Figure 2. Microscopic examination of leaf anatomical characteristics and photosynthetic efficiency analysis of both WT and sblob. (A) Paraffin section observation of a leaf from WT and one from sblob at the shooting stage. The scale bar represents 50 μm. (B) Leaf thickness of WT and sblob at the shooting stage. (C) Chlorophyll content of sblob and WT plants at the shooting and heading stages. (D) Cell size analysis of leaf from WT and sblob at the shooting stage. (E) Photosynthesis efficiency analyses of WT and sblob at the shooting and heading stages. * And ** indicate significant differences between groups of 0.05 and 0.01, respectively, while ns indicates no significant difference.
Ijms 25 00796 g002
Figure 3. Mapping of sblob1 gene. (A) Presentation of Euclidean distance (ED) correlation values across sorghum chromosome 3. Each blue dot represents the ED value of an individual single-nucleotide polymorphism (SNP) locus, while the red dashed line represents the significant correlation threshold. The red arrow indicates the identified candidate SNP locus. (B) Illustration of sblob1 structure and its mutation site. The ATG and TGA were at the left and right ends, respectively, representing the start and stop codons. Exons are depicted by black boxes; introns are represented by lines. The red line and text in the second exon specify the position and nature of the base mutation in the sblob mutant. (C) The DNA sequence at the candidate mutant site in sblob and WT plants. The red arrow highlights the mutant site. (D) Analysis of conservation in the amino acid substitution region and its frequency among homologous plant genes. The red arrow indicates the position of the amino acid substitution in the sblob mutant.
Ijms 25 00796 g003
Figure 4. Phylogenetic analysis of and physiological pathways involved in sblob1. (A) Phylogenetic analysis of the candidate gene and its homologs established through protein sequencing. The construction of the phylogenetic tree employed the neighbor-joining (NJ) algorithm by using MEGA 7.0 Software. (B) sblob1 is involved in the biological process of serotonin/melatonin synthesis.
Ijms 25 00796 g004
Figure 5. Three-dimensional structure analysis and molecular docking analysis of sblob1 protein and its WT counterpart. (A) Three-dimensional structure of WT (SbCYP71A1) protein. (B) Three-dimensional structure of sblob1 protein. (C) The binding pattern of WT (SbCYP71A1) protein and tryptamine. (D) The binding pattern of sblob1 protein and tryptamine. The brownish-red molecule is tryptamine.
Ijms 25 00796 g005
Figure 6. Melatonin, tryptamine and hormone content determination. (A) Melatonin content of sblob and WT. (B) Tryptamine content of sblob and WT. (C) Auxin content of sblob and WT. ** and *** indicate a significant difference between groups of 0.01 and 0.001, respectively, while ns indicates no significant difference.
Ijms 25 00796 g006
Table 1. Chi-square analysis of trait segregation in the F2 population.
WTsblobTotalχ2 (df = 1)
actual118294412
expected1033094122.63
Table 2. Summary of the sequencing data.
Clean ReadsClean Bases (bp)Clean Q30 (%)Mapped Ratio (%)Proper Ratio (%)Average Depths
WT190,778,00828,728,254,22294.4999.1295.6844.16
sblob177,743,20626,767,472,95494.7598.4995.1340.98
Table 3. The physical positions and numbers of genes in the 9 identified candidate genomic regions.
RegionStart Position (Mb)End Position (Mb)Region SizeTranscriptsGene Number
chr1057.9146158.1499690.2353593024
chr11.1541111.349520.1954094639
chr11.4097621.5325920.122834930
chr11.6236811.6913370.0676561514
chr11.8128011.9386550.1258543831
chr14.0687544.4982180.4294646352
chr158.30668259.2171580.9104768765
chr165.02089165.1641250.1432341615
chr16.5040786.6394190.1353412416
chr167.29556867.7227910.4272235749
chr172.06155772.6553870.593838567
chr18.5670858.8980330.3309486329
chr24.6680265.1498030.4817777659
chr25.4000135.4876650.08765275
chr25.6647285.7935080.128782111
chr271.66321272.6481820.98497190116
chr30.7037081.3237680.6200610485
chr370.88292272.6786831.795761285199
chr460.55124560.8662050.314964529
chr623.89005224.6179710.72791900
chr659.23337659.3380640.1046882220
chr858.30666658.3392770.03261155
total 8.9968021328960
Disclaimer/Publisher’s Note: The statements, opinions and data contained in all publications are solely those of the individual author(s) and contributor(s) and not of MDPI and/or the editor(s). MDPI and/or the editor(s) disclaim responsibility for any injury to people or property resulting from any ideas, methods, instructions or products referred to in the content.

