Article

Marker-Assisted Selection of Jacalin-Related Lectin Genes OsJRL45 and OsJRL40 Derived from Sea Rice 86 Enhances Salt Tolerance in Rice

Hunan Province Key Laboratory of Crop Sterile Germplasm Resource Innovation and Application, College of Life Science, Hunan Normal University, Changsha 410081, China
*
Authors to whom correspondence should be addressed.
Int. J. Mol. Sci. 2024, 25(20), 10912; https://doi.org/10.3390/ijms252010912
Submission received: 14 September 2024 / Revised: 2 October 2024 / Accepted: 8 October 2024 / Published: 10 October 2024
(This article belongs to the Special Issue Abiotic Stress Tolerance and Genetic Diversity in Plants, 2nd Edition)

Abstract

:
Soil salinization limits rice growth and is an important restriction on grain yield. Jacalin-related lectins are involved in multiple stress responses, but their role in salt stress responses and use as molecular markers for salt tolerance remain poorly understood. Salt stress treatments and RT-qPCR analyses of Sea Rice 86 (SR86), 9311, and Nipponbare (Nip) showed that OsJRL45 and OsJRL40 enhanced tolerance of salt stress in SR86. Molecular markers based on sequence differences in SR86 and the salt-sensitive variety, 9311, in the intergenic region between OsJRL45 and OsJRL40 were validated in recombinant inbred lines derived from SR86 and 9311, hybrid populations, and common rice varieties. Yeast two-hybrid and bimolecular fluorescence complementation demonstrated that OsJRL45 and OsJRL40 interacted. Co-transformation of Nip with OsJRL45 and OsJRL40 derived from SR86 had no effect on the mature phenotype in T2 plants; however, salt stress at the three-leaf stage led to significant increases in CAT, POD, SOD, and Pro contents, but reduced MDA content in transgenic plants. Transcriptomic analysis identified 834 differentially expressed genes in transgenic plants under salt stress. GO and KEGG enrichment analyses indicated that metabolic pathways related to antioxidant responses and osmotic balance were crucial for salt-stress tolerance. Thus, molecular markers based on nucleotide differences in OsJRL45 and OsJRL40 provide a novel method for identifying salt-tolerant rice varieties.

1. Introduction

Rice (Oryza sativa L.) is one of the most important food crops globally, with over half of the world’s population relying on it as a staple food [1]. The demand for food consumption is rising due to the rapid increase in the global population, although the area of land suitable for arable production decreases year by year due to the increase in salinized land [2]. Addressing the gap between this increased demand due to population growth and the reduction in arable land presents a significant challenge for grain production in China [3,4]. Rice is a salt-sensitive crop that, when subjected to salt stress, responds at the morphological, cellular, and molecular levels [5] in ways that affect essential processes, including photosynthesis and metabolism, leading to growth inhibition or even death [6,7]. At the molecular level, salt stress leads to ion toxicity, osmotic stress, and oxidative stress [8]. Ion toxicity under salt stress is usually due to the excessive accumulation of Na+ and Cl, which causes Na+ to accumulate in the cytoplasm. This leads to membrane depolarization and K+ leakage from the cell, ultimately resulting in plant death [9]. OsHAK1, a potassium transporter, promotes K+ uptake under salt stress and increases the K+/Na+ ratio, making this protein crucial for enhanced salt tolerance in rice [10,11,12]. Many other genes related to ion transport and the regulation of salt tolerance have been identified, including OsHKT1;5 [13] and OsAKT2 [14]. To cope with the osmotic stress caused by salt stress, plants produce large amounts of osmotic regulators, including proline, glycerol, sugars, and their derivatives [15]. Salt stress-induced oxidative stress increases the activity of antioxidant enzymes such as catalase (CAT), peroxidase (POD), and superoxide dismutase (SOD), as well as the synthesis of some non-enzymatic antioxidants [16]. The salt tolerance mechanism is thus a complex regulatory network composed of multiple metabolic pathways.
Increased soil salinity necessitates the development of novel methods for improving the tolerance of existing rice varieties to salt stress, as well as the use of conventional breeding techniques, such as backcrossing, recurrent selection, and use of mutations, to develop new varieties. Such approaches have their limitations, as, in addition to the desired genes, unwanted genes may also be passed on to future generations [17]. As genetic diversity serves as the raw material for breeding programs, the generation of segregating populations (F2 progeny or recombinant inbred lines (RILs)) followed by genetic analysis using a conventional genetic mapping approach can identify important agronomic traits and genes under controlled conditions [18,19,20]. Such populations contain a large number of genetic variants, enabling advances in crop improvement and the genetic analysis of complex traits, as well as the development of genetic markers to detect quantitative trait loci and isolate the genes responsible [21]. Marker-assisted selection (MAS) is an important molecular tool for rice breeding that minimizes the number of backcross generations required [22]. Markers are used to select indirectly the genetic determinant or determinants of a trait of interest, such as abiotic stress tolerance [23]. The development and availability of markers for use with plant lines carrying genomic regions known to participate in the expression of target traits has made it possible to use MAS to identify major genes controlling such traits [24].
Lectins are proteins that are found in a wide variety of species, including microorganisms, plants, and animals [25]. In plants, lectins are found in vegetative organs such as roots, stems, and leaves [26]. HvHorcH is a member of the jacalin-related lectin (JRL) family that is involved in the physiological response of barley (Hordeum vulgare) roots to salt stress and also enhances salt tolerance [27]. Abscisic acid (ABA) biosynthesis is inhibited in transgenic Arabidopsis (Arabidopsis thaliana) plants expressing PeJRL (Populus euphratica), thereby reducing the production of ABA-induced ROS and oxidative damage during salt stress [28]. OsJRL, a rice protein, is a JRL belonging to the mannose-binding lectin superfamily. It is up-regulated by OsJRL overexpression and increases the expression of stress-related genes under salt stress, enhancing salt tolerance [29]. Lectins are indirectly involved in regulating chlorophyll content and also reduce membrane damage and electrolyte leakage, thus mitigating the effects of salt stress [30]. The expression of SIT1, a lectin-encoding gene in rice, is up-regulated under salt stress; SIT1 participates in the MPK3/MPK6 pathway, which increases ethylene synthesis and ROS accumulation [31], and also plays a role in Na+ efflux by regulating the salt overly sensitive (SOS) pathway [32]. Under salt stress, rice plants overexpressing OsSalT, which encodes a mannose-binding protein, have significantly lower Na+ content than wild-type plants, indicating that this gene plays an important part in the response to salt stress [33]. OsJRL45 enhances the antioxidant capacity of rice plants and promotes the maintenance of Na+-K+ homeostasis under salt stress; OsJRL45-overexpression lines show higher salt tolerance, as well as significantly increased grain-filling rates and thousand-grain weights [34]. OsJRL40 enhances antioxidant enzyme activity and maintains Na+-K+ homeostasis under salt stress, as well as regulating salt tolerance in rice by controlling the expression of Na+-K+ transporters, salt-response transcription factors, and other salt response-related proteins [35]. Lectins thus play key roles in regulating stress response pathways during salt stress; however, their specific mode of action in response to salt stress requires further study.
The Sea Rice 86 (SR86) cultivar was developed over years of selection and offers many advantages, including high salt tolerance [36]. The identification of OsNACL35, a NAC (NAM, ATAF1/2, and CUC2) transcription factor, in SR86 suggests that salt tolerance may result from an enhanced H2S yield [37]. Microbial metabolomic analysis of rhizosphere bacteria associated with SR86 seedlings cultivated under different levels of salinity revealed that salt stress significantly alters the diversity of rhizosphere bacteria and rhizosphere metabolites, thereby improving salt tolerance [38]. The OsJRL45 and OsJRL40 genes from SR86 enhance the antioxidant capacity of rice plants and promote the maintenance of Na+-K+ homeostasis under salt stress [34,35,39]. Not all of the genes related to salt tolerance in SR86 have been identified to date, and most of those that have need to be expressed under stress induction. The use of molecular markers, linkage analysis, and mapping techniques will enable the identification of more genes involved in salt tolerance in this cultivar.
Our previous study hybridized the salt-tolerant rice variety SR86 with a standard cultivar Nip and used bulked segregant analysis (BSA) and genetic mapping to identify salt-tolerant and salt-sensitive populations in the segregating hybrids. We then screened these populations for genes related to salt stress and identified two JRL genes, OsJRL45 and OsJRL40 [39]. We also verified the physiological and biochemical functions of OsJRL45 and OsJRL40 in salt tolerance in rice [34,35]. In the current study, to better understand the roles played by OsJRL45 and OsJRL40 in salt tolerance, and to develop a novel method for mapping salt tolerance in rice, we co-transformed the Nip cultivar with OsJRL45 and OsJRL40 from SR86, and also constructed a segregating population derived from SR86 and 9311, a salt-sensitive variety. We screened the hybrid population for salt-tolerant plants by examining the phenotype under salt stress. We identified nucleotide differences associated with salt tolerance in the segregating population and used these to develop molecular markers for salt tolerance. This method improved the efficiency of screening for salt tolerance and shortened the breeding process of salt-tolerant rice, promoting the rapid development of new salt-tolerant rice varieties.

2. Results

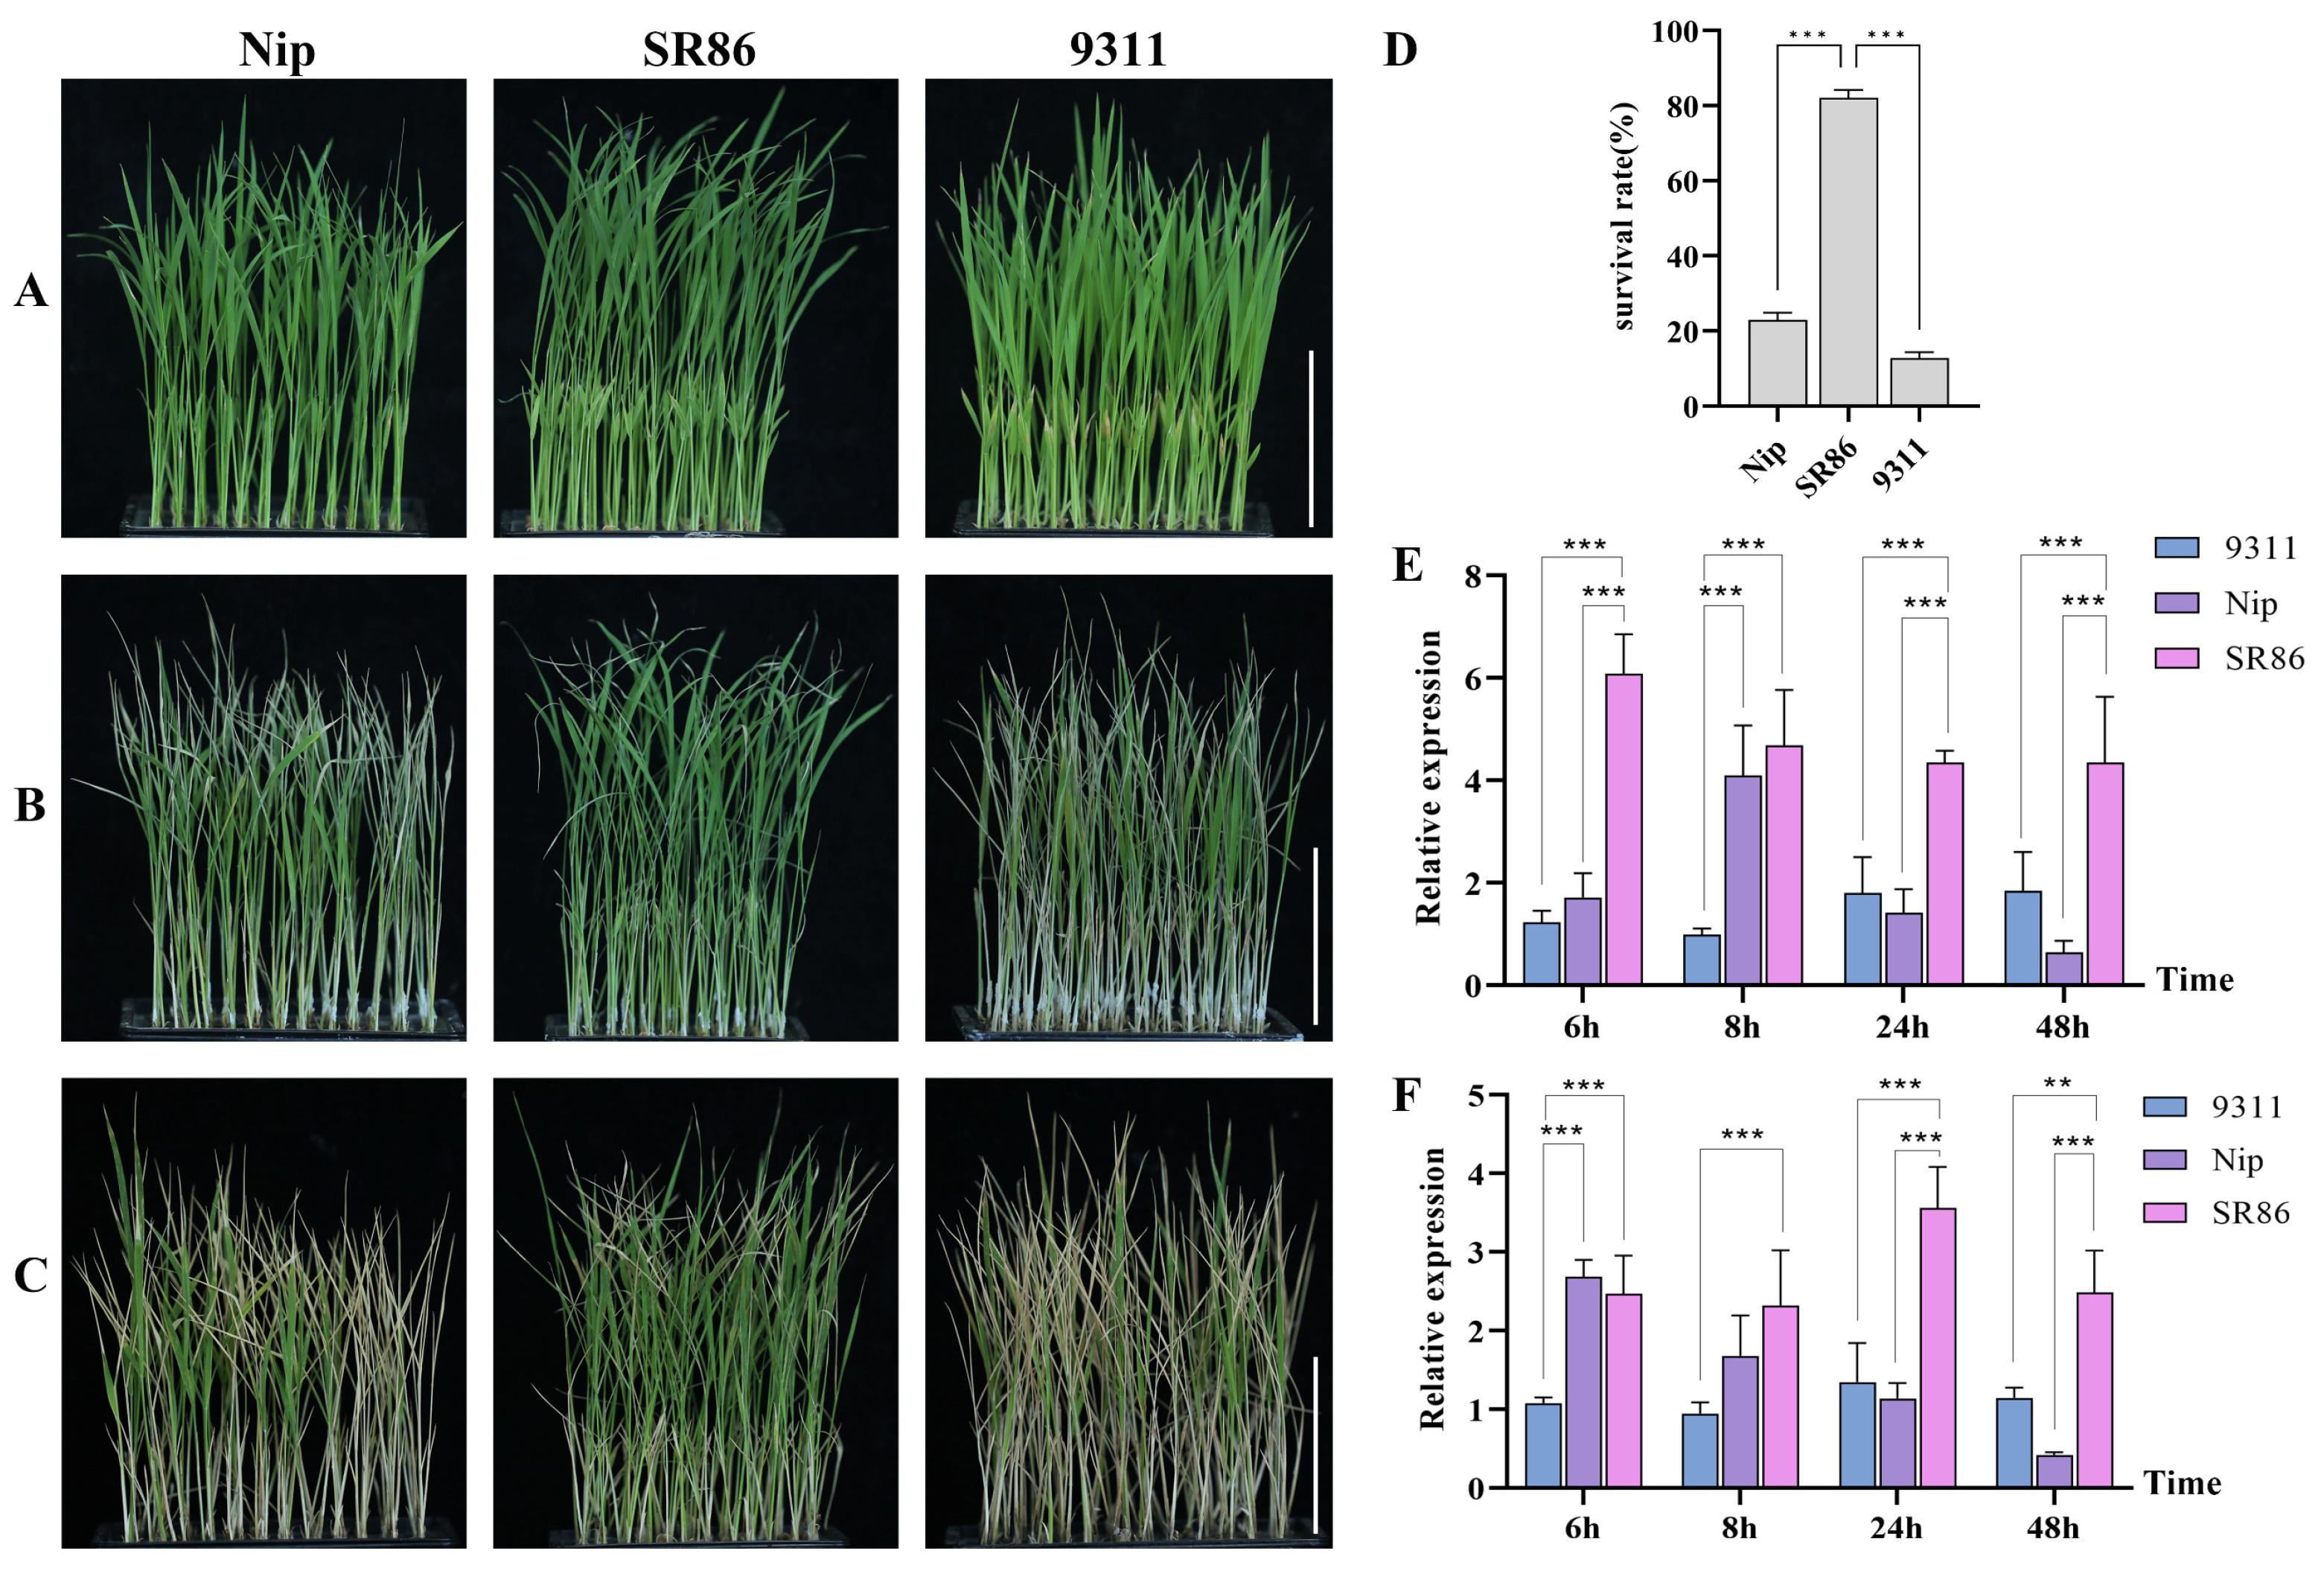
2.1. Analysis of OsJRL45 and OsJRL40 Expression under Salt Stress

To analyze the expression of OsJRL45 and OsJRL40 in SR86, 9311, and Nip under salt stress, seedlings at the three-leaf stage were treated with 9‰ NaCl for 4 days, followed by a 4-day recovery period (Figure 1A–C). The survival rates of 9311 and Nip were around 20%, while the survival rate of SR86 was 80%, indicating that this variety had significantly higher salt tolerance than either 9311 or Nip (Figure 1D). RT-qPCR analysis of OsJRL45 and OsJRL40 expression in SR86, 9311, and Nip after 6, 8, 24, and 48 h of salt stress revealed that both genes were expressed at significantly higher levels in SR86 than in 9311 and Nip (Figure 1E,F). These results suggested that OsJRL45 and OsJRL40 enhanced salt stress tolerance in SR86.

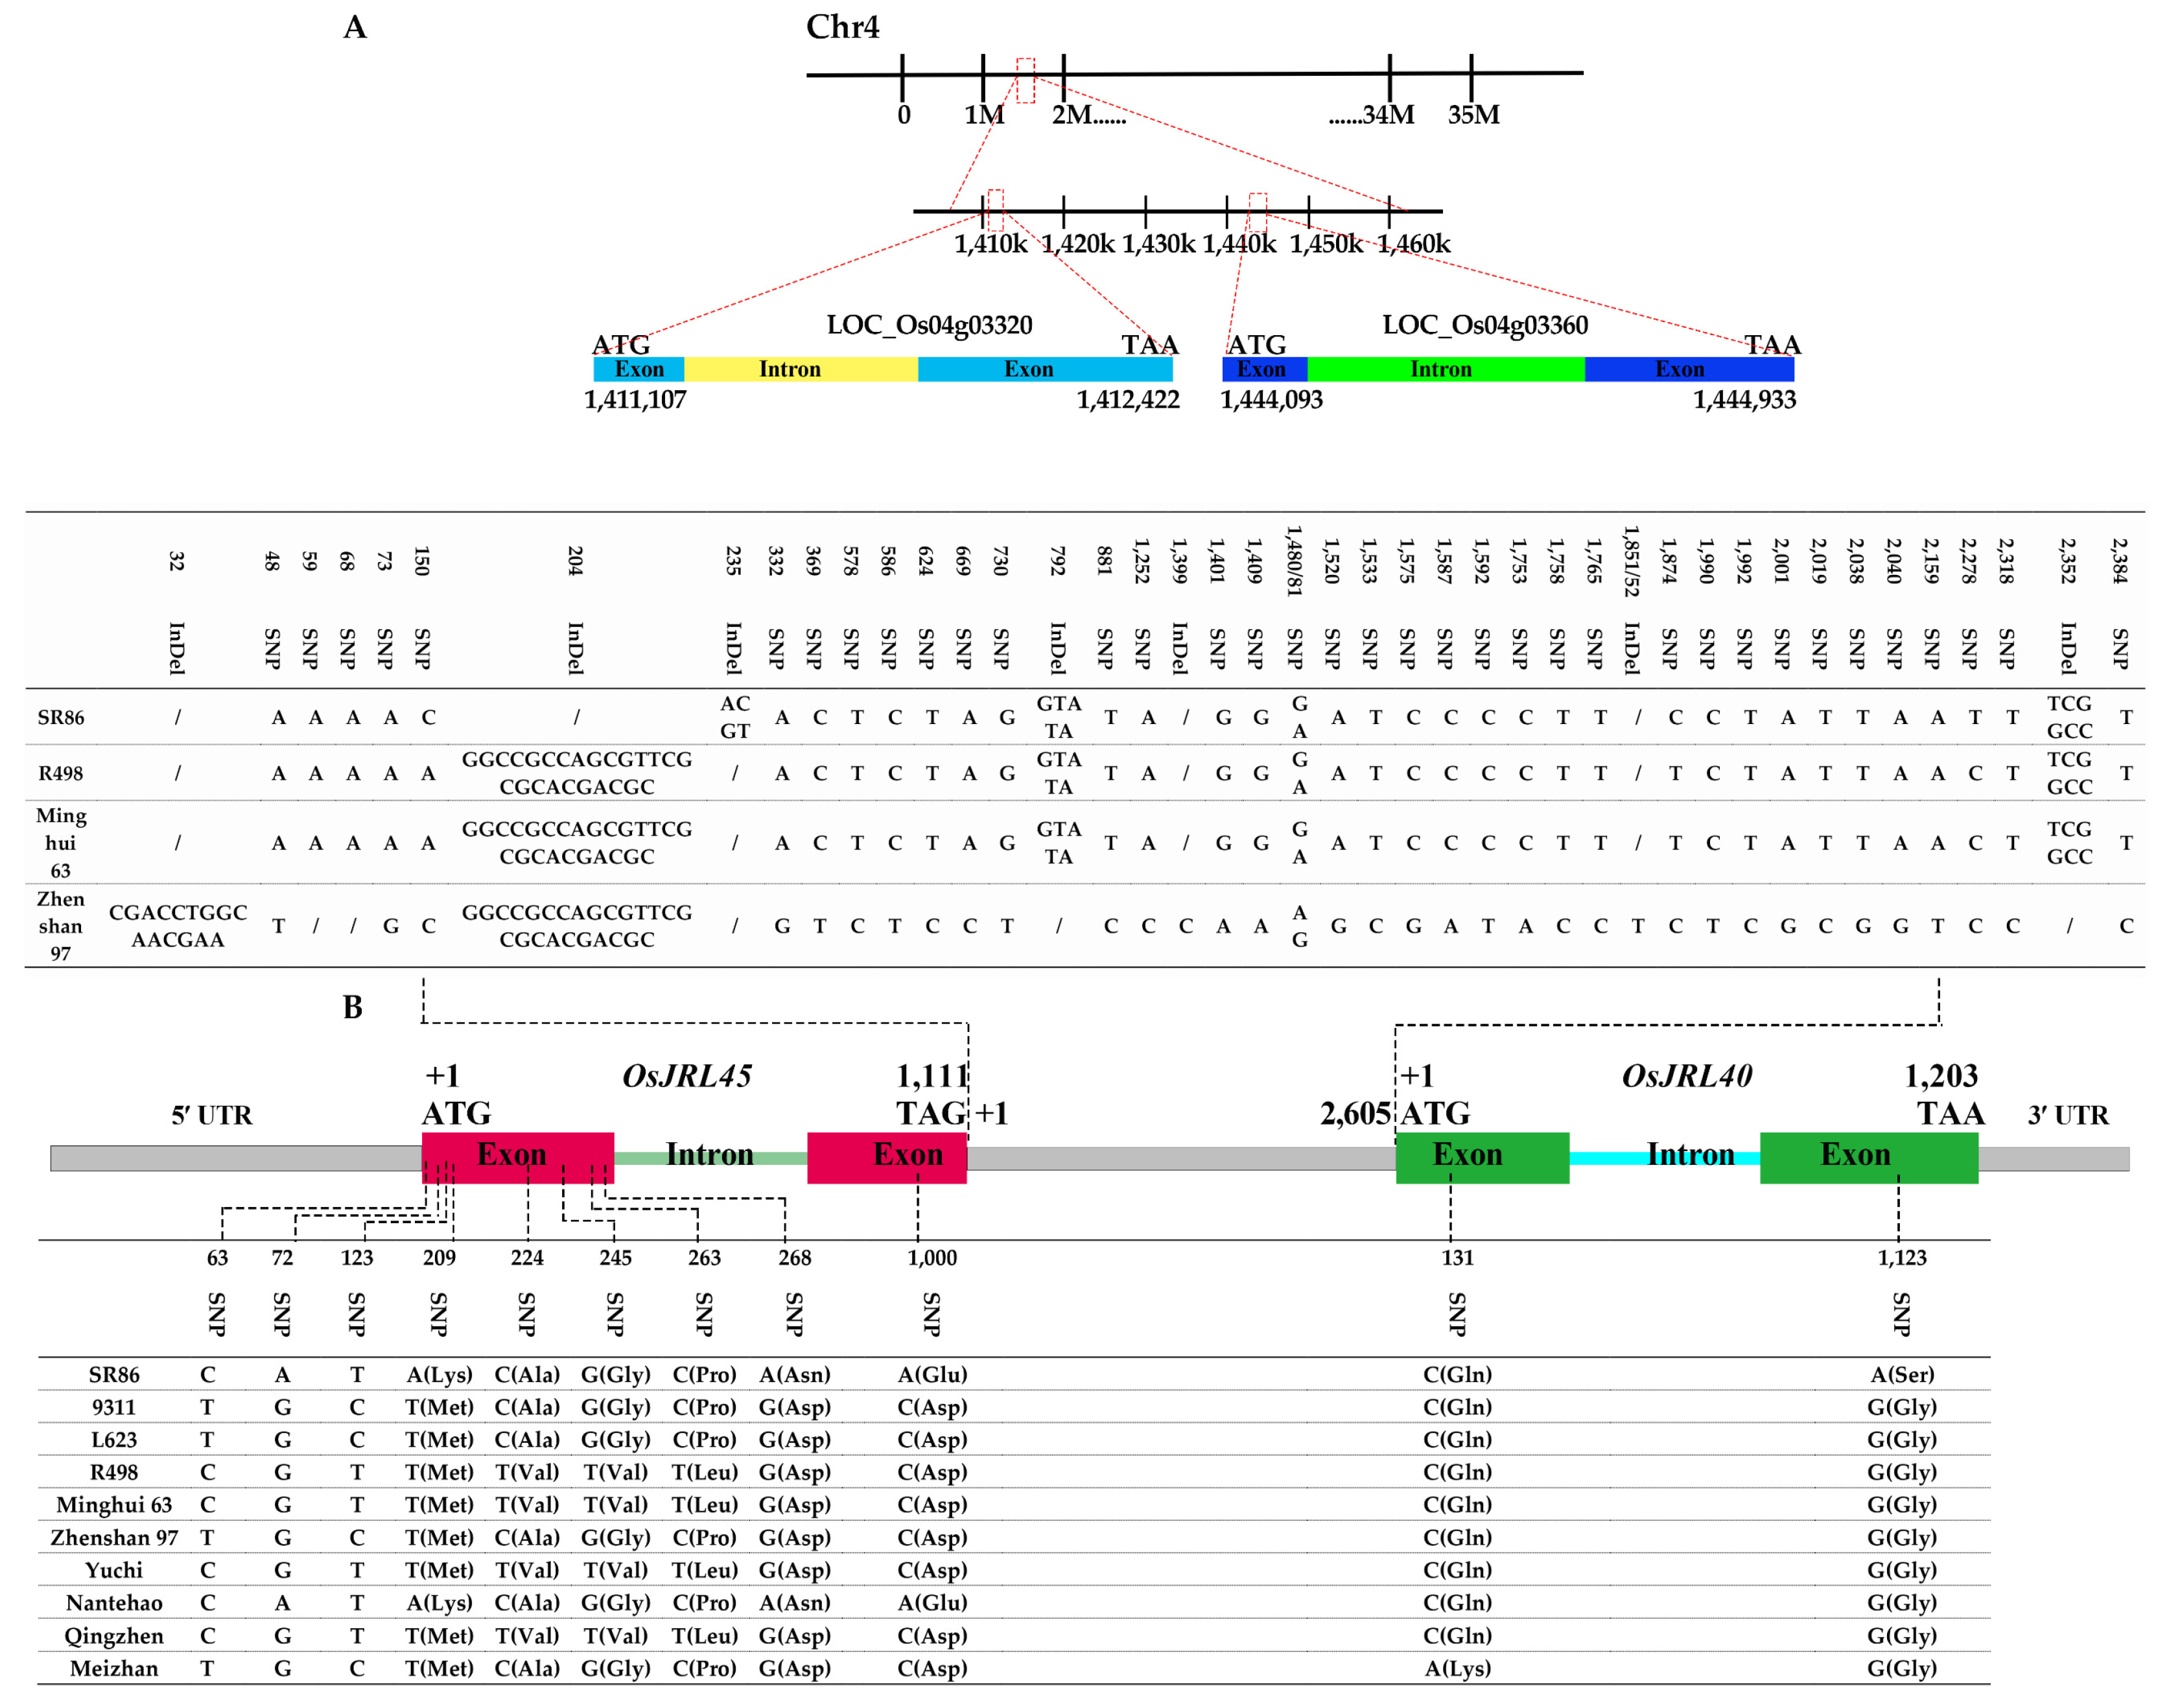
2.2. Analysis of Sequence Variation in OsJRL45 and OsJRL40

OsJRL45 and OsJRL40 are located on rice chromosome 4 and are thus likely to interact with each other (Figure 2A,B). An analysis of sequence variation between SR86 and other rice cultivars revealed a correlation with salt tolerance. The OsJRL45 and OsJRL40 sequences from Shuhui 498 (R498) were obtained from the NCBI (https://www.ncbi.nlm.nih.gov/, accessed on 29 June 2022). Both genes contained two exons and one intron (Figure 2). Primers were designed to amplify the OsJRL45 and OsJRL40 sequences from the rice cultivars SR86, 9311, L623, R498, Minghui63, Zhenshan97, Yu Chi, Nantehao, Qingzhen, and Meizhan, using NCBI R498 as the reference sequence.
Sequence alignment showed that exon 1 of OsJRL45 contained eight single nucleotide polymorphisms (SNPs). Amino acid alignment revealed that three SNPs (located 63 base-pairs (bp), 72 bp, and 123 bp after the start codon) were synonymous mutations but that the SNPs located 209 bp, 224 bp, 245 bp, 263 bp, and 268 bp from the start codon led to amino acid changes (Figure 2B). Exon 2 of OsJRL45 contained one SNP in which adenine (A) in the SR86 and Nantehao sequences was substituted with cytosine (C) in the other cultivars, leading to a change from Glu to Asp in the amino acid sequence (Figure 2B). An SNP in exon 1 of OsJRL40 was found in a single cultivar, Meizhan. Exon 2 of OsJRL40 contained one SNP; an adenine (A) in the SR86 sequence was substituted with guanine (G) in other cultivars, resulting in an amino acid change from Ser in SR86 to Gly in the other cultivars (Figure 2B). Genomic sequencing of OsJRL45 and OsJRL40 from SR86, R498, Minghui63, and Zhenshan97 revealed that the two genes were only 2605 bp apart. In SR86, the intergenic region contained a 25-bp deletion (GCGCACGACGCGGCCGCCAGCGTTC); this deletion was located 204 bp downstream from the end of the OsJRL45 coding sequence and 2401 bp upstream of OsJRL40. We therefore designed and validated molecular markers based on the variation in the OsJRL45 and OsJRL40 sequences in the different rice varieties.

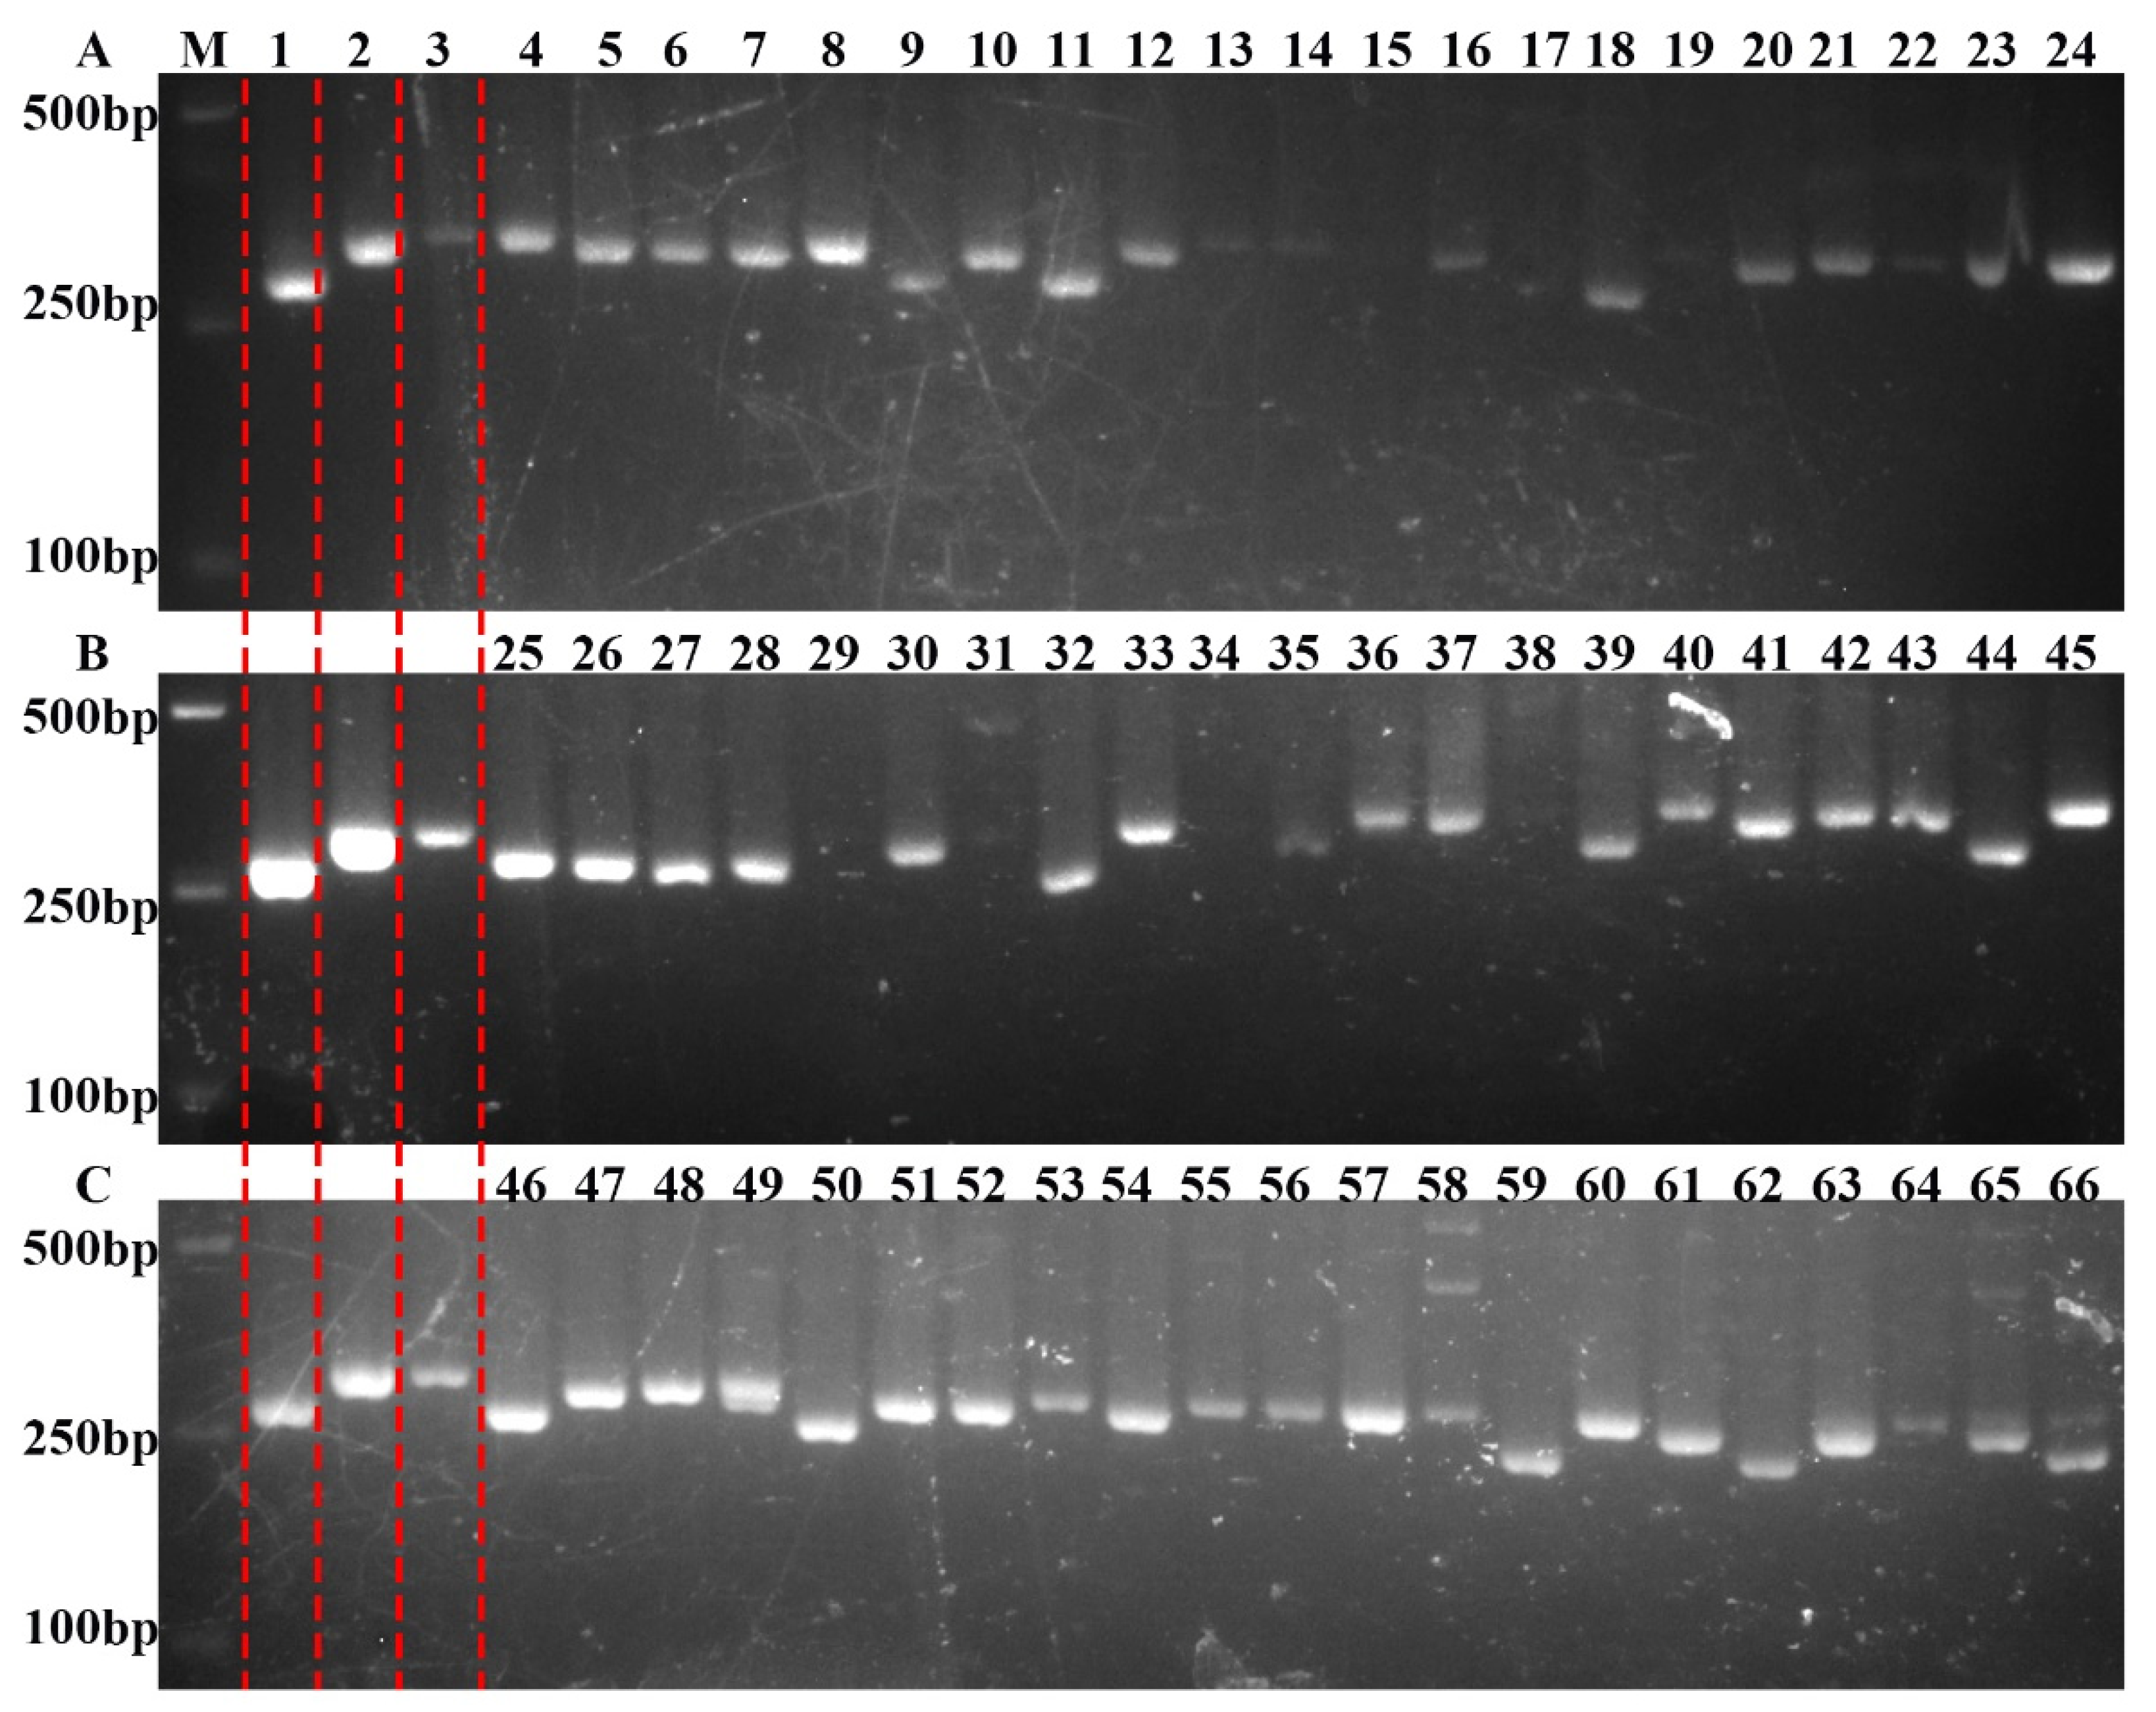
2.3. Validation of Molecular Markers in Populations

An F1 generation of hybrid progeny was produced by crossing SR86 and 9311. Individual F1 plants were selected and self-pollinated to produce an F2 population. We selected 3000 F2 seeds, which were germinated and the resulting seedlings subjected to 9‰ NaCl salt stress at the three-leaf stage. The surviving salt-tolerant plants were allowed to grow until seed-set and harvest. We then selected 320 individual F3 seedlings, which were grown to the three-leaf stage under hydroponic conditions, treated with 6‰ NaCl for 5 days to induce salt stress, and then allowed to recover for 5 days (Figure 3). DNA was extracted and analyzed by PCR using the molecular marker primers developed in this study. The PCR products were separated using 2% agarose gel electrophoresis (Figure S1), and a statistical analysis was performed to compare individual plants in the population. Of the F3 plants tested, 228 plants produced an agarose gel electrophoresis result that closely resembled that of the SR86 parent, 54 plants produced a result that resembled that of the 9311 parent, 36 plants were heterozygous, and the remaining 2 plants did not produce any PCR product (Table 1). These results indicated that molecular marker primers based on nucleotide differences between OsJRL45 and OsJRL40 could be used to screen salt-tolerant plants.

2.4. Validation of Molecular Markers for Salt Tolerance

To validate the accuracy of the molecular markers developed in this study to screen for salt-tolerant rice, the markers were verified in a number of rice varieties. DNA was extracted, amplified by PCR, and the PCR products separated using 2% agarose gel electrophoresis. The rice varieties that showed higher salt tolerance (Foer B, Chaimi, Yuejing, Xiangzao 32, Nantehao, R288, Shuhui 527, Aizinuo, and Xiang 628S) produced gel electrophoresis results that closely resembled that of SR86, while salt-intolerant plants produced similar results to 9311 (Figure 4). This indicated that the novel molecular markers designed to identify salt tolerance were accurate for more than 90% of plants, suggesting that they had high specificity when used for screening.

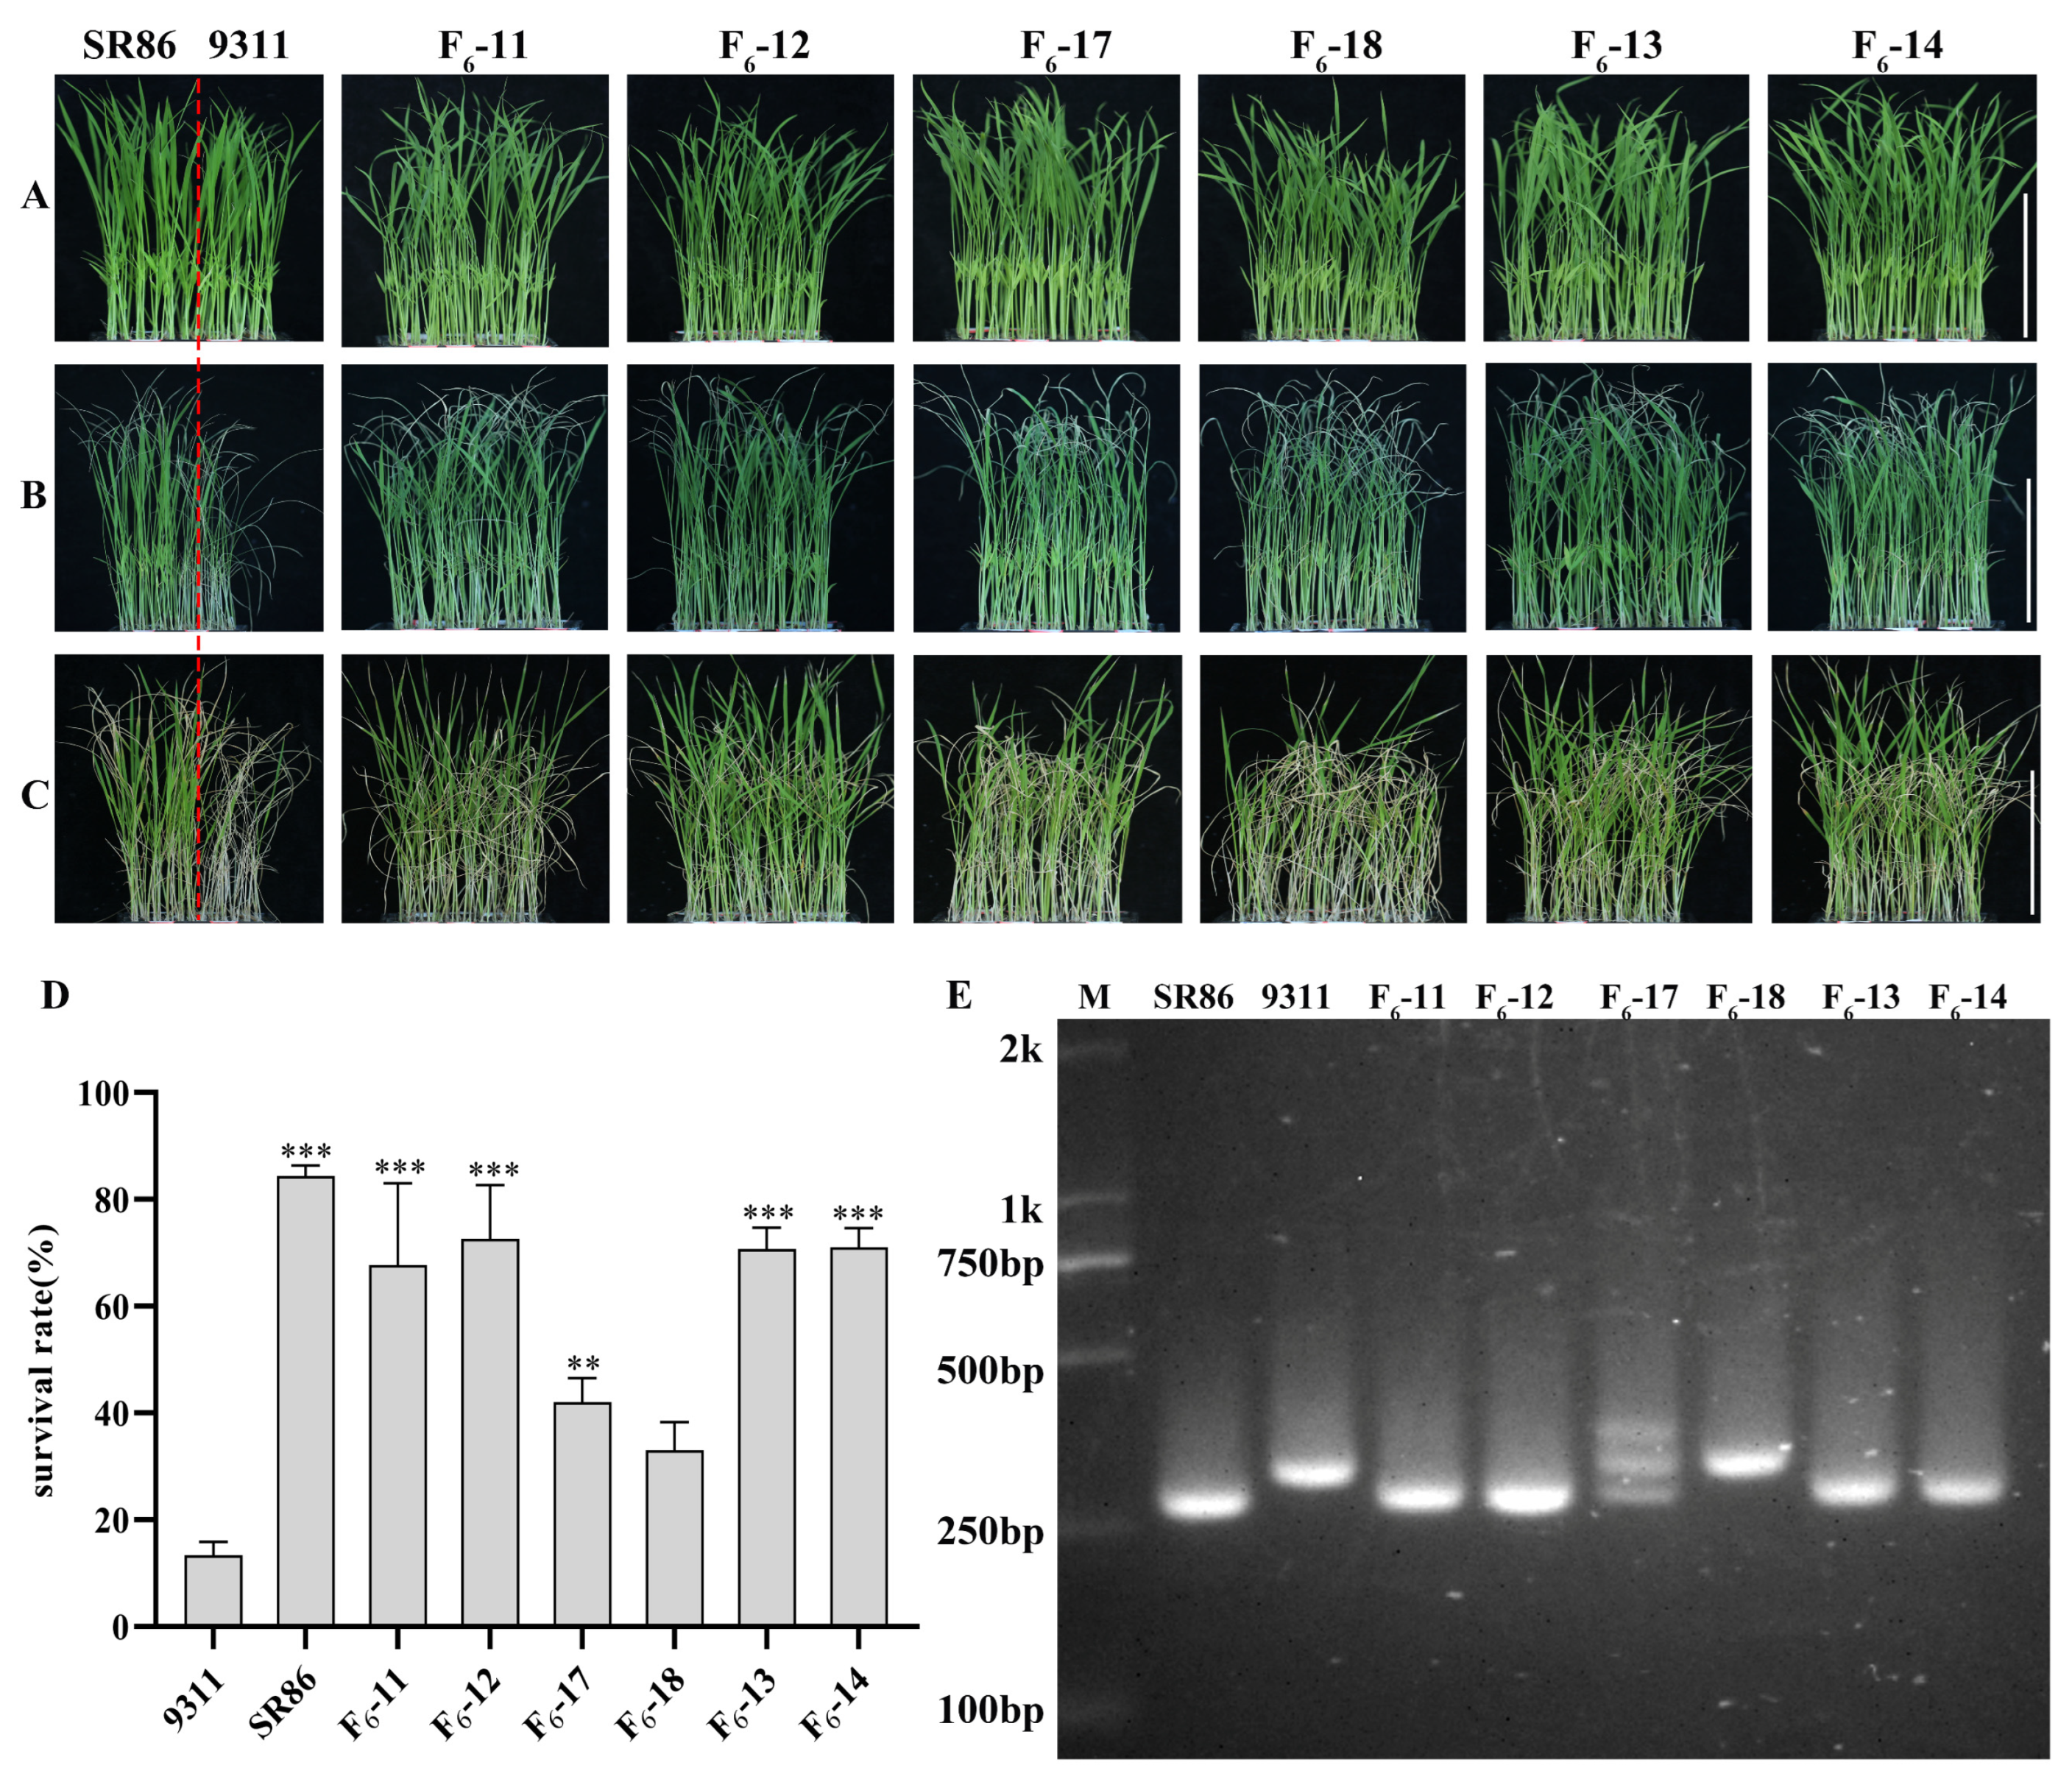
2.5. Validation of MAS for Salt Tolerance in RILs Derived from SR86 × 9311

Salt-tolerant plants were randomly selected from sixth generation RILs derived from SR86 and 9311 hybrids, treated with 9‰ NaCl for 4 days at the three-leaf stage, and then allowed to recover for 4 days (Figure 5A–C). The survival rates after recovery from salt stress treatment were determined. The survival rate of the parental line 9311 was approximately 10%, and that of SR86, the other parental line, was more than 80%. The survival rates of the salt-tolerant hybrids were between 60–70% (Figure 5D). The genotypes of the RILs were verified using specific marker primers based on differences between the SR86 and 9311 sequences. Agarose gel electrophoresis showed that plants with higher salt tolerance were genetically more similar to SR86, while individuals with poorer salt tolerance resembled 9311 genetically (Figure 5E). These results confirmed that the molecular markers developed in this study to identify salt tolerance had high specificity.

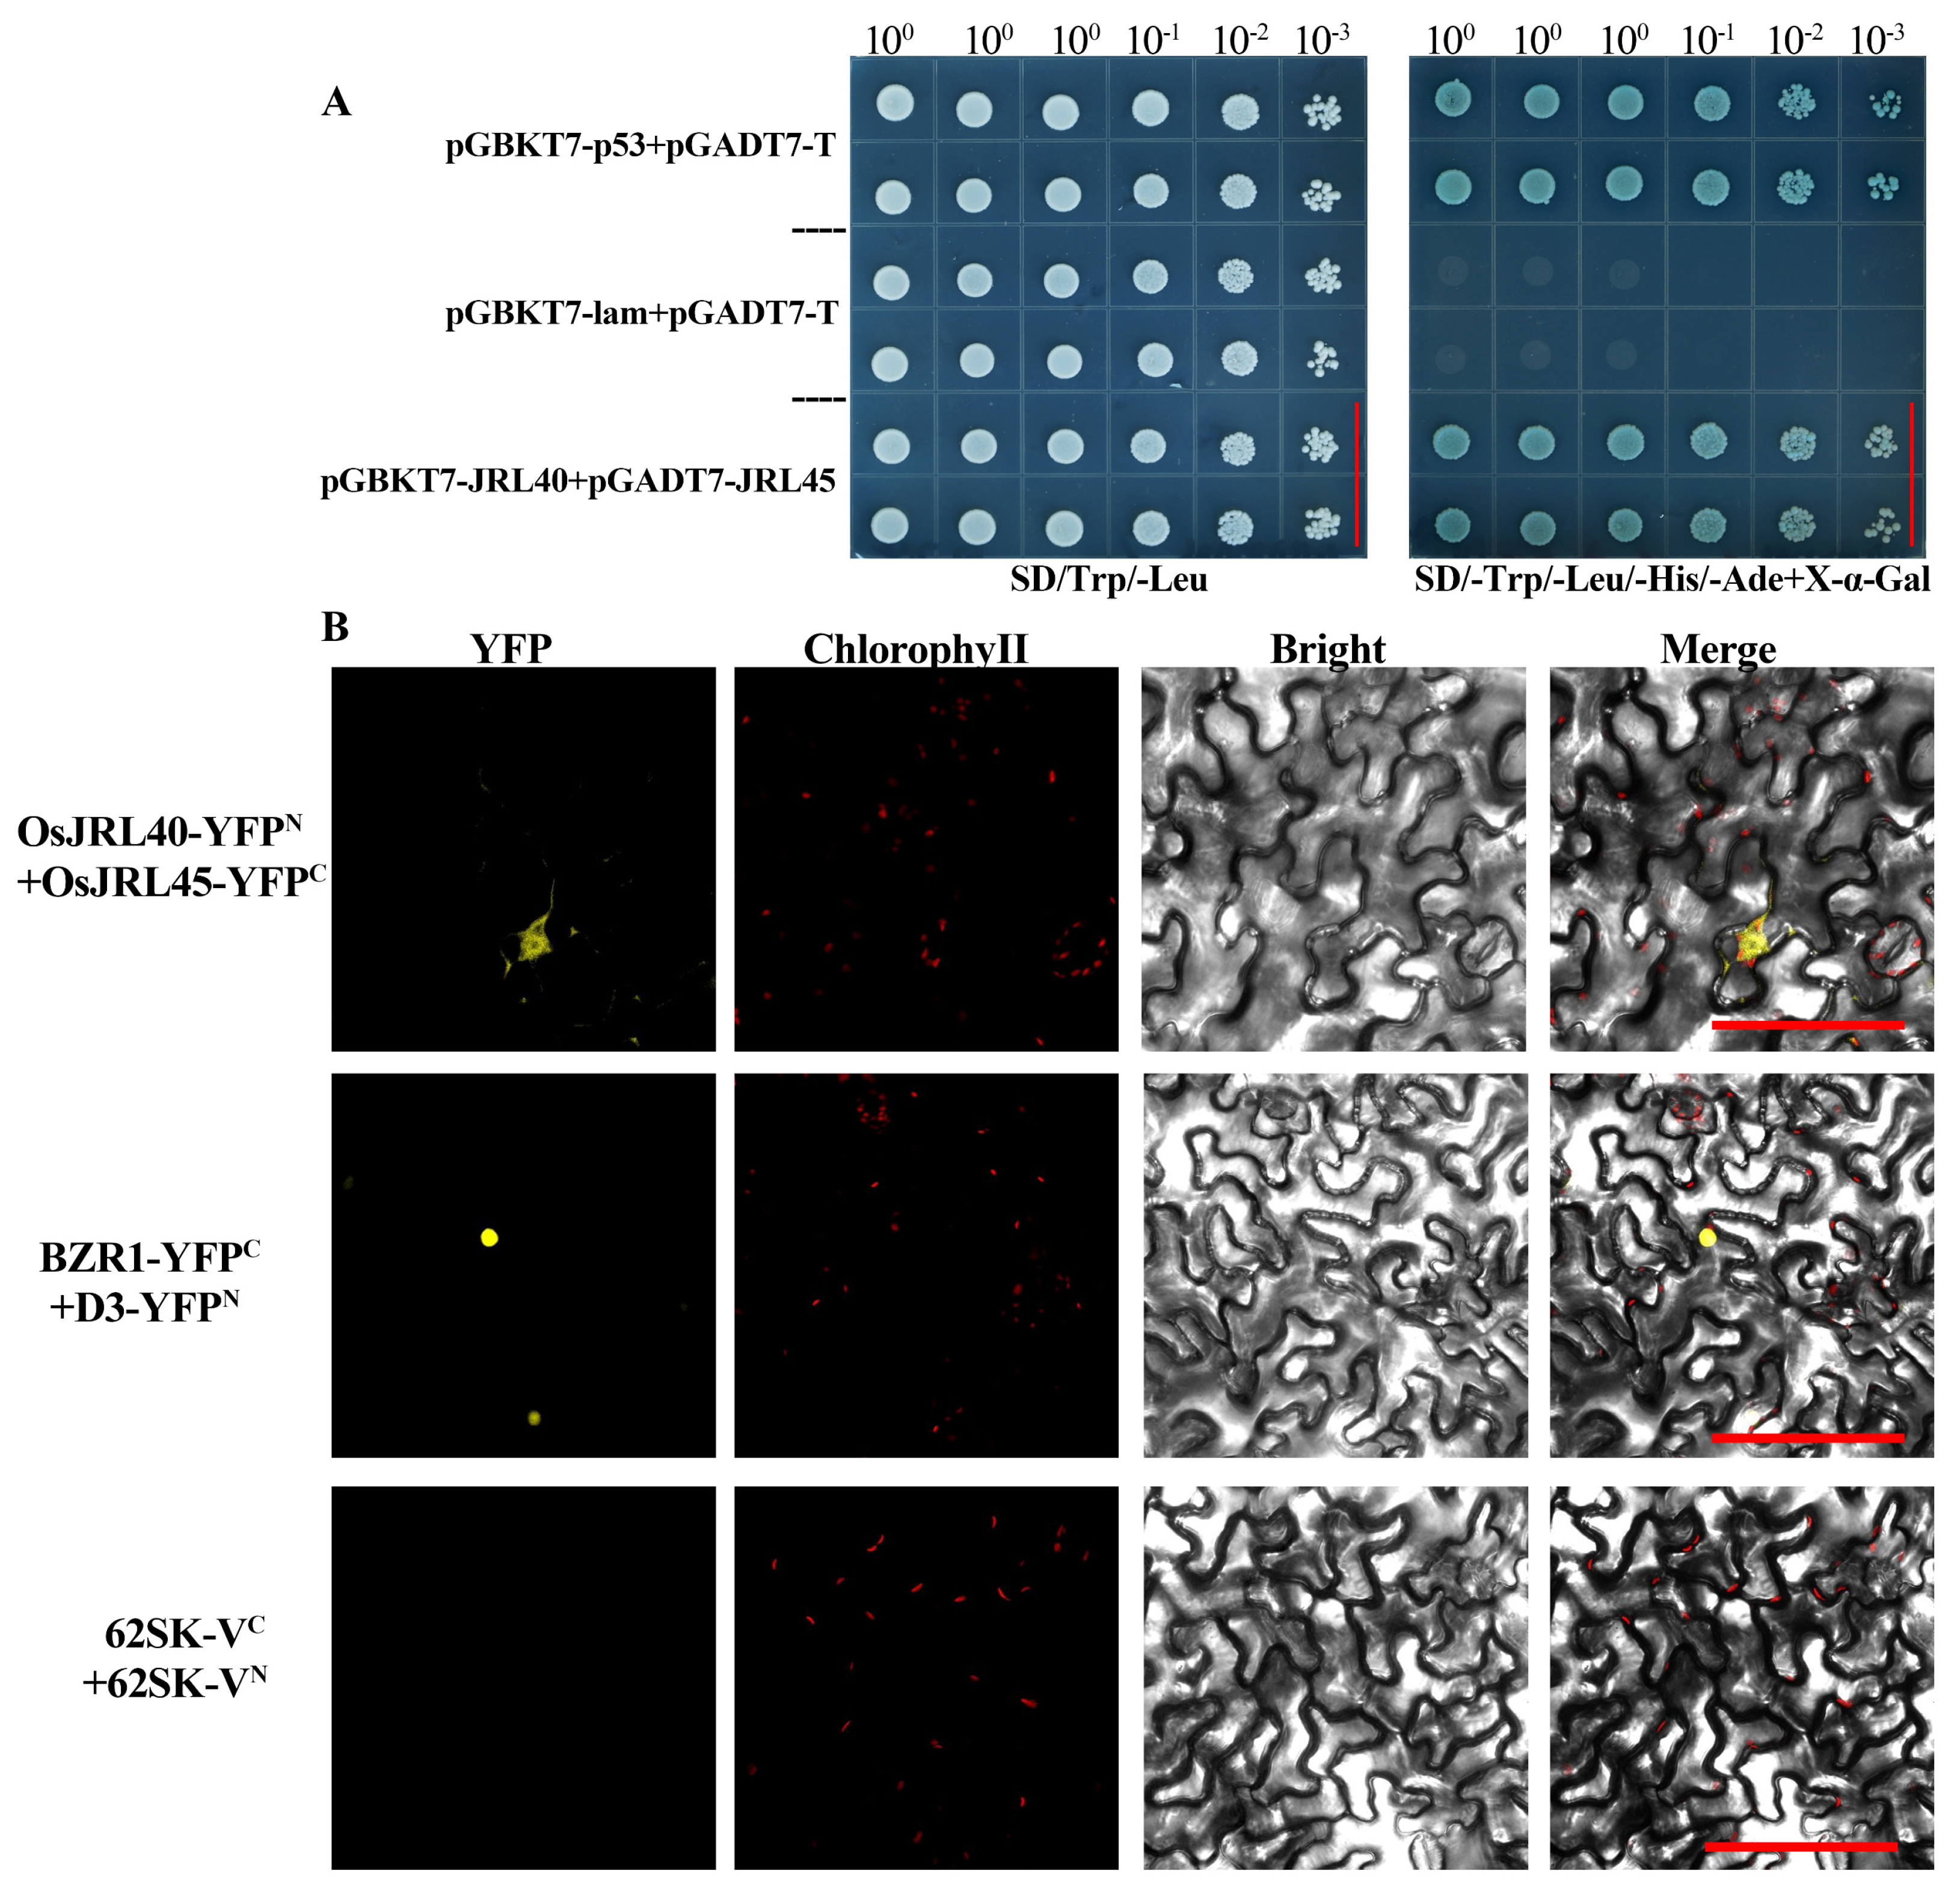
2.6. Analysis of the Interaction between OsJRL45 and OsJRL40

Structural analysis of OsJRL45 and OsJRL40 revealed that both genes were located on chromosome 4 (Figure 2A). To determine whether the OsJRL45 and OsJRL40 proteins interacted, OsJRL45 was used as bait in yeast two-hybrid (Y2H) experiments. The yeast strain Y2HGold was co-transformed with the vectors AD-OsJRL45 and BD-OsJRL40. Co-transformed yeast grew normally on SD/-Trp/-Leu/-His/-Ade + X-α-Gal medium (Figure 6A), indicating an interaction between OsJRL45 and OsJRL40.
To verify this Y2H result, bimolecular fluorescence complementation (BiFC) assays were conducted in tobacco leaves. Previous studies showed that OsJRL45 and OsJRL40 are located in the endoplasmic reticulum and cytoplasm, respectively [33,34]. Following co-expression of OsJRL40-YFPN/OsJRL45-YFPC, fluorescent signals were detected in the nucleus and cytoplasm (Figure 6B). Taken together, the Y2H and BiFC results indicated that there was an interaction between OsJRL45 and OsJRL40; we therefore speculated that co-expression of OsJRL45 and OsJRL40 in rice might enhance their function.

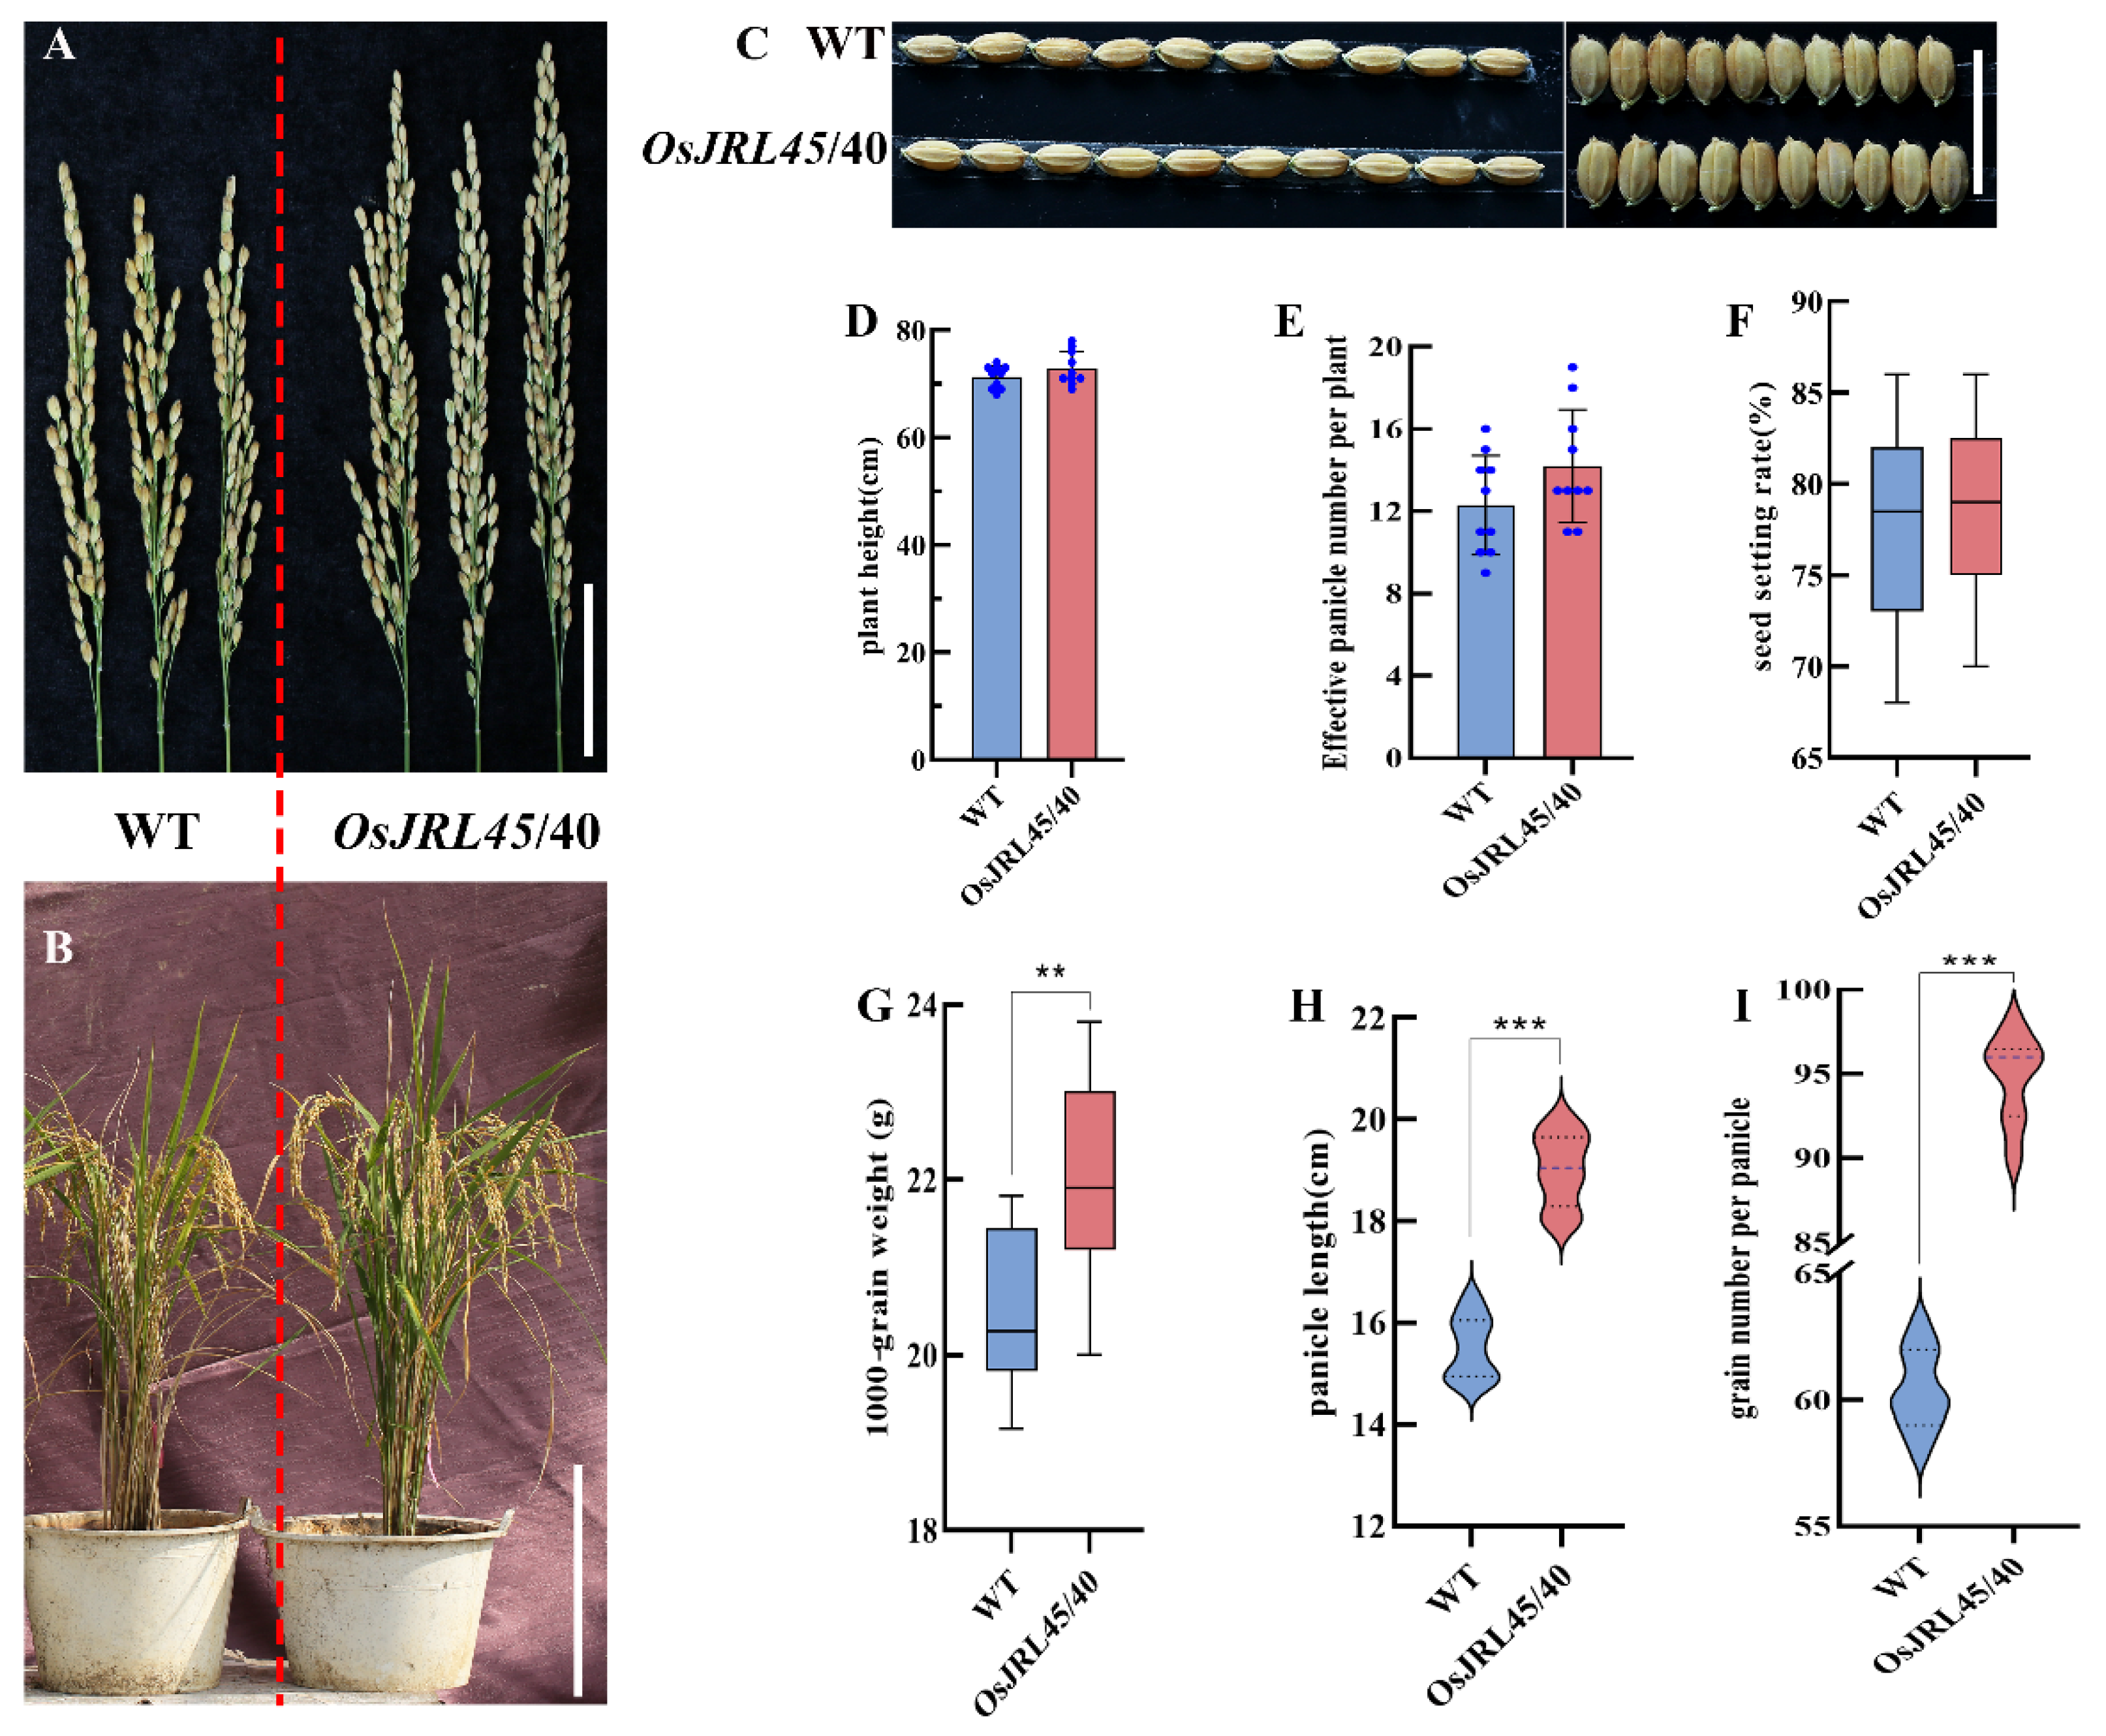
2.7. Analysis of Agronomic Traits in Mature Transgenic Plants Harboring OsJRL45/40 from SR86

To determine whether the phenotype and agronomic traits associated with SR86 could be observed in transgenic Nip plants harboring OsJRL45 and OsJRL40 (OsJRL45/40) from SR86, the T2 generation of transgenic plants was observed at maturity to compare their traits and phenotype with wild-type (WT) Nip (Figure 7). The single spike structure and overall phenotype of transgenic plants did not differ significantly from that of WT (Figure 7A,B); in addition, there were no significant differences in grain length, grain width, plant height, effective panicle, and seed-setting rate between transgenic plants and WT plants (Figure 7C–F). There were, however, significant differences between transgenic and WT plants in thousand-grain weight, spike length, and the number of grains per spike (Figure 7G–I). These results indicated that, although co-transformation of Nip with OsJRL45/40 from SR86 enhanced yield, it did not affect the general phenotype of the plant.

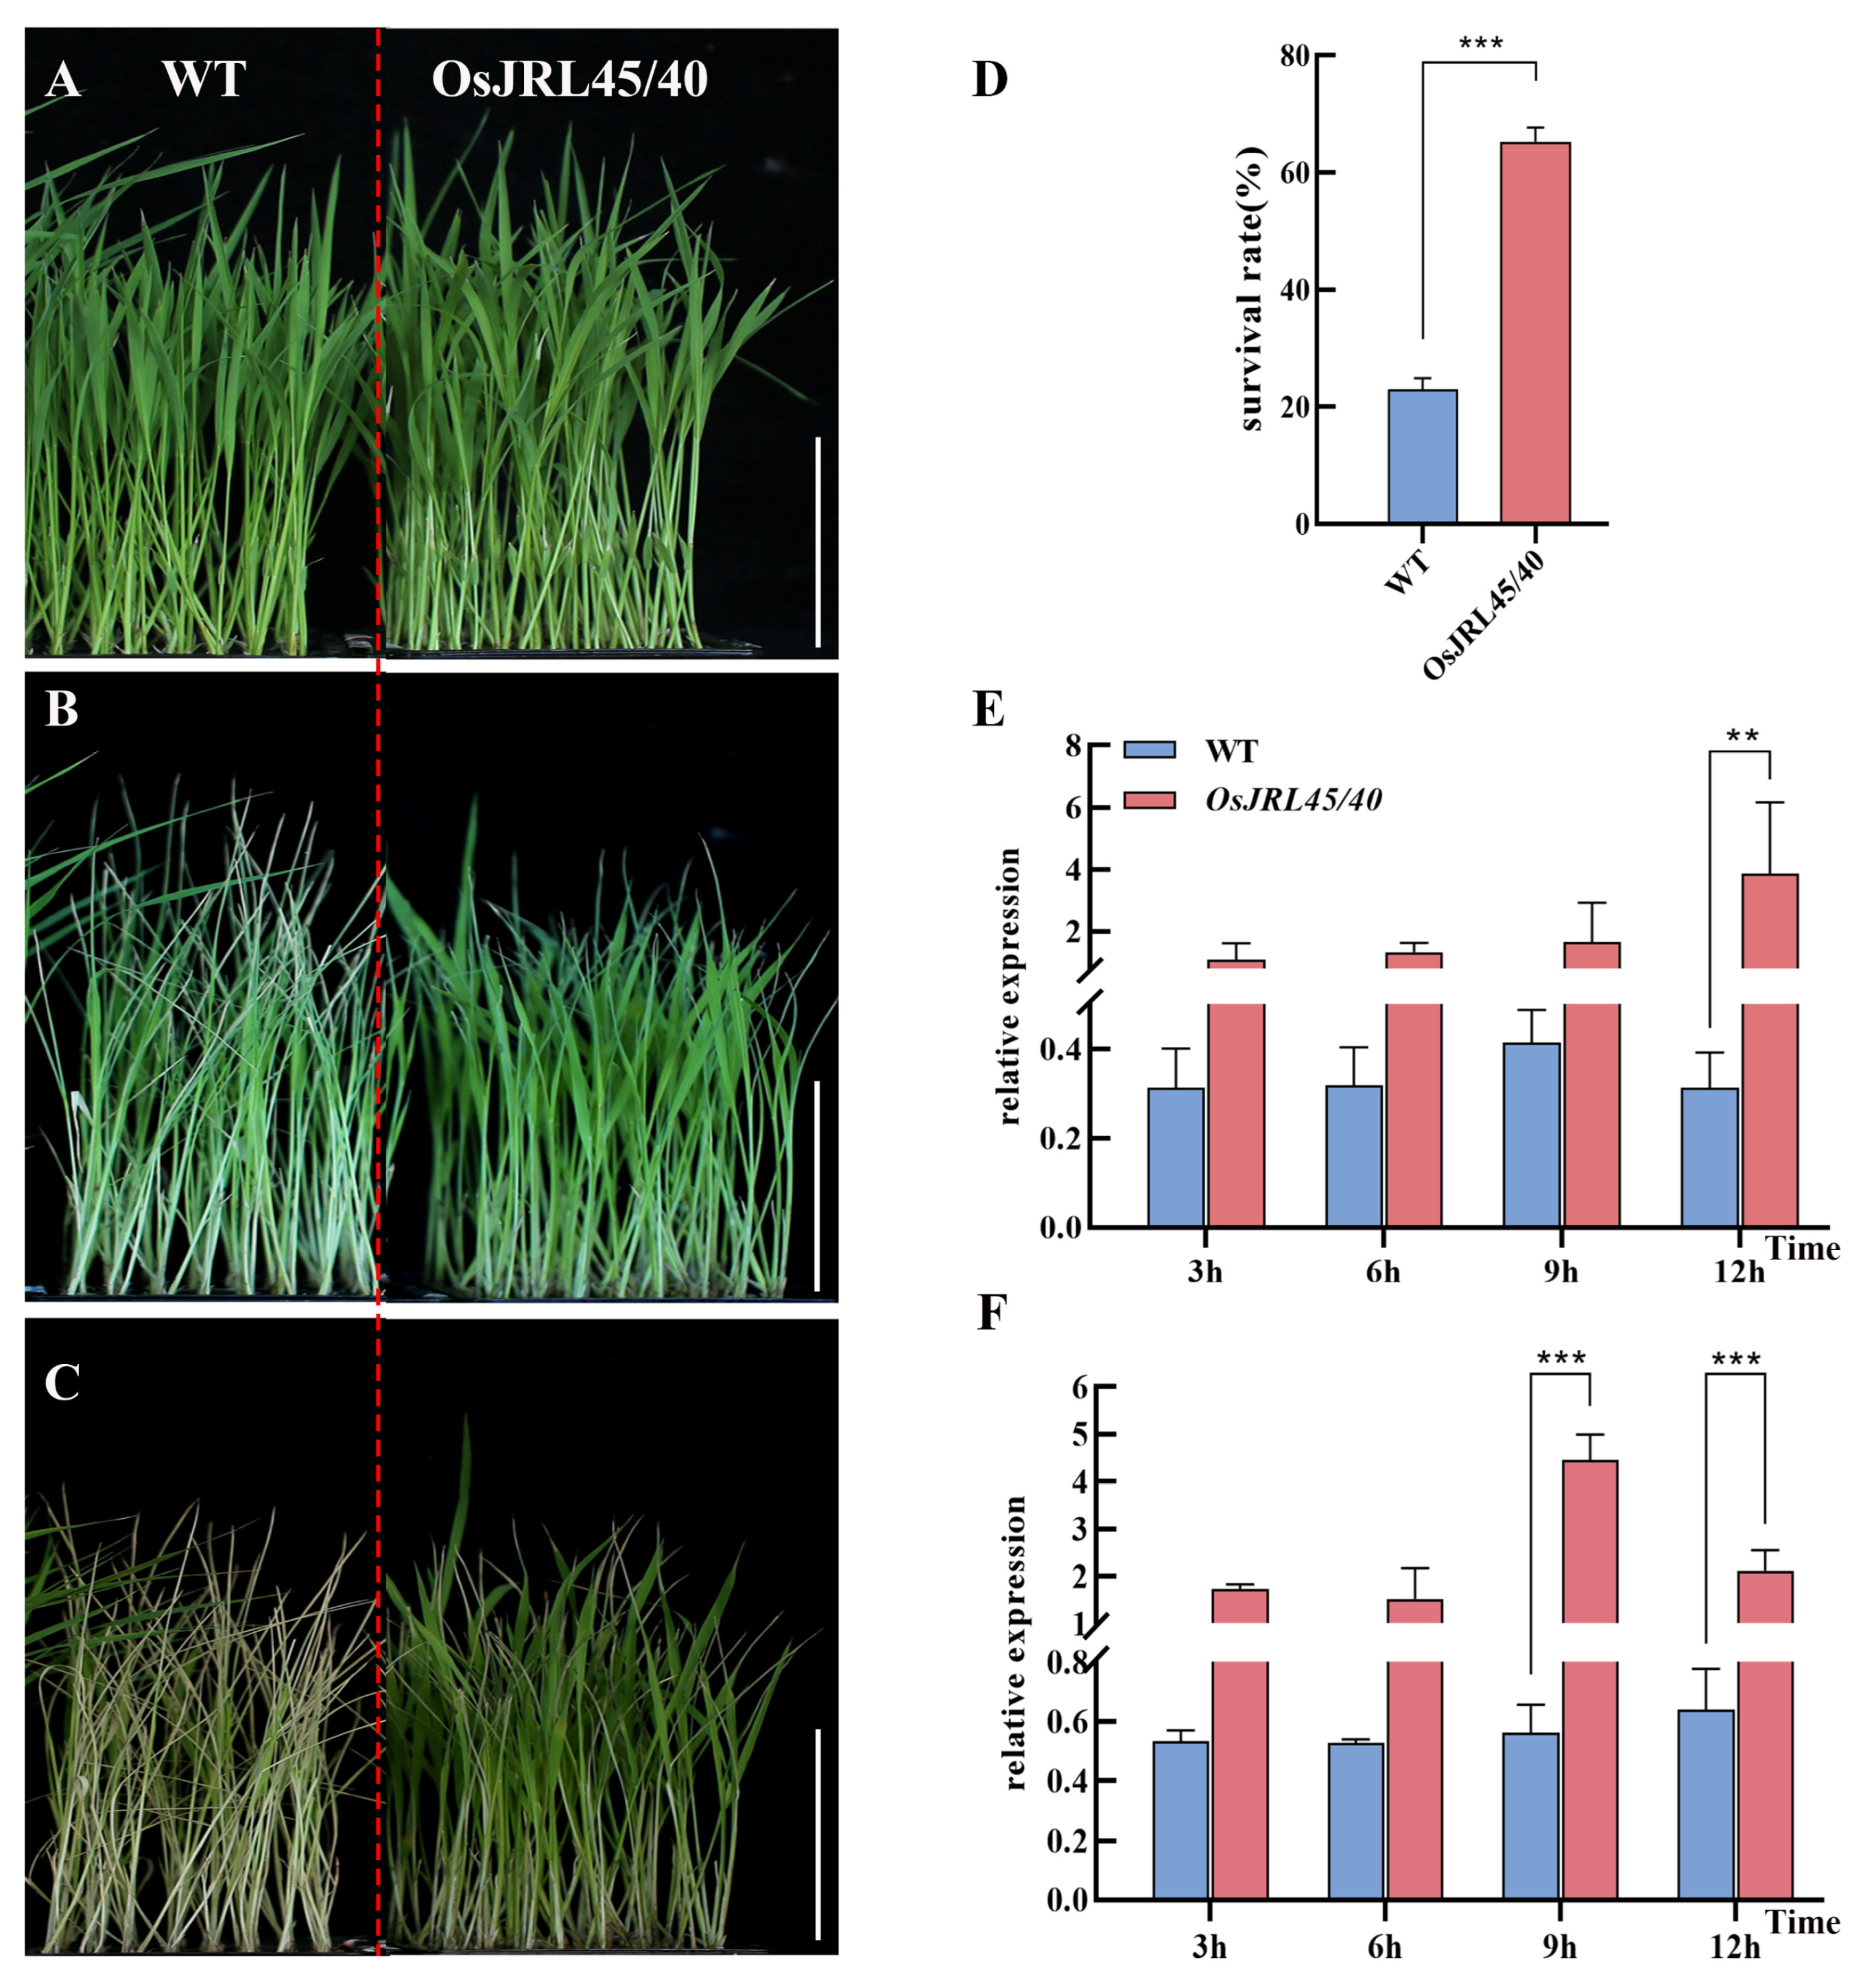
2.8. Co-Transformation with OsJRL45/40 from SR86 Enhances Tolerance of Salt Stress at the Three-Leaf Stage

To further verify whether co-transforming Nip with OsJRL45 and OsJRL40 from SR86 enhanced tolerance of salt stress, WT and transgenic plants at the three-leaf stage were subjected to 9‰ NaCl salt stress treatment for 4 days and allowed to recover for 4 days before their phenotypes were observed (Figure 8A–C). The survival rate of the transgenic plants was significantly higher than that of WT (Figure 8D), indicating that salt tolerance was enhanced by transformation with OsJRL45/40. Next, the expression of OsJRL45 and OsJRL40 in plants exposed to salt stress for 3, 6, 9, or 12 h was quantified using RT-qPCR. This analysis found that expression levels of these genes were significantly higher in the transgenic plants than in the WT (Figure 8E,F). These results confirmed that, at the three-leaf stage, co-transformation with OsJRL45 and OsJRL40 from SR86 enhanced tolerance to salt stress.

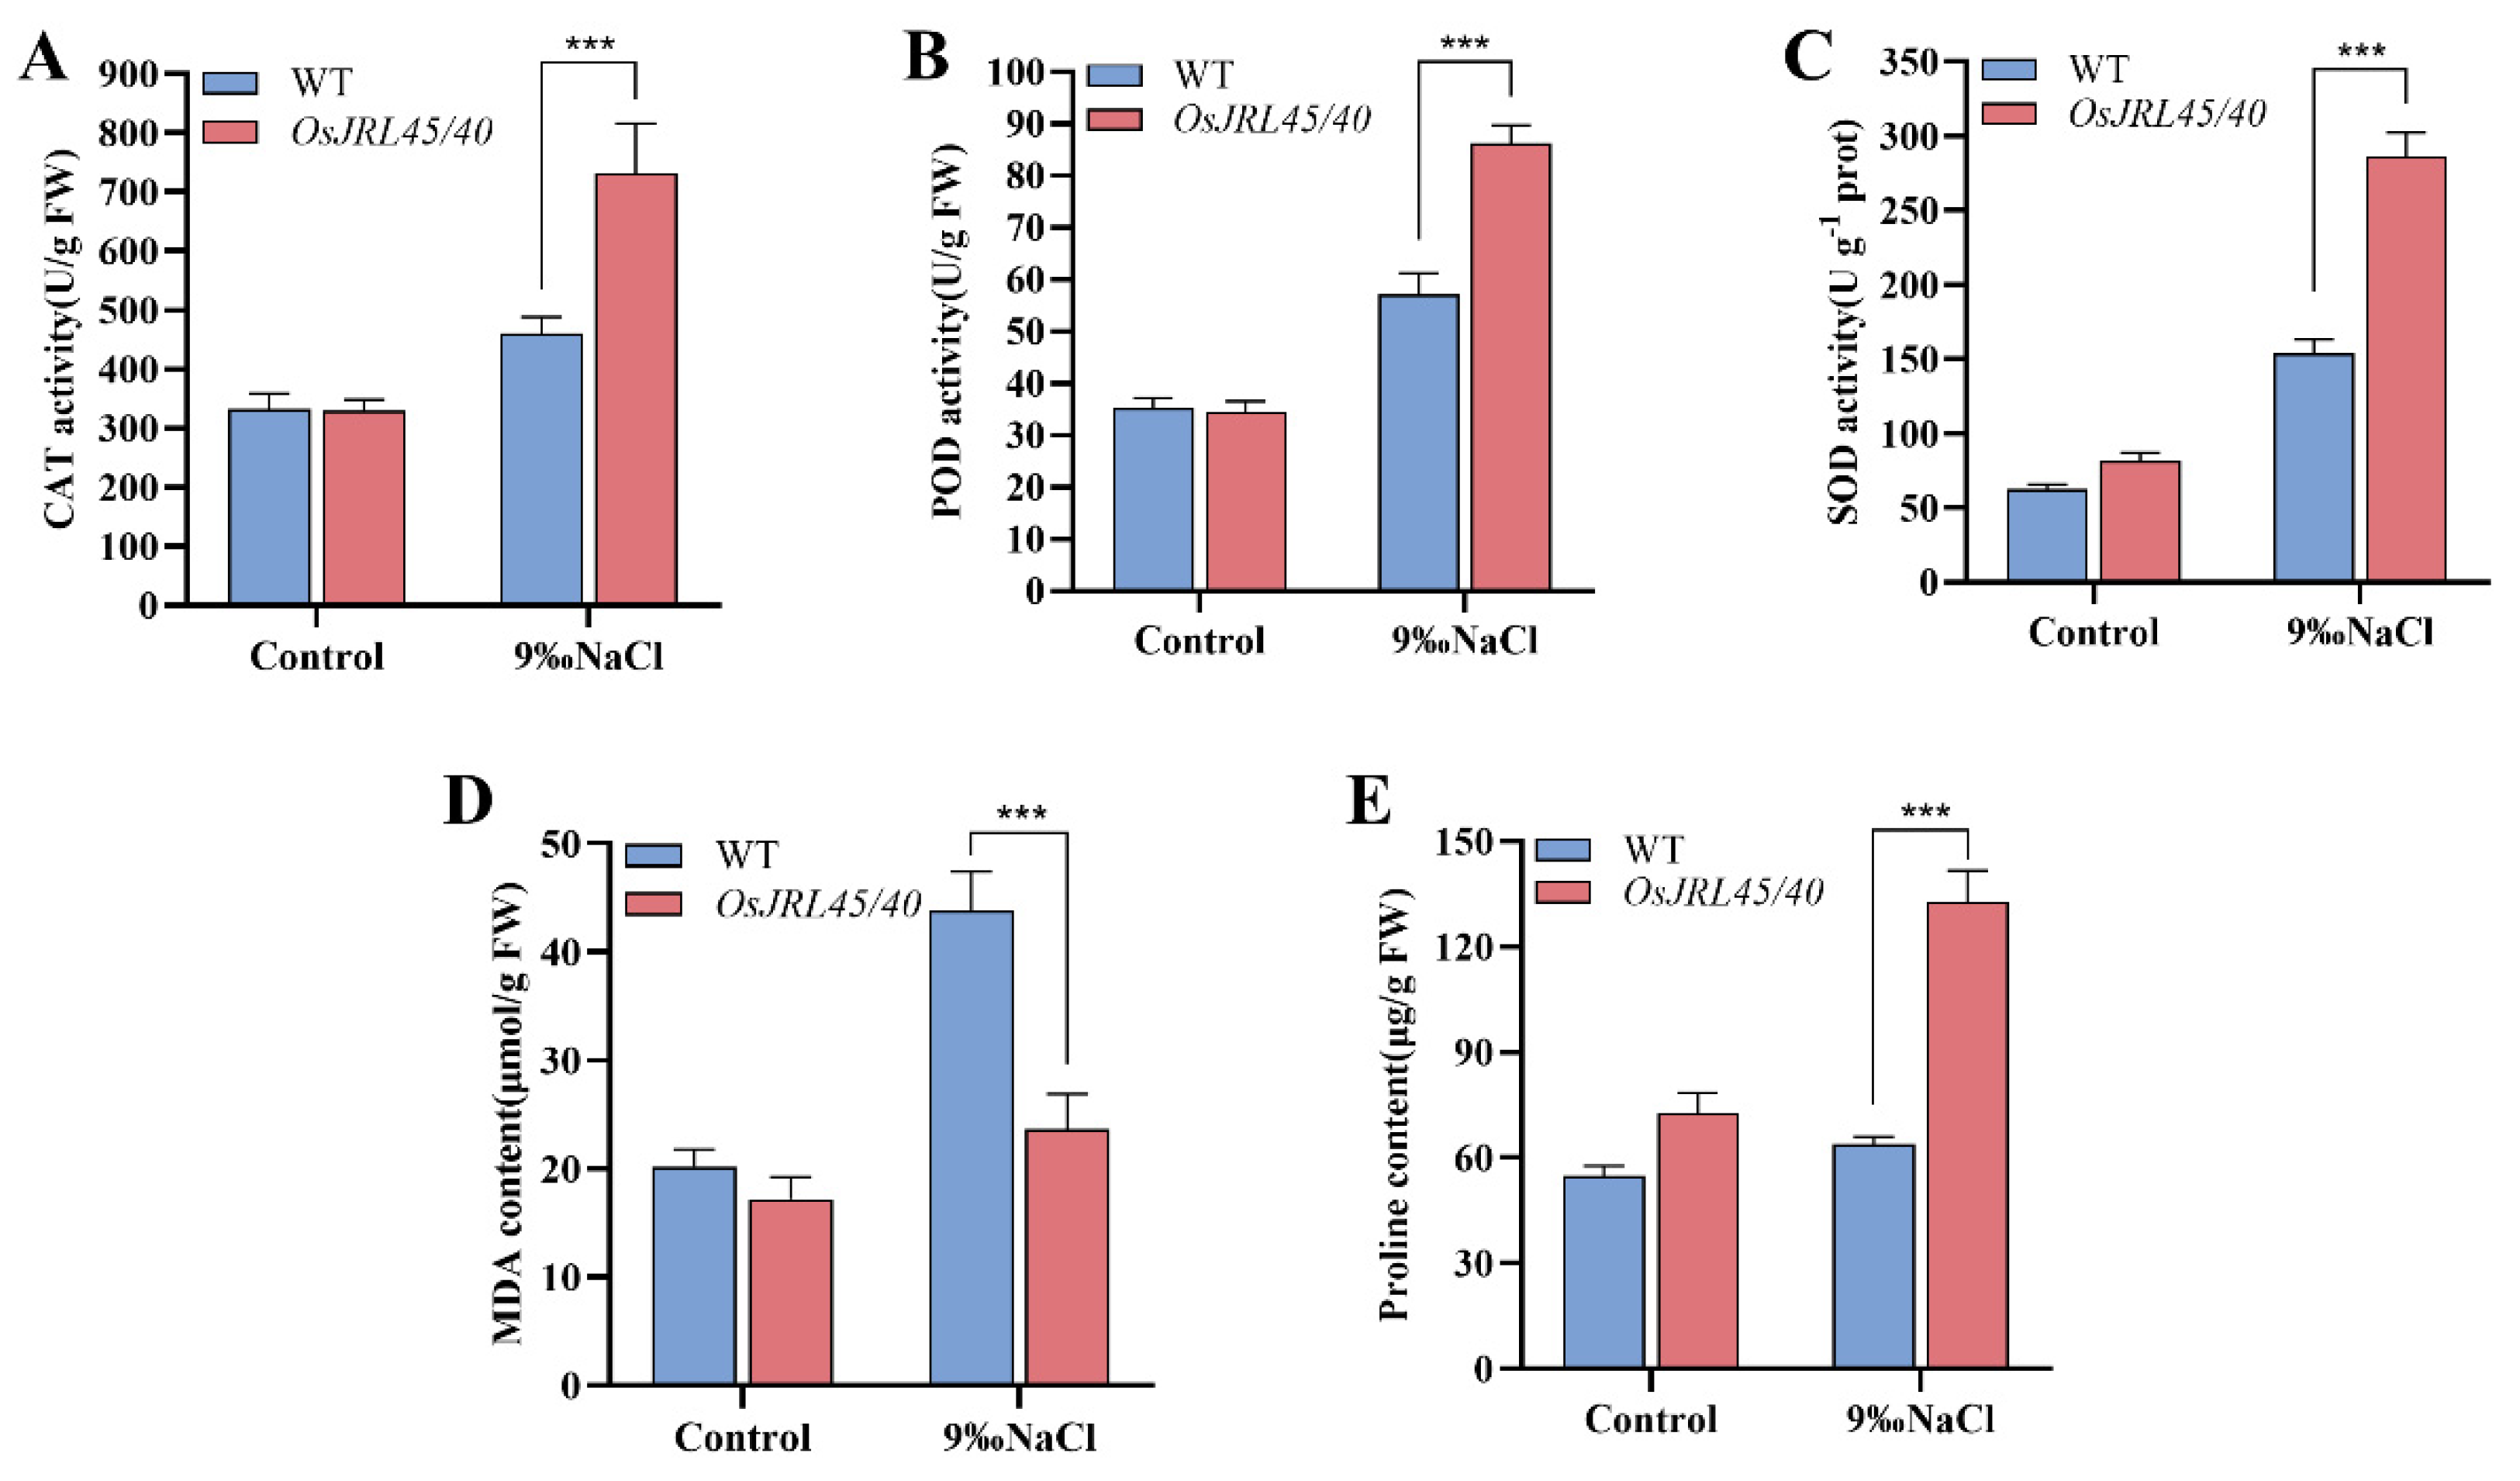
2.9. Co-Transformation with OsJRL45/40 Derived from SR86 Enhances Antioxidant Enzyme Activities under Salt Stress

To analyze the effects of co-transforming Nip WT with OsJRL45 and OsJRL40 from SR86 on physiological parameters related to ROS under salt stress, plants at the three-leaf stage were treated with 9‰ NaCl for 24 h. The enzymatic activities of CAT, POD, and SOD were measured in WT and OsJRL45/40 transgenic plants before and after salt stress treatment, as were the levels of malondialdehyde (MDA) and proline (Pro). The activities of CAT, POD, and SOD, as well as Pro content, were significantly higher in OsJRL45/40 transgenic plants than in WT, while the MDA content showed the opposite result (Figure 9A–E). This showed that co-transforming Nip with OsJRL45/40 from SR86 enhanced salt stress tolerance, and improved the homeostasis of related physiological parameters, including enzyme activities.

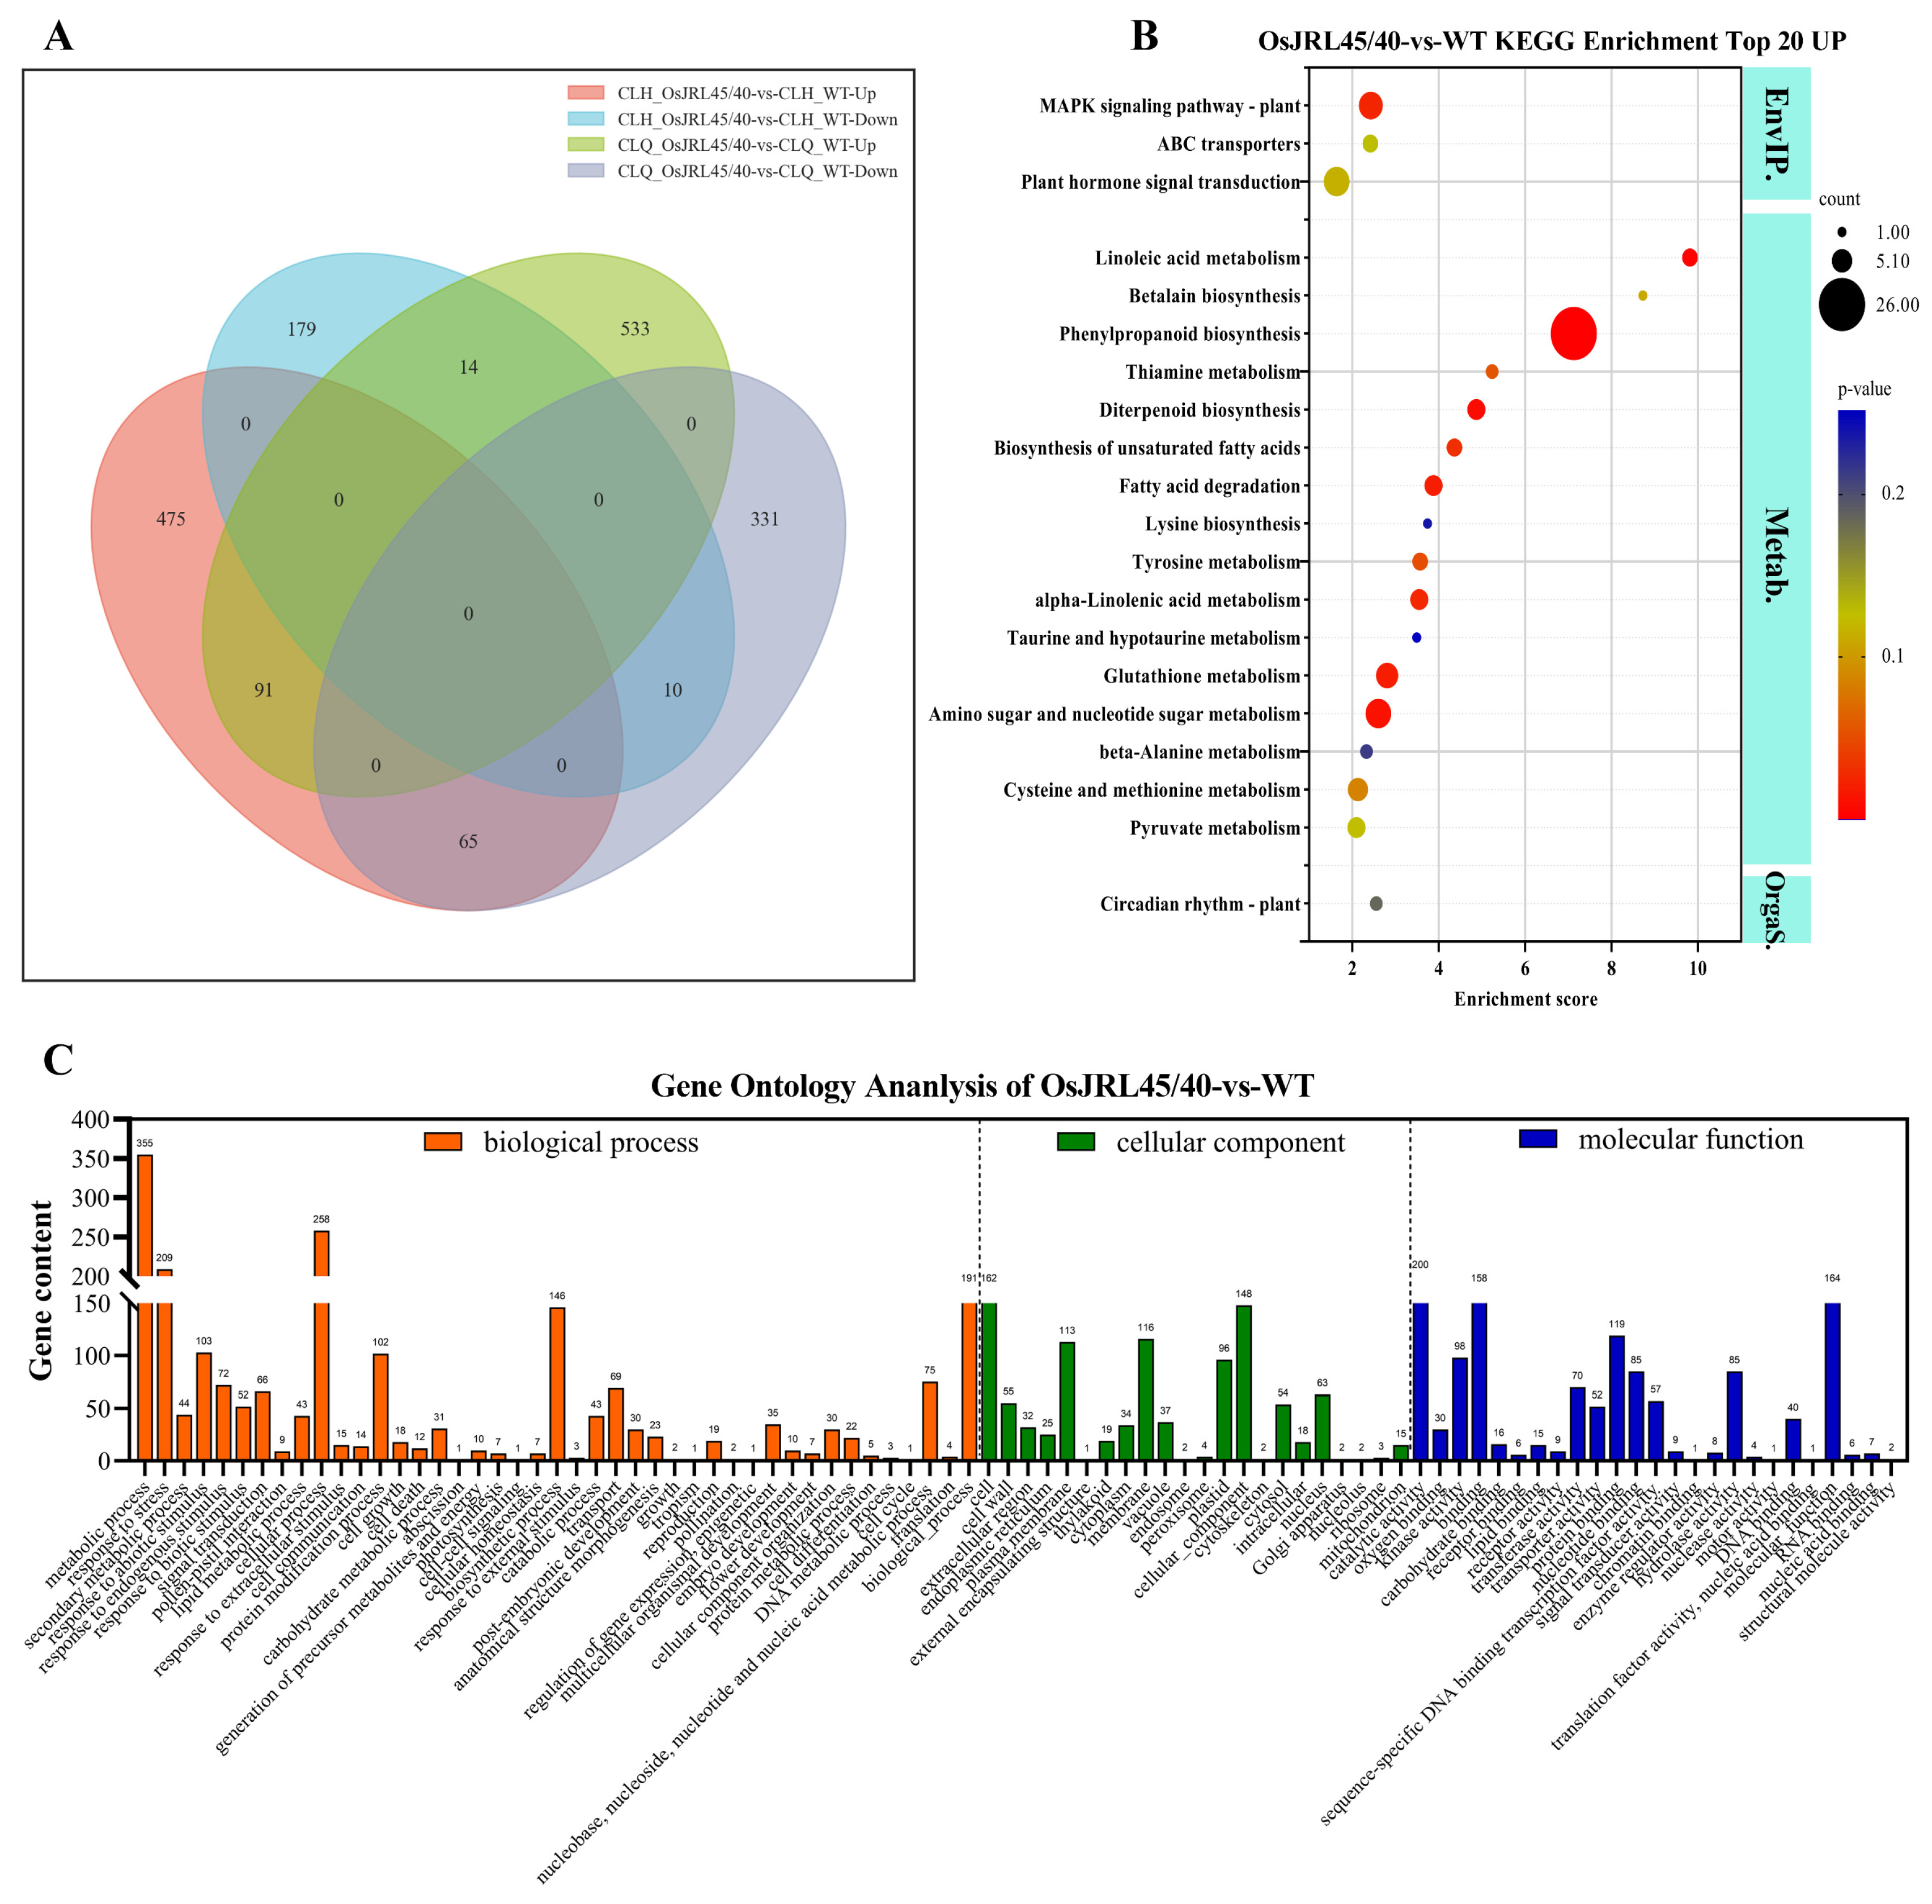
2.10. Analysis of Differentially Expressed Genes

To investigate the salt tolerance of transgenic Nip plants harboring OsJRL45 and OsJRL40 from SR86 further, we analyzed differential gene expression before and after salt stress treatment, using Fold Change ≥ 2 and q-value < 0.05 as criteria for determining differentially expressed genes (DEGs). The overlaps between groups of DEGs identified in transgenic and WT plants before and after salt stress treatment are shown in Figure 10A. We identified 1044 DEGs (638 up-regulated and 406 down-regulated) in OsJRL45/40-vs-WT before salt stress treatment and identified 834 DEGs (631 up-regulated and 203 down-regulated) in OsJRL45/40-vs-WT after salt treatment (Figure 10A); this group may contain key genes governing the response to salt stress. Kyoto Encyclopedia of Genes and Genomes (KEGG) enrichment analysis showed that genes that were differentially expressed between WT and transgenic plants before salt stress treatment were involved in “mitogen-activated protein kinase (MAPK) signaling pathway”, “plant hormone signal transduction”, and “phenylpropanoid biosynthesis” (Figure 10B). Gene ontology (GO) enrichment analysis showed that the DEGs were mainly involved in “metabolic process”, “response to stress”, “catalytic activity”, and “response to abiotic stimulus” (Figure 10C).
Volcano plot analysis found that 631 genes were significantly up-regulated and 203 genes significantly down-regulated in transgenic plants, relative to WT, after salt stress treatment (Figure 11A,B). KEGG enrichment analysis showed these DEGs were involved in “linoleic acid metabolism”, “photosynthesis”, “alpha-linolenic acid metabolism”, “2glyoxylate and dicarboxylate metabolism”, “carbon fixation in photosynthetic organisms”, and “alanine, aspartate, and glutamate metabolism” pathways (Figure 11C). GO enrichment analysis revealed that most of these DEGs were involved in “metabolic process”, “response to stress”, and “response to abiotic stimulus” (Figure 11D). That a large number of genes were differentially expressed in a short period soon after salt stress treatment indicated that the response to salt stress occurred more rapidly in transgenic plants harboring OsJRL45/40 from SR86 than in WT plants.

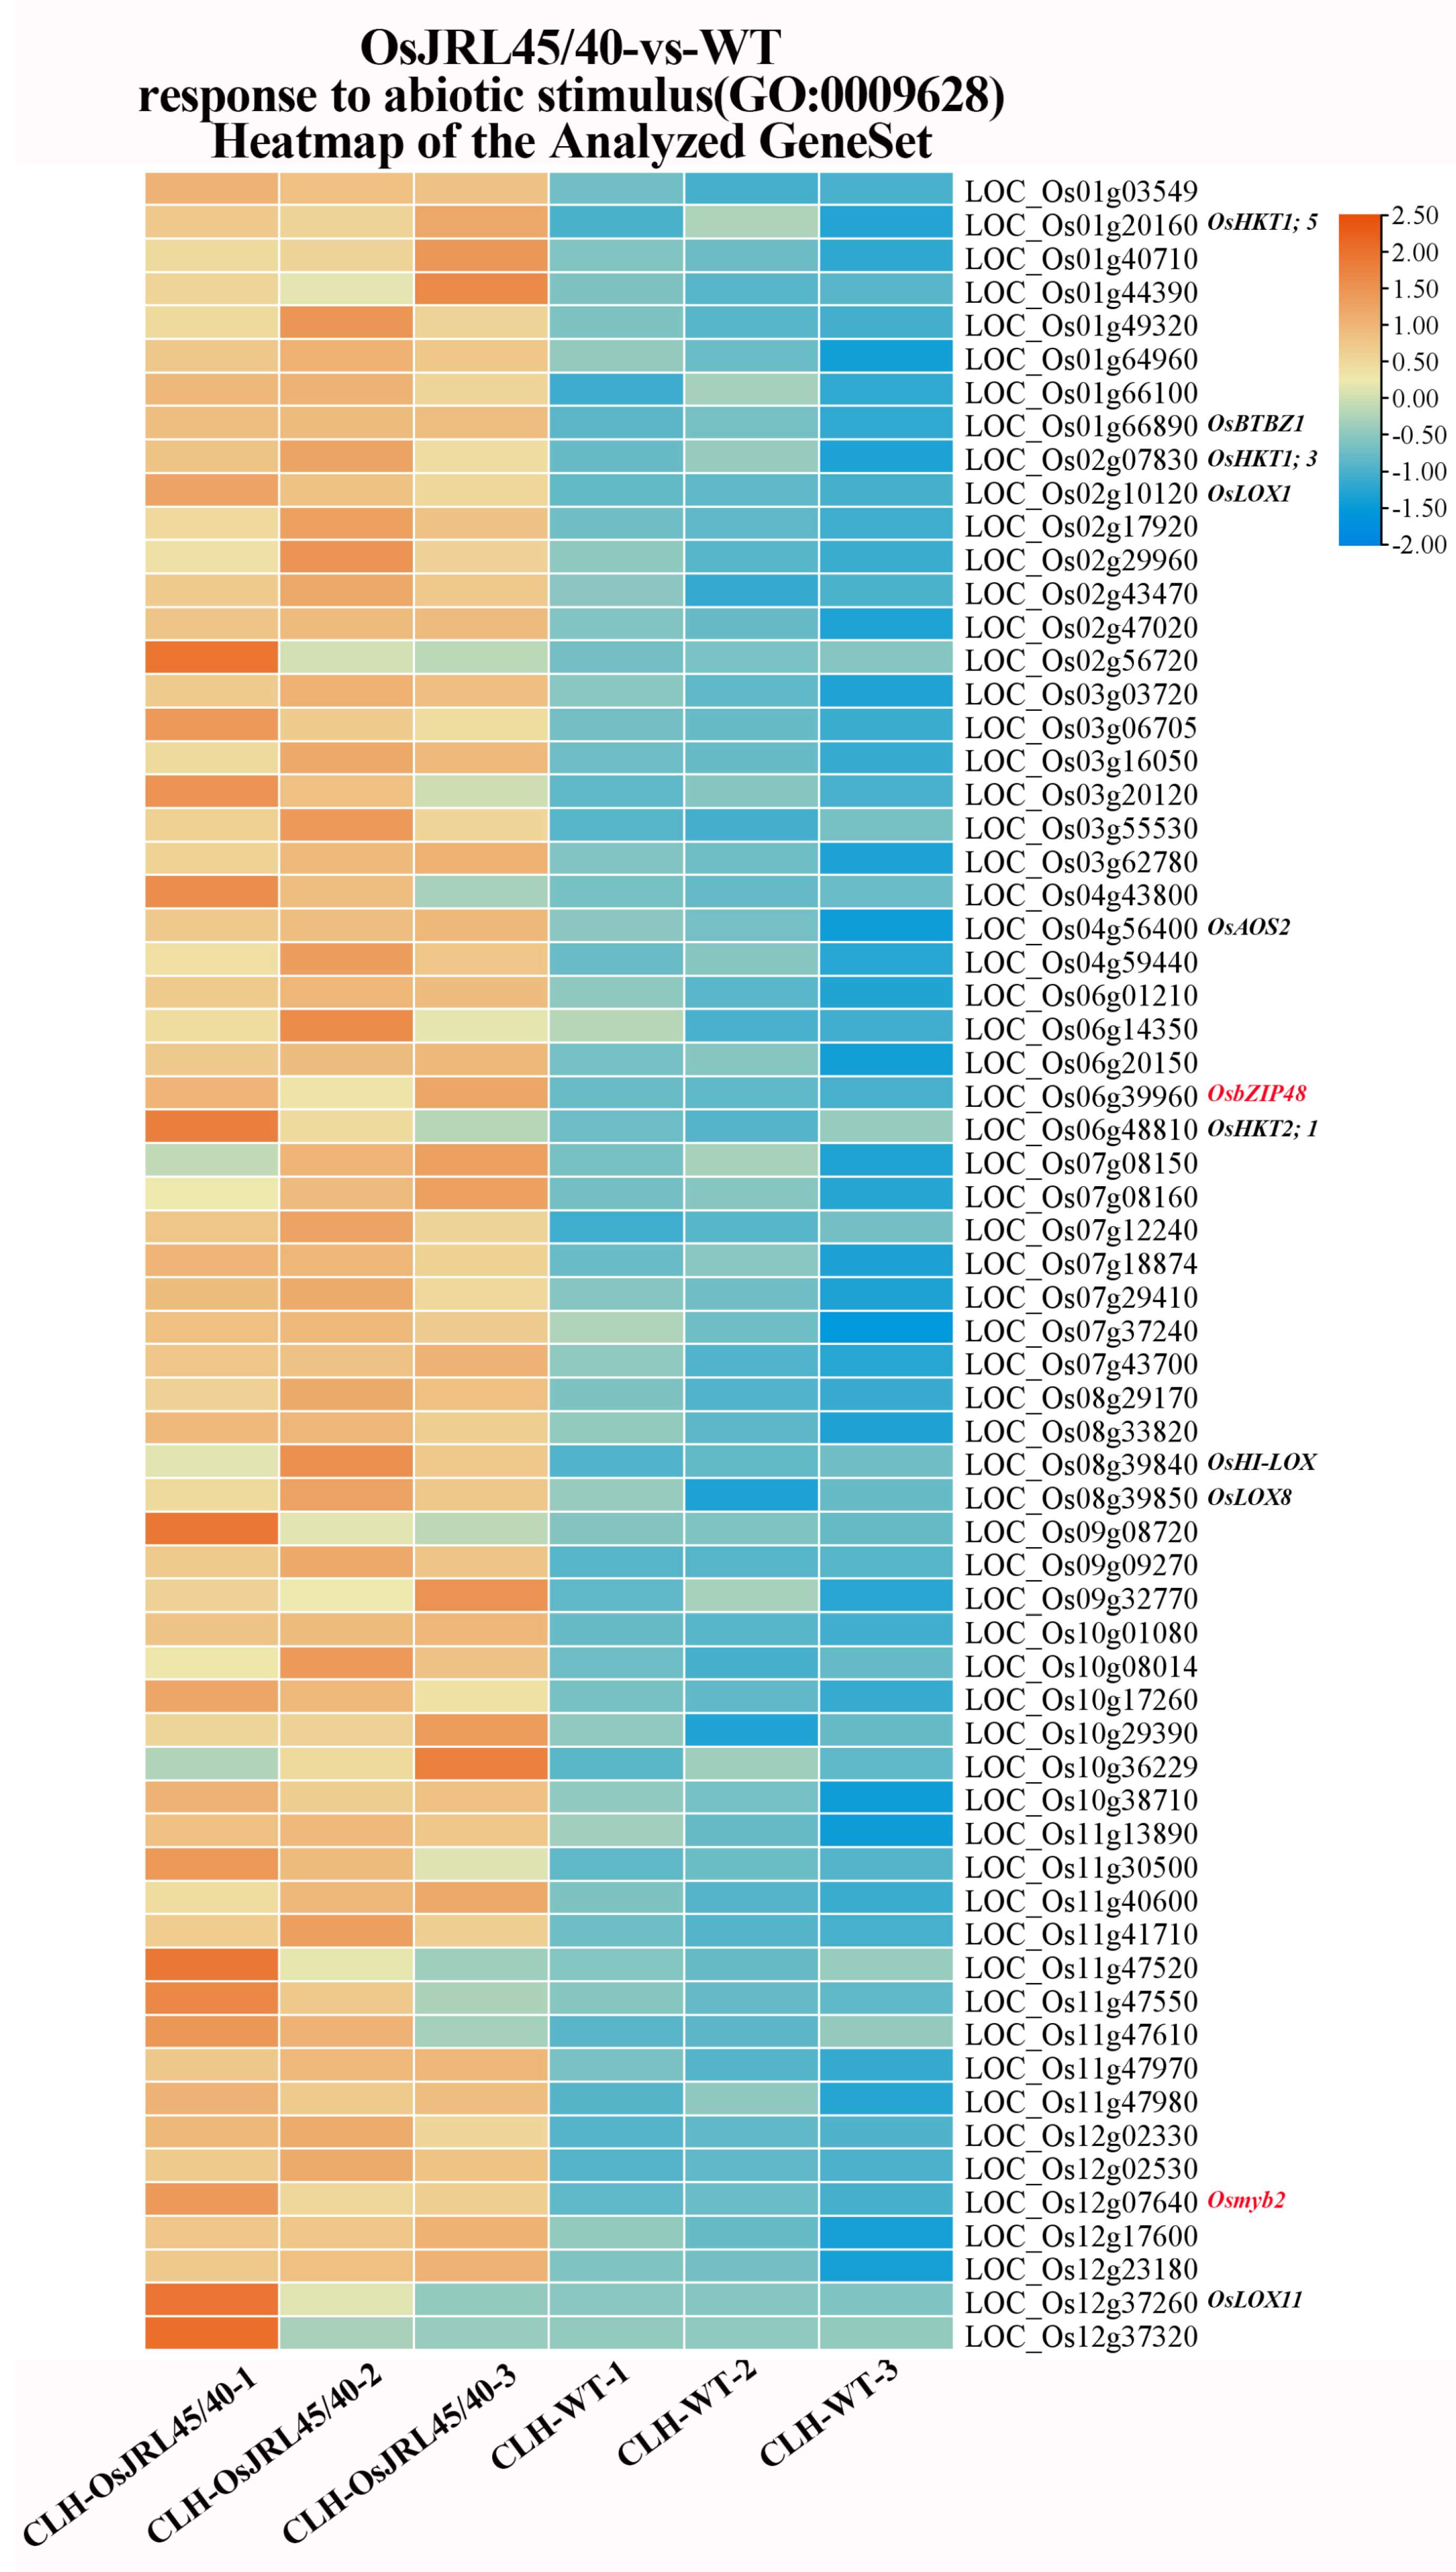
2.11. Gene Set Enrichment Analysis (GSEA) of the Response to Salt Stress

Further analysis of the Biological Process (BP) using GSEA revealed 104 DEGs were in the process “response to stress”, and 65 DEGs were in the process “response to abiotic stimulus” (Figure 12 and Figure 13). Both of these processes include Na+ transport proteins (Figure 10 and Figure 11), such as sodium transport protein (OsHKT1;5), low-affinity sodium transport protein (OsHKT1;3), and high-affinity sodium transport protein (OsHKT2;1). When rice plants are under salt stress, these transport proteins transport excess Na+ from the shoots to the roots, preventing excessive Na+ accumulation in the shoots, thereby reducing Na+ toxicity and enhancing salt tolerance. These processes also include lipoxygenase genes (OsLOX1, OsHI-LOX, OsLOX8, and OsLOX11; Figure 12 and Figure 13). Additionally, two key enzymes in the jasmonic acid (JA) biosynthesis pathway, lipoxygenase (OsLOX2) and allene oxide synthase (OsAOS2), are in the “response to stress” process (Figure 12). The JA biosynthesis pathway is involved in various signal transduction pathways and regulates physiological and molecular processes in plants; it plays an important signaling role in plant stress responses and thereby in protecting plants from salt stress. Finally, these processes both include E3 ubiquitin ligase (OsBTBZ1), galactinol synthase (OsGolS1/2), and stress membrane protein (OsSMP1), which are all involved in the regulating of the abscisic acid signaling pathway in response to salt stress. Glutamine synthetase (OsGS2) is involved in regulating the response to non-ionic osmotic stress, improving salt stress tolerance. Disease resistance protein (OsRSR1) is involved in ROS metabolism and plays an important role in maintaining the integrity of the biological membrane system and in defense against membrane lipid peroxidation under salt stress.
A bZIP transcription factor (OsbZIP48) and an MYB transcription factor (Osmyb2) were found in the “response to abiotic stimulus” process (Figure 13). bZIP transcription factors are involved in the biosynthesis of hormones such as gibberellin, JA, and auxin, while MYB transcription factors regulate gene expression, including of their own genes, by directly binding DNA. All of these results indicated that OsJRL45/40 co-transgenic plants could respond more quickly to salt stress through a variety of biological processes, including “Na+ transport protein”, “plant hormone regulation pathways”, “non-ionic osmotic stress”, “reactive oxygen species metabolism”, and “DNA transcription factors”.

3. Discussion

3.1. OsJRL45 and OsJRL40 Interact Together to Enhance the Salt Tolerance of Plants

Salt stress has a significant impact on plant growth and development, inhibiting seed germination, root and shoot growth, and plant morphology [40]. Many rice varieties are salt-sensitive and severely affected by salt stress. Lectins have been identified in various plant species [41,42,43,44,45], but their roles in responses to stress stimuli are not yet fully understood. We previously demonstrated that two genes encoding lectins, OsJRL45 and OsJRL40, regulate and enhance tolerance to salt stress in rice [34,35]. Since these genes are located close together on chromosome 4, understanding whether they interact and jointly enhance salt tolerance is of great significance.
Salt stress is a common abiotic stress that adversely affects plant development, growth, and production [33,46]. The responses of three rice cultivars, SR86, 9311, and Nip, to salt stress treatment indicated that OsJRL45 and OsJRL40 were associated with enhanced tolerance of salt stress in SR86 (Figure 1). Yeast two-hybrid and BiFC assays showed that the OsJRL45 and OsJRL40 proteins interacted (Figure 6). Transforming Nip with OsJRL45 and OsJRL40 (OsJRL45/40) genes from SR86 did not affect the plant phenotype (Figure 7), although salt tolerance was enhanced in transgenic plants at the three-leaf stage (Figure 8). In rice, salt stress disrupts the balance between reactive oxygen species (ROS) production and scavenging, leading to excessive ROS accumulation, which disrupts plant physiological functions and impedes normal growth and development [47,48]. CAT, POD, and SOD activities increased significantly in the transgenic plants, and their MDA content was significantly lower than that of the WT (Figure 9). Previous studies showed that OsJRL45 and OsJRL40 enhance the antioxidant capacity of cells and prevent excessive ROS accumulation [34,35]. The results of transformation with OsJRL45/40 from SR86 were consistent with these observations, indicating that OsJRL45 and OsJRL40 interacted and enhanced salt stress tolerance. High salt concentrations damage rice root development, accelerate leaf curling and yellowing, reduce the number of grains per panicle, and decrease the thousand-grain weight, resulting in yield reduction [49,50]. Therefore, understanding the molecular mechanisms underlying salt tolerance and screening for this trait are key steps for the development of salt-tolerant rice varieties.

3.2. Transcriptome Analysis of OsJRL45 and OsJRL40 Transgenic Seedlings under Salt Stress

Transgenic rice plants harboring OsJRL45/40 from SR86 exhibited positive physiological responses under salt stress. Key salt-responsive metabolic pathways and DEGs were explored and analyzed using transcriptomic data. RNA-seq analysis identified 1044 DEGs (638 up-regulated and 406 down-regulated) in OsJRL45/40-vs-WT before salt stress treatment and identified 834 DEGs in OsJRL45/40-vs-WT after salt stress treatment; 631 genes were up-regulated and 203 down-regulated, compared with WT plants (Figure 10A). The results of Volcano plot analyses were consistent (Figure 11A,B). Before salt stress treatment, KEGG enrichment analysis showed that the differentially expressed genes between WT and transgenic plants were involved in the “mitogen-activated protein kinase (MAPK) signaling pathway”, “plant hormone signaling”, and “phenylpropanoid biosynthesis” (Figure 10B). GO enrichment analysis showed that DEGs were mainly involved in “metabolic processes”, “responses to stress”, “catalytic activity”, and “responses to abiotic stimulus” (Figure 10C). KEGG enrichment analysis after salt stress treatment revealed that these DEGs were involved in “linoleic acid metabolism”, “photosynthesis”, “alpha-linolenic acid metabolism”, “2-glyoxylate and dicarboxylate metabolism”, “carbon fixation in photosynthetic organisms”, and “alanine, aspartic acid, and glutamate metabolism” pathways (Figure 11C). GO enrichment analysis revealed that most of these DEGs were involved in “metabolic processes”, “responses to stress”, and “responses to abiotic stimulus” (Figure 11D). Soon after salt stress treatment, a large number of genes were differentially expressed in a short period of time, indicating that the transgenic plants of OsJRL45/40 of SR86 could respond more quickly to salt stress than WT plants. GO functional analysis indicated that most DEGs were involved in the pathways “response to stress” and “response to abiotic stimulus” (Figure 10C and Figure 11D).
GSEA of GO enrichment analysis in the biological process (BP) categories “response to stress” and “response to abiotic stimulus” (Figure 12 and Figure 13) identified the Na+ transporter genes OsHKT1;5, OsHKT1;3, and OsHKT2;1. These transporters transfer excess Na+ from the shoots, thus reducing Na+ toxicity and enhancing salt tolerance in rice under salt stress [51,52,53]. The analysis also identified four lipoxygenase genes, OsLOX1, OsHI-LOX, OsLOX8, and OsLOX11. Two key enzymes lipoxygenase (OsLOX2) and allene oxide synthase (OsAOS2), which encode key enzymes in the JA synthesis pathway, which is involved in various signaling pathways and regulates many physiological and molecular processes in plants [54,55,56,57], thus protecting plants from salt stress. Additionally, the analysis identified genes involved in regulating the ABA signaling pathway, including E3 ubiquitin ligase (OsBTBZ1), galactinol synthase (OsGolS1/2), and stress membrane protein (OsSMP1); such genes respond to salt stress via ABA-dependent pathways, enhancing tolerance of abiotic stress [58,59,60]. Glutamine synthetase (OsGS2), which is involved in regulating the response to non-ionic osmotic stress, enhances rice tolerance to salt stress. The disease resistance protein (OsRSR1), which is involved in the regulation of reactive oxygen metabolism, can defend against lipid peroxidation under salt stress [61], and thus plays an important role in protecting the integrity of the biological membrane structure. The analysis also identified genes involved in the “response to abiotic stimulus” pathway, including a bZIP transcription factor (OsbZIP48), which is involved in biosynthesis of the plant hormones gibberellin, JA, and auxin [62], and an MYB transcription factor (Osmyb2) that positively regulates OsHKT1;5 to control its transcription [63]. Consistent with our previous study, co-transformation with OsJRL45/40 enhanced antioxidant enzyme activity under salt stress through non-ionic osmotic stress and reactive oxygen metabolism processes and regulated Na+-K+ homeostasis through Na+ transport proteins [34,35].

3.3. Sequence Differences between OsJRL45 and OsJRL40: Marker-Assisted Selection (MAS) Analysis for the Selection of Salt-Tolerant Rice

The development of molecular markers that can be used to screen for salt-tolerant rice varieties is crucial for selecting plants with high salt tolerance, as salt stress significantly affects rice yield and quality [64]. Molecular marker-assisted identification and selection of genes that control resistance to these factors have been used for rice improvement [22]. Previous studies showed that OsJRL45 and OsJRL40 are located on chromosome 4 [34,35,39]. The OsJRL45 and OsJRL40 gene sequences of SR86, 9311, L623, R498, Minghui63, Zhenshan97, Yu Chi, Nantehao, Qingzhen, and Meizhan were amplified by sequencing and aligned, which revealed eight single base differences in exon 1 in the OsJRL45 gene between these cultivars. The differences at positions 63 (base-pairs (bp)), 72 bp, and 123 bp corresponded to synonymous mutations after the initial ATG, while those at 209 bp, 224 bp, 245 bp, 263 bp, and 268 bp in exon 1 would result in amino acids changes (Figure 2). The single base change in exon 2 at position 1000 bp in the cultivars SR86 and Nantehao are A, resulting in a change to the amino acid Glu, whereas those in remaining cultivars are C, resulting in a change to amino acid Asp (Figure 2). In exon 1 of the OsJRL40 gene (position 131 bp), only Meizhan showed a single base change to A, and the nucleotides in the remaining cultivars were C. In exon 2 (position 1123 bp), only SR86 had a single base change to A, resulting in a change to the amino acid Ser, whereas in the remainder, the nucleotide was G, resulting in the amino acid Gly (Figure 2). However, sequencing analysis of the sequences between the OsJRL45 and OsJRL40 genes of SR86, R498, Minghui63, and Zhenshan97 showed that the distance between the two genes was only 2605 bp, and at 204 bp downstream of OsJRL45, the SR86 sequence was missing the 25 bp sequence GCGCACGACGCGGCCGCCAGCGTTC, which was located 2401 bp upstream of OsJRL40. Based on the differences between the genes and the binding of OsJRL45 and OsJRL40, molecular marker primers were designed for use as molecular markers and for validation.
The analyses of the recombinant inbred lines constructed by the hybridization of SR86 and 9311 under salt stress and the molecular marker primers developed in this study showed that the molecular-tagged primers based on the nucleotide differences between OsJRL45 and OsJRL40 could be used to screen salt-tolerant plants (Figure 2, Figure 3 and Figure S1 and Table 1). In order to further verify the accuracy of the molecular markers developed in this study for screening salt-tolerant rice, some rice plants commonly used in production were used for analysis. Rice varieties with higher salt tolerance (Foer B, Chaimi, Yuejing, Xiangzao 32, Nantehao, R288, Shuhui 527, Aizinuo, and Xiang 628S) produced gel electrophoresis results that were very similar to those of SR86, while those of salt-intolerant plants were similar to those of 9311 (Figure 4). This suggests that the novel molecular markers designed to identify salt-tolerant plants in this study identified more than 90% of the plants with salt tolerance, indicating that they would have high specificity for the screening of salt-tolerant plants. Salt-tolerant plants were randomly selected in the sixth generation of RILs derived from the R86 and 9311 hybrids, and the genotypes of the RILs were verified using specific marker primers based on differences between SR86 and 9311 sequences. Agarose gel electrophoresis showed that plants with higher salt tolerance were more genetically similar to SR86, while individuals with less salt tolerance were genetically more similar to 9311 (Figure 5E). These results confirm the high specificity of the molecular markers developed in this study for the identification of salt-tolerant rice cultivars. This targeted screening approach minimized the number of undesired traits and reduced the risk of linkage drag while maintaining the desirable genetic background of the parent varieties. This study demonstrated the effectiveness of these novel molecular markers in screens to identify salt-tolerant rice plants, showing that molecular markers based on differences in intergenic nucleotide sequences can facilitate the process of selective breeding.

4. Materials and Methods

4.1. Experimental Plants

The WT rice varieties SR86, Nip, and 9311 used in this study were provided by the rice germplasm resource platform of the Hunan Rice Research Institute [34,35,39,65]. All rice varieties were grown in the field at the Hunan Normal University in Changsha, Hunan Province. All of the experiments reported in this paper comply with the institutional, national, and international guidelines concerning plant genetic resources.
To construct the population of SR86/9311 RILs, SR86 and 9311 plants were crossed. Self-pollinated F1 plants were used to produce F2 seeds; after harvest, isolated F2 progeny were self-pollinated, and individual salt-tolerant and salt-intolerant plants were selected for further inbreeding under salt stress treatment. The RIL population was constructed by continuous inbreeding under salt stress treatment for five generations.
The OsJRL45 and OsJRL40 genes from SR86 were amplified by PCR and inserted into the vector pCAMBIA1300 using the gene recombination method. The relevant constructed vector primers are listed in Supplementary Table S1. Nip plants were transformed using Agrobacterium tumefaciens-mediated transformation to obtain OsJRL45/40 transgenic plants. The phenotype and agronomic traits of the transgenic plants were analyzed in the T2 generation. In addition, a hybrid population was constructed using SR86 and 9311 as parents, from which salt-tolerant plants were screened for subsequent research.

4.2. Construction of Segregating Populations

SR86 and 9311 were crossed in the field at Hunan Normal University. The F1 generation was self-pollinated to obtain F2 seeds. F2 plants were treated with 9‰ salt stress at the seedling stage.

4.3. Marker-Assisted Selection

Total genomic DNA was extracted from rice leaves using the cetyltrimethylammonium bromide (CTAB) method [66]. DNA was analyzed by PCR with a total reaction volume of 10 μL in a PCR instrument (Bio-Rad, T100TM Thermal Cycler, Foster City, CA, USA). The primers are listed in Supplementary Table S3. The PCR amplification regime was as follows: initial denaturation at 94 °C for 5 min, followed by 35 cycles of 94 °C for 30 s, 58 °C for 30 s, and 72 °C for 45 s, with a final extension at 72 °C for 5 min. The PCR products were separated by electrophoresis on 2% agarose gels and visualized under UV light.

4.4. Salt Stress Treatment of Transgenic Plants

Uniform, plump rice seeds were selected and surface-sterilized in 0.3% sodium hypochlorite for 20 min. Seeds were rinsed three times in distilled water, evenly spread across two layers of moist filter paper in a Petri dish, and incubated at 37 °C. After germination, seedlings were transplanted into a 96-well tray containing culture solution. The nutrient solution was changed every 4 days. Rice seedlings were grown under conventional hydroponic conditions until the three-leaf stage (approximately 14 days), then transferred to a hydroponic solution containing 9‰ NaCl for 4 days, and finally moved to a conventional hydroponic solution for recovery for 4 days.

4.5. Measurement of Physiological Parameters

Superoxide dismutase (SOD), peroxidase (POD), catalase (CAT), malondialdehyde (MDA), and proline contents were measured according to the kit manufacturer’s instructions (Jiancheng Bioengineering Institute, Nanjing, China) [34,35,39]. Measurements were made before treatment and 24 h after salt stress treatment. All experiments involved three independent biological replicates; data are reported as the mean ± standard deviation (SD).

4.6. RNA Extraction and Quantitative Real-Time PCR (qRT-PCR)

Rice seedlings at the three-leaf stage from the WT and OsJRL45/40 transgenic lines were treated with 9‰ NaCl. Total RNA was extracted using the TRIzol Reagent (Invitrogen, Waltham, MA, USA) and reverse transcribed using the HiScript II Q RT SuperMix for qPCR (+gDNA wiper) (Vazyme, R223-01, Nanjing, China). qRT-PCR was performed using the ChamQ Universal SYBR qPCR Master Mix (Vazyme, Q711-02, Nanjing, China), with rice Osactin as the internal reference gene. Relative gene expression was calculated using the 2−ΔΔCt method and expressed as the mean ± SD [67]. All primers used in the RT-qPCR analysis are listed in the Supplementary Table S2.

4.7. Transcriptomic Data Analysis

Whole WT and OsJRL45/40 transgenic plants were sampled at the three-leaf stage, before treatment, and 24 h after 9‰ NaCl stress treatment. Three biological replicates were collected for each plant. Samples were frozen in liquid nitrogen and sent on dry ice to OE Biotech Co. Ltd., Shanghai, China for transcriptomic analysis. The RNA-seq data were analyzed as described previously [34,35,68]. The bioinformatics analysis and graphical plotting were performed using the OE Biotech cloud platform. Bioinformatic analysis was performed using the OE Cloud tools at https://cloud.oebiotech.com/task/ accessed on 21 December 2023. The volcano map and other graphics were drawn using R (https://www.r-project.org/, accessed on 25 December 2023) on the OE Cloud platform (https://cloud.oebiotech.com/task/, accessed on 25 December 2023).

4.8. Yeast Two-Hybrid (Y2H) Assays

Yeast two-hybrid assays were performed using the GAL4 yeast two-hybrid system. The coding sequence (CDS) of OsJRL45 was cloned into the pGADT7 vector to generate AD-OsJRL45. The CDS of OsJRL40 was cloned into the pGBKT7 vector to generate BD-OsJRL40. The relevant primers are listed in the Supplementary Table S1. The Y2HGold yeast strain was co-transformed with the AD-OsJRL45 and BD-OsJRL40 constructs and grown on the selection media SD/-Trp/-Leu (lacking tryptophan and leucine) and SD/-Trp/-Leu/-His/-Ade + X-α-Gal (lacking adenine, tryptophan, leucine, and histidine) [69].

4.9. Bimolecular Fluorescence Complementation (BiFC) Assay

The CDS of OsJRL45 was fused to the C-terminus of yellow fluorescent protein (YFP), and the CDS of OsJRL40 was fused to the N-terminus of YFP to construct the co-expression vectors OsJRL40-YFPN and OsJRL45-YFPC. The specific primers used are listed in the Supplementary Table S1. The plasmids were introduced into Agrobacterium tumefaciens (GV3101) by electroporation, and the bacterial suspension was adjusted to an OD 600 of approximately 0.6. Tobacco plants (Nicotiana benthamiana) with good growth were selected. The lower epidermis of their leaves was injected with the bacterial suspension and labeled [70]. Tobacco plants were cultured under low light for 2 days following injection. The injected leaves were sampled, mounted on slides, and observed under a confocal laser scanning microscope (Nikon C2-ER) for image capture and recording.

4.10. Statistical Analysis

Data are presented as the mean ± SD of three or more independent replicates. The mean of the replicates for each experiment was calculated using PASW Statistics 18 software. Statistical significance was determined using one-way ANOVA and Student’s t-test with p < 0.05. Bar charts were created using GraphPad Prism 9. Heat maps were constructed and drawn using TBtools-II v.2.119 software [71].

5. Conclusions

Based on the results of the treatments and RT-qPCR analysis of salt-tolerant cultivars SR86, 9311, and Nip under salt stress, we speculated that OsJRL45 and OsJRL40 genes contributed to the stronger salt tolerance of SR86. To further validate this hypothesis, we analyzed the sequence differences between the OsJRL45 and OsJRL40 genes in SR86 and 9311 using sequencing technology, and developed molecular markers for salt-tolerant screening based on these differences. Subsequently, we constructed a recombinant inbred line population using salt-tolerant SR86 and conventional variety 9311 as parental varieties and verified the effectiveness of the developed molecular markers using rice varieties commonly used for rice production.
Yeast two-hybrid and bimolecular fluorescence complementation further demonstrated the interaction between OsJRL45 and OsJRL40 proteins. In addition, OsJRL45/40 co-transgenic plants were created by genetic recombination technology, and salt stress treatment and physiological parameters were measured. The results showed that compared with the wild type, the antioxidant enzyme activities (including CAT, POD, SOD) and proline (Pro) content of OsJRL45/40 co-transgenic rice were significantly increased, while their malondialdehyde (MDA) content was significantly reduced, suggesting that synergy between OsJRL45 and OsJRL40 increased salt tolerance.
In addition, transcriptome analysis revealed 834 differentially expressed genes (DEGs) in the OsJRL45/40 co-transgenic plants under salt stress conditions. GO and KEGG enrichment analysis showed that these differential genes were mainly involved in metabolic pathways related to antioxidant response and osmotic homeostasis, which are known to play a key role in salt stress tolerance.
In summary, synergy between the activities of OsJRL45 and OsJRL40 not only increased salt tolerance in rice, but the development of molecular markers based on differences in the sequences of OsJRL45 and OsJRL40 between the salt-tolerant variety SR86 and the salt-sensitive variety 9311 was successful in identifying salt-tolerant rice varieties.

Supplementary Materials

The supporting information can be downloaded at: https://www.mdpi.com/article/10.3390/ijms252010912/s1.

Author Contributions

X.Y., M.L. and X.D. designed the experiments, analyzed the data, and revised the manuscript. X.Y. performed the experiments and wrote the manuscript. Q.G., Y.L., R.B., S.Z. and J.F. helped organize the experimental data. X.Y., M.L. and X.D. analyzed the data and revised the manuscript. F.W., W.L., Y.L., R.B., S.Z., J.F. and L.C. provided assistance during the experiments. All authors have read and agreed to the published version of the manuscript.

Funding

This research was funded by the National Key Research and Development Program of China (grant numbers 2016YFD0101107 and 2018YFD0100902), the Hunan Province Key Research and Development Plan (grant number 2016JC2023), and Natural Science Foundation of Hunan Province in China (2022JJ30377).

Institutional Review Board Statement

Not applicable.

Informed Consent Statement

Not applicable.

Data Availability Statement

All of the data supporting the conclusions of this article are provided within the article and in Supplementary Materials. All of the data and materials are available upon reasonable request from the corresponding author.

Conflicts of Interest

The authors declare that the research was conducted in the absence of any commercial or financial relationships that could be construed as potential conflicts of interest.

References

  1. Wing, R.A.; Purugganan, M.D.; Zhang, Q. The rice genome revolution: From an ancient grain to Green Super Rice. Nat. Rev. Genet. 2018, 19, 505–517. [Google Scholar] [CrossRef] [PubMed]
  2. Butcher, K.; Wick, A.F.; DeSutter, T.; Chatterjee, A.; Harmon, J. Soil Salinity: A Threat to Global Food Security. Agron. J. 2016, 108, 2189–2200. [Google Scholar] [CrossRef]
  3. Godoy, F.; Olivos-Hernandez, K.; Stange, C.; Handford, M. Abiotic Stress in Crop Species: Improving Tolerance by Applying Plant Metabolites. Plants 2021, 10, 186. [Google Scholar] [CrossRef]
  4. van Dijk, M.; Morley, T.; Rau, M.L.; Saghai, Y. A meta-analysis of projected global food demand and population at risk of hunger for the period 2010–2050. Nat. Food 2021, 2, 494–501. [Google Scholar] [CrossRef]
  5. Ashraf, M.; Akram, N.A. Improving salinity tolerance of plants through conventional breeding and genetic engineering: An analytical comparison. Biotechnol. Adv. 2009, 27, 744–752. [Google Scholar] [CrossRef]
  6. Rasheed, A.; Li, H.; Nawaz, M.; Mahmood, A.; Hassan, M.U.; Shah, A.N.; Hussain, F.; Azmat, S.; Gillani, S.F.A.; Majeed, Y.; et al. Molecular tools, potential frontiers for enhancing salinity tolerance in rice: A critical review and future prospective. Front. Plant Sci. 2022, 13, 966749. [Google Scholar] [CrossRef]
  7. Bhatt, T.; Sharma, A.; Puri, S.; Minha, A.P. Salt Tolerance Mechanisms and Approaches: Future Scope of Halotolerant Genes and Rice Landraces. Rice Sci. 2020, 27, 368–383. [Google Scholar] [CrossRef]
  8. Hussain, S.; Zhang, J.H.; Zhong, C.; Zhu, L.F.; Cao, X.C.; Yu, S.M.; James, A.B.; Hu, J.J.; Jin, Q.Y. Effects of salt stress on rice growth, development characteristics, and the regulating ways: A review. J. Integr. Agric. 2017, 16, 2357–2374. [Google Scholar] [CrossRef]
  9. Wu, H.H. Plant salt tolerance and Na+ sensing and transport. Crop J. 2018, 6, 215–225. [Google Scholar] [CrossRef]
  10. Chen, G.; Liu, C.; Gao, Z.; Zhang, Y.; Zhang, A.; Zhu, L.; Hu, J.; Ren, D.; Yu, L.; Xu, G.; et al. Variation in the Abundance of OsHAK1 Transcript Underlies the Differential Salinity Tolerance of an indica and a japonica Rice Cultivar. Front. Plant Sci. 2017, 8, 2216. [Google Scholar] [CrossRef]
  11. Chen, G.; Hu, Q.; Luo, L.; Yang, T.; Zhang, S.; Hu, Y.; Yu, L.; Xu, G. Rice potassium transporter OsHAK1 is essential for maintaining potassium-mediated growth and functions in salt tolerance over low and high potassium concentration ranges. Plant Cell Environ. 2015, 38, 2747–2765. [Google Scholar] [CrossRef] [PubMed]
  12. Rai, H.; Yokoyama, S.; Satoh-Nagasawa, N.; Furukawa, J.; Nomi, T.; Ito, Y.; Fujimura, S.; Takahashi, H.; Suzuki, R.; Yousra, E.; et al. Cesium Uptake by Rice Roots Largely Depends Upon a Single Gene, HAK1, Which Encodes a Potassium Transporter. Plant Cell Physiol. 2017, 58, 1486–1493. [Google Scholar] [CrossRef]
  13. Wang, J.; Nan, N.; Li, N.; Liu, Y.; Wang, T.J.; Hwang, I.; Liu, B.; Xu, Z.Y. A DNA Methylation Reader-Chaperone Regulator-Transcription Factor Complex Activates OsHKT1;5 Expression during Salinity Stress. Plant Cell 2020, 32, 3535–3558. [Google Scholar] [CrossRef]
  14. Tian, Q.; Shen, L.; Luan, J.; Zhou, Z.; Guo, D.; Shen, Y.; Jing, W.; Zhang, B.; Zhang, Q.; Zhang, W. Rice shaker potassium channel OsAKT2 positively regulates salt tolerance and grain yield by mediating K+ redistribution. Plant Cell Environ. 2021, 44, 2951–2965. [Google Scholar] [CrossRef]
  15. Hao, S.H.; Wang, Y.R.; Yan, Y.X.; Liu, Y.H.; Wang, J.Y.; Chen, S. A Review on Plant Responses to Salt Stress and Their Mechanisms of Salt Resistance. Horticulturae 2021, 7, 132. [Google Scholar] [CrossRef]
  16. Liu, C.T.; Mao, B.G.; Yuan, D.Y.; Chu, C.C.; Duan, M.J. Salt tolerance in rice: Physiological responses and molecular mechanisms. Crop J. 2022, 10, 13–25. [Google Scholar] [CrossRef]
  17. Das, G.; Patra, J.K.; Baek, K.H. Insight into MAS: A Molecular Tool for Development of Stress Resistant and Quality of Rice through Gene Stacking. Front. Plant Sci. 2017, 8, 985. [Google Scholar]
  18. Tamiru, M.; Takagi, H.; Abe, A.; Yokota, T.; Kanzaki, H.; Okamoto, H.; Saitoh, H.; Takahashi, H.; Fujisaki, K.; Oikawa, K.; et al. A chloroplast-localized protein LESION AND LAMINA BENDING affects defence and growth responses in rice. New Phytol. 2016, 210, 1282–1297. [Google Scholar] [CrossRef]
  19. Nagata, K.; Ando, T.; Nonoue, Y.; Mizubayashi, T.; Kitazawa, N.; Shomura, A.; Matsubara, K.; Ono, N.; Mizobuchi, R.; Shibaya, T.; et al. Advanced backcross QTL analysis reveals complicated genetic control of rice grain shape in a japonica x indica cross. Breed. Sci. 2015, 65, 308–318. [Google Scholar] [CrossRef]
  20. Fekih, R.; Tamiru, M.; Kanzaki, H.; Abe, A.; Yoshida, K.; Kanzaki, E.; Saitoh, H.; Takagi, H.; Natsume, S.; Undan, J.R.; et al. The rice (Oryza sativa L.) LESION MIMIC RESEMBLING, which encodes an AAA-type ATPase, is implicated in defense response. Mol. Genet. Genom. 2015, 290, 611–622. [Google Scholar] [CrossRef]
  21. Fekih, R.; Ishimaru, Y.; Okada, S.; Maeda, M.; Miyagi, R.; Obana, T.; Suzuki, K.; Inamori, M.; Enoki, H.; Yamasaki, M. High-Density Linkage Maps from Japanese Rice japonica Recombinant Inbred Lines Using Genotyping by Random Amplicon Sequencing-Direct (GRAS-Di). Plants 2023, 12, 929. [Google Scholar] [CrossRef] [PubMed]
  22. Hasan, M.M.; Rafii, M.Y.; Ismail, M.R.; Mahmood, M.; Rahim, H.A.; Alam, M.A.; Ashkani, S.; Malek, M.A.; Latif, M.A. Marker-assisted backcrossing: A useful method for rice improvement. Biotechnol. Biotechnol. Equip. 2015, 29, 237–254. [Google Scholar] [CrossRef]
  23. Prabhu, A.S.; Filippi, M.C.; Silva, G.B.; Silva Lobo, V.L.; Morais, O.P. An Unprecedented Outbreak of Rice Blast on a Newly Released Cultivar BRS Colosso in Brazil. In Advances in Genetics, Genomics and Control of Rice Blast Disease; Springer: Dordrecht, The Netherlands, 2009. [Google Scholar]
  24. Collard, B.C.; Mackill, D.J. Marker-assisted selection: An approach for precision plant breeding in the twenty-first century. Philos. Trans. R. Soc. Lond. B Biol. Sci. 2008, 363, 557–572. [Google Scholar] [CrossRef]
  25. Li, Y.; Zhang, J.; Hu, F.; Adolf, A.; Ackah, M.; Justice, A.A.; Lin, Q.; Li, L.; Zhao, W.G. Cloning and abiotic stress expression analysis of galactose-binding lectin (GBL) gene from mulberry and its prokaryotic expression in E. coli. J. Hortic. Sci. Biotechnol. 2021, 96, 24–33. [Google Scholar] [CrossRef]
  26. Tsaneva, M.; Van Damme, E.J.M. 130 years of Plant Lectin Research. Glycoconj. J. 2020, 37, 533–551. [Google Scholar] [CrossRef]
  27. Witzel, K.; Matros, A.; Bertsch, U.; Aftab, T.; Rutten, T.; Ramireddy, E.; Melzer, M.; Kunze, G.; Mock, H.P. The Jacalin-Related Lectin HvHorcH Is Involved in the Physiological Response of Barley Roots to Salt Stress. Int. J. Mol. Sci. 2021, 22, 10248. [Google Scholar] [CrossRef]
  28. Zhang, H.; Deng, C.; Yao, J.; Zhang, Y.L.; Zhang, Y.N.; Deng, S.; Zhao, N.; Sa, G.; Zhou, X.; Lu, C.; et al. Populus euphratica JRL Mediates ABA Response, Ionic and ROS Homeostasis in Arabidopsis under Salt Stress. Int. J. Mol. Sci. 2019, 20, 815. [Google Scholar] [CrossRef]
  29. He, X.; Li, L.; Xu, H.; Xi, J.; Cao, X.; Xu, H.; Rong, S.; Dong, Y.; Wang, C.; Chen, R.; et al. A rice jacalin-related mannose-binding lectin gene, OsJRL, enhances Escherichia coli viability under high salinity stress and improves salinity tolerance of rice. Plant Biol. (Stuttg.) 2017, 19, 257–267. [Google Scholar] [CrossRef]
  30. Shekha, S.; Kuma, D. Ectopic Overexpression of Lectin in Transgenic Brassica juncea Plants Exhibit Resistance to Fungal Phytopathogen and Showed Alleviation to Salt and Drought Stress. J. Bioeng. Biomed. Sci. 2015, 5, 147. [Google Scholar] [CrossRef]
  31. Sun, Y.; Qiao, Z.; Muchero, W.; Chen, J.G. Lectin Receptor-Like Kinases: The Sensor and Mediator at the Plant Cell Surface. Front. Plant Sci. 2020, 11, 596301. [Google Scholar] [CrossRef]
  32. Passricha, N.; Saifi, S.K.; Kharb, P.; Tuteja, N. Rice lectin receptor-like kinase provides salinity tolerance by ion homeostasis. Biotechnol. Bioeng. 2020, 117, 498–510. [Google Scholar] [CrossRef] [PubMed]
  33. Kaur, N.; Prashanth, K.H.; Bhatti, M.S.; Pati, P.K. OsSalT gene cloned from rice provides evidence of its role in salinity and drought stress tolerance. Plant Sci. 2022, 320, 111306. [Google Scholar] [CrossRef] [PubMed]
  34. Gao, Q.M.; Yin, X.L.; Wang, F.; Zhang, C.Z.; Xiao, F.C.; Wang, H.Y.; Hu, S.C.; Liu, W.H.; Zhou, S.Q.; Chen, L.B.; et al. Jacalin-related lectin 45 (OsJRL45) isolated from ‘sea rice 86’ enhances rice salt tolerance at the seedling and reproductive stages. BMC Plant Biol. 2023, 23, 553. [Google Scholar] [CrossRef] [PubMed]
  35. Gao, Q.M.; Yin, X.L.; Wang, F.; Hu, S.C.; Liu, W.H.; Chen, L.B.; Dai, X.J.; Liang, M.Z. OsJRL40, a Jacalin-Related Lectin Gene, Promotes Salt Stress Tolerance in Rice. Int. J. Mol. Sci. 2023, 24, 7441. [Google Scholar] [CrossRef]
  36. Chen, R.S.; Cheng, Y.F.; Han, S.Y.; Van Handel, B.; Dong, L.; Li, X.M.; Xie, X.Q. Whole genome sequencing and comparative transcriptome analysis of a novel seawater adapted, salt-resistant rice cultivar—Sea rice 86. BMC Genom. 2017, 18, 655. [Google Scholar] [CrossRef]
  37. Sun, Y.; Song, K.; Guo, M.; Wu, H.; Ji, X.; Hou, L.; Liu, X.; Lu, S. A NAC Transcription Factor from ‘Sea Rice 86’ Enhances Salt Tolerance by Promoting Hydrogen Sulfide Production in Rice Seedlings. Int. J. Mol. Sci. 2022, 23, 6435. [Google Scholar] [CrossRef]
  38. Wang, G.; Weng, L.; Huang, Y.; Ling, Y.; Zhen, Z.; Lin, Z.; Hu, H.; Li, C.; Guo, J.; Zhou, J.L.; et al. Microbiome-metabolome analysis directed isolation of rhizobacteria capable of enhancing salt tolerance of Sea Rice 86. Sci. Total Environ. 2022, 843, 156817. [Google Scholar] [CrossRef]
  39. Gao, Q.M.; Wang, H.Y.; Yin, X.L.; Wang, F.; Hu, S.C.; Liu, W.H.; Chen, L.B.; Dai, X.J.; Liang, M.Z. Identification of Salt Tolerance Related Candidate Genes in ‘Sea Rice 86’ at the Seedling and Reproductive Stages Using QTL-Seq and BSA-Seq. Genes 2023, 14, 458. [Google Scholar] [CrossRef]
  40. Liang, W.; Ma, X.; Wan, P.; Liu, L. Plant salt-tolerance mechanism: A review. Biochem. Biophys. Res. Commun. 2018, 495, 286–291. [Google Scholar] [CrossRef]
  41. Quan, X.Y.; Meng, C.; Xie, C.J.; Sun, H.F.; Xu, B.Y.; Bermudez, R.S.; He, W.X. Genome-Wide and Transcriptome Analysis of Jacalin-Related Lectin Genes in Barley and the Functional Characterization of HvHorcH in Low-Nitrogen Tolerance in Arabidopsis. Int. J. Mol. Sci. 2023, 24, 16641. [Google Scholar] [CrossRef]
  42. Zhang, Z.; Huang, B.; Chen, J.; Jiao, Y.; Guo, H.; Liu, S.; Ramakrishnan, M.; Qi, G. Genome-Wide Identification of JRL Genes in Moso Bamboo and Their Expression Profiles in Response to Multiple Hormones and Abiotic Stresses. Front. Plant Sci. 2021, 12, 809666. [Google Scholar] [CrossRef] [PubMed]
  43. Han, Y.J.; Zhong, Z.H.; Song, L.L.; Stefan, O.; Wang, Z.H.; Lu, G.L. Evolutionary analysis of plant jacalin-related lectins (JRLs) family and expression of rice JRLs in response to Magnaporthe oryzae. J. Integr. Agric. 2018, 17, 1252–1266. [Google Scholar] [CrossRef]
  44. Song, M.; Xu, W.; Xiang, Y.; Jia, H.; Zhang, L.; Ma, Z. Association of jacalin-related lectins with wheat responses to stresses revealed by transcriptional profiling. Plant Mol. Biol. 2014, 84, 95–110. [Google Scholar] [CrossRef] [PubMed]
  45. Nagano, A.J.; Fukao, Y.; Fujiwara, M.; Nishimura, M.; Hara-Nishimura, I. Antagonistic jacalin-related lectins regulate the size of ER body-type beta-glucosidase complexes in Arabidopsis thaliana. Plant Cell Physiol. 2008, 49, 969–980. [Google Scholar] [CrossRef]
  46. Kaur, N.; Sagar, A.; Sharma, P.; Ashish; Pati, P.K. Structural insights into rice SalTol QTL located SALT protein. Sci. Rep. 2020, 10, 16589. [Google Scholar] [CrossRef]
  47. Akladious, S.A.; Mohamed, H.I. Ameliorative effects of calcium nitrate and humic acid on the growth, yield component and biochemical attribute of pepper (Capsicum annuum) plants grown under salt stress. Sci. Hortic. 2018, 236, 244–250. [Google Scholar] [CrossRef]
  48. Kohli, S.K.; Khanna, K.; Bhardwaj, R.; Abd Allah, E.F.; Ahmad, P.; Corpas, F.J. Assessment of Subcellular ROS and NO Metabolism in Higher Plants: Multifunctional Signaling Molecules. Antioxidants 2019, 8, 641. [Google Scholar] [CrossRef]
  49. Razzaq, A.; Ali, A.; Safdar, L.B.; Zafar, M.M.; Rui, Y.; Shakeel, A.; Shaukat, A.; Ashraf, M.; Gong, W.; Yuan, Y. Salt stress induces physiochemical alterations in rice grain composition and quality. J. Food Sci. 2020, 85, 14–20. [Google Scholar] [CrossRef] [PubMed]
  50. van Zelm, E.; Zhang, Y.; Testerink, C. Salt Tolerance Mechanisms of Plants. Annu. Rev. Plant Biol. 2020, 71, 403–433. [Google Scholar] [CrossRef]
  51. Gao, R.; Jia, Y.; Xu, X.; Fu, P.; Zhou, J.; Yang, G. Structural insights into the Oryza sativa cation transporters HKTs in salt tolerance. J. Integr. Plant Biol. 2024, 66, 700–708. [Google Scholar] [CrossRef]
  52. Yu, J.; Zhu, C.; Xuan, W.; An, H.; Tian, Y.; Wang, B.; Chi, W.; Chen, G.; Ge, Y.; Li, J.; et al. Genome-wide association studies identify OsWRKY53 as a key regulator of salt tolerance in rice. Nat. Commun. 2023, 14, 3550. [Google Scholar] [CrossRef] [PubMed]
  53. Song, J.; Yang, H.; Qiao, C.; Zhu, C.; Bai, T.; Du, H.; Ma, S.; Wang, N.; Luo, C.; Zhang, Y.; et al. Natural variations of chlorophyll fluorescence and ion transporter genes influenced the differential response of japonica rice germplasm with different salt tolerances. Front. Plant Sci. 2023, 14, 1095929. [Google Scholar] [CrossRef]
  54. Muzaffar, A.; Chen, Y.S.; Lee, H.T.; Wu, C.C.; Le, T.T.; Liang, J.Z.; Lu, C.H.; Balasubramaniam, H.; Lo, S.F.; Yu, L.C.; et al. A newly evolved rice-specific gene JAUP1 regulates jasmonate biosynthesis and signalling to promote root development and multi-stress tolerance. Plant Biotechnol. J. 2024, 22, 1417–1432. [Google Scholar] [CrossRef]
  55. Shikha, D.; Jakhar, P.; Satbhai, S.B. Role of jasmonate signaling in the regulation of plant responses to nutrient deficiency. J. Exp. Bot. 2023, 74, 1221–1243. [Google Scholar] [CrossRef]
  56. Ndecky, S.; Nguyen, T.H.; Eiche, E.; Cognat, V.; Pflieger, D.; Pawar, N.; Betting, F.; Saha, S.; Champion, A.; Riemann, M.; et al. Jasmonate signaling controls negative and positive effectors of salt stress tolerance in rice. J. Exp. Bot. 2023, 74, 3220–3239. [Google Scholar] [CrossRef]
  57. Asif, S.; Jan, R.; Kim, N.; Asaf, S.; Lubna; Khan, M.A.; Kim, E.G.; Jang, Y.H.; Bhatta, D.; Lee, I.J.; et al. Halotolerant endophytic bacteria alleviate salinity stress in rice (Oryza sativa L.) by modulating ion content, endogenous hormones, the antioxidant system and gene expression. BMC Plant Biol. 2023, 23, 494. [Google Scholar] [CrossRef]
  58. Feng, Z.; Xu, Y.; Xie, Z.; Yang, Y.; Lu, G.; Jin, Y.; Wang, M.; Liu, M.; Yang, H.; Li, W.; et al. Overexpression of Abscisic Acid Biosynthesis Gene OsNCED3 Enhances Survival Rate and Tolerance to Alkaline Stress in Rice Seedlings. Plants 2024, 13, 1713. [Google Scholar] [CrossRef]
  59. Jin, X.; Li, X.; Xie, Z.; Sun, Y.; Jin, L.; Hu, T.; Huang, J. Nuclear factor OsNF-YC5 modulates rice seed germination by regulating synergistic hormone signaling. Plant Physiol. 2023, 193, 2825–2847. [Google Scholar] [CrossRef] [PubMed]
  60. Zheng, S.W.; Liu, S.B.; Feng, J.H.; Wang, W.; Wang, Y.W.; Yu, Q.; Liao, Y.R.; Mo, Y.H.; Xu, Z.J.; Li, L.H.; et al. Overexpression of a stress response membrane protein gene OsSMP1 enhances rice tolerance to salt, cold and heavy metal stress. Environ. Exp. Bot. 2021, 182, 104327. [Google Scholar] [CrossRef]
  61. Wang, A.; Shu, X.; Jing, X.; Jiao, C.; Chen, L.; Zhang, J.; Ma, L.; Jiang, Y.; Yamamoto, N.; Li, S.; et al. Identification of rice (Oryza sativa L.) genes involved in sheath blight resistance via a genome-wide association study. Plant Biotechnol. J. 2021, 19, 1553–1566. [Google Scholar] [CrossRef]
  62. Zhang, F.; Huang, J.; Guo, H.; Yang, C.; Li, Y.; Shen, S.; Zhan, C.; Qu, L.; Liu, X.; Wang, S.; et al. OsRLCK160 contributes to flavonoid accumulation and UV-B tolerance by regulating OsbZIP48 in rice. Sci. China Life Sci. 2022, 65, 1380–1394. [Google Scholar] [CrossRef]
  63. Liu, Y.; Li, M.; Yu, J.; Ma, A.; Wang, J.; Yun, D.J.; Xu, Z.Y. Plasma membrane-localized Hsp40/DNAJ chaperone protein facilitates OsSUVH7-OsBAG4-OsMYB106 transcriptional complex formation for OsHKT1;5 activation. J. Integr. Plant Biol. 2023, 65, 265–279. [Google Scholar] [CrossRef]
  64. Krishnamurthy, S.L.; Sharma, S.K.; Kumar, V.; Tiwari, S.; Singh, N.K. Analysis of genomic region spanning Saltol using SSR markers in rice genotypes showing differential seedlings stage salt tolerance. J. Plant Biochem. Biotechnol. 2015, 25, 331–336. [Google Scholar] [CrossRef]
  65. Dai, X.J.; He, C.; Zhou, L.; Liang, M.Z.; Fu, X.C.; Qin, P.; Yang, Y.Z.; Chen, L.B. Identification of a specific molecular marker for the rice blast-resistant gene Pigm and molecular breeding of thermo-sensitive genic male sterile leaf-color marker lines. Mol. Breed. 2018, 38, 72. [Google Scholar] [CrossRef]
  66. Doyle, J. DNA Protocols for Plants. In Molecular Techniques in Taxonomy; Hewitt Godfrey, M., Johnston Andrew, W.B., Young, J., Peter, W., Eds.; Springer: Berlin/Heidelberg, Germany, 1991; pp. 283–293. [Google Scholar]
  67. Livak, K.J.; Schmittgen, T.D. Analysis of relative gene expression data using real-time quantitative PCR and the 2−ΔΔCt Method. Methods 2001, 25, 402–408. [Google Scholar] [CrossRef]
  68. Zhang, K.; Su, J.; Xu, M.; Zhou, Z.; Zhu, X.; Ma, X.; Hou, J.; Tan, L.; Zhu, Z.; Cai, H.; et al. A common wild rice-derived BOC1 allele reduces callus browning in indica rice transformation. Nat. Commun. 2020, 11, 443. [Google Scholar] [CrossRef]
  69. Wang, J.; Nan, N.; Shi, L.; Li, N.; Huang, S.; Zhang, A.; Liu, Y.; Guo, P.; Liu, B.; Xu, Z.Y. Arabidopsis BRCA1 represses RRTF1-mediated ROS production and ROS-responsive gene expression under dehydration stress. New Phytol. 2020, 228, 1591–1610. [Google Scholar] [CrossRef]
  70. Ruan, W.; Guo, M.; Wang, X.; Guo, Z.; Xu, Z.; Xu, L.; Zhao, H.; Sun, H.; Yan, C.; Yi, K. Two RING-Finger Ubiquitin E3 Ligases Regulate the Degradation of SPX4, An Internal Phosphate Sensor, for Phosphate Homeostasis and Signaling in Rice. Mol. Plant 2019, 12, 1060–1074. [Google Scholar] [CrossRef]
  71. Chen, C.; Wu, Y.; Li, J.; Wang, X.; Zeng, Z.; Xu, J.; Liu, Y.; Feng, J.; Chen, H.; He, Y.; et al. TBtools-II: A “one for all, all for one” bioinformatics platform for biological big-data mining. Mol. Plant 2023, 16, 1733–1742. [Google Scholar] [CrossRef]
Figure 1. Plant phenotypes and analysis of OsJRL45 and OsJRL40 expression at the three-leaf stage under 9‰ NaCl salt stress. (A) Appearance of plants at the three-leaf stage before salt stress treatment. (B) Appearance of plants after 4 days of treatment with 9‰ NaCl. (C) Appearance of plants after recovery for 4 days. (D) Survival rates after recovery from salt stress treatment. (E) Quantification of RT-qPCR analysis of OsJRL45 expression. (F) Quantification of RT-qPCR analysis of OsJRL40 expression. Data represent the mean ± SD of three independent replicates; asterisks indicate statistically significant differences (**: p < 0.01; ***: p < 0.001). Scale bars on (AC): 5 cm.
Ijms 25 10912 g001
Figure 2. Location and structure of OsJRL45 and OsJRL40. (A) Structure of OsJRL45 and OsJRL40 in Nip. ATG indicates the start codon. (B) Positions of single nucleotide polymorphisms (SNPs) in the exons of OsJRL45 and OsJRL40 and the resulting changes in amino acid sequences.
Ijms 25 10912 g002
Figure 3. Effect of salt stress on plants from a hybrid population derived from the cross SR86 × 9311. (A) Appearance of plants at the three-leaf stage before salt stress treatment. (B) Appearance of plants after 5 days of 6‰ NaCl salt stress treatment. (C) Appearance of plants after 5 days of recovery. (D) Appearance of individual plants after recovery. SR86 × 9311 indicates plants from the hybrid population; plants from the parental line 9311 are shown to the right of the red dotted line. Scale bars on (AD): 5 cm.
Ijms 25 10912 g003
Figure 4. Validation of marker-assisted selection in different rice varieties. Lanes 1, 2 and 3 (indicated by the red dotted lines) represent SR86, 9311, and Nip, respectively. (A) From left to right (lanes 4–24): Mei Zhan, Yu Chi, Ming Hui, Zhan F2, Feng Hua Zhan, Fu Yi B, IR64, Chai Mi, Zi 100, B213, Zhu 1S, Guangxiang 24S, Hua 451, Xiang Wan Indica, Yuejing, Xianhui, bolon, Zm273 Bairizao, Zhen Indica 97A, Guangzhan 63S. (B) From left to right (lanes 25–45): TTP, Qingzhen, TB, Lemont, Wanhui 110, PA64S, ZhongjiuA, Xiangzao 32, Gang 46B, 7001S2, CHEN 28, Sanyingzhan, Yongping, Qingzhen, Guangsi, IR36, 9311, Nan 11, Xiangzao Indica, IR24. (C) From left to right (lanes 46–66): Nantehao, Ludao 2318, R402, R16, R288, Minghui 63, P002, Qiuguang, Shuhui 527, Yujing 1, Zhengxuan 3, Xiaozinuo, D16, Xiangzi 3150, Xiangxiang 628S, Huaihui 210, Yixiang A, Duozi 1, Lila 2, Yuehui A, 750S. M: DNA size marker.
Ijms 25 10912 g004
Figure 5. Screening of RILs derived from SR86 × 9311 for salt tolerance. (A) Appearance of plants at the three-leaf stage before salt stress treatment. (B) Appearance of plants after 4 days of treatment with 9‰ NaCl. (C) Appearance of plants after 4 days of recovery from salt stress. F6 indicates the sixth generation of RILs derived from the cross SR86 × 9311. (D) Survival rate statistics: data represent the mean ± SD of three independent replicates; asterisks indicate statistically significant differences (**: p < 0.01; ***: p < 0.001). (E) Genotyping of hybrid plants using specific molecular markers. (AC) On the left side of the red dotted line is SR86 and on the right is 9311. M: DNA size marker. Scale bars on (AC): 5 cm.
Ijms 25 10912 g005
Figure 6. Interaction between OsJRL45 and OsJRL40. (A) Yeast two-hybrid (Y2H) assays showing the in vivo interaction between OsJRL45 and OsJRL40. The recombinant plasmids pGBKT7-53/pGADT7-T and pGBKT7-Lam/pGADT7-T were used as positive and negative controls, respectively. SD/-Trp/-Leu medium lacks tryptophan and leucine; SD/-Trp/-Leu/-His/-Ade + X-α-Gal medium lacks adenine, tryptophan, leucine, and histidine. (B) Bimolecular fluorescence complementation (BiFC) assay confirming the interaction between OsJRL45 and OsJRL40. Yellow indicates yellow protein fluorescence and red indicates chloroplast channels. BZR1-CYFP/D3-NYFP and 62SK-VC/62SK-VN were used as positive and negative controls, respectively. (A) Scale bars: 2 cm, (B) Scale bars: 20 μm.
Ijms 25 10912 g006
Figure 7. Analysis of agronomic traits in transgenic plants harboring OsJRL45/40 and Nip wild-type (WT) rice. (A) Single spike phenotype. (B) Mature plant phenotype. (C) Grain length and width phenotypes. (D) Plant height. (E) Effective panicle. (F) Seed-setting rate. (G) Thousand-grain weight. (H) Spike length. (I) Number of grains per spike. Data represent the mean ± SD of three independent replicates; asterisks indicate statistically significant differences (**: p < 0.01; ***: p < 0.001). (A,B) On the left side of the red dotted line is WT and on the right is OsJRL45/40. Scale bars on (AC): 5 cm.
Ijms 25 10912 g007
Figure 8. Phenotypic analysis of plants at the three-leaf stage exposed to salt stress by treatment with 9‰ NaCl. (A) Appearance of plants at the three-leaf stage before salt stress treatment. (B) Appearance of plants after 4 days of treatment with 9‰ NaCl. (C) Appearance of plants after 4 days of recovery from salt stress. (D) Survival rates after recovery from salt stress. (E) Quantification of OsJRL45 expression by RT-qPCR. (F) Quantification of OsJRL40 expression by RT-qPCR. WT: wild-type Nip; OsJRL45/40: transgenic plants. Data represent the means ± SD of three independent replicates; asterisks indicate statistically significant differences (**: p < 0.01; ***: p < 0.001). (AC) On the left side of the red dotted line is WT and on the right is OsJRL45/40. Scale bars on (AC): 5 cm.
Ijms 25 10912 g008
Figure 9. Changes in physiological indicators of plants at the three-leaf stage treated with 9‰ NaCl for 24 h. (A) Catalase (CAT) activity. (B) Peroxidase (POD) activity. (C) Superoxide dismutase (SOD) activity. (D) Malondialdehyde (MDA) content. (E) Proline (Pro) content. WT: wild-type Nip; OsJRL45/40: transgenic plants. Data represent the mean ± SD of three independent replicates; asterisks indicate statistically significant differences (***: p < 0.001).
Ijms 25 10912 g009
Figure 10. GO and KEGG enrichment analyses of differential gene expression before and after salt stress treatment. (A) Venn diagram showing the overlap of differentially expressed genes (DEGs) identified in WT and transgenic seedlings harboring OsJRL45/40 from SR86 before and after salt stress treatment. CLQ-OsJRL45/40-vs-CLQ-WT-Up/Down: genes that were up-regulated and down-regulated in transgenic plants, relative to their expression in WT plants, under normal conditions; CLH-OsJRL45/40-vs-CLH-WT-Up/Down: genes that were up-regulated and down-regulated in transgenic plants, relative to their expression in WT plants, under salt stress conditions. (B) KEGG enrichment analysis of genes differentially expressed in WT and transgenic plants before salt stress treatment. (C) Functional annotation of genes differentially expressed in WT and transgenic plants before salt stress treatment.
Ijms 25 10912 g010
Figure 11. GO and KEGG enrichment analyses of DEGs detected in WT and transgenic plants harboring OsJRL45/40 from SR86 after salt stress treatment. Volcano plot of DEGs detected (A) before and (B) after salt stress treatment. (C) KEGG enrichment analysis of DEGs detected after salt stress treatment. (D) Classification and functional annotation of DEGs between WT and transgenic plants after salt stress treatment.
Ijms 25 10912 g011
Figure 12. DEGs enriched in “response to stress” GO pathways after salt stress treatment, identified by GSEA. Genes that also appear in Figure 13 are shown in black; genes shown in red are unique to this process.
Ijms 25 10912 g012
Figure 13. DEGs enriched in “response to abiotic stimulus” GO pathways after salt stress treatment, identified by GSEA. Genes that also appear in Figure 12 are shown in black; genes shown in red are unique to this process.
Ijms 25 10912 g013
Table 1. Validation of MAS of salt stress in 320 SR86 × 9311 RILs.
Number of SR86 × 9311 RILs
SR86228
931154
Heterozygous36
No product2
Total320
Disclaimer/Publisher’s Note: The statements, opinions and data contained in all publications are solely those of the individual author(s) and contributor(s) and not of MDPI and/or the editor(s). MDPI and/or the editor(s) disclaim responsibility for any injury to people or property resulting from any ideas, methods, instructions or products referred to in the content.

