Abstract
Alternaria alternata, a causal agent of pear black spot, can recognize and respond to physicochemical signals from fruit surfaces through an intricate signaling network to initiate infection. Crz1 is an important transcription factor downstream of the calcium signaling pathway. In this study, we first investigated the infection structure formation process of the wild type (WT) and ΔAaCrz1 strains induced by the cuticular wax of the “Zaosu” pear by microscopic observation. We found that the infection process was delayed and the rate of appressorium formation and infection hyphae formation was significantly decreased in the ΔAaCrz1 strain. RNA-seq of WT and ΔAaCrz1 strains was analyzed after 6 h of induction with pear wax. A total of 893 up-regulated and 534 down-regulated genes were identified. Among them, genes related to cell wall degrading enzymes, ABC transporters, and ion homeostasis were down-regulated, and the autophagy pathway was induced and activated. In addition, disruption to the intracellular antioxidant system was also found after AaCrz1 knockdown. In summary, this study provides new information on the mechanism of the transcription factor AaCrz1 in the regulation of infection structure formation of A. alternata induced by pear peel wax signal, which can be used to develop new strategies for controlling fungal diseases in the future.
1. Introduction
Alternaria alternata, an important postharvest pathogen with a wide range of hosts, can cause black spot disease in various fruits and vegetables such as pears, melons, citrus, peaches, and potatoes [1,2]. A. alternata, as a typical latent infection fungus, initiates infection when it senses favorable signals, starting with spore germination to form germ tubes that subsequently differentiate to appressoria [3], which can invade the fruit through pressure-mediated penetration of the intact host cuticle and outer epidermal cell walls or lenticel and epidermal wounds, employing various strategies that have evolved to invade fruit effectively [4]. Due to the complexity and diversity of the infection pathways, infection modes, pathogenic factors, and regulatory mechanisms of A. alternata, it is of great significance to comprehensively reveal the molecular pathogenic mechanisms of A. alternata in order to control postharvest black spots in fruit.
Plant surface cuticular wax is a complex mixture of hydrophobic substances, whose components and their degradation products can be utilized by phytopathogenic fungi as part of the signals that trigger spore germination and infection structure differentiation [5,6]. Intracellular signal transduction pathways are involved in the process of pathogenic fungi recognition and perception of external physical and chemical stimuli to initiate infection. These signal transduction pathways, including the cyclic adenosine monophosphate-protein kinase A (cAMP-PKA) pathway, mitogen-activated protein kinase (MAPK) pathway, and calcium signaling pathway, can induce cellular responses through membrane-to-membrane transduction and intracellular phosphorylation cascades [7,8,9,10,11,12]. In particular, changes in intracellular Ca2+ concentration have been found to be an important regulatory signal for a variety of cellular metabolic activities [13]. Current research reports on the calcium signaling pathway in fungal species have mainly focused on pathway proteins such as phospholipase C, calmodulin, and calcineurin [8,14]. In addition, Crz1 is an important zinc finger transcription factor downstream of the calcium signaling pathway in pathogenic fungi. The Cys2His2 zinc finger structural domain of Crz1 binds to the promoter elements of target genes and activates target gene expression [15,16]. The function of Crz1 homologues has been reported in many fungi. In Saccharomyces cerevisiae, Crz1 regulated tolerance to high concentrations of Ca2+ by regulating genes such as ATPase PMC1 [17]. Crz1 positively regulates the virulence of human and plant pathogenic fungi. The Crz1 deficiency reduced the virulence of Magnaporthe grisea and Botrytis cinerea by affecting appressorium or sclerotium formation [18,19]. The virulence of Candida glabrata, Aspergillus fumigatus, and Cryptococcus neoformans [20,21,22] decreased as a result of the deletion of Crz1. It has also been observed that knocking out Crz1 results in impaired fungal growth, reduced conidia [23], inhibition of toxin synthesis [23], and impaired cell wall integrity [10]. The function and possible regulatory mechanism of Crz1 has always been a hot topic in the field of fungal research.
In this study, we observed the infection structure differentiation and penetration process of wild type (WT) and ΔAaCrz1 on onion epidermis coated with pear peel wax. We found that the infection structure of ΔAaCrz1 was damaged during the early infection stage. However, the specific regulatory mechanism of how AaCrz1 participates in the structural differentiation and pathogenicity of A. alternata by responding to cuticular wax signals remains unclear. Thus, RNA-seq was used for analysis of the differentially expressed genes (DEGs) and differential metabolic pathways of ΔAaCrz1 compared to WT after 6 h of induction with the cuticular wax of a “Zaosu” pear. The data showed that genes related to cell wall degrading enzymes, ABC transporters, and ion homeostasis were down-regulated, and the autophagy pathway was induced and activated. In addition, the intracellular antioxidant system was also found to be destroyed after AaCrz1 knockout. These results greatly enriched our understanding of the regulatory mechanism of AaCrz1 on A. alternata infection structure formation induced by pear peel wax signal, and this RNA-seq result provides data support for the search for potential genes or proteins in A. alternata as targets for black spot disease control.
2. Results
2.1. AaCrz1 Deletion Affects the Infection Structure Differentiation of A. alternata on the Onion Epidermis Coated with Fruit Wax Extract
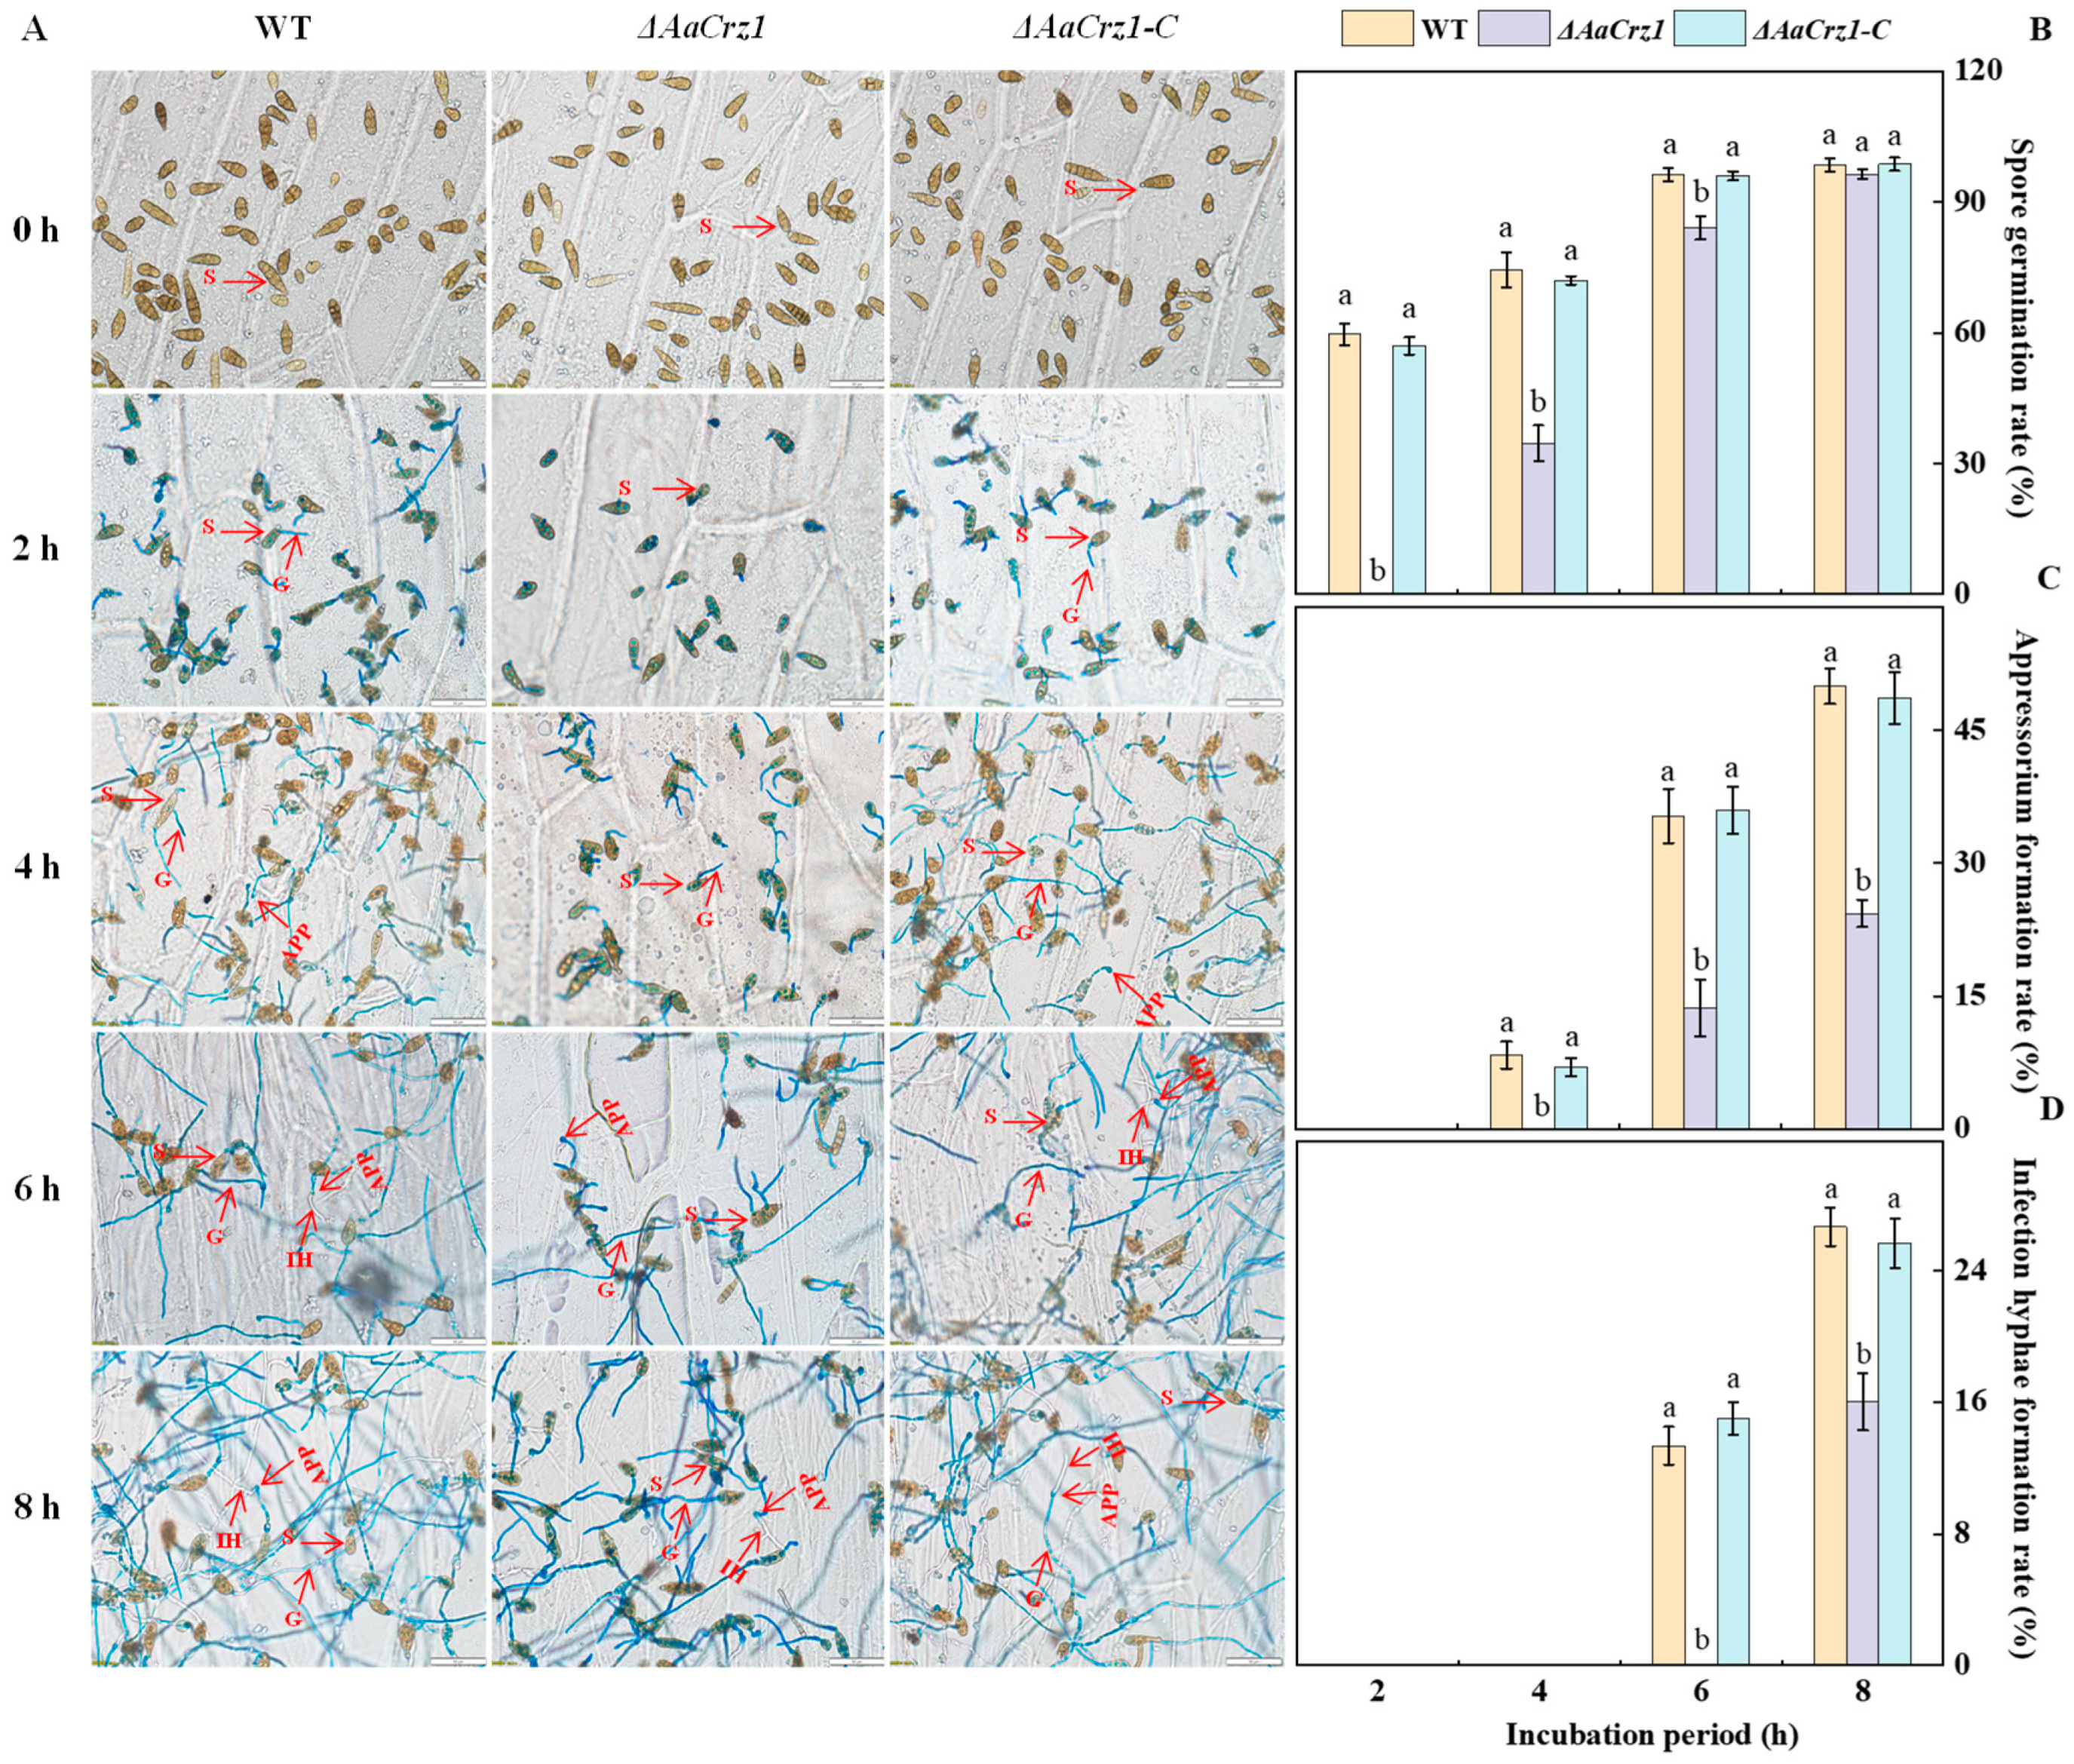
To observe the complete infection structure differentiation and penetration process of A. alternata, the spore suspension of the WT, ΔAaCrz1, and ΔAaCrz1-C were dropped on onion skin coated with fruit wax for observation. The recombinant pC-NEO vector containing the AaCrz1 gene sequence was transferred into ΔAaCrz1 by PEG-mediated protoplast transformation to obtain the complementary strain ΔAaCrz1-C. The results showed that A. alternata conidia were rod-shaped, ovoid, or ellipsoid with longitudinal and transverse septa (Figure 1A). The deletion of AaCrz1 reduced the differentiation ability of the infection structure in A. alternata. Compared to WT and ΔAaCrz1-C, the ΔAaCrz1 spore germination was decreased by 54.05% and 52.77%, respectively, at 4 h of incubation (Figure 1B). The appressorium formation and infection hyphae formation rate of ΔAaCrz1 were decreased by 51.34% and 39.98%, respectively, at 8 h of incubation (Figure 1C,D). However, ΔAaCrz1-C restored the defective phenotype of the ΔAaCrz1 mutant, and the appressorium formation and infection hyphae formation were significantly improved. Moreover, there was no significant difference between the ΔAaCrz1-C and WT strains during this process.

Figure 1.
Effect of AaCrz1 on the infection structure differentiation of A. alternata on the onion epidermis coated with fruit wax extract. Morphological observation of infection structure of the WT, ΔAaCrz1, and ΔAaCrz1-C strains on onion epidermis coated with fruit wax extract. S represents spores, G represents germ tube, APP represents appressorium, and IH represents infection hyphae (A); the spore germination rate of the WT, ΔAaCrz1 and ΔAaCrz1-C strains (B); the spore appressorium formation rate (C) of the WT, ΔAaCrz1, and ΔAaCrz1-C strains; the infection hyphae formation rate of the WT, ΔAaCrz1, and ΔAaCrz1-C strains (D). Each treatment was in parallel and repeated three times. Vertical lines indicate the standard error of the means. Different letters indicate significant differences (p < 0.05).
2.2. Gene Expression Abundance Distribution and Sample Relationship Analysis
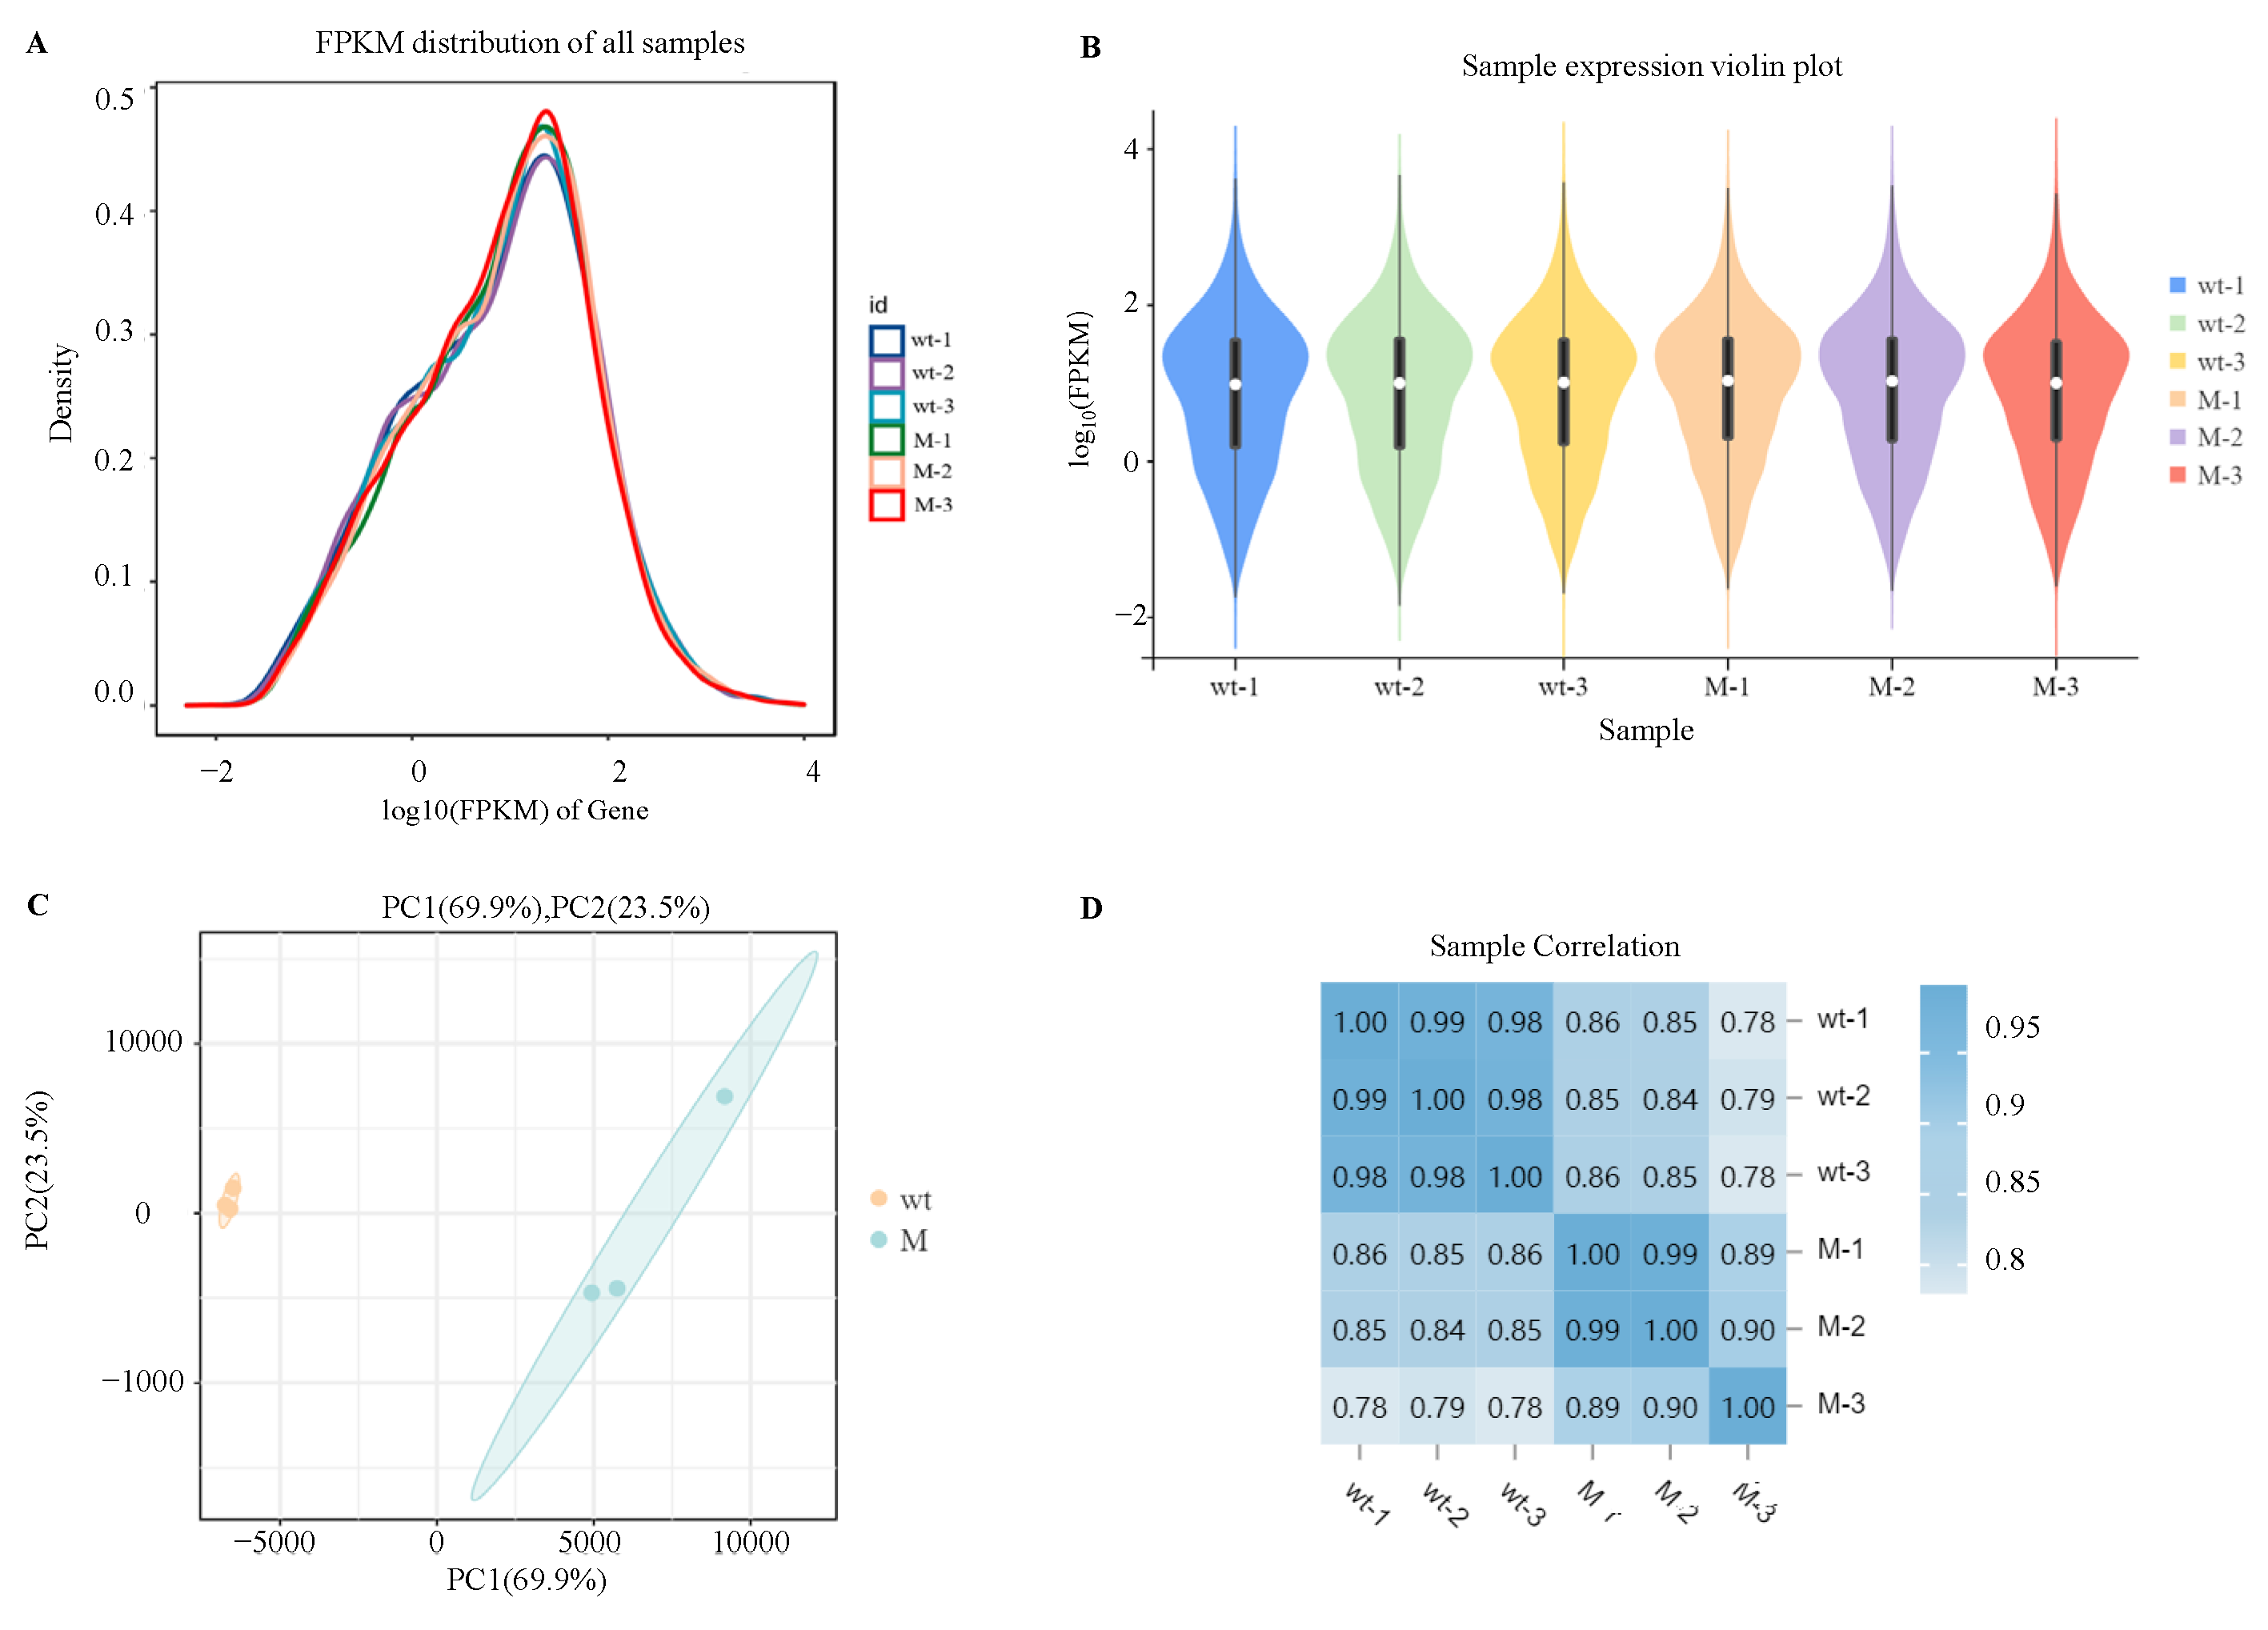
In order to explore the specific regulatory mechanism of AaCrz1 on the structural differentiation and pathogenicity of A. alternata upon responding to cuticular wax signals, RNA-seq was used to analyze the differentially expressed genes (DEGs) and differential metabolic pathways of ΔAaCrz1 compared with the WT 6 h after incubating with cuticular wax from the “Zaosu” pear. The FPKM density distribution comparison diagram of six samples of WT and ΔAaCrz1 strains showed that the gene expression level spanned six orders of magnitude from 10−2 to 104 (Figure 2A). The results of the violin plots showed that the expression levels of the six samples were consistent (Figure 2B). According to the principal component analysis (PCA), a tight clustering of samples in the same group indicated a good level of repeatability of the samples in the same group. Notable dispersion between samples from different treatments indicated that the samples correctly reflected the biological differences between different groups (Figure 2C). The results of sample correlation analysis showed that the duplicate samples within the same group showed a highly significant positive correlation, and the correlation coefficients were in the range of 0.782 to 0.994, indicating that the reproducibility between the samples was good and the quality of sequencing was reliable (Figure 2D).

Figure 2.
Analysis of gene expression abundance distribution and sample relationship. (A) Abundance distribution map of gene expression in each sample; (B) Violin plot of gene expression in each sample. The white dots represent the median, and the black rectangle indicates the interquartile range. The length of thin black lines indicates the degree of dispersion and symmetry of the non-abnormal data, and the external shape is the kernel density estimate. The vertical axis length of the plot shows the degree of data dispersion, and the horizontal axis length reflects the amount of data distribution at a certain vertical axis position; (C) Sample principal component analysis (PCA). The PC1 coordinate represents the first principal component, and the percentage in parentheses represents the contribution of the first principal component to the sample difference; The PC2 coordinate represents the second principal component, and the percentage in parentheses represents the contribution of the second principal component to the sample difference; (D) Sample correlation analysis. The number in the lattice is the Pearson correlation coefficient. The bluer the color is, the greater the correlation coefficient is, and the stronger the sample similarity is. Note: wt represents the WT strain and M represents the ΔAaCrz1 strain.
2.3. DEGs Analysis
To identify genes that exhibit significant changes in expression levels between the wild-type strain (WT) and ΔAaCrz1 (M) groups were screened with FDR < 0.05 and |log2FC| > 1. The results showed that compared with WT, ΔAaCrz1 had 1427 differentially expressed genes (DEGs), including 534 (37.42%) down-regulated genes and 893 (62.58%) up-regulated genes, indicating that the deletion of AaCrz1 gene had a great effect on the gene expression level of A. alternata under pear fruit wax induction (Figure 3A). Specifically, the overall distribution of these genes is shown in the volcano plot, with yellow dots representing down-regulated DEGs and blue dots representing up-regulated DEGs (Figure 3B).
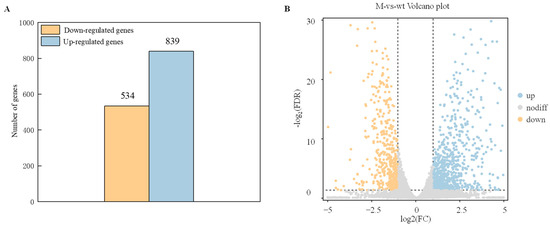
Figure 3.
Statistics of differential expressed genes (DEGs). (A) The statistical map of DEGs. The yellow column represents the down-regulated differential expressed genes (DEGs), and the blue column represents up-regulated differentially expressed genes (DEGs). (B) The volcano plot of DEGs. The abscissa represents the logarithm of the difference between the two groups, and the ordinate represents the −log2 value of the FDR of the difference between the two groups. Blue (up-regulated expression) and yellow (down-regulated expression) points indicate differential gene expression, and gray points indicate no difference.
2.4. GO Enrichment Analysis
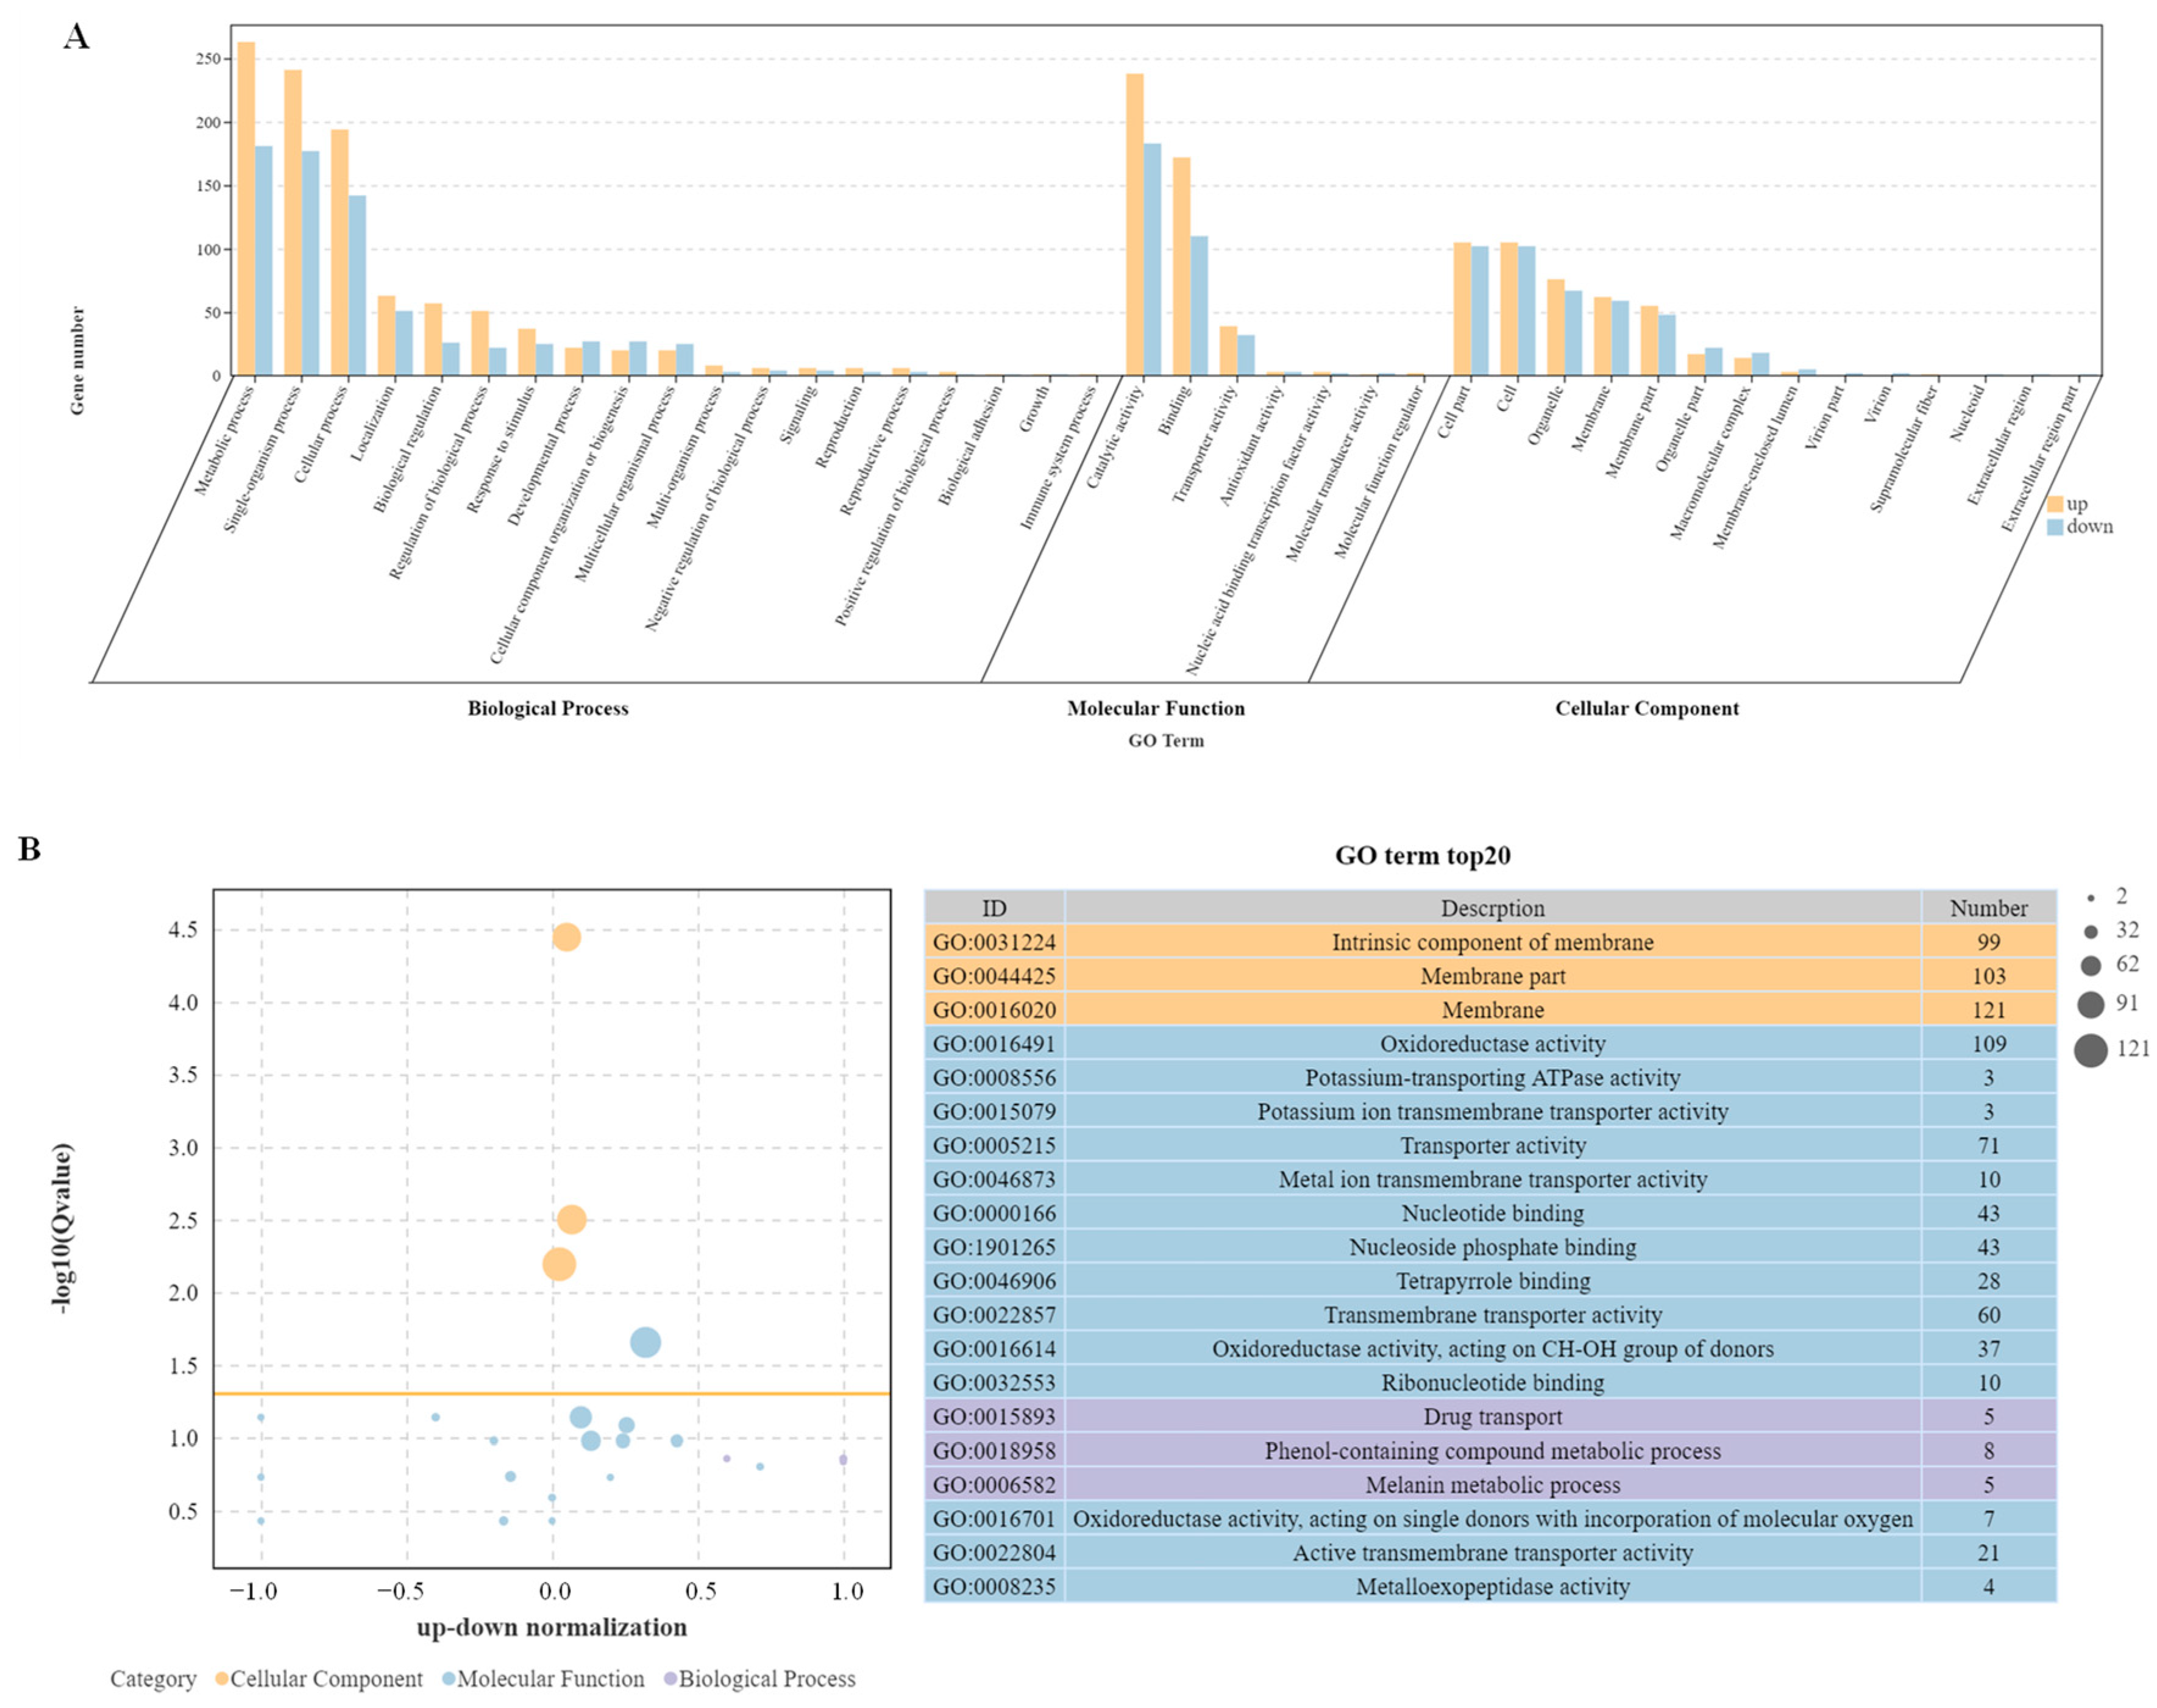
DEGs data were functionally categorized using Gene Ontology, which contains three main categories: biological process, molecular function, and cellular composition (Figure 4A). Since some DEGs can be categorized into different category branches, the total number of DEGs in the GO classification can be larger than the actual total number of DEGs. In this study, GO enrichment analysis found a total of 19 biological process terms, involving 1006 up-regulated DEGs and 723 down-regulated DEGs; seven molecular functional terms, involving 458 up-regulated DEGs and 332 down-regulated DEGs; and 14 cell component terms, involving 438 up-regulated DEGs and 430 down-regulated DEGs. The top 20 most significantly enriched GO terms in −log10(Q-value) are shown in Figure 4B. The top three GO terms in cell components were all plasma membrane related, including the intrinsic component of membranes, membrane parts, and membranes as a whole. Two of the three terms of biological processes were enriched and annotated as metabolic processes: the phenol-containing compound metabolic process, and the melanin metabolic process. DEGs were also significantly enriched in drug transport. Among the 14 terms of molecular function, 5 terms related to enzyme activity were significantly enriched, with the most significant differences in oxidoreductase activity and potassium-transporting ATPase activity. Five terms related to transporters were significantly enriched, with the most significant differences in potassium ion transmembrane transporter activity and metal ion transmembrane transporter activity. In addition, four terms related to binding proteins were enriched.
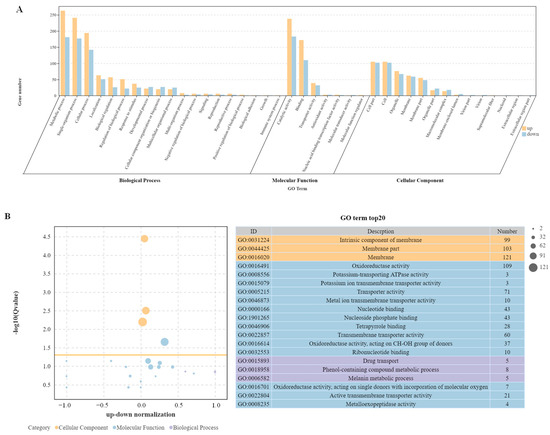
Figure 4.
Enrichment analysis of GO terms. (A) The Go enrichment of DEGs in the WT-vs-ΔAaCrz1 mutant strain group (the yellow column represents the up-regulated genes, the blue column represents the down-regulated ones). (B) Top 20 most significantly enriched GO terms by −log10(Q-value).
2.5. KEGG Pathway Enrichment Analysis
The KEGG pathway classification of DEGs was mainly enriched in five categories: metabolism, genetic information processing, cellular processes, environmental information processing, and organismal systems (Figure 5A). In metabolism, DEGs were enriched in 11 KEGG pathway annotations, including primary metabolism (carbohydrate, amino acid, lipid, energy, and nucleotide metabolism), secondary metabolite metabolism (cofactor and vitamin metabolism, terpene, and polyketide metabolism), glycan biosynthesis and metabolism, and biosynthesis of other secondary metabolites. In genetic information processing, DEGs were enriched for four annotations, namely folding, sorting, and degradation, replication and repair, translation, and transcription. Two annotations of transport and decomposition as well as cell growth and death were enriched during cellular processes. Two annotations of signal transduction and membrane transport were enriched in the process of environmental information. Only the annotation of aging was enriched in biological systems.
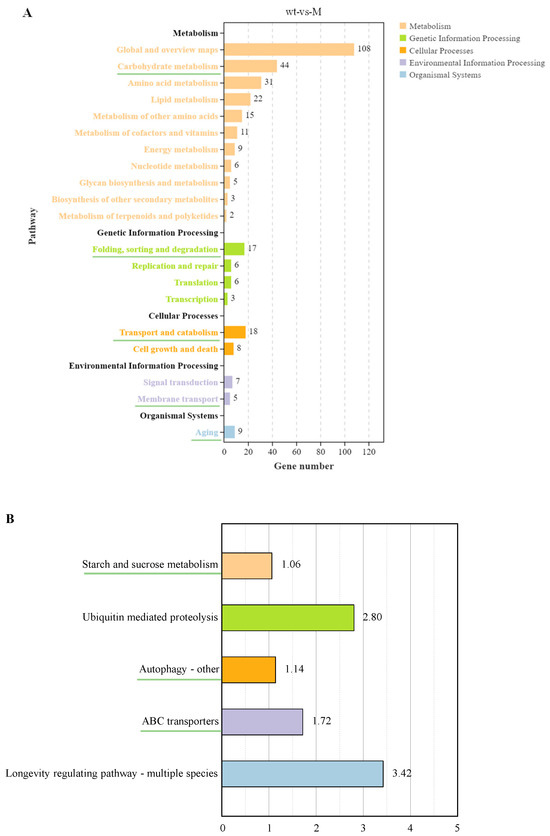
Figure 5.
Enrichment analysis of the KEGG pathway. (A) The enrichment of KEGG pathways. (B) Five pathways selected from five secondary annotations underlined in Figure 5A by −log10 (Q-value).
Subsequently, five annotations of the green underscore in Figure 5A were selected: carbohydrate metabolism, folding, sorting, and degradation, transport and catabolism, membrane transport, and aging. The five pathways most significantly enriched in −log10(Q-value) under these annotations are shown in Figure 5B, with different colors representing different categories. In carbohydrate metabolism, starch and sucrose metabolism was significantly enriched. Ubiquitin-mediated proteolysis was the most important enrichment pathway during folding, sorting, and degradation. In transport and catabolism, the most important pathway was autophagy (others). In terms of membrane transport, ABC transporters was the most significantly enriched pathway. In terms of aging, the longevity regulatory pathway (multiple species) was the most significantly enriched pathway.
2.6. Characterization of DEGs in A. alternata at Early Stages of Infection
Starch and sucrose metabolism, autophagy-other, and ABC transporter proteins, which relate to fungi pathogenicity, were selected for analysis (Figure 5B). The DEGs involved in these pathways are summarized in Supplementary Table S1. In addition, information on the DEGs involved in regulation by AaCrz1 is presented in Supplementary Table S2.
2.6.1. Analysis of DEGs Involved in the Selected Pathway
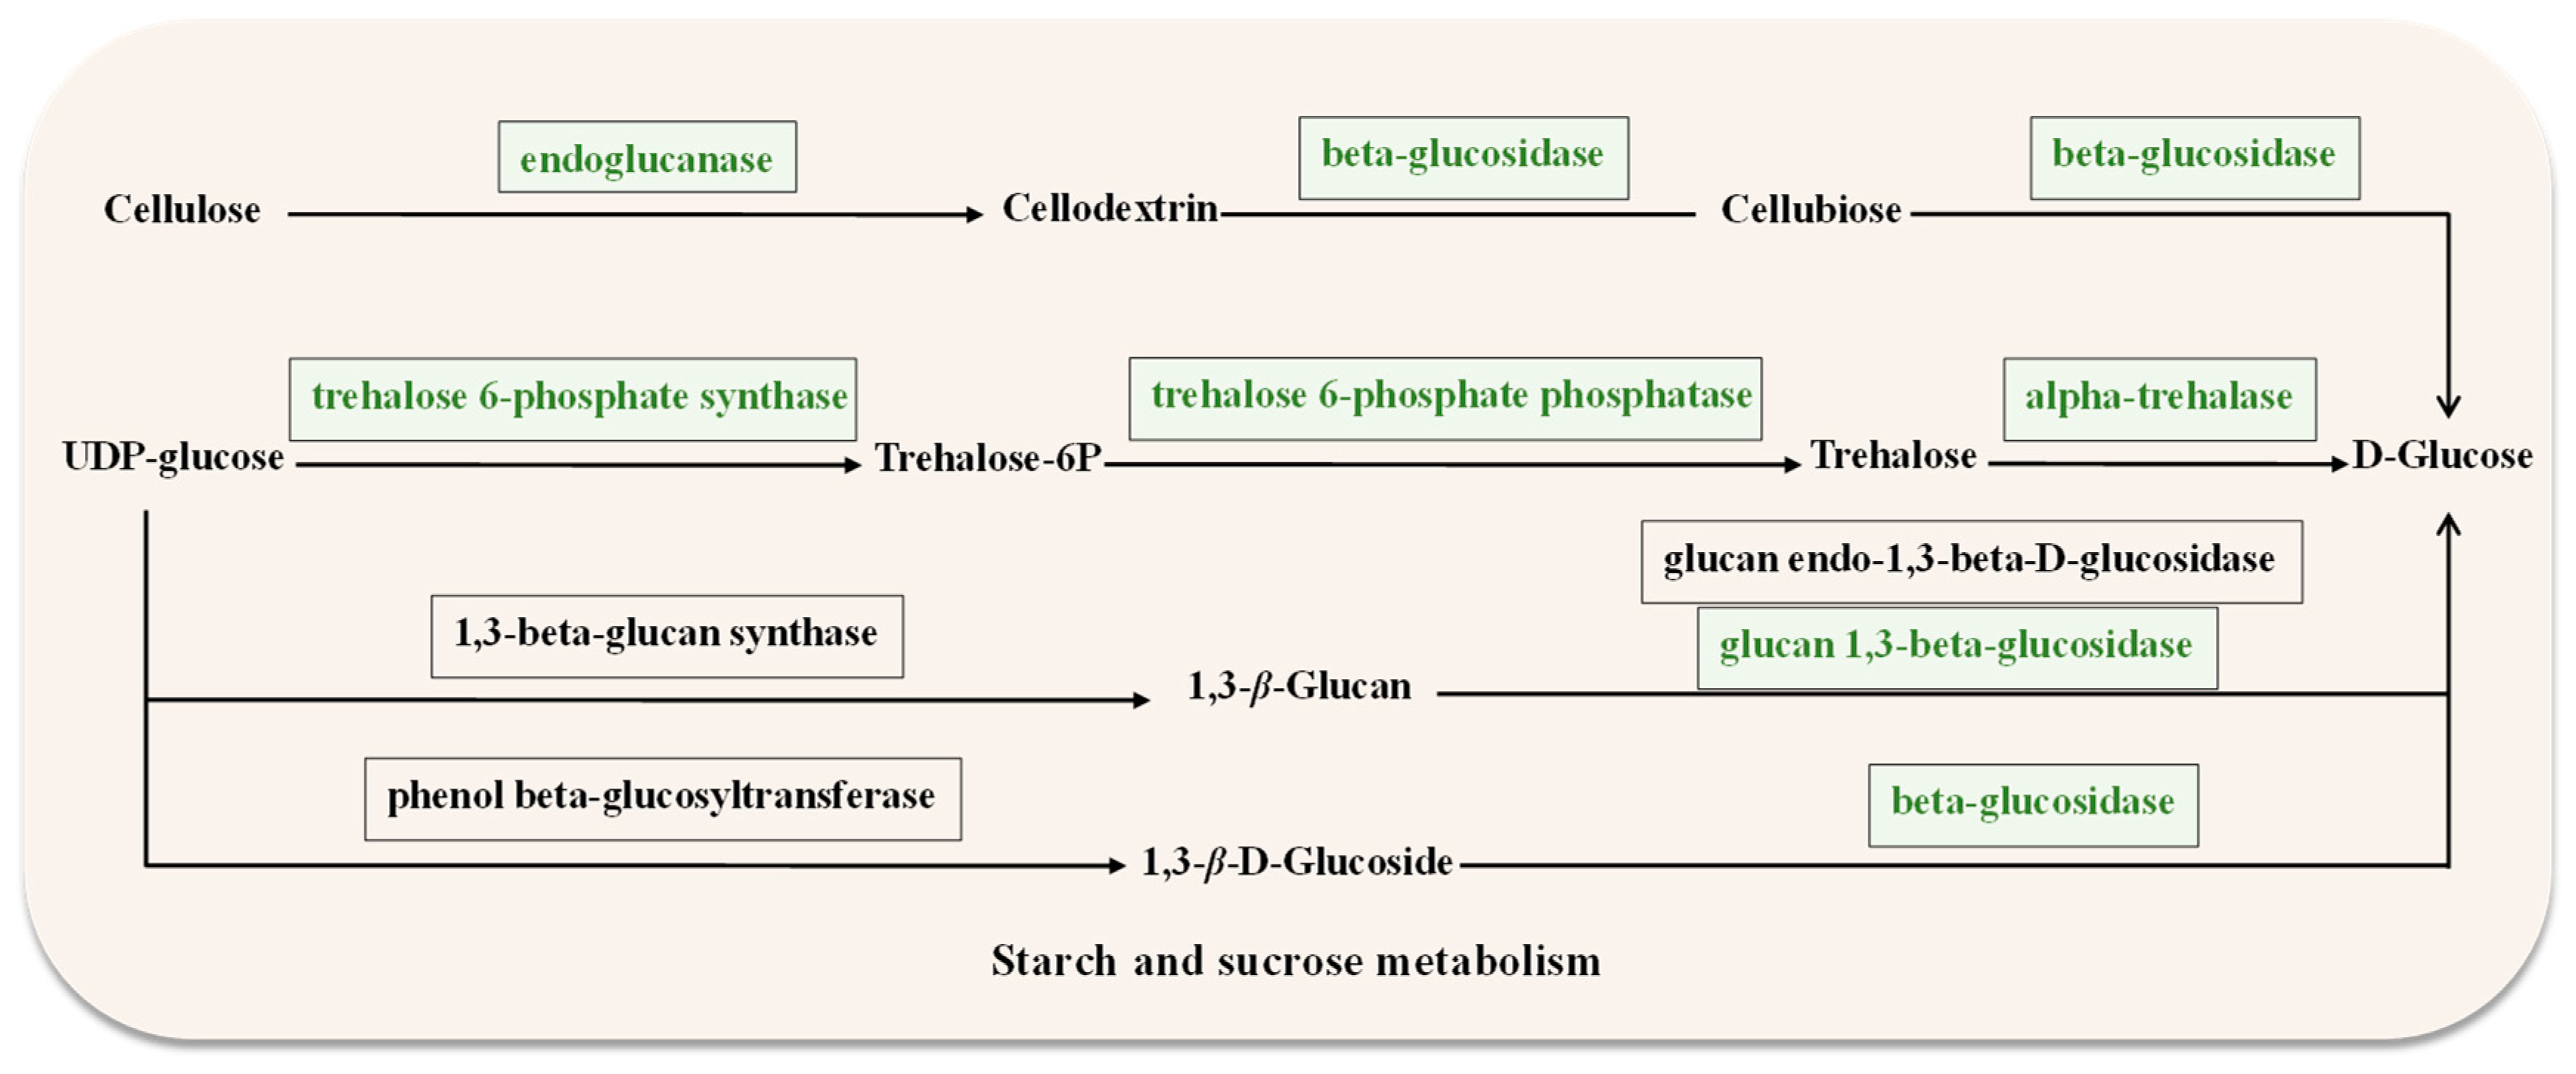
Genes related to starch and sucrose metabolism were downregulated in ΔAaCrz1 compared to WT (Supplementary Table S1). They contained genes belonging to cell wall degrading enzymes (CWDEs), including EXG1 (ncbi_29108996), bglF (ncbi_29120998), and celb (ncbi_29116806), which encode the synthesis of 1,3-β-glucosidase, β-glucosidase, and endoglucanase, respectively. Additionally, two genes down-regulated in this pathway were identified as being involved in trehalose metabolism, including treh (ncbi_29119646) and OTS1 (ncbi_29109130), encoding trehalose 6-phosphate synthase and α-trehalase, respectively (Figure 6). DEGs were up-regulated in autophagy-others, including ATG4 (ncbi_29109885), ATG9 (ncbi_29111274), and ATG1 (ncbi_29117977). Among the ABC transporters, atrA (ncbi_29117678), and atrB (ncbi_29110931), which belong to the ABCG subfamily, were significantly down-regulated.
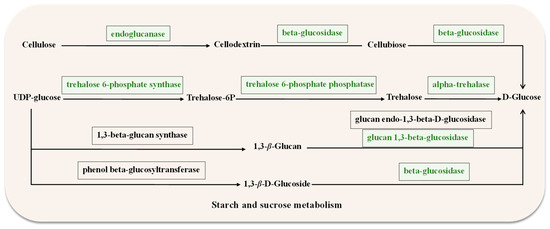
Figure 6.
Starch and sucrose metabolism diagram. The box represents the enzymes required for the metabolism, and the green box indicates the downregulated genes encoding the corresponding enzymes.
2.6.2. Analysis of DEGs Involved in the Regulation of AaCrz1
According to the gene function of GO annotation, DEGs possibly regulated by AaCrz1 were analyzed. Among the cell wall degrading enzymes, in addition to the three genes involved in starch and sucrose metabolism listed in Supplementary Table S1, the down-regulated DEGs included a cutinase gene cutA (ncbi_29117201), and four endoglucanase genes (ncbi_29116806, ncbi_29120322, ncbi_29115410, and ncbi_29111957). Pathogenic fungi have evolved a complete antioxidant system to maintain ROS balance in vivo. RNA-seq results showed that cat-1 (ncbi_29109411), catB (ncbi_29114347), and CAT1 (ncbi_29121404) genes were significantly down-regulated in ΔAaCrz1, and the sod-2 (ncbi_29111723) gene was significantly up-regulated. In addition, Erg3 (ncbi_29116487) was found to be significantly down-regulated in the transcriptome, which would result in the alteration of cell membrane permeability, allowing exogenous H2O2 to enter the cell. Thus, the transcriptome results showed that AaCrz1 deletion resulted in excessive accumulation of intracellular ROS. Ion homeostasis is essential for maintaining normal physiological metabolism in pathogenic fungi. RNA-seq results showed that the expression of pmc1 (ncbi_29117801, ncbi_29120094), VCX1 (ncbi_29118340, ncbi_29119593), and RCAN2 (ncbi_29109809) were significantly down-regulated in ΔAaCrz1 compared with WT (Supplementary Table S2).
2.7. Identification of Proteins Interacting with AaCrz1
Using the STRING protein database, the differentially expressed proteins interacting with AaCrz1 were predicted, and an interaction network diagram was constructed using Cytoscape. As shown in Figure 7, the top 30 interacting proteins with the highest score were screened out. The results showed that of the hexose transporter, inorganic phosphate transporter, etc., six proteins (yellow) among the proteins interacting with AaCrz1 were encoded by upregulated genes, which accounted for 20% of the total interacting proteins. The expression of 24 proteins (blue), including calcium homeostasis regulating proteins, antioxidant enzymes, drug transporters, etc., was encoded by downregulated genes, which accounted for 80% of the total interacting proteins. The motif sequence information of the transcription factor CRZ1 in S. cerevisiae was used to predict the binding sites between these 30 proteins interacting with AaCrz1, and the results are shown in Supplementary Table S3.
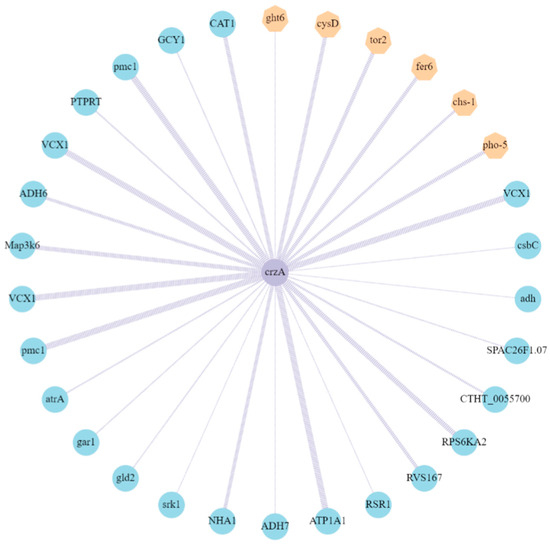
Figure 7.
Identification of proteins interacting with AaCrz1. The yellow hexagons represent the proteins encoded by upregulated genes, whereas green circles represent the proteins encoded by downregulated genes in ΔAaCrz1 compared to WT. The thickness of the purple line indicates the level of the score. The greater the score, the higher the interaction probability.
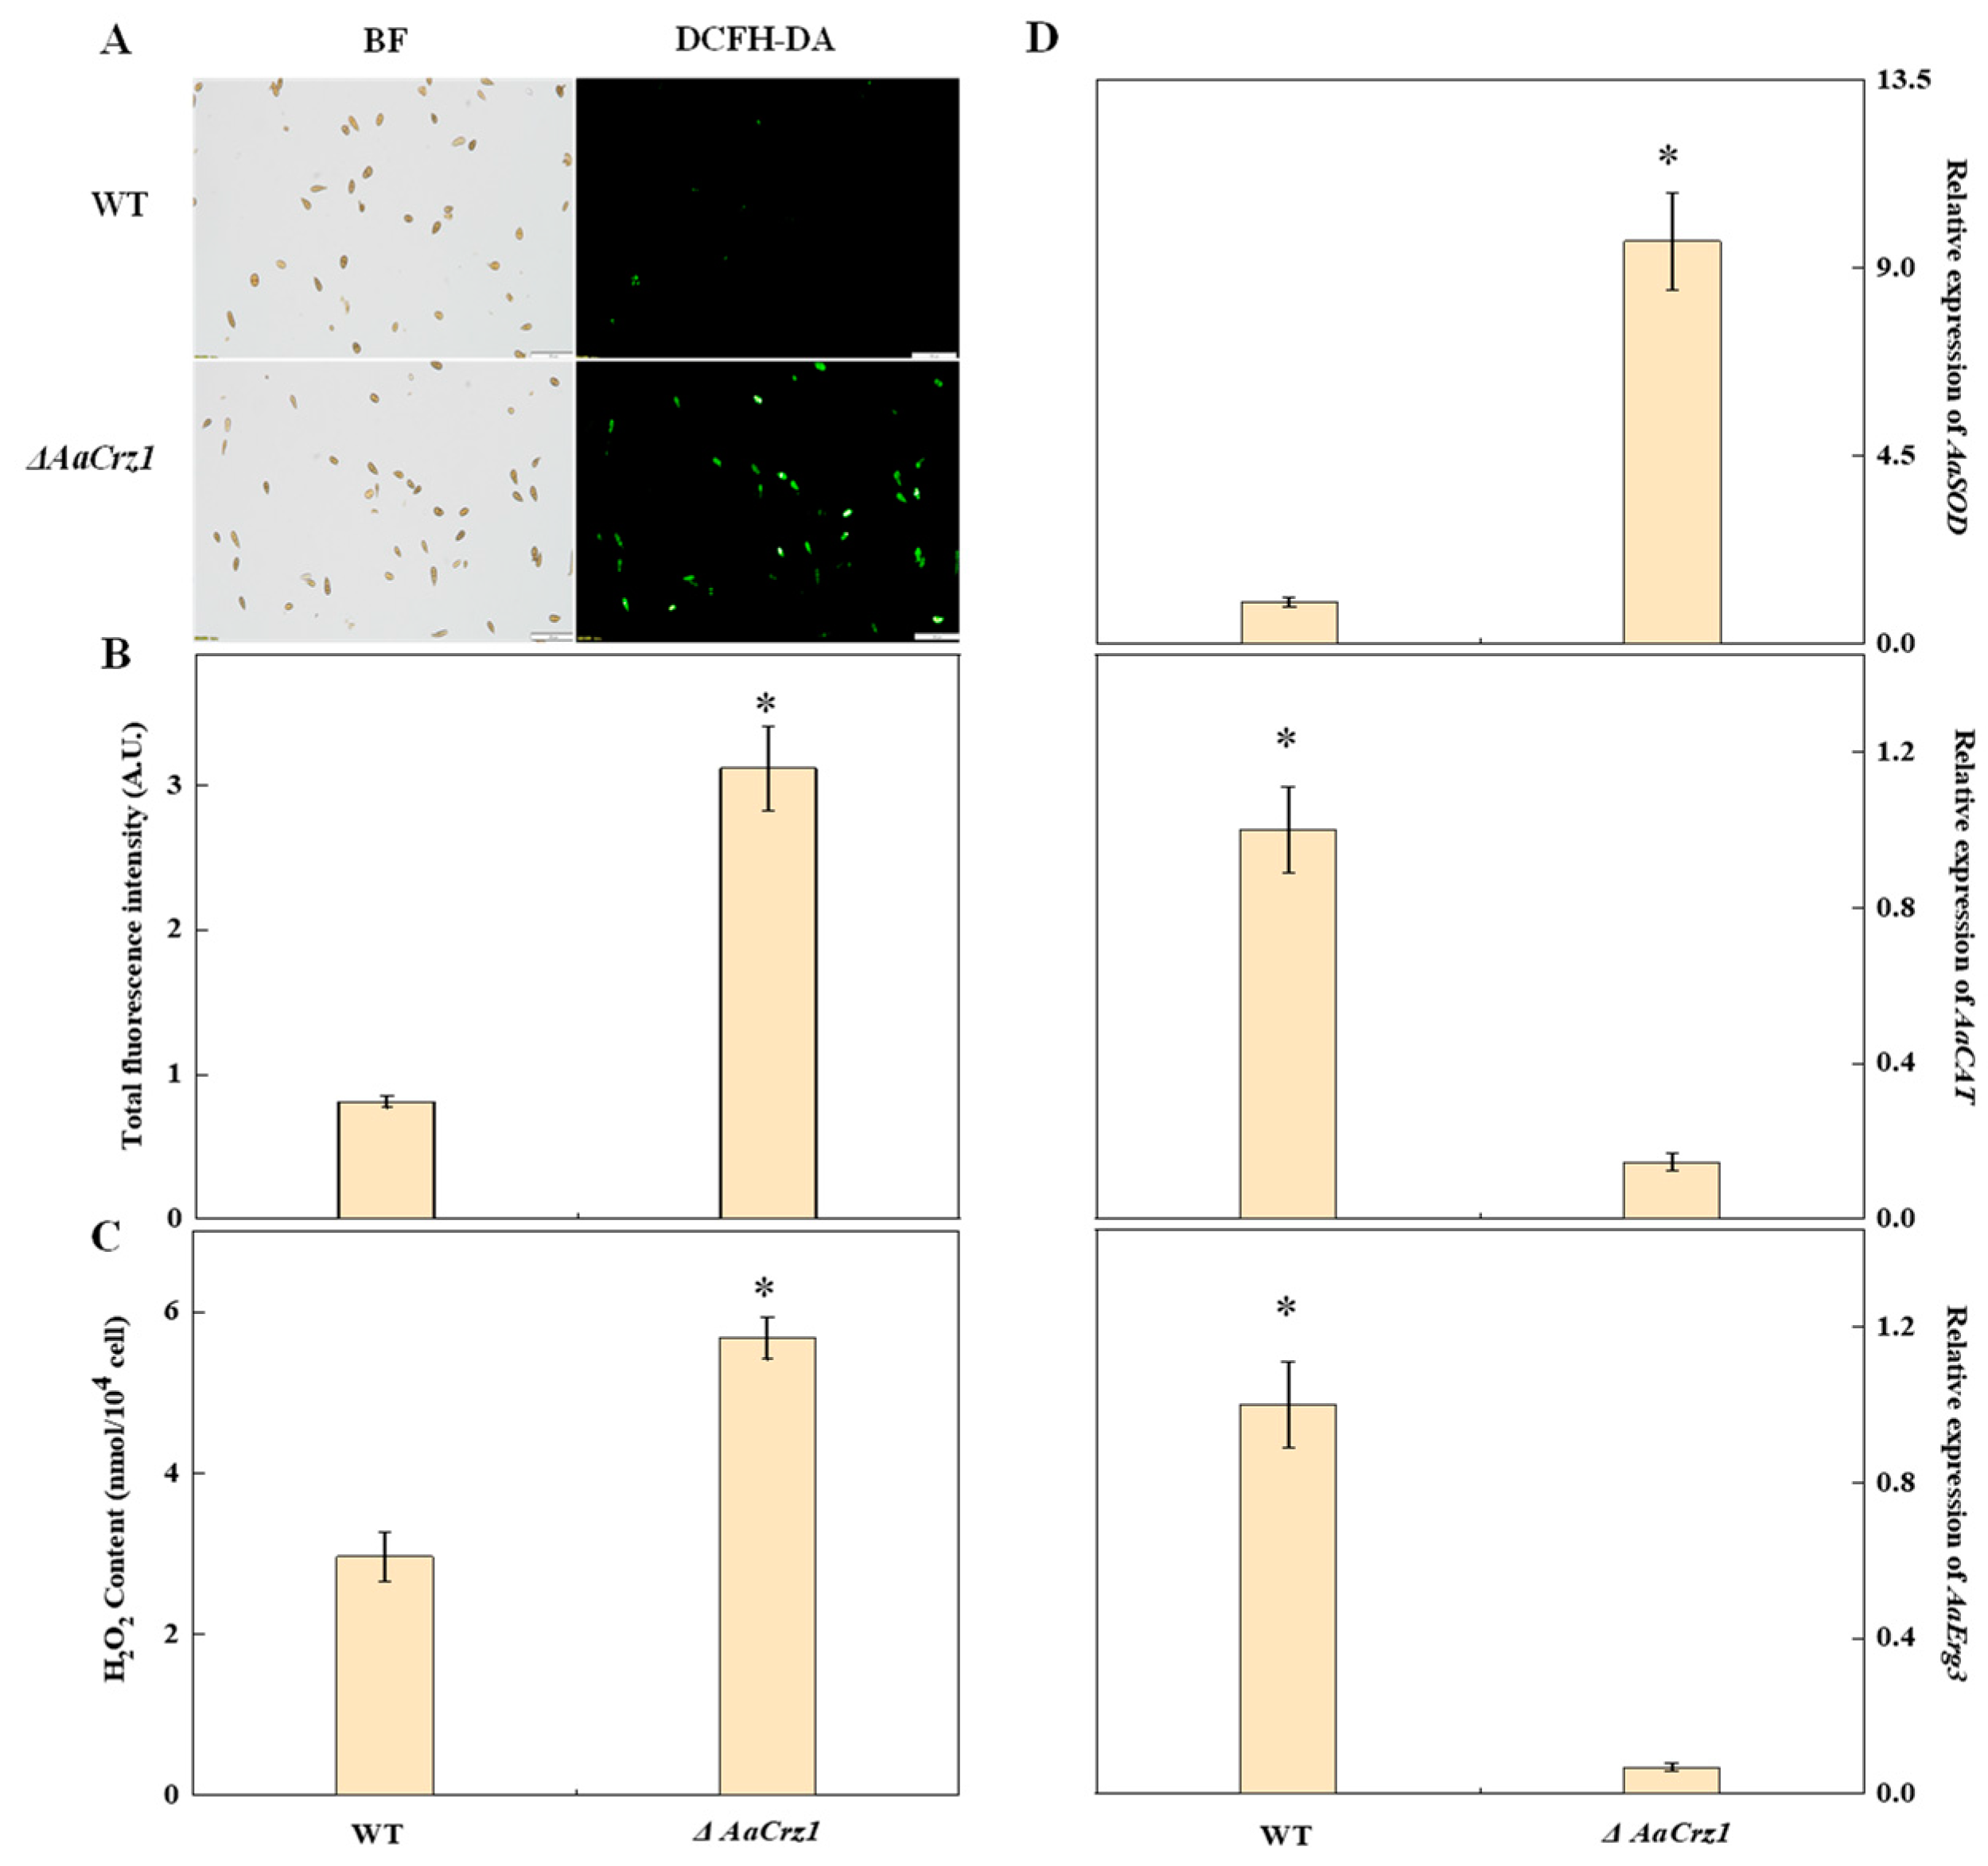
2.8. Validation of Intracellular ROS Accumulation
Elevated levels of ROS can damage fungal cell membranes and cause electrolyte leakage, ultimately leading to cell death. Therefore, fungi generate various enzymes, including superoxide dismutase (SOD) and catalase (CAT), to combat excessive ROS and counter host defense mechanisms. Fluorescence staining showed that the green fluorescence emitted by the WT spores was sparse and dim, while that of the ΔAaCrz1 spores was dense and bright (Figure 8A). The fluorescence intensity of the ΔAaCrz1 spores was significantly higher than that of the WT (Figure 8B). Compared to the WT, the ΔAaCrz1 significantly increased the H2O2 content by 1.9-fold (Figure 8C). In addition, the expression of AaSOD (ncbi_29111723), which is responsible for the disproportionation of O2•− to more stable H2O2, in ΔAaCrz1 was significantly higher than that in WT. However, the expression of AaCAT (ncbi_29121404), an important H2O2 scavenging enzyme, was significantly decreased. In addition, the expression of the AaErg3 (ncbi_29116487) gene decreased after AaCrz1 knockout (Figure 8D), which further promoted intracellular H2O2 content.
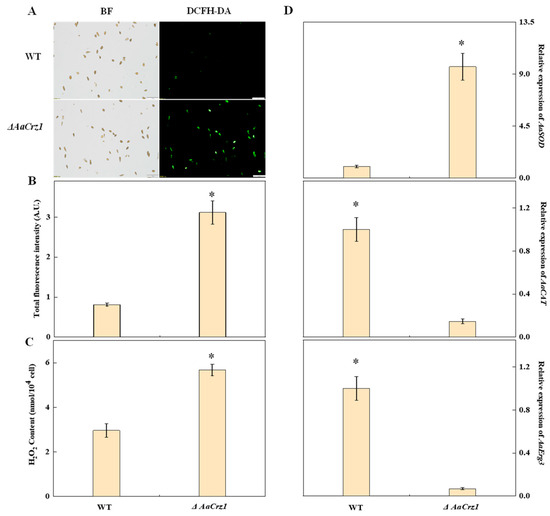
Figure 8.
Effects of AaCrz1 deletion on ROS level in A. alternata. (A) ROS staining of spores. BF: Bright field; DCFH-DA: 2,7-dichlorodi-hydrofluorescein diacetate. (B) The fluorescence intensity of spores. (C) H2O2 content. (D) The expression of ROS-related genes. Bars indicate standard errors. Each treatment was performed in parallel and repeated three times. * indicates significant differences (* p < 0.05).
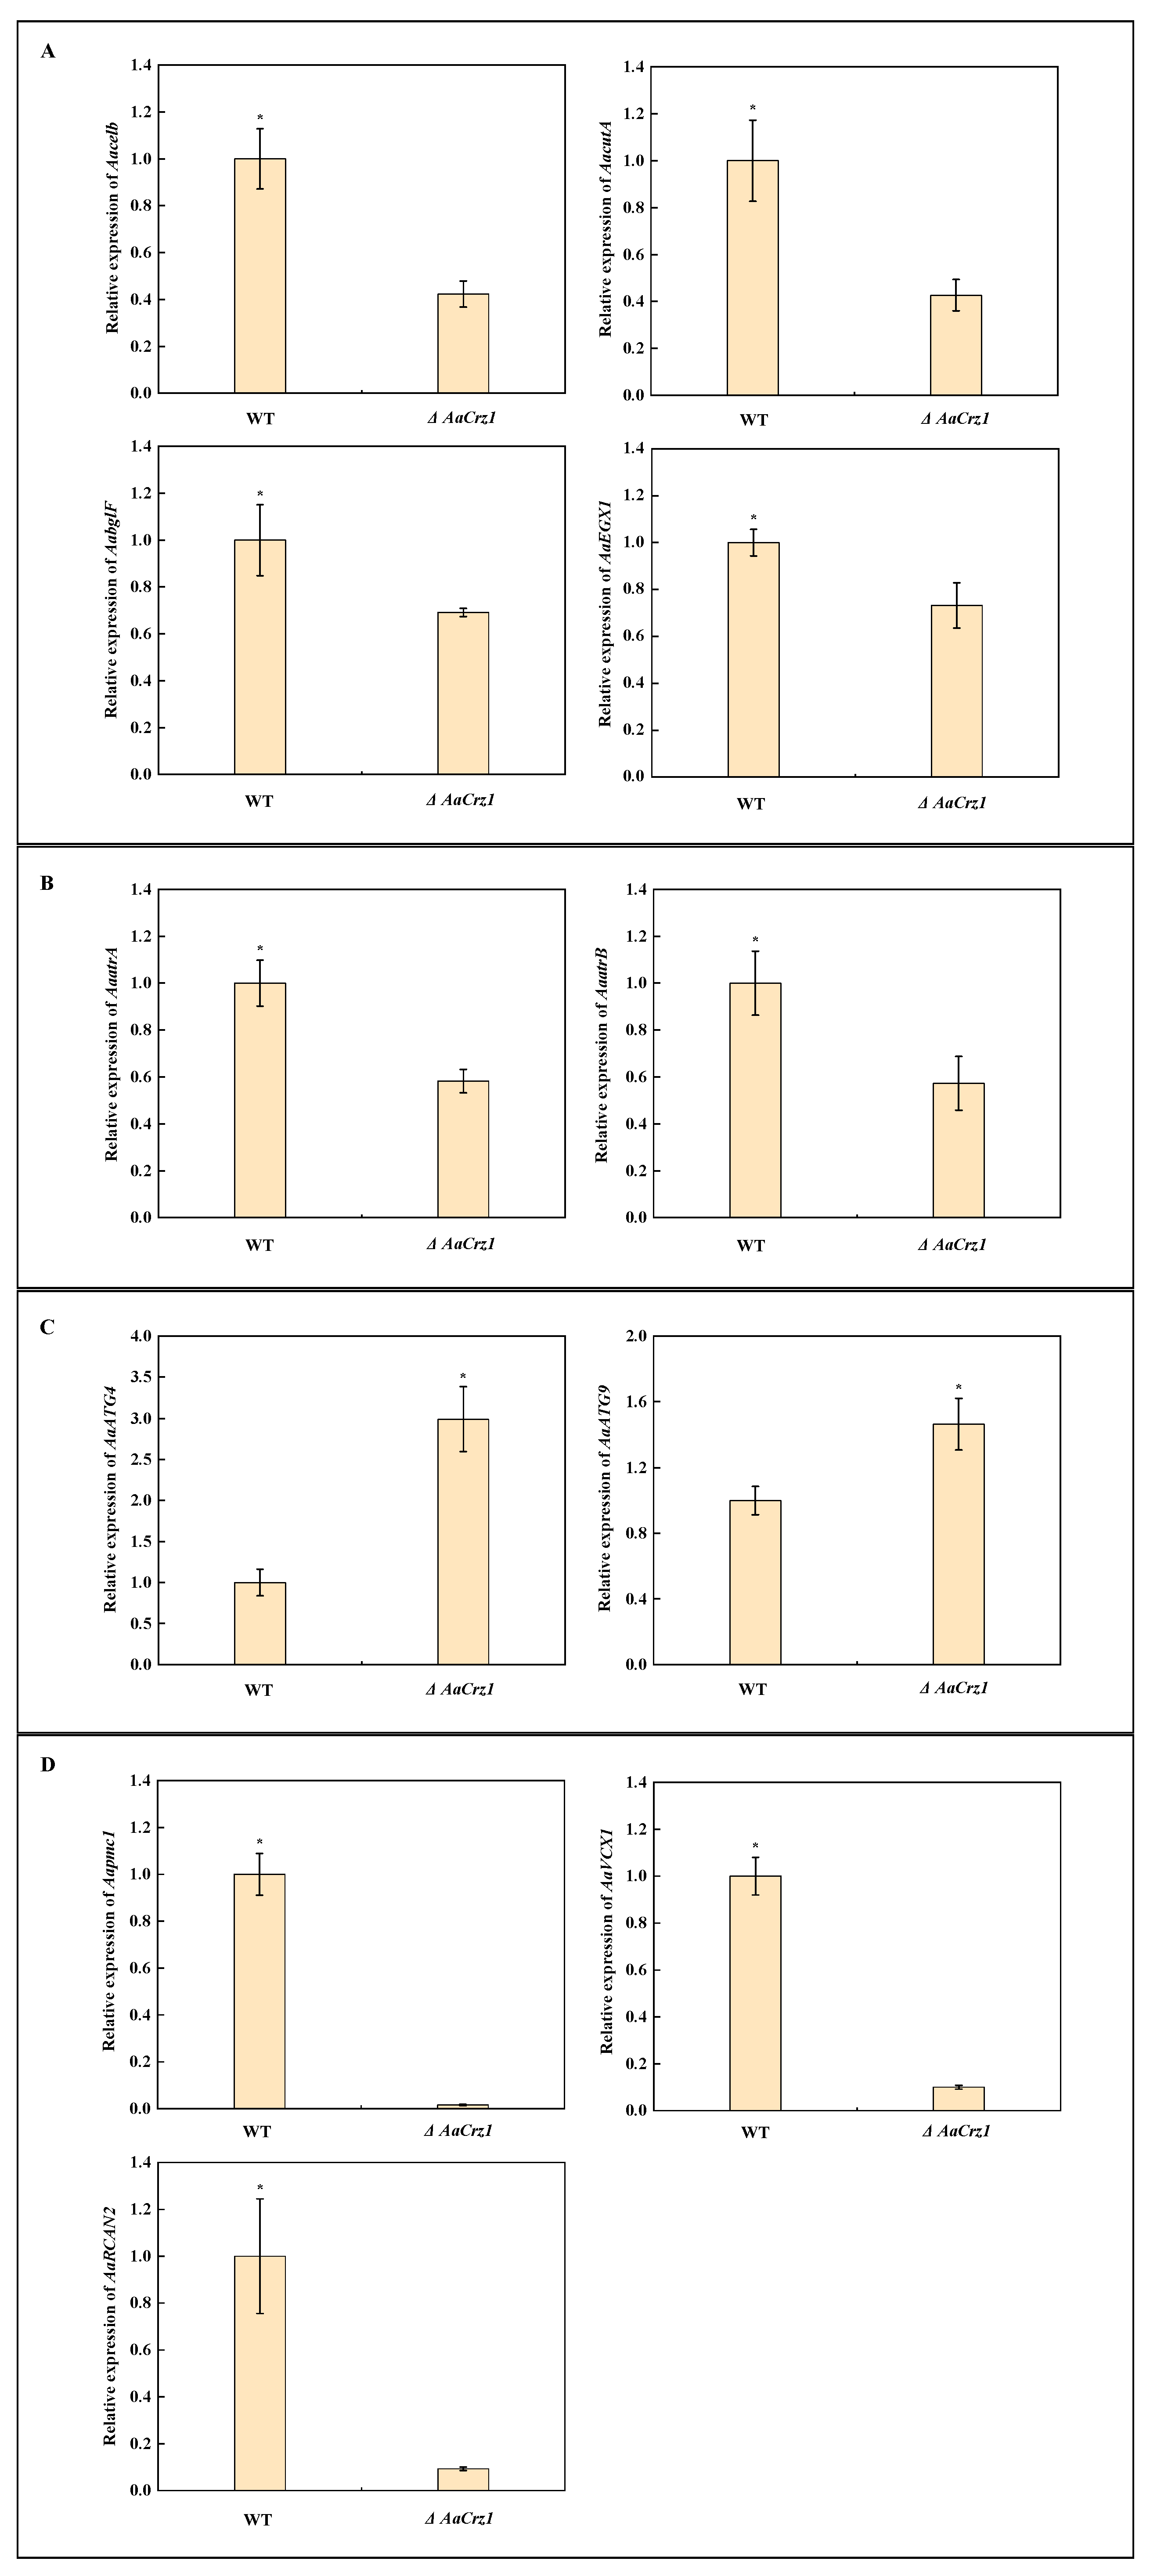
2.9. Validation of Gene Expression Associated with Cell Wall Degrading Enzymes, ABC Transporters, Autophagy, and Calcium Homeostasis
In addition to the above ROS-related genes, 11 DEGs were selected for qRT-PCR validation in order to verify the reliability of the RNA-seq data. Among them, four cell wall degrading enzyme genes, Aacelb (ncbi_29116806), AaccutA (ncbi_29117201), AabglF (ncbi_29120998), and AaEXG1 (ncbi_29108996), were significantly down-regulated in ΔAaCrz1 (Figure 9A). The expression of two genes belonging to the ABCG transporter family, AaatrA (ncbi_29117678) and AaatrB (ncbi_29110931), was inhibited (Figure 9B). The autophagy genes AaATG4 (ncbi_29109885) and AaATG9 (ncbi_29111274) were significantly up-regulated in ΔAaCrz1 (Figure 9C). The expression of genes AaVCX1 (ncbi_29118340), Aapmc1 (ncbi_29117801), and AaRCAN2 (ncbi_29109809), which are responsible for maintaining intracellular calcium homeostasis, was significantly inhibited (Figure 9D).
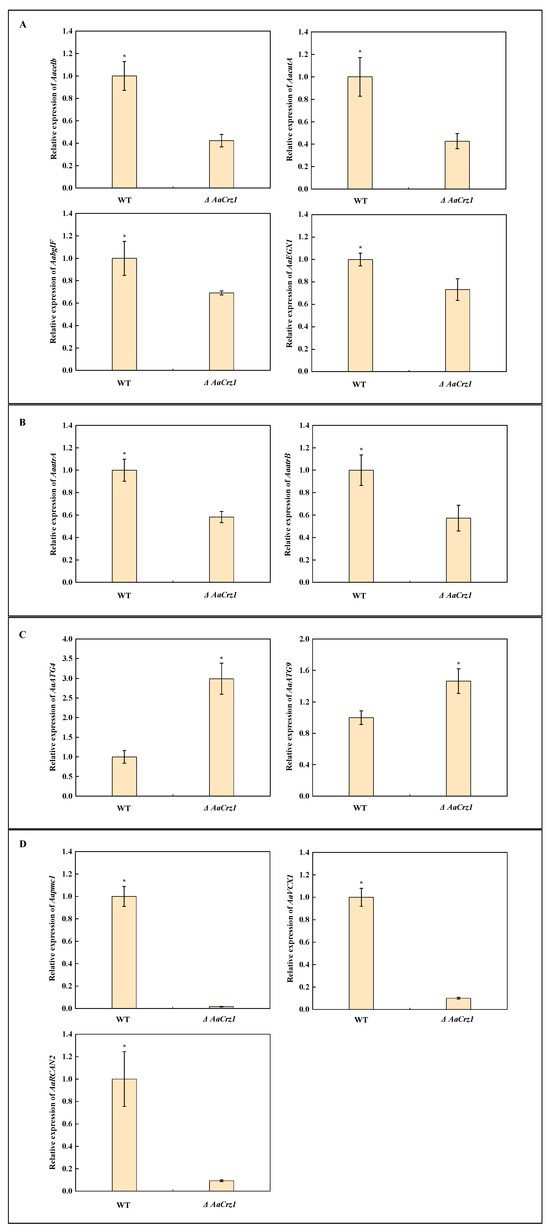
Figure 9.
The relative expression level change of 11 selected genes. (A) Genes from cell wall degrading enzymes. (B) Genes from ABC transporter. (C) Genes from autophagy. (D) Genes from calcium homeostasis. Asterisks denote significant differences (* p < 0.05).
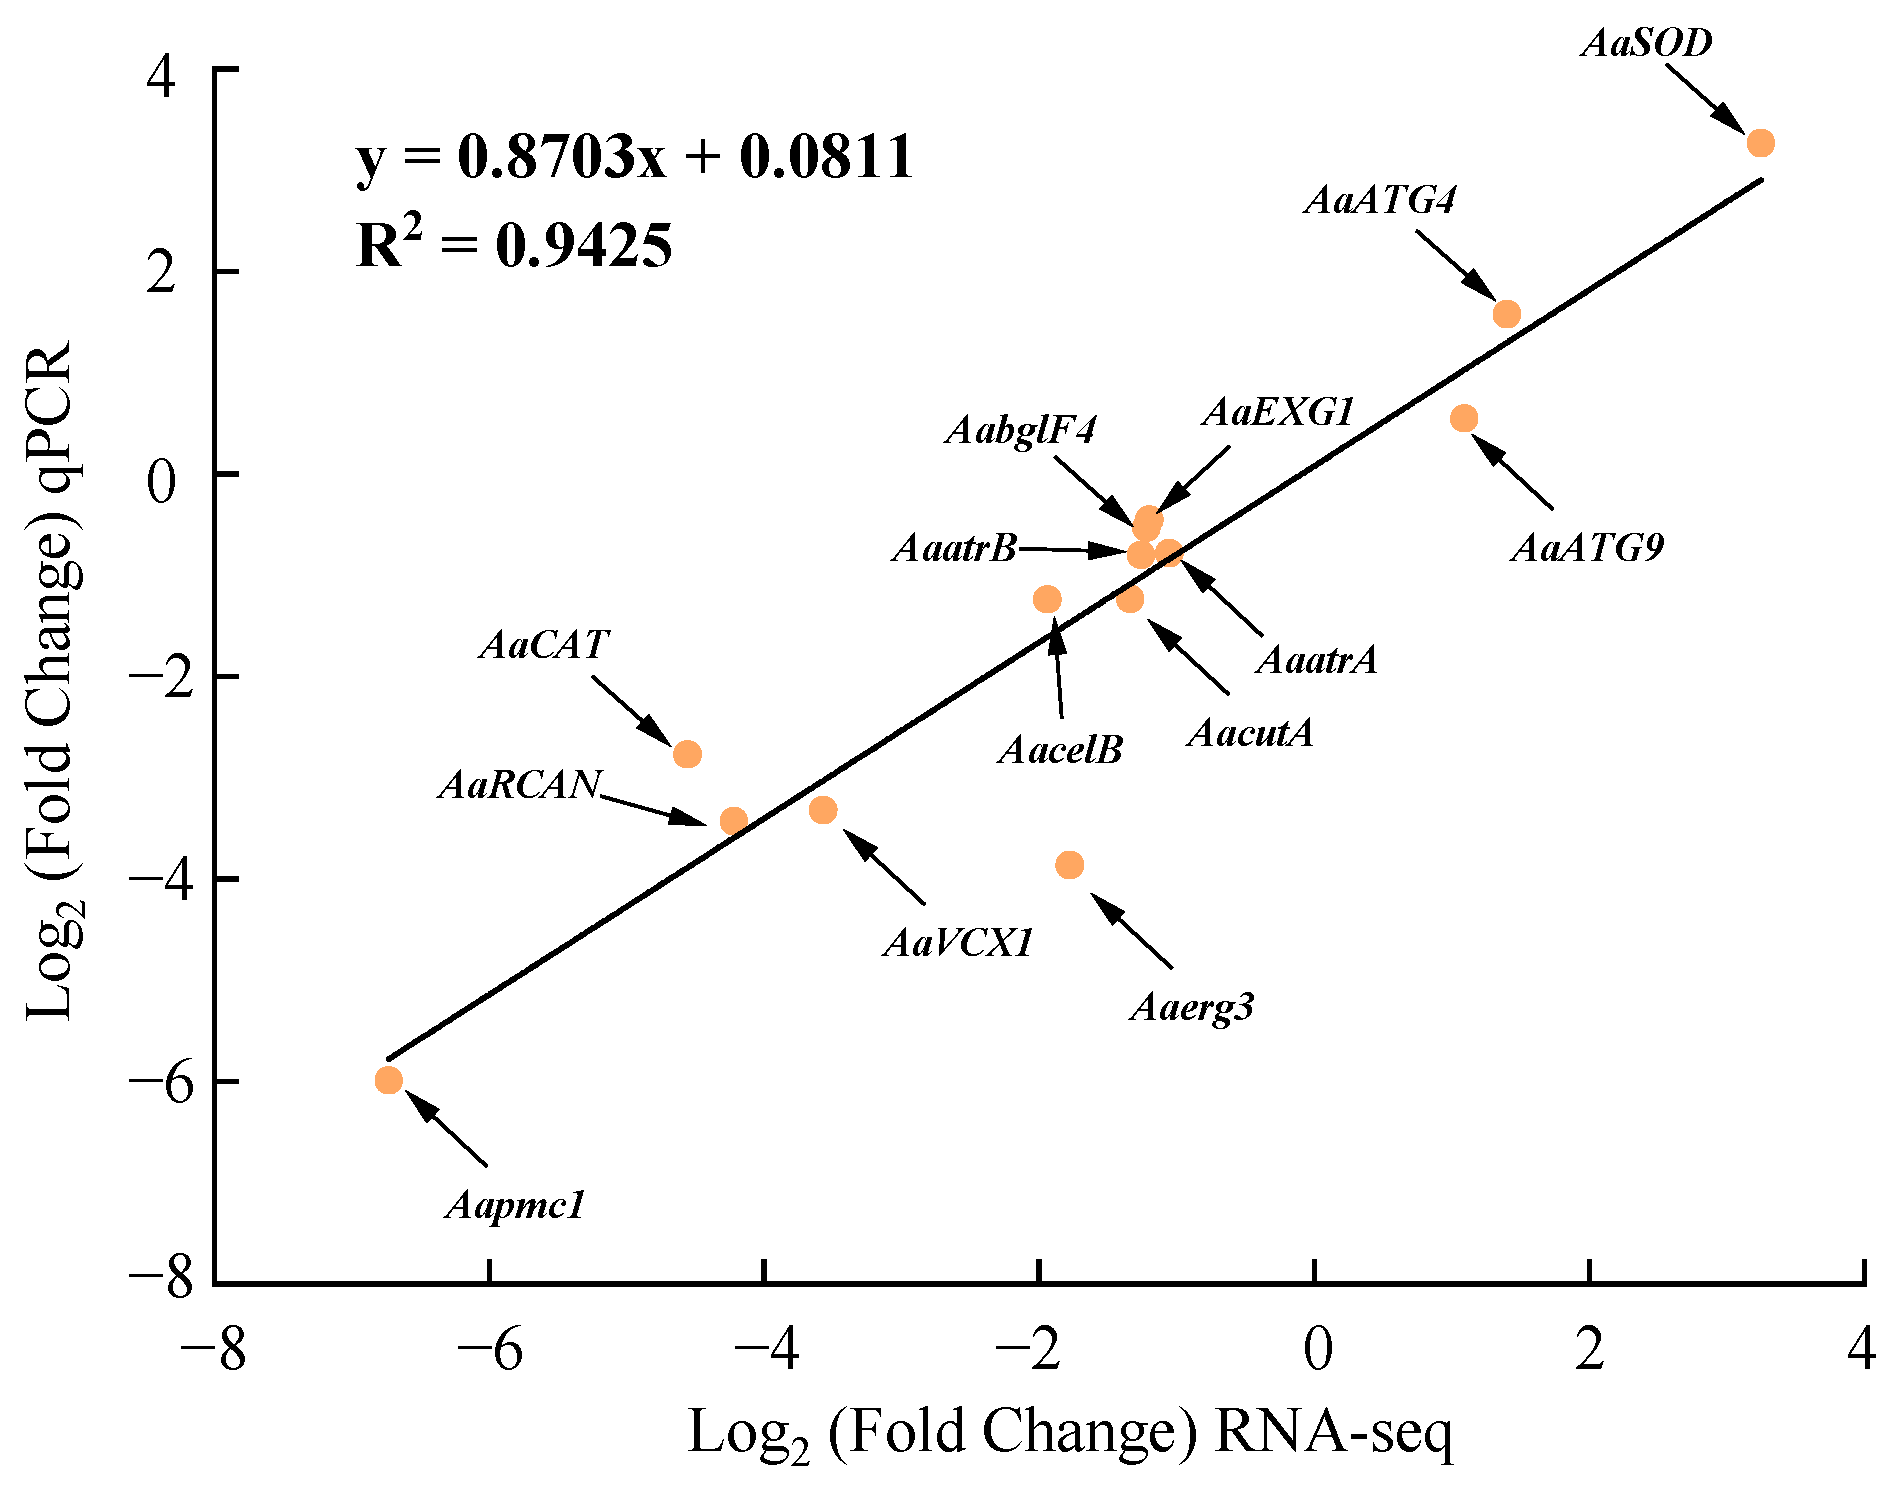
The relative expression of the 14 DEGs determined by RT-qPCR showed a good linear relationship with their expression in the transcriptome with a correlation coefficient of 0.9425, indicating that the transcriptome data were reliable and accurate (Figure 10).

Figure 10.
Regression analysis of the expression of 14 DEGs detected by RNA-seq and RT-qPCR.
3. Discussion
A. alternata is currently recognized as a cosmopolitan pathogenic fungus with a broad host range, causing disease in fruit and vegetables such as pears, citrus, broccoli, carrots, and tobacco, as well as many ornamental and weedy plants [1,24,25]. As a latent fungus, the infection structure differentiation of A. alternata plays a key role in the disease cycle [3]. Fruit surface wax plays an important role in this process [26,27,28,29]. Previous studies have shown that the highly hydrophobic surface of wax can induce fungi to produce appressoria [3,8,9,10,12,14,27,30]. The components of wax have also proven to be beneficial to the differentiation of fungal infection structures [26,27]. C26 aldehyde and C28 aldehyde in barley and wheat leaf wax are the most effective components in promoting the development of Blumeria graminis infections [26,28,29,31], indicating complex morphological structures and compositions of plant surface wax, as physical and chemical cues regulate various physiological and biochemical processes during pathogenic fungi infection.
The calcineurin responsive transcription factor Crz1 is involved in the regulation of the growth and pathogenicity of a variety of plant pathogenic fungi [19,32,33,34,35]. Our previous study found that AaCrz1, an important transcription factor in the calcium signaling pathway, was involved in the regulation of growth and development, calcium homeostasis, cell wall integrity, and pathogenicity in A. alternata [10,11]. In this experiment, we observed the effect of AaCrz1 knockout on the infection structure formation in A. alternata. The results showed that compared with WT, the ΔAaCrz1 spore germination was delayed and the rate of appressorium formation and infection hyphae formation was significantly decreased on the wax-coated onion epidermis, which directly demonstrated that the transcription factor AaCrz1 played a positive regulatory role in response to wax-induced A. alternata infection structure formation. This result was also consistent with previous results in B. graminis, Magnaporthe grisea, and Puccinia graminis [31,36,37,38]. However, there were no differences in the rates of spore germination and appressorium formation in ΔMoCRZ1 [20]. Therefore, the regulatory effect of Crz1 on infection structure formation varies with different fungal species. The specific regulatory mechanism of AaCrz1 on A. alternata infection structure formation needs further investigation.
To reveal the physiological function of AaCrz1 in the process of wax-induced infection structure formation in A. alternata, RNA-seq with a reference genome was performed on WT and ΔAaCrz1 after pear wax induction for 6 h. A total of 1427 differentially expressed genes were screened, indicating that the AaCrz1 deletion had a great effect on A. alternata gene expression (Figure 3A). GO enrichment analysis of DEGs can annotate the classification of gene GO function and analyze the significance of GO function enrichment. GO enrichment analysis showed that DEGs differed most significantly in three aspects (Figure 4B). The analysis results based on KEGG are helpful for further analysis of some significant enrichment pathway annotations in DEGs. The five most significantly enriched pathways are shown in Figure 5B.
The key to the successful infection of plant pathogenic fungi is to break through the obstacles of the host cell wall. Therefore, fungi need to secrete a variety of cell wall degrading enzymes to destroy various polysaccharides in the host cell wall. The role of CWDE as a pathogenic factor in pathogenic fungi has been verified [39,40,41]. RNA-seq data showed that the expression levels of cell wall degrading enzymes were significantly down-regulated (Figure 6). Our experiment provided reference information on the cell wall-degrading enzymes (CWDEs) genes, which will help to identify the pathogenic factors in A. alternata. ABC transporters are membrane-integrated proteins that catalyze the hydrolysis of ATP and utilize the energy generated by the hydrolysis to facilitate the transmembrane transport of substrates [42]. It is well known that ABCG plays an important role in the multidrug resistance of fungi [43,44,45]. The expression of two ABC transporter genes was significantly down-regulated in ΔAaCrz1.
The production of ROS as a means of resisting pathogens is an early defence response of plants to pathogenic fungal infection [46]. In response, pathogenic fungi have also formed a powerful antioxidant system, including superoxide dismutase (SOD), catalase (CAT), peroxidase (POD), glutathione (GLU), and thioredoxin [47,48]. Peroxisomes can maintain the dynamic balance of ROS in cells by producing and removing ROS. When Fusarium graminearum is unable to maintain intracellular ROS homeostasis due to dysfunctional peroxisomes, the level of ROS accumulation in the mycelium is elevated and it is more sensitive to reactive oxygen bursts produced by the plant during the infection process [32]. In this study, ΔAaCrz1 showed higher ROS fluorescence intensity and H2O2 content, suggesting that AaCrz1 deletion resulted in antioxidant system disruption in A. alternata. Deletion of ERG3 gene encoding the C-5 sterol desaturase has been reported to result in a failure of sterol synthesis, which alters the composition of cell membrane lipids and thus alters the anisotropy of the cell membrane to H2O2, allowing more H2O2 to enter the cell and leading to an increase in intracellular ROS levels [49,50,51,52]. RNA-seq results confirmed that Erg3 (ncbi_29116487) was significantly down-regulated, so we hypothesized that this would lead to an increase in ROS levels in ΔAaCrz1. Intracellular accumulation of ROS caused oxidative damage to proteins, nucleic acids, and other cellular components [53,54], and these oxidative damages further acted as inducers of autophagy [55]. KEGG pathway enrichment analysis showed that DEGs were up-regulated in autophagy-other pathways, including several important proteins in the process of autophagy, such as ATG4 (ncbi_29109885), which plays a major role in macroautophagy [56], ATG9 (ncbi_29111274), an important source of membrane components required for early autophagosome formation [57], and ATG1 (ncbi_29117977), a key regulatory center protein kinase upstream of autophagy mechanism [58,59]. Taken together, we speculate that ROS accumulation in ΔAaCrz1 induces an increase in autophagy level, although this warrants further exploration and examination.
Ca2+ is an essential regulator of many pathways in all eukaryotic cells, and disruption of calcium homeostasis would severely interfere with the related metabolic processes. Therefore, cells have evolved elaborate calcium homeostasis systems to regulate intracellular Ca2+ levels [60]. RNA-seq showed that two calcium transport genes, pmc1 (ncbi_29117801, ncbi_29120094) and VCX1 (ncbi_29118340, ncbi_29119593), located on the vacuolar membrane were significantly down-regulated in ΔAaCrz1. Studies have shown that Pmc1 and VCX1 knockout impaired intracellular calcium transport, resulting in a significant increase in cytosol calcium ion levels. In addition, Pmc1 plays a key role in the pathogenesis of Cryptococcosis [61]. Calcineurin regulator (RCANs) (also known as calcium vasopressin) directly bind to the catalytic subunit of calcineurin and regulate the phosphatase activity of calcineurin [62]. In plant pathogenic fungi, RCAN deficiency severely reduced mycelial growth, spore formation and virulence [63,64,65]. From the RNA-seq results, we identified a structural gene belonging to this family, RCAN2 (ncbi_29109809) (Supplementary Table S2), which was significantly down-regulated in ΔAaCrz1. Thus, intracellular calcium homeostasis in A. alternata was affected by AaCrz1 knockdown, which is consistent with our previous results [10].
When fungal cells are exposed to various external stimuli, such as high temperature, low temperature, hyperosmolarity, oxidative stress, or antifungal drugs, Ca2+-mediated signaling induces an instantaneous increase in intracellular Ca2+ [66,67]. Free intracellular Ca2+ binds to calmodulin (CaM) to form a Ca2+/CaM complex to activate calcineurin (CaN), which further dephosphorylates the transcription factor Crz1 to the nucleus [11,68]. Crz1 containing the zinc finger domain can specifically bind to the CDREs sequence of about 24 bp to regulate the expression of target genes [16,69]. The STRING protein database was used to predict proteins that interact with AaCrz1. As shown in Figure 7, 30 proteins were screened.
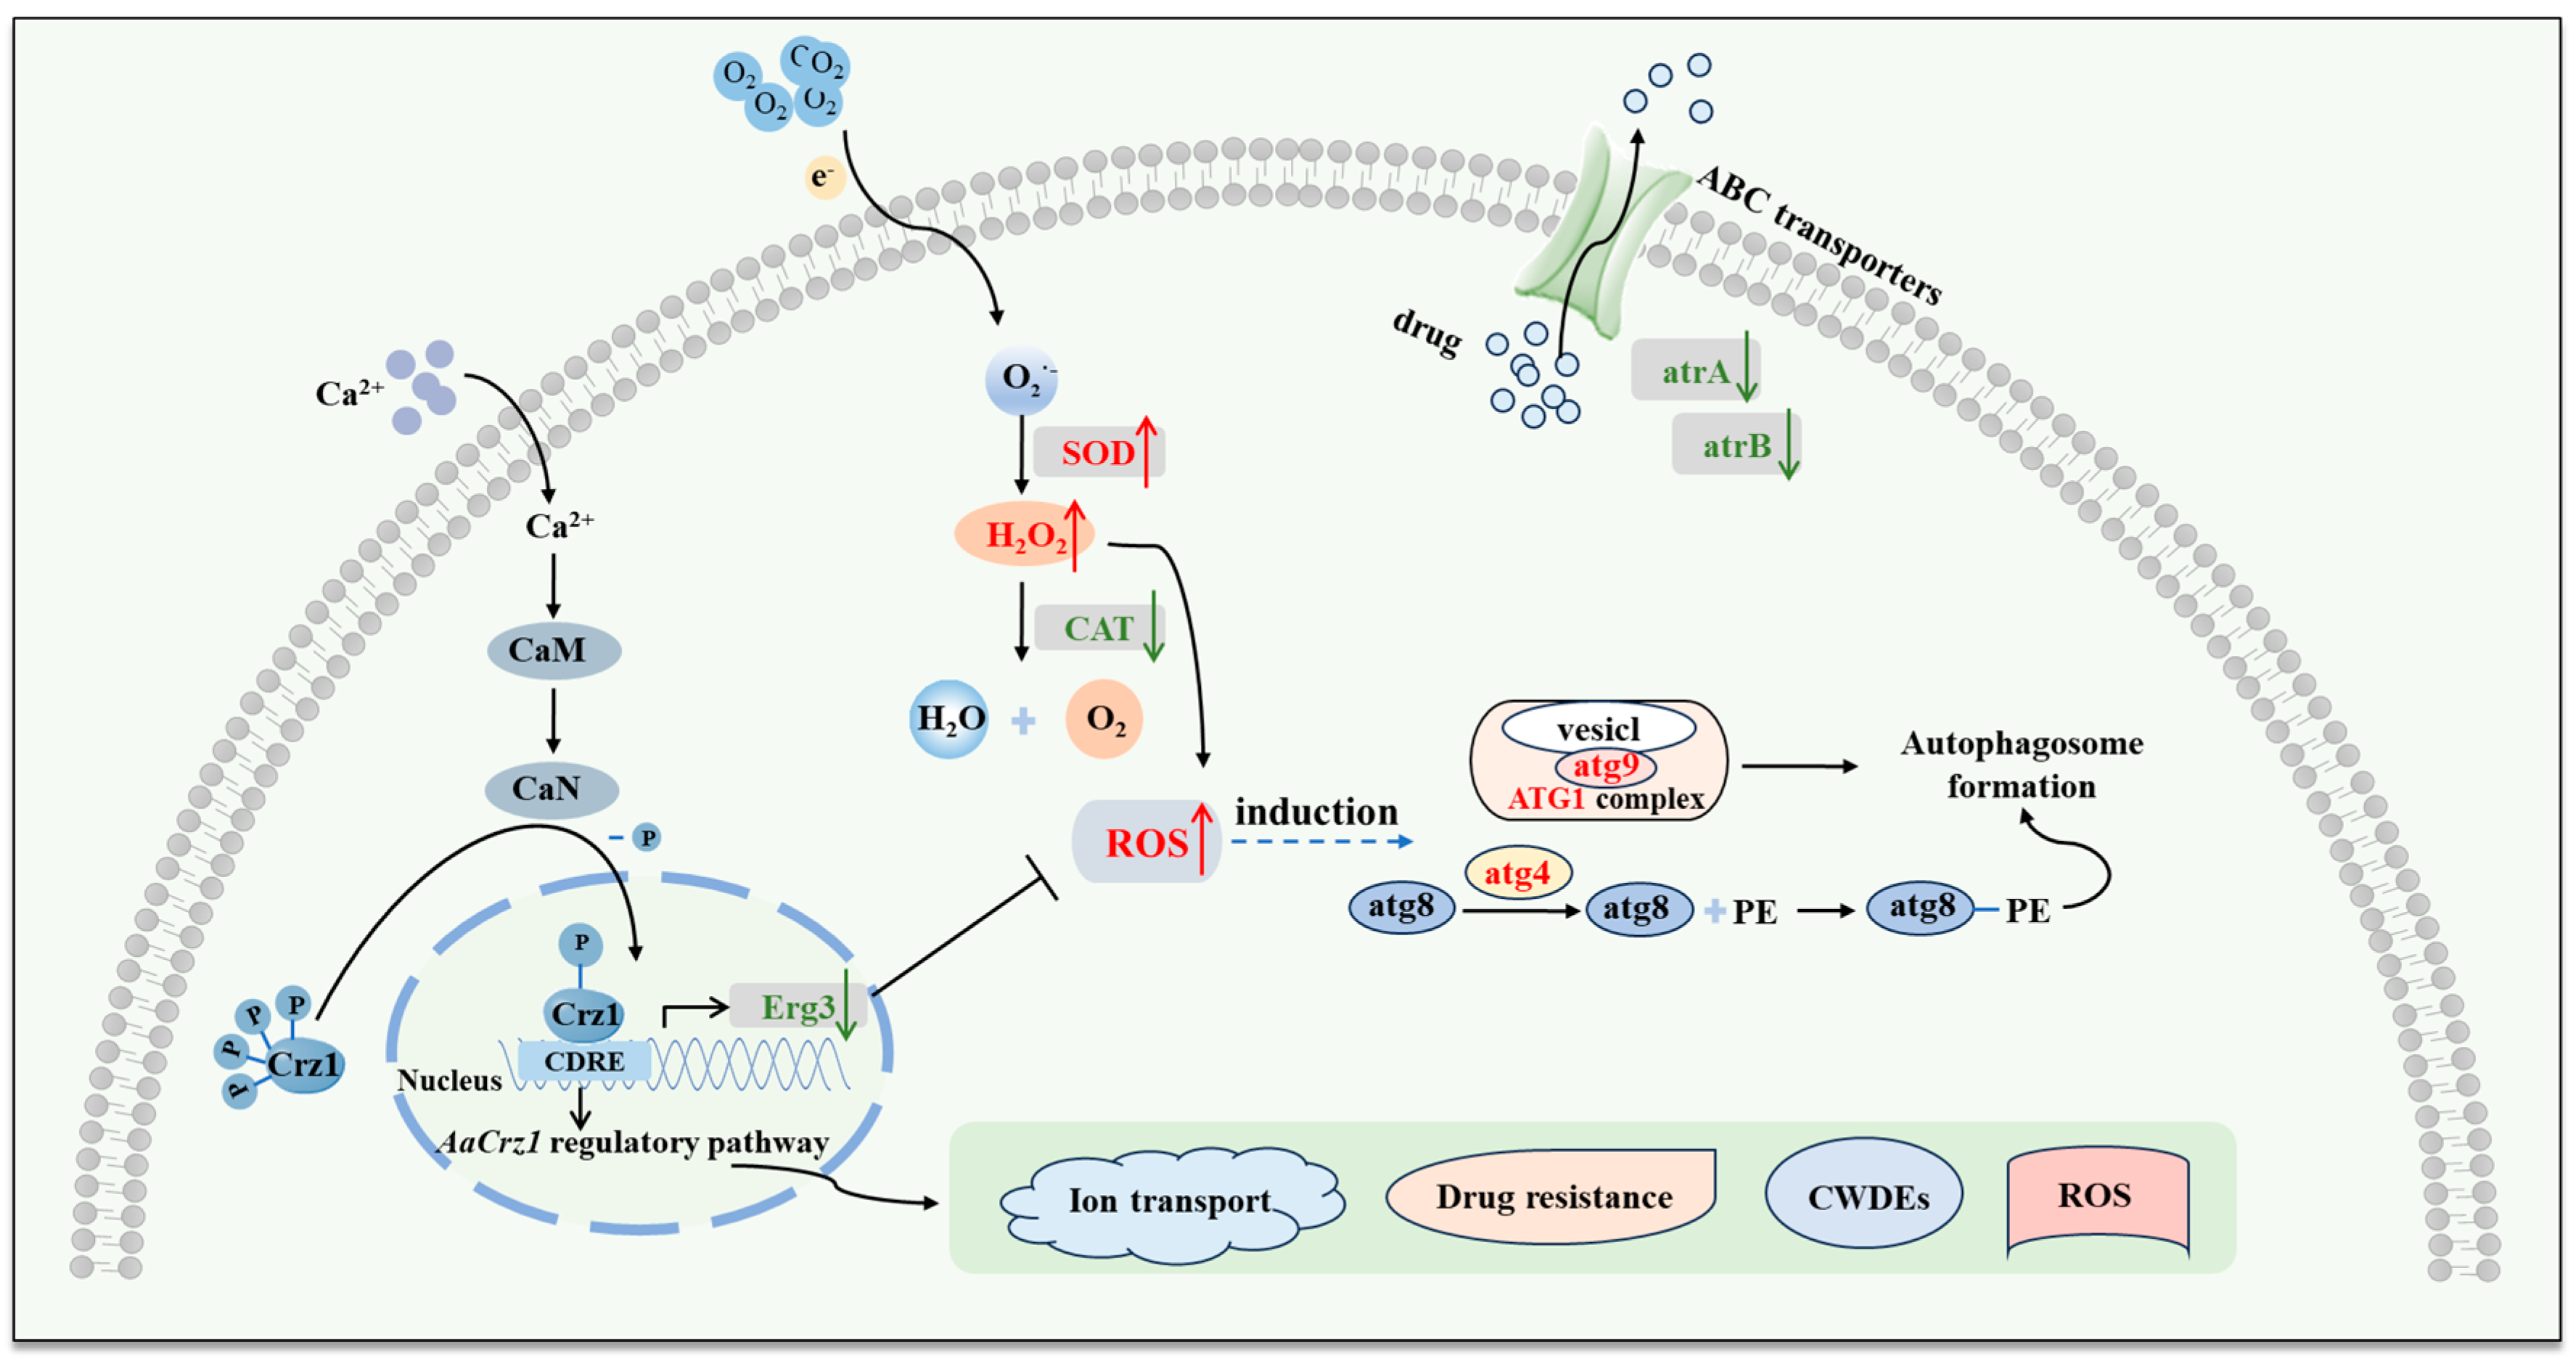
Based on current investigation results, our previous findings in the phenotypic observation of ΔAaCrz1, and studies from other researchers, the mechanisms of AaCrz1 regulating the biological function of A. alternata and the mode of AaCrz1 knockout inducing changes in A. alternata were schematically illustrated (Figure 11). Intracellular free Ca2+ binds to CaM and CaN, and then the activated CaN dephosphorylates Crz1 in the cytoplasm and enters the nucleus to regulate target gene expression [11,15,16]. The transcription factor Crz1 is involved in several biological processes such as fungal vegetative growth, infection structure formation, cell wall integrity, calcium homeostasis, stress resistance, and virulence [10,17,20,21,34,35]. RNA-seq results showed that the antioxidant system of A. alternata was damaged and the ROS level was increased after AaCrz1 knockout. In addition, the expression of Erg3 was down-regulated, which promoted the entry of external H2O2 into the cell (Figure 8). The expression level of autophagy genes was up-regulated, which we hypothesized might be induced by elevated ROS levels in vivo. The expression levels of atrA and atrB, two genes responsible for drug efflux, were also decreased in ΔAaCrz1. In conclusion, the RNA-seq data provide clues for exploring the specific regulatory mechanism of AaCrz1 in response to cuticular wax signaling involved in the infection structure differentiation and pathogenicity of A. alternata.
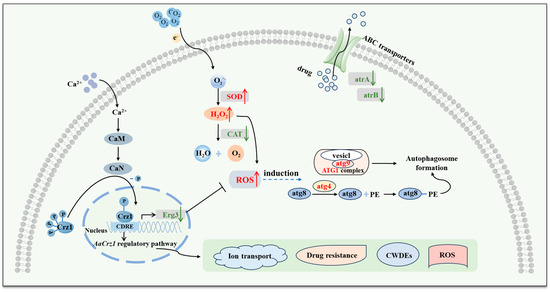
Figure 11.
The mechanism of AaCrz1 regulating the biological functions of A. alternata, and the pattern of in vivo changes in A. alternata induced by AaCrz1 knockout. The red font and red arrows represent up-regulated gene expression or increased substance content, and the green font and green arrows represent down-regulated gene expression in the figure.
4. Material and Methods
4.1. Fungal Strains
The wild type (WT) and ΔAaCrz1 strains of A. alternata used in this study have been previously characterized [10].
4.2. Wax Extraction from “Zaosu” Pear Peel
According to the method of Tang et al. [3], “Zaosu” pear specimens without the presence of pests and diseases were selected, cleaned, and dried at room temperature. The pear fruit was completely immersed in chloroform solution for 30 s, and then the chloroform enriched with wax extract was placed in a constant temperature vacuum distillation device to remove chloroform and obtain wax crude extract. The wax crude extract was blown to powder using a nitrogen blowing apparatus and stored at 4 °C for subsequent experiments.
4.3. Observation of the Infection Structure Formation of A. alternata Induced by Pear Wax in Onion Epidermis
According to the method of Yang et al. [10], the onion was cut into a size of 2 cm × 2 cm and the epidermal membrane was removed. The onion membrane was placed in chloroform for 1 min for dewaxing, and then the fruit wax extract was evenly spread with a spreader. Then, 20 μL spore suspensions of the WT, ΔAaCrz1, and ΔAaCrz1-C specimens were added to the treated onion membrane, respectively. The process of A. alternata infection structure formation was observed under an optical microscope, and the spore germination rate (%), appressorium formation rate (%), and infection hyphae formation rate (%) were calculated at 2 h, 4 h, 6 h, and 8 h of incubation at 28 °C, respectively. Each treatment had three parallels, and 100 conidia were counted each time.
4.4. Sample Preparation, RNA Extraction, Library Construction and Sequencing for Transcriptomes
Spore suspensions of the WT and ΔAaCrz1 strains at a concentration of 1 × 10⁶ conidia mL−1 were prepared and then inoculated on the hydrophobic surface of the Gelbond PAG membrane coated with pear wax extract. The hydrophobic membrane containing the spore suspension was carefully placed in a petri dish with a moist circular filter paper (used to provide the humidity required for spore germination) at the bottom and placed in a dark incubator at 28 °C. After 6 h, the spores on the Gelbond PAG membrane were rapidly collected into a centrifuge tube to collect spore precipitation, then frozen in liquid nitrogen and stored at −80 °C for RNA-seq. Each treatment was repeated three times. The six samples of WT and ΔAaCrz1 were named WT-1, WT-2, WT-3, M-1, M-2, and M-3, respectively. Total RNA was extracted using the Trizol Kit (Invitrogen, Carlsbad, CA, USA) with some modifications according to the manufacturers’ instructions. The quality of extracted RNA was examined using agarose gel electrophoresis, a NanoPhotometer spectrophotometer, a Qubit 2.0 Fluorometer, and an Agilent 2100 bioanalyzer to fulfill the database construction requirements. RNA libraries were sequenced on the Illumina sequencing platform by Genedenovo Biotechnology Co., Ltd. (Guangzhou, China).
4.5. Reference Genomes and Reference Genes
Since a reference genome was already available for A. alternata [52], the clean data for the samples WT-1, WT-2, WT-3, M-1, M-2, and M-3 were compared with the reference genome and reference genes, respectively.
4.6. Functional Annotation and GO and KEGG Classification
False Discovery Rate (FDR) ≤ 0.05 and FoldChange ≥ 2 were used as screening criteria for differential expression analysis. Databases used for transcriptome analysis included GO (https://www.geneontology.org/, accessed on 16 October 2023) and KEGG (https://www.genome.jp/kegg, accessed on 16 October 2023).
4.7. Interaction Network Analysis
The STRING protein interactions database (http://string-db.org, accessed on 25 October 2023) was applied to analyze the protein interactions of differential genes. For species included in the database, the set of differential genes was extracted from the database and cytoscape was used to construct the interactions network map; for species not included in the database, the sequences in the target gene set were firstly exposed to blast comparison with the protein sequences of the reference species included in the STRING database, and the protein interactions of this reference species determined by comparison were used to construct the interactions network.
4.8. Gene Expression Validation by RT-qPCR
The target gene sequences of A. alternata were obtained from NCBI. The primer sequences are shown in Supplementary Table S4. Quantitative RT-qPCR experiments were performed using the Takara Bioengineering (Dalian, China) kit. The PrimeScript™ RT reagent Kit with gDNAEraser (Perfect Real Time) cDNA synthesis kit (RR047A) was used to obtain cDNA. Fluorescence quantification was performed using the abm®Eva Green qPCR MasterMix-ROX kit. The PCR reaction system and PCR conditions are listed in Supplementary Tables S5 and S6. The relative expression levels of the genes were calculated using the 2−ΔΔCt method.
4.9. ROS Staining Observation
ROS staining of spores was performed using 2,7-dichlorodi-hydro fluorescein diacetate (DCFH-DA, D6470, Solarbio Science & Technology Co., Ltd., Beijing, China). DCFH-DA staining solution with a concentration of 1 g L−1 was prepared with DMSO reagent and stored at −20 °C for later use. A total of 1 mL spore suspension (1 × 10⁶ spores mL−1) of the WT and ΔAaCrz1 mutant were placed in a 1.5 mL centrifuge tube and centrifuged at 8000× g and 4 °C for 10 min, and the supernatant was collected. The precipitate was suspended in 1 mL of PBS (0.01 M, pH 7.2–7.4) buffer, and 10 μL of DCFH-DA staining solution was added, and stained for 30 min in a 37 °C incubator protected from light. After two washes with 1 mL of PBS (0.01 M, pH 7.2–7.4) buffer and resuspension, 20 μL was aspirated and placed under a fluorescence microscope (CX21FS1C, Olympus, Tokyo, Japan) and photographed. The fluorescence intensity of spores was measured using ImageJ 2.
4.10. Determination of H2O2 Content
H2O2 content was determined using kits (Beijing Solarbio Science & Technology Co., Ltd., BC3595, Beijing, China). The spores were broken by ultrasonic wave (power 20%, ultrasonic 3 s, interval 10 s, repeated 30 times), followed by centrifugation at 8000× g and 4 °C for 10 min, and the supernatant was used to determine the content of H2O2. H2O2 content was determined according to the kit instructions, at 415 nm absorbance and expressed as μmol/104 cell.
4.11. Statistical Analysis
Data for transcriptome analysis were plotted using the OmicShare tool (https://www.omicsshare.com/tools, accessed on 8 October 2023). The mean and standard deviation of RT-qPCR data were calculated using Microsoft Office 2010, and the data were plotted using Origin 8.5. Duncan’s multiple difference analysis was performed using SPSS 26.0 (p < 0.05).
5. Conclusions
In summary, AaCrz1 contributes to the infection structure formation in A. alternata during the early infection stage. Moreover, our results provide clues for exploring the specific regulatory mechanism of AaCrz1 in response to cuticular wax signaling involved in the infection structure differentiation and pathogenicity of A. alternata, especially involving a series of metabolic pathways such as cell wall degrading enzymes, ABC transporters, antioxidant capacity, autophagy, and ion homeostasis. The RNA-seq results will provide data support for searching for potential genes or proteins in A. alternata as targets for black spot disease control. Moreover, the findings will contribute to the development of target-based fungicides for postharvest disease control using molecular techniques such as synthetic dsRNA technology.
Supplementary Materials
The following supporting information can be downloaded at: https://www.mdpi.com/article/10.3390/ijms252211950/s1.
Author Contributions
Writing—original draft, Writing—review and editing, Y.Y.; Data curation, P.X.; Formal analysis, Y.N.; Software, X.X.; Validation and visualization, J.Y.; Project administration, funding acquisition and supervision, Y.L.; Resources and methodology, Y.B.; Conceptualization, D.P. All authors have read and agreed to the published version of the manuscript.
Funding
This study was supported by the National Natural Science Foundation of China (32372411 and 32060567).
Institutional Review Board Statement
Not applicable.
Informed Consent Statement
Not applicable.
Data Availability Statement
Data are contained within the article and Supplementary Material.
Acknowledgments
The authors would like to thank the anonymous reviewers for helpful comments.
Conflicts of Interest
The authors declare no conflicts of interest.
References
- Li, Y.C.; Bi, Y.; An, L.Z. Occurrence and latent infection of Alternaria rot of Pingguoli pear (Pyrus bretschneideri Rehd. cv. Pingguoli) fruits in Gansu, China. J. Phytopathol. 2006, 155, 56–60. [Google Scholar] [CrossRef]
- Fu, H.L.; Chung, K.R.; Gai, Y.P.; Mao, L.J.; Li, H.Y. The basal transcription factor II H subunit Tfb5 is required for stress response and pathogenicity in the tangerine pathotype of Alternaria alternata. Mol. Plant Pathol. 2020, 21, 1337–1352. [Google Scholar] [CrossRef] [PubMed]
- Tang, Y.; Li, Y.C.; Bi, Y.; Wang, Y. Role of pear fruit cuticular wax and surface hydrophobicity in regulating the prepenetration phase of Alternaria alternate infection. J. Phytopathol. 2017, 165, 313–322. [Google Scholar] [CrossRef]
- Wang, K.L.; Ngea, G.L.N.; Godana, E.A.; Shi, Y.; Lanhuang, B.E.; Zhang, X.; Zhang, H.Y. Recent advances in Penicillium expansum infection mechanisms and current methods in controlling P. expansum in postharvest apples. Crit. Rev. Food Sci. Nutr. 2021, 15, 2598–2611. [Google Scholar] [CrossRef]
- Hegde, Y.; Kolattukudy, P.E. Cuticular waxes relieve self-inhibition of germination and appressorium formation by the conidia of Magnaporthe grisea. Physiol. Mol. Plant Pathol. 1997, 51, 75–84. [Google Scholar] [CrossRef]
- Warwar, V.; Dickman, M.B. Effect of calcium and calmodulin on spore gemination and appressorium development in Colletotrichum trifolii. Appl. Environ. Microb. 1996, 62, 74–79. [Google Scholar] [CrossRef]
- Neer, E.J. Heterotrimeric G proteins: Organizers of transmembrane signals. Cell 1995, 80, 249–257. [Google Scholar] [CrossRef]
- Jiang, Q.Q.; Mao, R.Y.; Li, Y.C.; Bi, Y.; Liu, Y.X.; Zhang, M.; Li, R.; Yang, Y.Y.; Prusky, D.B. AaCaM is required for infection structure differentiation and secondary metabolites in pear fungal pathogen Alternaria alternata. J. Appl. Microbiol. 2022, 133, 2631–2641. [Google Scholar] [CrossRef]
- Zhang, M.; Li, Y.C.; Wang, T.L.; Bi, Y.; Li, R.; Huang, Y.; Mao, R.Y.; Jiang, Q.Q.; Liu, Y.X.; Prusky, D.B. AaPKAc regulates differentiation of infection structures induced by physicochemical signals from pear fruit cuticular wax, secondary metabolism, and pathogenicity of Alternaria alternata. Front. Plant Sci. 2021, 12, 642601. [Google Scholar] [CrossRef]
- Yang, Y.Y.; Xie, P.D.; Yuan, J.; Liu, Y.X.; Zhang, M.; Li, Y.C.; Bi, Y.; Prusky, D.B. The calcineurin-responsive transcription factor Crz1 is required for regulation of infection structure differentiation, calcium homeostasis and cell wall integrity in Alternaria alternata. Postharvest Biol. Technol. 2022, 94, 112064. [Google Scholar] [CrossRef]
- Yang, Y.Y.; Xie, P.D.; Li, Y.C.; Bi, Y.; Prusky, D. Updating insights into the regulatory mechanisms of calcineurin-activated transcription factor Crz1 in pathogenic fungi. J. Fungi. 2022, 8, 1082. [Google Scholar] [CrossRef] [PubMed]
- Liu, Y.X.; Li, Y.C.; Ma, L.; Deng, H.W.; Huang, Y.; Jiang, Q.Q.; Yang, Y.Y.; Bi, Y.; Prusky, D.B. The transmembrane protein AaSho1 is essential for appressorium formation and secondary metabolism but dispensable for vegetative growth in pear fungal Alternaria alternata. Fungal Biol. 2021, 126, 139–148. [Google Scholar] [CrossRef] [PubMed]
- Berridge, M.J.; Bootman, M.D.; Roderick, H.L. Calcium: Calcium signalling: Dynamics, homeostasis and remodelling. Nat. Rev. Mol. Cell Biol. 2003, 4, 517–529. [Google Scholar] [CrossRef]
- Huang, Y.; Li, Y.C.; Li, D.M.; Bi, Y.; Prusky, D.B.; Dong, Y.P.; Wang, T.L.; Zhang, M.; Zhang, X.M.; Liu, Y.X. Phospholipase C from Alternaria alternata is induced by physiochemical cues on the pear fruit surface that dictate infection structure differentiation and pathogenicity. Front. Microbiol. 2020, 11, 1279. [Google Scholar] [CrossRef]
- Polizotto, R.S.; Cyert, M.S. Calcineurin-dependent nuclear import of the transcription factor Crzlp requires Nmd5p. J. Cell Biol. 2001, 154, 951–960. [Google Scholar] [CrossRef]
- Stathopoulos, A.M.; Cyert, M.S. Calcineurin acts through the CRZ1/TCN1-encoded transcription factor to regulate gene expression in yeast. Genes Dev. 1997, 11, 3432–3444. [Google Scholar] [CrossRef]
- Matheos, D.P.; Kingsbury, T.J.; Ahsan, U.S.; Cunningham, K.W. Tcn1p/Crz1p, a calcineurin dependent transcription factor that differentially regulates gene expression in Saccharomyces cerevisiae. Genes Dev. 1997, 11, 3445–3458. [Google Scholar] [CrossRef]
- Viaud, M.C.; Balhadere, P.V.; Talbot, N.J. A Magnaporthe grisea cyclophilin acts as a virulence determinant during plant infection. Plant Cell 2002, 14, 917–930. [Google Scholar] [CrossRef]
- Schumacher, J.; Viaud, M.; Simon, A.; Tudzynski, B. The Galpha subunit BCG1, the phospholipase C (BcPLC1) and the calcineurin phosphatase co-ordinately regulate gene expression in the grey mould fungus Botrytis cinerea. Mol. Microbiol. 2008, 67, 1027–1050. [Google Scholar] [CrossRef]
- Seki, M.; Kakeya, H.; Yamamoto, Y.; Yanagihara, K.; Miyazaki, Y.; Kohno, S. Roles of calcineurin and Crz1 in antifungal susceptibility and virulence of Candida glabrata. Antimicrob. Agents Chemother. 2010, 54, 1639–1643. [Google Scholar] [CrossRef]
- Soriani, F.M.; Malavazi, I.; Ferreira, M.E.; Savoldi, M.; Goldman, M.H. Functional characterization of the Aspergillus fumigatus CRZ1 homologue, CrzA. Mol. Microbiol. 2008, 67, 1274–1291. [Google Scholar] [CrossRef] [PubMed]
- Moranova, Z.; Virtudazo, E.; Hricova, K.; Ohkusu, M.; Kawamoto, S.; Husickova, V.; Raclavsky, V. The CRZ1/SP1-like gene links survival under limited aeration, cell integrity and biofilm formation in the pathogenic yeast Cryptococcus neoformans. Biomed. Pap. Med. Fac. Univ. Palacky Olomouc Czech Repub. 2014, 158, 212–220. [Google Scholar] [CrossRef] [PubMed]
- Li, C.; Qiang, T.; Zhang, C.Q.; Ding, K.J. The transcription factor FgCrz1A is essential for fungal development, virulence, deoxynivalenol biosynthesis and stress responses in Fusarium graminearum. Curr. Genet. 2018, 65, 153–166. [Google Scholar] [CrossRef]
- Hou, Y.J.; Yu, X.Y.; Chen, W.P.; Zhuang, W.B.; Wang, S.H.; Sun, C.; Cao, L.F. MdWRKY75e enhances resistance to Alternaria alternata in Malus domestica. Hortic. Res. 2021, 8, 225. [Google Scholar] [CrossRef]
- Ghooshkhaneh, N.G.; Golzarian, M.R.; Mamarabadi, M. Spectral pattern study of citrus black rot caused by Alternaria alternata and selecting optimal wavelengths for decay detection. Food Sci. Nutr. 2022, 10, 1694–1706. [Google Scholar] [CrossRef]
- Tsuba, M.; Katagiri, C.; Takeuchi, Y.; Takada, Y.; Yamaoka, N. Chemical factors of the leaf surface involved in the morphogenesis of Blumeria graminis. Physiol. Mol. Plant Pathol. 2002, 60, 51–57. [Google Scholar] [CrossRef]
- Zabka, V.; Stangl, M.; Bringmann, G.; Vogg, G. Host surface properties affect prepenetration processes in the barley powdery mildew fungus. New Phytol. 2008, 177, 251–263. [Google Scholar] [CrossRef]
- Hansjakob, A.; Bischof, S.; Bringmann, G.; Riederer, M.; Hildebrandt, U. Very-long-chain aldehydes promote in vitro prepenetration processes of Blumeria graminis in a dose- and chain length dependent manner. New Phytol. 2010, 188, 1039–1054. [Google Scholar] [CrossRef]
- Hansjakob, A.; Riederer, M.; Hildebrandt, U. Appressorium morphogenesis and cell cycle progression are linked in the grass powdery mildew fungus Blumeria graminis. Fungal Biol. 2012, 116, 890–901. [Google Scholar] [CrossRef]
- Liu, W.D.; Zhou, X.Y.; Li, G.T.; Li, L.; Kong, L.G.; Wang, C.F.; Zhang, H.F.; Xu, J.R. Multiple plant surface signals are sensed by different mechanisms in the rice blast fungus for appressorium formation. PLoS Pathog. 2011, 7, e1001261. [Google Scholar] [CrossRef]
- Reisige, K.; Gorzelanny, C.; Daniels, U.; Moerschbacher, B.M. The C28 aldehyde octacosanal is a morphogenetically active component involved in host plant recognition and infection structure differentiation in the wheat stem rust fungus. Physiol. Mol. Plant Pathol. 2006, 68, 33–40. [Google Scholar] [CrossRef]
- Chen, Y.; Zheng, S.; Ju, Z.Z.; Zhang, C.Q.; Tang, G.F.; Wang, J.; Wen, Z.Y.; Chen, W.; Ma, Z.H. Contribution of peroxisomal docking machinery to mycotoxin biosynthesis, pathogenicity and pexophagy in the plant pathogenic fungus Fusarium graminearum. Environ. Microbiol. 2018, 20, 3224–3245. [Google Scholar] [CrossRef] [PubMed]
- Hagiwara, D.; Kondo, A.; Abe, F.K. Functional analysis of C2H2 zinc finger transcription factor CrzA involved in calcium signaling in Aspergillus nidulans. Curr. Genet. 2008, 54, 325–338. [Google Scholar] [CrossRef] [PubMed]
- Zhang, T.; Xu, Q.; Sun, X.; Li, H. The calcineurin-responsive transcription factor Crz1 is required for conidation, full virulence and DMI resistance in Penicillium digitatum. Microbiol. Res. 2013, 168, 211–222. [Google Scholar] [CrossRef]
- Xiong, D.; Wang, Y.; Tang, C.; Fang, Y.; Zou, J.; Tian, C. VdCrz1 is involved in microsclerotia formation and required for full virulence in Verticillium dahliae. Fungal Genet. Biol. 2015, 82, 201–212. [Google Scholar] [CrossRef]
- Hansjakob, A.; Riederer, M.; Hildebrandt, U. Wax matters: Absence of very long-chain aldehydes from the leaf cuticular wax of the glossy11 mutant of maize compromises the pre-penetration processes of Blumeria graminis. Plant Pathol. 2011, 60, 1151–1161. [Google Scholar] [CrossRef]
- Zhu, M.; Riederer, M.; Hildebrandt, U. Very-long-chain aldehydes induce appressorium formation in ascospores of the wheat powdery mildew fungus Blumeria graminis. Fungal Biol. 2017, 188, 1039–1054. [Google Scholar] [CrossRef]
- Feng, J.; Wang, F.; Liu, G.; Greenshields, D.; Shen, W.; Kaminskyj, S.; Hughes, G.R.; Peng, Y.L.; Selvaraj, G.; Zou, J.; et al. Analysis of a Blumeria graminis-secreted lipase reveals the importance of host epicuticular wax components for fungal adhesion and development. Mol. Plant Microbe Interact. 2009, 22, 1601–1610. [Google Scholar] [CrossRef]
- Brito, N.; Espino, J.J.; González, C. The endo-beta-1,4-xylanase xyn11A is required for virulence in Botrytis cinerea. Mol. Plant Microbe Interact. 2006, 19, 25–32. [Google Scholar] [CrossRef]
- Kars, I.; Krooshof, G.H.; Wagemakers, L.; Joosten, R. Necrotizing activity of five Botrytis cinerea endopolygalacturonases produced in Pichia pastoris. Plant J. 2005, 43, 213–225. [Google Scholar] [CrossRef]
- Ten, H.A.; Mulder, W.; Visser, J.; Kan, J.A.V. The endopolygalacturonase gene Bcpg1 is required for full virulence of Botrytis cinerea. Mol. Plant Microbe Interact. 1998, 11, 1009. [Google Scholar] [CrossRef]
- Locher, K.P. Review. Structure and mechanism of ATP-binding cassette transporters. Philos. Trans. R. Soc. B Biol. Sci. 2009, 364, 239–245. [Google Scholar] [CrossRef] [PubMed]
- Esquivel, B.D.; Rybak, J.M.; Barker, K.S. Characterization of the efflux capability and substrate specificity of Aspergillus fumigatus PDR5-like ABC transporters expressed in Saccharomyces cerevisiae. mBio 2020, 11, 16. [Google Scholar] [CrossRef] [PubMed]
- Chen, Z.L.; Shi, T.L.; Zhang, L.; Zhu, P.L.; Deng, M.Y.; Huang, C.; Hu, T.T.; Jiang, L.; Li, J. Mammalian drug efflux transporters of the ATP binding cassette (ABC) family in multidrug resistance: A review of the past decade. Cancer Lett. 2016, 370, 153–164. [Google Scholar] [CrossRef]
- Schoonbeek, H.; Sorbo, G.D.; Waard, M.A.D. The ABC transporter BcatrB affects the sensitivity of Botrytis cinerea to the phytoalexin resveratrol and the fungicide fenpiclonil. Mol. Plant Microbe Interact. 2001, 14, 562–571. [Google Scholar] [CrossRef]
- Aardra, K.; He, Z.H.; Rajesh, P.; Zhu, Q.; Zhong, J.P.; Li, D.B.; Pamela, R.; Chris, L.; Bharat, B.C. Induction of H2O2 in transgenic rice leads to cell death and enhanced resistance to both bacterial and fungal pathogens. Transgenic Res. 2003, 12, 577–586. [Google Scholar] [CrossRef]
- Segal, L.M.; Wilson, R.A. Reactive oxygen species metabolism and plant-fungal interactions. Fungal Genet. Biol. 2018, 110, 1–9. [Google Scholar] [CrossRef]
- Xu, M.; Yang, Q.; Boateng, N.A.S.; Ahima, J.; Dou, Y.; Zhang, H.Y. Ultrastructure observation and transcriptome analysis of Penicillium expansum invasion in postharvest pears. Postharvest Biol. Technol. 2020, 165, 111198. [Google Scholar] [CrossRef]
- Arthington, B.A.; Bennett, L.G.; Skatrud, P.L.; Guynn, C.J.; Barbuch, R.J.; Ulbright, C.E.; Bard, M. Cloning, disruption and sequence of the gene encoding yeast C-5 sterol desaturase. Gene 1991, 102, 39–44. [Google Scholar] [CrossRef]
- Brookes, P.S.; Yoon, Y.; Robotham, J.L.; Anders, M.W.; Sheu, S.S. Calcium, ATP, and ROS: A mitochondrial love-hate triangle. Am. J. Physiol. Cell Physiol. 2004, 287, C817–C833. [Google Scholar] [CrossRef]
- Pedroso, N.; Matias, A.C.; Cyrne, L.; Antunes, F.; Borges, C.; Malho, R.; Almeida, R.F.M.D.; Herrero, E.; Marinho, H.S. Modulation of plasma membrane lipid profile and microdomains by H2O2 in Saccharomyces cerevisiae. Free. Radic. Biol. Med. 2009, 46, 289–298. [Google Scholar] [CrossRef] [PubMed]
- Li, G.H.; Fu, W.X.; Deng, Y.; Zhao, Y.Y. Role of calcium/calcineurin signalling in regulating intracellular reactive oxygen species homeostasis in Saccharomyces cerevisiae. Genes 2021, 12, 1311. [Google Scholar] [CrossRef] [PubMed]
- Nita, M.; Grzybowski, A. The Role of the reactive oxygen species and oxidative stress in the pathomechanism of the age-related ocular diseases and other pathologies of the anterior and posterior eye segments in adults. Oxidative Med. Cell. Longev. 2016, 2016, 3164734. [Google Scholar] [CrossRef]
- Rahal, A.; Kumar, A.; Singh, V.; Yadav, B.; Tiwari, R.; Chakraborty, S.; Dhama, K. Oxidative stress, prooxidants, and antioxidants: The interplay. BioMed Res. Int. 2014, 2014, 761264. [Google Scholar] [CrossRef]
- Li, L.; Tan, J.; Miao, Y.; Lei, P.; Zhang, Q. ROS and Autophagy: Interactions and molecular regulatory mechanisms. Cell. Mol. Neurobiol. 2015, 35, 615–621. [Google Scholar] [CrossRef]
- Li, M.; Hou, Y.; Wang, J.; Chen, X.; Shao, Z.M.; Yin, X.M. Kinetics comparisons of mammalian Atg4 homologues indicate selective preferences toward diverse Atg8 substrates. J. Biol. Chem. 2011, 286, 7327–7338. [Google Scholar] [CrossRef]
- Yamamoto, H.; Kakuta, S.; Watanabe, T.M.; Kitamura, A.; Sekito, T.; Kondo-Kakuta, C. Atg9 vesicles are an important membrane source during early steps of autophagosome formation. J. Cell Biol. 2012, 198, 219–233. [Google Scholar] [CrossRef]
- Papinski, D.; Schuschnig, M.; Reiter, W.; Wilhelm, L.; Barnes, C.A.; Maiolica, A.; Hansmann, I.; Pfaffenwimmer, T.; Kijanska, M.; Stoffel, I.; et al. Early steps in autophagy depend on direct phosphorylation of Atg9 by the Atg1 kinase. Mol. Cell 2014, 53, 471–483. [Google Scholar] [CrossRef]
- Barz, S.; Kriegenburg, F.; Henning, A.; Bhattacharya, A.; Mancilla, H.; Sánchez-Martín, P.; Kraft, C. Atg1 kinase regulates autophagosome-vacuole fusion by controlling SNARE bundling. EMBO Rep. 2020, 21, e51869. [Google Scholar] [CrossRef]
- Kmetzsch, L.; Staats, C.C.; Simon, E.; Fonseca, F.L.; de Oliveira, D.L.; Sobrino, L. The vacuolar Ca2+ exchanger VCX1 is involved in calcineurin-dependent Ca2+ tolerance and virulence in Cryptococcus neoformans. Eukaryot. Cell 2010, 9, 1798–1805. [Google Scholar] [CrossRef]
- Kmetzsch, L.; Staats, C.C.; Cupertino, J.B.; Fonseca, F.L.; Rodrigues, M.L.; Schrank, A.; Vainstein, M.H. The calcium transporter Pmc1 provides Ca2+ tolerance and influences the progression of murine cryptococcal infection. FEBS J. 2013, 280, 4853–4864. [Google Scholar] [CrossRef] [PubMed]
- Davies, K.J.; Ermak, G.; Rothermel, B.A.; Pritchard, M.; Heitman, J.; Ahnn, J. Renaming the DSCR1/Adapt78 gene family as RCAN: Regulators of calcineurin. FASEB J. 2007, 21, 3023–3028. [Google Scholar] [CrossRef] [PubMed]
- Pinchai, N.; Perfect, B.Z.; Juvvadi, P.R.; Fortwendel, J.R.; Cramer, R.A.; Asfaw, Y.G.; Heitman, J.; Perfect, J.R.; Steinbach, W.J. Aspergillus fumigatus calcipressin CbpA is involved in hyphal growth and calcium homeostasis. Eukaryot. Cell 2009, 8, 511–519. [Google Scholar] [CrossRef]
- Harren, K.; Schumacher, J.; Tudzynski, B. The Ca2+/calcineurin dependent signaling pathway in the gray mold Botrytis cinerea: The role of calcipressin in modulating calcineurin activity. PLoS ONE 2012, 7, e41761. [Google Scholar] [CrossRef]
- Liu, C.Y.; Liu, T.G.; Lv, Z.W.; Qin, M.Y. A calcineurin regulator MoRCN1 is important for asexual development, stress response, and plant infection of Magnaporthe oryzae. Front. Plant Sci. 2022, 13, 925645. [Google Scholar] [CrossRef]
- Wang, H.; Liang, Y.; Zhang, B.; Zheng, W.; Xing, L.; Li, M. Alkaline stress triggers an immediate calcium fluctuation in Candida albicans mediated by Rim101p and Crz1p transcription factors. FEMS Yeast Res. 2011, 11, 430–439. [Google Scholar] [CrossRef]
- Bodvard, K.; Jorhov, A.; Blomberg, A.; Molin, M.; Kall, M. The yeast transcription factor Crz1 is activated by blue light in a Ca2+/calcineurin-dependent and PKA-independent manner. PLoS ONE 2013, 8, e53404. [Google Scholar] [CrossRef]
- Stathopoulos-Gerontides, A.; Guo, J.J.; Cyert, M.S. Yeast calcineurin regulates nuclear localization of the Crz1p transcription factor through dephosphorylation. Genes Dev. 1999, 13, 798–803. [Google Scholar] [CrossRef]
- Dinamarco, T.M.; Freitas, F.Z.; Almeida, R.S.; Brown, N.A.; Reis, T.F.d.; Ramalho, L.N.Z.; Savoldi, M.; Goldman, M.H.S.; Bertolini, M.C.; Goldman, G.H. Functional characterization of an Aspergillus fumigatus calcium transporter (PmcA) that is essential for fungal infection. PLoS ONE 2012, 5, e37591. [Google Scholar] [CrossRef]


Disclaimer/Publisher’s Note: The statements, opinions and data contained in all publications are solely those of the individual author(s) and contributor(s) and not of MDPI and/or the editor(s). MDPI and/or the editor(s) disclaim responsibility for any injury to people or property resulting from any ideas, methods, instructions or products referred to in the content. |
© 2024 by the authors. Licensee MDPI, Basel, Switzerland. This article is an open access article distributed under the terms and conditions of the Creative Commons Attribution (CC BY) license (https://creativecommons.org/licenses/by/4.0/).