Article

Identifying the Shared Metabolite Biomarkers and Potential Intervention Targets for Multiple Sarcopenia-Related Phenotypes

Department of Epidemiology and Health Statistics, The School of Public Health of Qingdao University, Qingdao 266071, China
*
Author to whom correspondence should be addressed.
Int. J. Mol. Sci. 2024, 25(22), 12310; https://doi.org/10.3390/ijms252212310
Submission received: 22 October 2024 / Revised: 14 November 2024 / Accepted: 15 November 2024 / Published: 16 November 2024
(This article belongs to the Section Molecular Endocrinology and Metabolism)

Abstract

:
The relationship between circulating metabolites and sarcopenia-related phenotypes remains unclear. We explored the causality between circulating metabolites and sarcopenia-related phenotypes. Instrumental variables for the human metabolome were derived from the recently published GWAS, which included 690 plasma metabolites. Summary statistics for four sarcopenia phenotypes (whole-body lean mass (WBLM), usual walking pace, appendicular lean mass (ALM), and handgrip strength (HGS)) (both sexes, males and females) were obtained from relevant GWASs. We used MR to evaluate the association between circulating metabolites and sarcopenia-related phenotypes. Colocalization analysis was utilized to determine whether two associated signals were consistent with a shared causal variant rather than the confounding effect of linkage disequilibrium. Subsequently, we explored associations between modifiable risk factors and sarcopenia-related metabolites to explore which metabolites may serve as potential intervention targets through lifestyle modification. Genetically predicted plasma levels of 95 known metabolites were associated with sarcopenia-related phenotypes, and 27 metabolites were supported by robust evidence of colocalization, among which 13 metabolites had a cross-sarcopenia effect. These metabolites primarily included acyl carnitines, amino acids and their derivatives, and phospholipids. Specifically, our analyses supported causal relationships between 23, 6, and 15 metabolites and ALM, HGS, and WBLM, respectively. Seven relevant metabolites might be associated with six modifiable factors. We identified 27 metabolite biomarkers with robust causal evidence for sarcopenia-related phenotypes, highlighting 13 metabolites with a cross-sarcopenia effect, and prioritized several metabolites as the potential interventional targets of lifestyle changes. Our study provided new insight into the etiology and prevention of sarcopenia.

1. Introduction

Sarcopenia is characterized by a generalized and progressive skeletal muscle strength and mass decline and is primarily observed in the elderly [1]. Currently, most criteria have used combinations of muscle mass and strength as evaluation measures of sarcopenia [2,3,4]. The estimated prevalence of sarcopenia in populations of European ancestry is 23% for those older than 60 and 18% for those younger than 60, which also supports the idea that sarcopenia usually appears early in life [5]. Observational studies indicate that risk factors for sarcopenia include insufficient physical activity, malnutrition, smoking, and diabetes and that sarcopenia has also been linked to a range of negative health outcomes [6]. Therefore, the exploration of early biomarkers for sarcopenia holds the potential to advance the research on etiology, risk prediction, and precision prevention.
The human metabolome comprises products of metabolic processes, including intermediates and end products, which collectively present a metabolic fingerprint of an individual [7]. The development of omics-based technologies offers a window to unveil the complex mechanisms and pathological processes of diseases or phenotypes [8,9]. Specifically, metabolomics can reveal changes in intermediate metabolites or metabolic pathways to find new insights into diseases. Abnormal metabolism has been implicated in various diseases [10,11]. Evidence from observational metabolomics studies with candidate approaches supports an association between some metabolites and sarcopenia-related phenotypes [12,13,14]. However, previous studies based on cross-sectional design restrict causal inference, despite evidence indicating that broader metabolic disturbances occur in wasting. Additionally, most studies are limited to candidate metabolites, restricting a comprehensive understanding of the relationship between metabolites and sarcopenia. Recent studies also implied causal associations of several metabolites with sarcopenia, such as isovalerylcarnitine, docosapentaenoate, glycine, 1-arachidonoylglycerophosphocholine, pentadecanoate, 3-dehydrocarnitine, and epiandrosterone sulfate [15,16,17]. However, there is a lack of insight into the specific and shared metabolic markers between sarcopenia-related phenotypes, and sex differences in the association of metabolites with sarcopenia are not well defined.
Recent large-scale GWASs (1091 metabolites, 690 of which had available mQTL) have significantly advanced our knowledge of the genetic architecture underlying the human metabolome [18]. Meanwhile, the availability of muscle strength and mass phenotypes (HGS, ALM, WBLM, and usual walking pace) with associated genotypes provides a valuable resource for evaluating causal association by MR. MR employs genetic variants as proxies to achieve robust causal inference between a given exposure and the outcome with minimal reverse causation or confounding effects [19]. Therefore, we conducted a metabolome-wide MR analysis to assess the causal association between metabolites and sarcopenia-related phenotypes and to explore the cross-sarcopenia effects of metabolites. Subsequently, we further investigate the association across different genders.

2. Results

2.1. Metabolome-Wide MR Identified 118 Sarcopenia-Related Metabolites

The reporting of this MR study followed the STROBE-MR checklist (Supplementary File S1). The data sources and detailed information are presented in Table S1. The F-statistic for the genetic instruments was larger than the normally selected value of 10, suggesting no weak instrumental variable (Table S2). The number of nominally significant metabolites (p < 0.05) across the sarcopenia traits ranged from 239 for ALM to 73 for usual walking pace (Table 1). There were 118 metabolites (95 known and 23 unknown metabolites) significantly associated with four phenotypes after multiple testing corrections, including 78 known metabolites for ALM, 11 known metabolites for HGS, 47 known metabolites for WBLM, and 1 known metabolite for usual walking pace (Tables S4–S7). Among these known metabolites, no significant pleiotropy or heterogeneity was observed (Table S8).
In the sex-stratified analyses, we observed significant associations between 50, 19, 3, and 1 known metabolite and ALM, WBLM, HGS, and usual walking pace in males, respectively (Table 1 and Tables S9–S12). In females, we observed significant associations between 64, 23, and 8 known metabolites and ALM, WBLM, and HGS, respectively (Table 1 and Tables S13–S16). For ALM, HGS, and WBLM, 34, 13, and 6 known metabolites were significant in both the male and female stratified analyses, respectively. There were 16 and 6 known metabolites that were significantly associated with ALM and WBLM only in males. For ALM, WBLM, and HGS, 30, 10, and 5 known metabolites were significant only in females, respectively.
Among the 11 known metabolites significantly associated with HGS, 8 metabolites were subsequently validated. The genetically determined levels of myristoylcarnitine, arachidoylcarnitine, S-adenosylhomocysteine (SAH), and 3-hydroxyoleoylcarnitine were positively related to the risk of HGS weakness [OR (95 CI): 1.26 (1.11–1.43), 1.19 (1.07–1.34), 1.15 (1.06–1.25), and 1.20 (1.07–1.36), respectively. The genetically determined levels of four metabolites (glycine, isovalerylglycine, cinnamoylglycine, and gamma-glutamylglycine) were negatively correlated with the risk of HGS weakness (Table S17).

2.2. Colocalization Analysis Supports 27 Known Metabolites

Among the 95 known metabolites associated with sarcopenia-related phenotypes, 27 metabolites had strong colocalization evidence (PP4 > 0.80) under different windows (±250 kb or ±500 kb) and priors (P12 = 1 × 10⁻⁵ or P12 = 1 × 10⁻⁶), suggesting the high probability of a shared causal variant between metabolites and sarcopenia-related phenotypes (Table S18). Specifically, there is significant colocalization support for the associations of 23, 6, and 15 known metabolites with ALM (Figure 1), HGS (Figure 2), and WBLM (Figure 3), respectively.
Totals of 23 and 13 metabolites were significantly associated with at least one sarcopenia-related phenotype in males and females, respectively, with colocalization evidence supports. Among them, 12 metabolites were significant in both sexes, primarily falling into the amino acids and their derivatives, categories of carnitines and their derivatives, and carbohydrate metabolites. The male-specific sarcopenia-related metabolites included myristoylcarnitine, propionylglycine, sphingomyelin, isobutyrylglycine, arachidoylcarnitine, 1-lignoceroyl-GPC (24:0), N-acetylglycine, carnitine, arachidonoylcholine, trans-2-hexenoylglycine, and 3-hydroxyoleoylcarnitine, while the only female-specific sarcopenia-related metabolite was 2-O-methylascorbic acid.

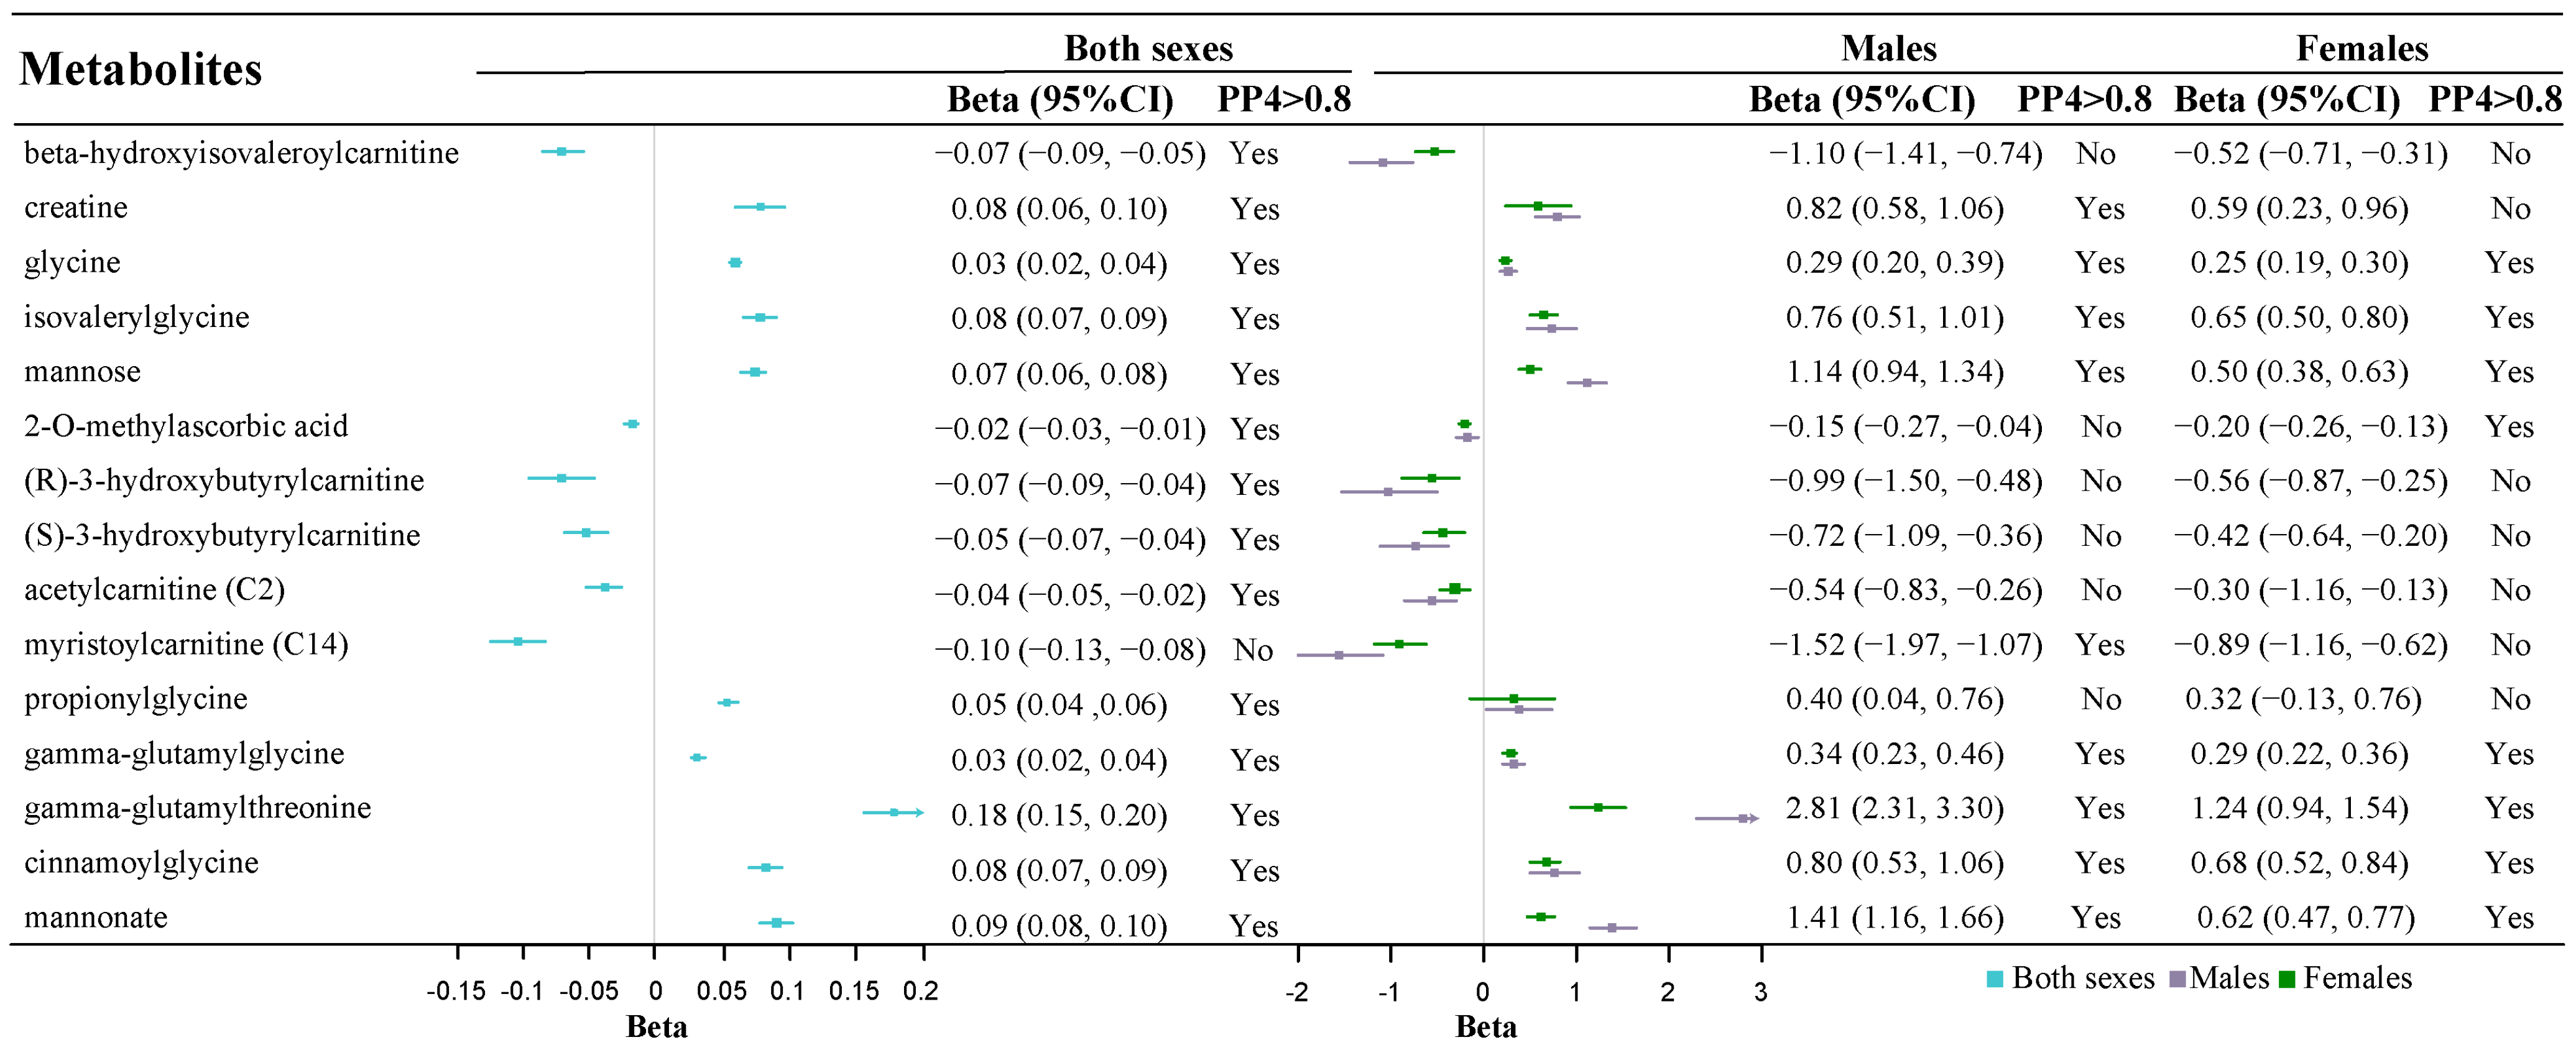
2.3. Thirteen Metabolites with Robust Colocalization Evidence Have Cross-Sarcopenia Effect

Among 27 identified sarcopenia-related metabolites, 13 metabolites showed cross-sarcopenia effects. Specifically, the genetically determined plasma myristoylcarnitine level was related to lower ALM, WBLM, and HGS. The higher levels of five other metabolites (glycine, isovalerylglycine, propionylglycine, gamma-glutamylglycine, and cinnamoylglycine) were associated with higher ALM, WBLM, and HGS. The higher levels of mannose, creatine, and mannonate were associated with higher ALM and WBLM. The lower levels of four other metabolites (beta-hydroxyisovaleroylcarnitine, (R)-3-hydroxybutyrylcarnitine, (S)-hydroxybutyrylcarnitine, and acetylcarnitine) were associated with higher ALM and WBLM (Table 2).

2.4. Metabolic Pathway Analysis

Metabolic pathway analysis was performed among the metabolites with robust colocalization evidence using Metaconflict 5.0. A total of 12 metabolic pathways were detected from two databases, including 7 from both the KEGG and the Small Molecule Pathway databases, as well as 5 from the KEGG dataset. Four important metabolic pathways potentially involved in muscle mass were identified in the metabolic pathway analysis (Table S19). The results indicated that the “glycerophospholipid metabolism”, “glycine, serine and threonine metabolism”, “linoleic acid metabolism”, and “alpha-Linolenic acid metabolism” pathways might be relevant to ALM and WBLM (p < 0.05). We did not find pathways associated with HGS and usual walking pace due to limited metabolites.

2.5. Six Potential Modifiable Factors Associated with Sarcopenia-Related Metabolites

In the analysis of the associations of 38 modifiable factors with 27 sarcopenia-related metabolites, 6 modifiable factors (1 obesity-related factor: WHRadjBMI; 3 lifestyle factors: television watching, sleep duration, and smoking initiation; and 2 dietary factors: tea consumption and milk intake) were significantly associated with 7 metabolites. Among 13 metabolites with cross-sarcopenia effects, beta-hydroxyisovaleroylcarnitine was positively associated with smoking initiation and short sleep duration, while gamma-glutamylglycine, glycine, and mannose were positively related to milk intake and lower WHRadjBMI (Table 3).

3. Discussion

In this study, we systematically investigated the causal association between 690 blood metabolites and sarcopenia-related phenotypes in both sexes, male and female, respectively. We identified 95 known metabolites associated with sarcopenia-related phenotypes, with the majority showing significance in sex-stratified analyses. A total of 27 metabolites were prioritized after Bayesian colocalization analysis, and 13 of these had a cross-sarcopenia effect. Additionally, 23 metabolites in the males and 13 in the females were associated with at least one sarcopenia phenotype, supported by strong colocalization evidence. Of these, 12 metabolites were same in the males and females.
Glycine has been found to have potential effects on muscle health. Insufficient synthesis of glycine is associated with muscle weakness [20,21]. A glycine supplement can protect muscles from the impact of various diseases, including cachexia [22,23,24]. Gamma-glutamylglycine and gamma-glutamylthreonine were observed to be associated with muscle mass and strength. It can be resynthesized into glutathione under the catalytic action of gamma-glutamyl transpeptidase [8]. Research suggests that glutathione may help maintain muscle health through antioxidants [25]. Isovalerylglycine is commonly used for the screening of isovaleric acidemia in newborns. However, a previous study identified it as a nutritional and health-related biomarker for diagnosing or detecting resistance to diet-induced obesity [26]. A higher isovalerylglycine level indicates an increased likelihood that obesity induced by a high-fat diet can be resisted [26]. Cinnamoylglycine is typically formed through the metabolism of dietary polyphenols by gut microbiota, suggesting a potential role of dietary polyphenols or gut microbiota in maintaining muscle health [27]. Contrary to our findings, Lustgarten et al. found through principal component analysis that the principal component containing cinnamoylglycine was negatively correlated with muscle strength in adults [28,29]. The reason for this discrepancy may lie in the differences in research methodologies.
Our results indicated a causal effect of acyl carnitines on sarcopenia-related phenotypes. Acyl carnitines are predominantly derived from skeletal muscles and play a crucial role in intracellular fatty acid metabolism and transport. Acyl carnitines accumulation is observed in certain conditions, such as type 2 diabetes, cardiac ischemia, or inherited fatty acid oxidation disorders [30], emphasizing the impact of these conditions on muscle function. Previous studies suggested that long-chain acyl carnitines are implicated in activating insulin resistance and inflammatory responses in muscle tissues [30,31,32,33]. Under pathological conditions, such as fatty acid oxidation disorders or myocardial ischemia, acyl carnitines may induce oxidative stress in muscle cells [30,34]. In vitro experiments indicated that low concentrations of acyl carnitines may initiate Ca-dependent IL-6 responses by increasing Ca2+ in muscle cells, potentially resulting in muscle cell apoptosis [35]. These findings collectively emphasize the significant impact of acyl carnitines on muscle physiology. As one of the most popular sports supplements, creatine could enhance adenosine triphosphate (ATP) resynthesis in cells, thereby contributing to improved physical performance, including maximal strength, maximal work output, sprinting performance, and fat-free mass [36,37].
Our results found that sarcopenia-related metabolites were largely consistent across the sexes, though more sarcopenia-related metabolites were identified in the males than in the females. Although the underlying mechanisms remain unclear, we propose several possible explanations. First, sex differences in metabolite levels have been documented in prior studies, which show that males exhibit higher concentrations of metabolites, such as creatine and fatty acid oxidation-related products, including carnitines and acylcarnitine, compared to females [38,39]. These differences may arise from estrogen regulation [40], inflammatory responses, muscle mass and body composition, as well as endogenous metabolite synthesis [38], potentially contributing to the stronger associations observed between some metabolites and sarcopenia in males. Additionally, male-specific environmental factors, such as high-intensity training and higher basal metabolic rates, may influence the concentration or functional activity of certain amino acid metabolites [41], which may also account for the observed gender difference.
Several modifiable risk factors (WHRadjBMI, leisure television watching, sleep duration, smoking initiation, tea consumption, and milk intake) are associated with seven sarcopenia-related metabolites. Previous studies have also identified these factors as being associated with sarcopenia [42]. However, our hypothesis is based on genetic variations as proxies, which limits our ability to fully evaluate potential confounding factors and only provides potential clues. Rigorously designed intervention studies are needed in the future to assess whether changes in lifestyle behaviors could affect the sarcopenia risk through influence-identified metabolites.
This study has the following advantages: Firstly, we performed a comprehensive and systematic study to explore the causal association between plasma metabolites and the sarcopenia-related phenotypes, providing a comprehensive view with which to understand the etiological role of metabolites in muscle function. Secondly, the use of the MR and Bayesian colocalization methods reduced the impact of confounding factors and reverse causation, making the current study potentially more robust than observational studies. Thirdly, we identified modifiable factors of relevant metabolites, prioritizing potential interventional metabolite targets of lifestyle changes to treat sarcopenia.
However, our study has weaknesses that warrant caution. Firstly, the current study focused on sarcopenia-related phenotypes rather than sarcopenia diagnosed by internationally recognized criteria, such as those defined by the EWGSOP or AWGS. This is due to the current lack of GWASs on sarcopenia as defined by the above standards. Moreover, the sarcopenia-related phenotypes we selected are common indicators in the internationally recognized criteria and have been widely used in previous research [43]. Secondly, blood metabolites are commonly used for disease diagnosis or screening due to the accessibility and low invasiveness. Therefore, this study focuses on plasma metabolites, but evaluating the role of metabolites in other tissues, especially muscle tissue, could offer further perspectives on the pathology of sarcopenia. Thirdly, due to the current lack of GWASs on ALM, WBLM, and walking pace in other populations, we were only able to validate metabolites associated with handgrip strength. Our results will require further validation through experimental studies or population-based research in the future. Finally, since we used genetically determined metabolites to explore their association with sarcopenia-related phenotypes, we were unable to provide actual metabolite concentrations in sarcopenia patients. This limitation restricts the clinical applicability of our findings and calls for further research in the future.

4. Methods and Materials

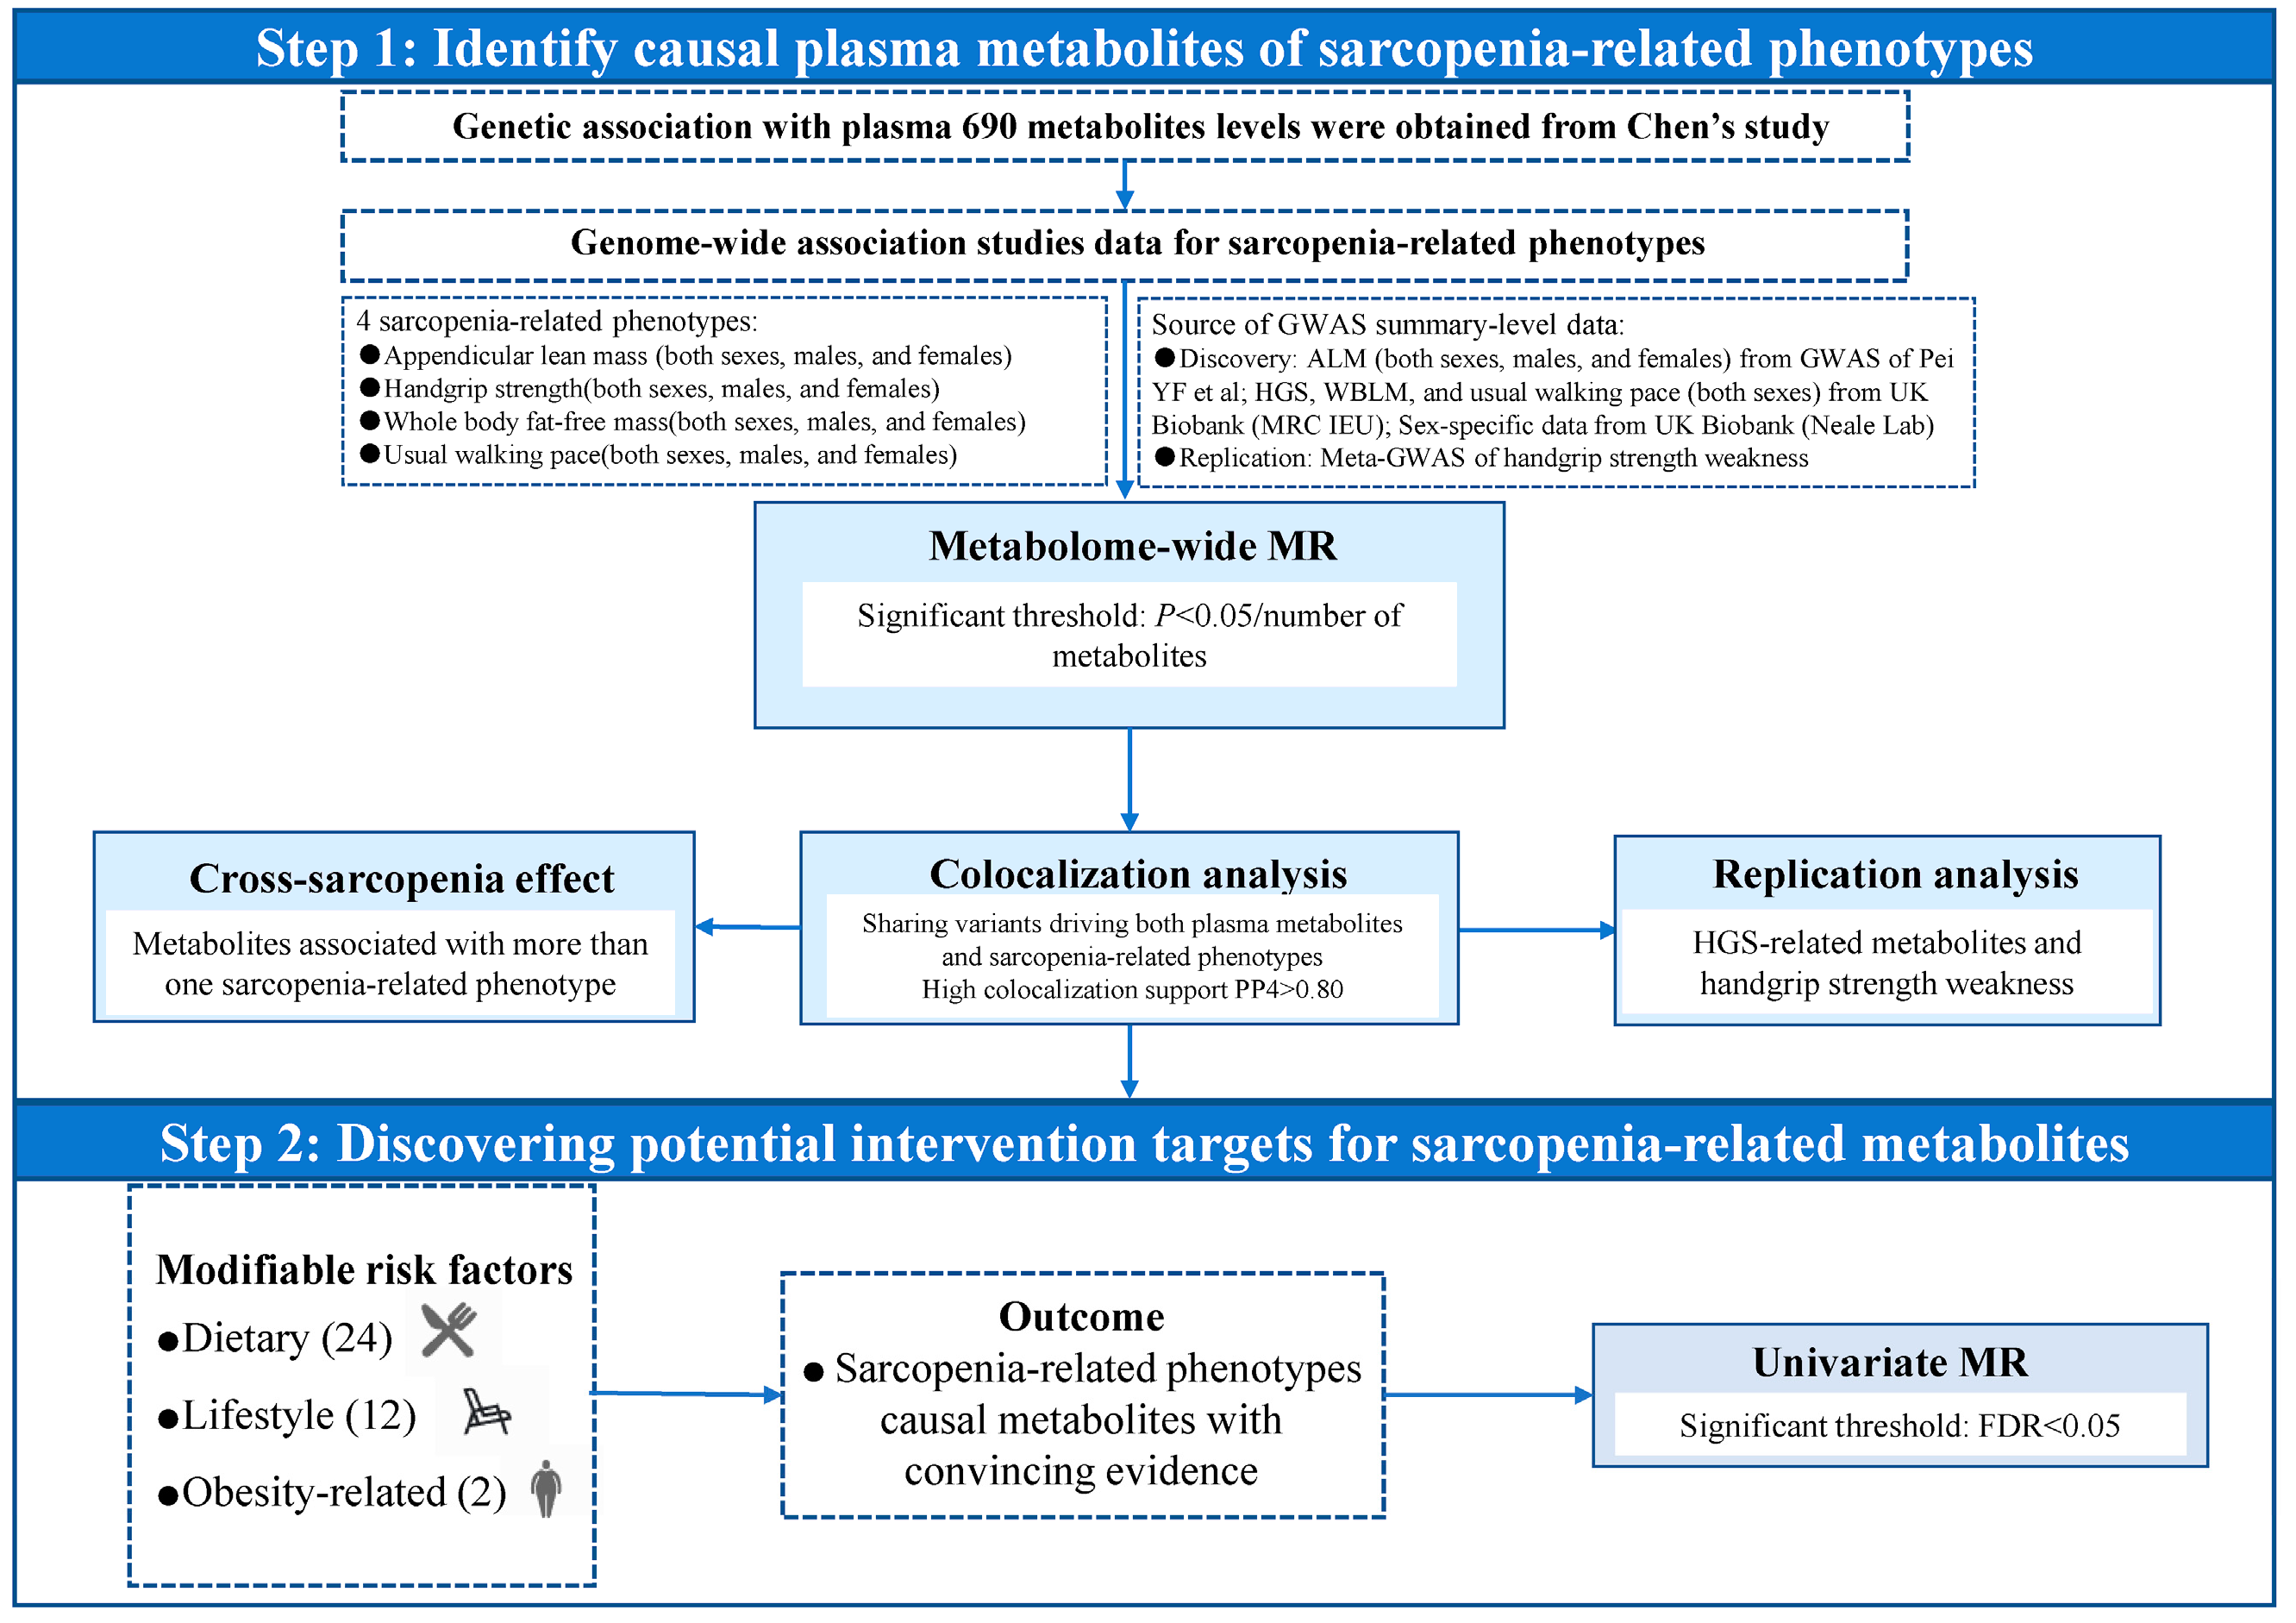
4.1. Overall Study Design

The study design is outlined in Figure 4. Initially, we performed a two-sample MR analysis using genetic variants from the recently published metabolomics study as instrumental variables to explore the association between metabolites and sarcopenia-related phenotypes. Subsequently, we conducted colocalization analysis to verify the causal relationships. Metabolic pathway analysis was further conducted to identify the underlying metabolite pathways or groups that might be related to the biological process of sarcopenia. Finally, another MR analysis was conducted between the modifiable risk factors and sarcopenia-related metabolites to identify which metabolites might serve as potential interventional targets of modifiable lifestyle factors.

4.2. Data Sources and Study Population

Instrumental variables for the human metabolome were derived from the recently published largest GWAS, which included 690 blood metabolites (571 known and 119 unknown) measured using the Metabolon HD4 platform among 8299 individuals of European ancestry [18]. The mean age was 62.4 ± 9.9 years. As in previous studies, we did not use sarcopenia directly defined by the EWGSOP criteria as an outcome; instead, we analyzed related indicators of sarcopenia [44]. We obtained summary statistics for single-nucleotide polymorphisms (SNPs) associated with sarcopenia-related phenotypes from previous GWASs [45,46]. In brief, ALM and WBLM were selected as measures of muscle mass; both of these are valid predictors of sarcopenia [47]. HGS and usual walking pace were selected as measures of muscle strength [48]. We used the full summary statistics data from a GWAS on ALM, which contained 450,243 participants of European ancestry, and ALM was measured using bioelectrical impedance analysis (BIA) [45]. For HGS, usual walking pace, and WBLM, full summary statistics data from UK Biobank (n = 461,089, 459,915 and 454,850, respectively; aged between 48 and 73 at recruitment) were used.
We also obtained sex-specific full summary statistics data on WBLM, HGS, and usual walking pace from UK Biobank (Neale Lab) in the sex-stratified analysis [49]. For the WBLM, the sample size was 163,815 for the males and 190,993 for the females. For HGS, the sample size was 166,424 for the males and 193,280 for the females. For usual walking pace, the sample size was 165,967 for the males and 193,007 for the females. The GWAS of ALM conducted by Pei et al. contains 205,513 males (the mean age was 57.0 ± 8.1 years) and 244,730 females (the mean age was 56.6 ± 7.9 years) [45]. The original publications obtained the ethics approvals from the relevant authorities, and informed consent was provided by all the participants.

4.3. Metabolome-Wide MR Analysis

In the present MR analysis, the following criteria were applied to choose the instrumental variables (IVs) of the plasma metabolites: (i) SNPs associated with a corresponding metabolite at the genome-wide significance level (p < 5 × 10⁻⁸); (ii) due to the complex linkage disequilibrium (LD) structure of SNPs within the human major histocompatibility complex region, SNPs within this region were excluded; (iii) to identify independent IVs for a given metabolite, the clumping process was used (r2 < 0.001); and (iv) the R2 and F-statistic were used to measure the strength of the IVs, where R2 was the variance explained by genetic variance, and an F-statistic of less than 10 was considered indicative of a weak IV [50]. Finally, 690 unique metabolites and 1291 IVs were included in the sequence analysis. Table S2 presents detailed information on the IVs.
The MR analysis utilized the “TwoSampleMR” R package [51]. If the metabolites had only a single IV, we utilized the Wald ratio method to evaluate the changes in ALM, WBLM, HGS, and usual walking pace for a per SD increase in plasma metabolites, as proxied by the IVs. For the metabolites with more than one genetic proxy, we used the inverse-variance weighted (IVW) method, and the heterogeneity of the IVs was estimated by a heterogeneity test based on the Q statistic. Additional analyses, including weighted median, simple mode, MR-Egger, and weighted mode, were also conducted to detect potential horizontal pleiotropy. Bonferroni correction was used for multiple testing and p < 7.25 × 10⁻⁵ (0.05/690) was considered as the significance threshold.
Due to the lack of available replication datasets for ALM, WBLM, and usual walking pace, the replication analysis only validated the causal relationship between HGS-related metabolites and HGS weakness. Summary statistics data of HGS weakness were obtained from a previous GWAS meta-analysis, where the definition of HGS weakness was in accordance with the European Working Group on Sarcopenia in Older People (EWGSOP) criteria (<20 kg for females; HGS < 30 kg for males) [52]. A false discovery rate (FDR) < 0.05 was considered as the significance threshold in the replication analysis.

4.4. Colocalization Analysis

The Bayesian colocalization analysis was conducted using the “coloc” R package to determinate whether two associated signals (muscle strength- and mass-related metabolites and their corresponding phenotypes) were consistent with a shared causal variant rather than the confounding effect of LD [53]. This analysis included five hypotheses: (H0) no causal variant for either the metabolites or phenotypes in the locus; (H1) one causal variant for a metabolite only; (H2) one causal variant for a muscle strength and mass phenotype only; (H3) two different causal variants for the metabolites and phenotype; and (H4) the metabolite and phenotype shared a common causal variant. For each metabolite, we performed colocalization analysis by including SNPs within a 500 kb window upstream and downstream of the instrumental variables, with a default parameter set at P12 = 1 × 10⁻⁵ (prior probability that an SNP is associated with both metabolites and sarcopenia-related phenotypes). Due to the sensitivity of colocalization analysis to the prior and window size, we assessed the robustness of the colocalization by using a smaller window size (±250 kb) and prior (P12 = 1 × 10⁻⁶) in additional analyses [54]. The posterior probability of H4 (PP4) being greater than 0.80 across different windows and priors was considered as strong colocalization evidence [55].

4.5. Metabolic Pathway Analysis

For the potential suitability of the sarcopenia causal metabolites with convincing evidence, metabolic pathway analysis was conducted using the web-based Metaconflict 5.0 to identify underlying metabolite groups or pathways which might be involved in the biological process of sarcopenia [56].

4.6. Associations Between Modifiable Risk Factors and Sarcopenia-Related Metabolites

To investigate the associations between potential modifiable lifestyle factors and sarcopenia-related metabolites with convincing colocalization evidence, we conducted additional univariate MR analyses. These analyses included a total of 38 modifiable risk factors, comprising 12 related to lifestyle behaviors, 24 related to diet, and 2 related to obesity (Table S3). FDR < 0.05 was defined as the significance level. R version 4.1.1 was used to conduct all the analyses.

5. Conclusions

In summary, we identified 27 plasma metabolite biomarkers with convincing evidence for sarcopenia-related phenotypes and highlighted 13 metabolites with a cross-sarcopenia effect, and we prioritized the potential intervention metabolite targets of lifestyle changes. Our study offered new clues into the prevention and etiology of sarcopenia. Future studies are needed to validate the findings and investigate whether the identified metabolites could serve as potential intervention targets through lifestyles or drugs to reduce the risk of sarcopenia.

Supplementary Materials

The following supporting information can be downloaded at: https://www.mdpi.com/article/10.3390/ijms252212310/s1.

Author Contributions

Conceptualization, J.L. (Jia Luo) and R.Z.; methodology, J.L. (Jia Luo) and J.L. (Jingxian Li); software, J.L. (Jia Luo) and W.W.; validation, J.L. (Jia Luo) and J.L. (Jingxian Li); formal analysis, J.L. (Jia Luo); investigation, R.Z.; resources, J.L. (Jia Luo) and R.Z.; data curation, J.L. (Jia Luo); writing—original draft preparation, J.L. (Jia Luo) and R.Z.; writing—review and editing, J.L. (Jia Luo); visualization, R.Z.; supervision, D.Z.; project administration, D.Z. All authors have read and agreed to the published version of the manuscript.

Funding

This research received no external funding.

Institutional Review Board Statement

The ethics approval was obtained from the relevant authorities in the original publications.

Informed Consent Statement

The informed consent statement was obtained in the original publications.

Data Availability Statement

The findings of this study can be found in its supplementary materials. GWAS summary data of sarcopenia-related phenotypes are available at http://www.nealelab.is/uk-biobank (accessed on 6 September 2023) and https://gwas.mrcieu.ac.uk/ (accessed on 6 September 2023). The GWAS summary data of metabolites are available at GWAS Catalog (https://www.ebi.ac.uk/gwas/ (accessed on 6 September 2023)). The GWAS summary data of replication analysis are available from the original publications.

Acknowledgments

The authors thank all the participants from metabolomic studies, sarcopenia-related trait GWASs, and UK Biobank cohort, the institutions and their staff for providing data. The authors also thank Xue Li and Jing Sun from Zhejiang University for their assistance in the data analysis.

Conflicts of Interest

The authors declare no potential conflicts of interest.

References

  1. Cruz-Jentoft, A.J.; Baeyens, J.P.; Bauer, J.M.; Boirie, Y.; Cederholm, T.; Landi, F.; Martin, F.C.; Michel, J.P.; Rolland, Y.; Schneider, S.M.; et al. Sarcopenia: European consensus on definition and diagnosis: Report of the European Working Group on Sarcopenia in Older People. Age Ageing 2010, 39, 412–423. [Google Scholar] [CrossRef] [PubMed]
  2. Chen, L.K.; Liu, L.K.; Woo, J.; Assantachai, P.; Auyeung, T.W.; Bahyah, K.S.; Chou, M.Y.; Chen, L.Y.; Hsu, P.S.; Krairit, O.; et al. Sarcopenia in Asia: Consensus report of the Asian Working Group for Sarcopenia. J. Am. Med. Dir. Assoc. 2014, 15, 95–101. [Google Scholar] [CrossRef] [PubMed]
  3. Fielding, R.A.; Vellas, B.; Evans, W.J.; Bhasin, S.; Morley, J.E.; Newman, A.B.; Abellan van Kan, G.; Andrieu, S.; Bauer, J.; Breuille, D.; et al. Sarcopenia: An undiagnosed condition in older adults. Current consensus definition: Prevalence, etiology, and consequences. International working group on sarcopenia. J. Am. Med. Dir. Assoc. 2011, 12, 249–256. [Google Scholar] [CrossRef]
  4. Cruz-Jentoft, A.J.; Bahat, G.; Bauer, J.; Boirie, Y.; Bruyère, O.; Cederholm, T.; Cooper, C.; Landi, F.; Rolland, Y.; Sayer, A.A.; et al. Sarcopenia: Revised European consensus on definition and diagnosis. Age Ageing 2019, 48, 16–31. [Google Scholar] [CrossRef]
  5. Petermann-Rocha, F.; Balntzi, V.; Gray, S.R.; Lara, J.; Ho, F.K.; Pell, J.P.; Celis-Morales, C. Global prevalence of sarcopenia and severe sarcopenia: A systematic review and meta-analysis. J. Cachexia Sarcopenia Muscle 2022, 13, 86–99. [Google Scholar] [CrossRef]
  6. Yuan, S.; Larsson, S.C. Epidemiology of sarcopenia: Prevalence, risk factors, and consequences. Metab. Clin. Exp. 2023, 144, 155533. [Google Scholar] [CrossRef]
  7. Johnson, C.H.; Ivanisevic, J.; Siuzdak, G. Metabolomics: Beyond biomarkers and towards mechanisms. Nat. Rev. Mol. Cell Biol. 2016, 17, 451–459. [Google Scholar] [CrossRef] [PubMed]
  8. Castiglione, V.; Aimo, A.; Vergaro, G.; Saccaro, L.; Passino, C.; Emdin, M. Biomarkers for the diagnosis and management of heart failure. Heart Fail. Rev. 2022, 27, 625–643. [Google Scholar] [CrossRef]
  9. Arnett, D.K.; Claas, S.A. Omics of Blood Pressure and Hypertension. Circ. Res. 2018, 122, 1409–1419. [Google Scholar] [CrossRef]
  10. Buch, A.; Carmeli, E.; Boker, L.K.; Marcus, Y.; Shefer, G.; Kis, O.; Berner, Y.; Stern, N. Muscle function and fat content in relation to sarcopenia, obesity and frailty of old age—An overview. Exp. Gerontol. 2016, 76, 25–32. [Google Scholar] [CrossRef]
  11. Yanai, H.; Tomono, Y.; Ito, K.; Furutani, N.; Yoshida, H.; Tada, N. The underlying mechanisms for development of hypertension in the metabolic syndrome. Nutr. J. 2008, 7, 10. [Google Scholar] [CrossRef] [PubMed]
  12. Liu, H.; Lin, X.; Gong, R.; Shen, H.; Qu, Z.; Zhao, Q.; Shen, J.; Xiao, H.; Deng, H. Identification and Functional Characterization of Metabolites for Skeletal Muscle Mass in Early Postmenopausal Chinese Women. J. Gerontol. Ser. A Biol. Sci. Med. Sci. 2022, 77, 2346–2355. [Google Scholar] [CrossRef] [PubMed]
  13. Lv, W.Q.; Lin, X.; Shen, H.; Liu, H.M.; Qiu, X.; Li, B.Y.; Shen, W.D.; Ge, C.L.; Lv, F.Y.; Shen, J.; et al. Human gut microbiome impacts skeletal muscle mass via gut microbial synthesis of the short-chain fatty acid butyrate among healthy menopausal women. J. Cachexia Sarcopenia Muscle 2021, 12, 1860–1870. [Google Scholar] [CrossRef] [PubMed]
  14. Alldritt, I.; Greenhaff, P.L.; Wilkinson, D.J. Metabolomics as an Important Tool for Determining the Mechanisms of Human Skeletal Muscle Deconditioning. Int. J. Mol. Sci. 2021, 22, 13575. [Google Scholar] [CrossRef]
  15. Peng, W.; Xia, Z.; Guo, Y.; Li, L.; He, J.; Su, Y. The causal relationship of human blood metabolites with the components of Sarcopenia: A two-sample Mendelian randomization analysis. BMC Geriatr. 2024, 24, 339. [Google Scholar] [CrossRef]
  16. Chen, S.; Dong, Y.; Aiheti, N.; Wang, J.; Yan, S.; Kuribanjiang, K.; Li, H.; Peng, X.; Wupuer, A.; Li, Y.; et al. Metabolome-Wide Mendelian Randomization Assessing the Causal Relationship Between Blood Metabolites and Sarcopenia-Related Traits. J. Gerontol. Ser. A Biol. Sci. Med. Sci. 2024, 79, glae051. [Google Scholar] [CrossRef]
  17. Sha, T.; Wang, N.; Wei, J.; He, H.; Wang, Y.; Zeng, C.; Lei, G. Genetically Predicted Levels of Serum Metabolites and Risk of Sarcopenia: A Mendelian Randomization Study. Nutrients 2023, 15, 3964. [Google Scholar] [CrossRef]
  18. Chen, Y.; Lu, T.; Pettersson-Kymmer, U.; Stewart, I.D.; Butler-Laporte, G.; Nakanishi, T.; Cerani, A.; Liang, K.Y.H.; Yoshiji, S.; Willett, J.D.S.; et al. Genomic atlas of the plasma metabolome prioritizes metabolites implicated in human diseases. Nat. Genet. 2023, 55, 44–53. [Google Scholar] [CrossRef]
  19. Holmes, M.V.; Ala-Korpela, M.; Smith, G.D. Mendelian randomization in cardiometabolic disease: Challenges in evaluating causality. Nat. Rev. Cardiol. 2017, 14, 577–590. [Google Scholar] [CrossRef]
  20. Alves, A.; Bassot, A.; Bulteau, A.L.; Pirola, L.; Morio, B. Glycine Metabolism and Its Alterations in Obesity and Metabolic Diseases. Nutrients 2019, 11, 1356. [Google Scholar] [CrossRef]
  21. Gheller, B.J.; Blum, J.E.; Lim, E.W.; Handzlik, M.K.; Hannah Fong, E.H.; Ko, A.C.; Khanna, S.; Gheller, M.E.; Bender, E.L.; Alexander, M.S.; et al. Extracellular serine and glycine are required for mouse and human skeletal muscle stem and progenitor cell function. Mol. Metab. 2021, 43, 101106. [Google Scholar] [CrossRef] [PubMed]
  22. Koopman, R.; Caldow, M.K.; Ham, D.J.; Lynch, G.S. Glycine metabolism in skeletal muscle: Implications for metabolic homeostasis. Curr. Opin. Clin. Nutr. Metab. Care 2017, 20, 237–242. [Google Scholar] [CrossRef]
  23. Liu, Y.; Wang, X.; Wu, H.; Chen, S.; Zhu, H.; Zhang, J.; Hou, Y.; Hu, C.A.; Zhang, G. Glycine enhances muscle protein mass associated with maintaining Akt-mTOR-FOXO1 signaling and suppressing TLR4 and NOD2 signaling in piglets challenged with LPS. Am. J. Physiol. Regul. Integr. Comp. Physiol. 2016, 311, R365–R373. [Google Scholar] [CrossRef]
  24. Genton, L.; Teta, D.; Pruijm, M.; Stoermann, C.; Marangon, N.; Mareschal, J.; Bassi, I.; Wurzner-Ghajarzadeh, A.; Lazarevic, V.; Cynober, L.; et al. Glycine increases fat-free mass in malnourished haemodialysis patients: A randomized double-blind crossover trial. J. Cachexia Sarcopenia Muscle 2021, 12, 1540–1552. [Google Scholar] [CrossRef]
  25. Forcina, L.; Musarò, A. Rejuvenating muscle stem cells with the glutathione system. Cell Metab. 2023, 35, 379–381. [Google Scholar] [CrossRef] [PubMed]
  26. Martin, F.-P.; Boulange, C.L.; Rora, I.M.; Collino, S.; Dumas, M.-E.; Holmes, E.; Rezzi, S.A.D.; Nicholson, J.; Kochhar, S. Isovalerylglycine as Biomarker for the Predispositon for Weight Gain and Obesity. Google Patents G01N33/6893, 2016. [Google Scholar]
  27. Ticinesi, A.; Nouvenne, A.; Cerundolo, N.; Catania, P.; Prati, B.; Tana, C.; Meschi, T. Gut Microbiota, Muscle Mass and Function in Aging: A Focus on Physical Frailty and Sarcopenia. Nutrients 2019, 11, 1633. [Google Scholar] [CrossRef]
  28. Lustgarten, M.S.; Price, L.L.; Fielding, R.A. Analytes and Metabolites Associated with Muscle Quality in Young, Healthy Adults. Med. Sci. Sports Exerc. 2015, 47, 1659–1664. [Google Scholar] [CrossRef] [PubMed]
  29. Lustgarten, M.S.; Price, L.L.; Chalé, A.; Fielding, R.A. Metabolites related to gut bacterial metabolism, peroxisome proliferator-activated receptor-alpha activation, and insulin sensitivity are associated with physical function in functionally-limited older adults. Aging Cell 2014, 13, 918–925. [Google Scholar] [CrossRef]
  30. McCoin, C.S.; Knotts, T.A.; Adams, S.H. Acylcarnitines--old actors auditioning for new roles in metabolic physiology. Nat. Rev. Endocrinol. 2015, 11, 617–625. [Google Scholar] [CrossRef]
  31. Aguer, C.; McCoin, C.S.; Knotts, T.A.; Thrush, A.B.; Ono-Moore, K.; McPherson, R.; Dent, R.; Hwang, D.H.; Adams, S.H.; Harper, M.E. Acylcarnitines: Potential implications for skeletal muscle insulin resistance. FASEB J. Off. Publ. Fed. Am. Soc. Exp. Biol. 2015, 29, 336–345. [Google Scholar] [CrossRef]
  32. Rutkowsky, J.M.; Knotts, T.A.; Ono-Moore, K.D.; McCoin, C.S.; Huang, S.; Schneider, D.; Singh, S.; Adams, S.H.; Hwang, D.H. Acylcarnitines activate proinflammatory signaling pathways. Am. J. Physiol. Endocrinol. Metab. 2014, 306, E1378–E1387. [Google Scholar] [CrossRef] [PubMed]
  33. Zhang, J.; Light, A.R.; Hoppel, C.L.; Campbell, C.; Chandler, C.J.; Burnett, D.J.; Souza, E.C.; Casazza, G.A.; Hughen, R.W.; Keim, N.L.; et al. Acylcarnitines as markers of exercise-associated fuel partitioning, xenometabolism, and potential signals to muscle afferent neurons. Exp. Physiol. 2017, 102, 48–69. [Google Scholar] [CrossRef] [PubMed]
  34. Rinaldo, P.; Matern, D.; Bennett, M.J. Fatty acid oxidation disorders. Annu. Rev. Physiol. 2002, 64, 477–502. [Google Scholar] [CrossRef]
  35. McCoin, C.S.; Knotts, T.A.; Ono-Moore, K.D.; Oort, P.J.; Adams, S.H. Long-chain acylcarnitines activate cell stress and myokine release in C2C12 myotubes: Calcium-dependent and -independent effects. Am. J. Physiol. Endocrinol. Metab. 2015, 308, E990–E1000. [Google Scholar] [CrossRef]
  36. Wax, B.; Kerksick, C.M.; Jagim, A.R.; Mayo, J.J.; Lyons, B.C.; Kreider, R.B. Creatine for Exercise and Sports Performance, with Recovery Considerations for Healthy Populations. Nutrients 2021, 13, 1915. [Google Scholar] [CrossRef] [PubMed]
  37. Butts, J.; Jacobs, B.; Silvis, M. Creatine Use in Sports. Sports Health 2018, 10, 31–34. [Google Scholar] [CrossRef]
  38. Slupsky, C.M.; Rankin, K.N.; Wagner, J.; Fu, H.; Chang, D.; Weljie, A.M.; Saude, E.J.; Lix, B.; Adamko, D.J.; Shah, S.; et al. Investigations of the effects of gender, diurnal variation, and age in human urinary metabolomic profiles. Anal. Chem. 2007, 79, 6995–7004. [Google Scholar] [CrossRef]
  39. Thévenot, E.A.; Roux, A.; Xu, Y.; Ezan, E.; Junot, C. Analysis of the Human Adult Urinary Metabolome Variations with Age, Body Mass Index, and Gender by Implementing a Comprehensive Workflow for Univariate and OPLS Statistical Analyses. J. Proteome Res. 2015, 14, 3322–3335. [Google Scholar] [CrossRef] [PubMed]
  40. Bhardwaj, J.K.; Siwach, A.; Sachdeva, S.N. Metabolomics and cellular altered pathways in cancer biology: A review. J. Biochem. Mol. Toxicol. 2024, 38, e23807. [Google Scholar] [CrossRef]
  41. Xiao, Q.; Moore, S.C.; Keadle, S.K.; Xiang, Y.B.; Zheng, W.; Peters, T.M.; Leitzmann, M.F.; Ji, B.T.; Sampson, J.N.; Shu, X.O.; et al. Objectively measured physical activity and plasma metabolomics in the Shanghai Physical Activity Study. Int. J. Epidemiol. 2016, 45, 1433–1444. [Google Scholar] [CrossRef]
  42. Bruyère, O.; Reginster, J.Y.; Beaudart, C. Lifestyle approaches to prevent and retard sarcopenia: A narrative review. Maturitas 2022, 161, 44–48. [Google Scholar] [CrossRef] [PubMed]
  43. Song, J.; Zhou, D.; Li, J.; Wang, M.; Jia, L.; Lan, D.; Song, H.; Ji, X.; Meng, R. The causal relationship between sarcopenia-related traits and ischemic stroke: Insights from univariable and multivariable Mendelian randomization analyses. CNS Neurosci. Ther. 2024, 30, e14759. [Google Scholar] [CrossRef] [PubMed]
  44. Yin, K.F.; Chen, T.; Gu, X.J.; Su, W.M.; Jiang, Z.; Lu, S.J.; Cao, B.; Chi, L.Y.; Gao, X.; Chen, Y.P. Systematic druggable genome-wide Mendelian randomization identifies therapeutic targets for sarcopenia. J. Cachexia Sarcopenia Muscle 2024, 15, 1324–1334. [Google Scholar] [CrossRef] [PubMed]
  45. Pei, Y.F.; Liu, Y.Z.; Yang, X.L.; Zhang, H.; Feng, G.J.; Wei, X.T.; Zhang, L. The genetic architecture of appendicular lean mass characterized by association analysis in the UK Biobank study. Commun. Biol. 2020, 3, 608. [Google Scholar] [CrossRef] [PubMed]
  46. Elsworth, B.L.; Mitchell, R.; Raistrick, C.A.; Paternoster, L.; Hemani, G.; Gaunt, T.R. MRC IEU UK Biobank GWAS Pipeline Version; University of Bristol: Bristol, UK, 2017. [Google Scholar] [CrossRef]
  47. Vikberg, S.; Sörlén, N.; Brandén, L.; Johansson, J.; Nordström, A.; Hult, A.; Nordström, P. Effects of Resistance Training on Functional Strength and Muscle Mass in 70-Year-Old Individuals with Pre-sarcopenia: A Randomized Controlled Trial. J. Am. Med. Dir. Assoc. 2019, 20, 28–34. [Google Scholar] [CrossRef]
  48. Bohannon, R.W. Are hand-grip and knee extension strength reflective of a common construct? Percept. Mot. Ski. 2012, 114, 514–518. [Google Scholar] [CrossRef]
  49. UK Biobank GWAS Round 2 Results (Neale Lab). Available online: http://www.nealelab.is/uk-biobank (accessed on 10 August 2023).
  50. Burgess, S.; Thompson, S.G. Bias in causal estimates from Mendelian randomization studies with weak instruments. Stat. Med. 2011, 30, 1312–1323. [Google Scholar] [CrossRef]
  51. Hemani, G.; Zheng, J.; Elsworth, B.; Wade, K.H.; Haberland, V.; Baird, D.; Laurin, C.; Burgess, S.; Bowden, J.; Langdon, R.; et al. The MR-Base platform supports systematic causal inference across the human phenome. eLife 2018, 7, e34408. [Google Scholar] [CrossRef]
  52. Jones, G.; Trajanoska, K.; Santanasto, A.J.; Stringa, N.; Kuo, C.L.; Atkins, J.L.; Lewis, J.R.; Duong, T.; Hong, S.; Biggs, M.L.; et al. Genome-wide meta-analysis of muscle weakness identifies 15 susceptibility loci in older men and women. Nat. Commun. 2021, 12, 654. [Google Scholar] [CrossRef]
  53. Giambartolomei, C.; Vukcevic, D.; Schadt, E.E.; Franke, L.; Hingorani, A.D.; Wallace, C.; Plagnol, V. Bayesian test for colocalisation between pairs of genetic association studies using summary statistics. PLoS Genet. 2014, 10, e1004383. [Google Scholar] [CrossRef]
  54. Sun, J.; Zhao, J.; Jiang, F.; Wang, L.; Xiao, Q.; Han, F.; Chen, J.; Yuan, S.; Wei, J.; Larsson, S.C.; et al. Identification of novel protein biomarkers and drug targets for colorectal cancer by integrating human plasma proteome with genome. Genome Med. 2023, 15, 75. [Google Scholar] [CrossRef] [PubMed]
  55. Kia, D.A.; Zhang, D.; Guelfi, S.; Manzoni, C.; Hubbard, L.; Reynolds, R.H.; Botía, J.; Ryten, M.; Ferrari, R.; Lewis, P.A.; et al. Identification of Candidate Parkinson Disease Genes by Integrating Genome-Wide Association Study, Expression, and Epigenetic Data Sets. JAMA Neurol. 2021, 78, 464–472. [Google Scholar] [CrossRef] [PubMed]
  56. Xia, J.; Psychogios, N.; Young, N.; Wishart, D.S. MetaboAnalyst: A web server for metabolomic data analysis and interpretation. Nucleic Acids Res. 2009, 37, W652–W660. [Google Scholar] [CrossRef] [PubMed]
Figure 1. ALM-related metabolites from MR with robust colocalization evidence. Light blue represents males, red represents females, and black represents the overall population. The dots indicate the effect sizes of the corresponding metabolites, with horizontal lines showing the corresponding 95% confidence intervals (CIs). Solid dots indicate evidence supported by colocalization, while hollow dots indicate a lack of colocalization evidence.
Ijms 25 12310 g001
Figure 2. WBLM-related metabolites from MR with robust colocalization evidence. Light blue represents the overall population, light purple represents males, and green represents females. Squares indicate the effect sizes of the corresponding metabolites, with horizontal lines representing 95% confidence intervals (CIs).
Ijms 25 12310 g002
Figure 3. HGS-related metabolites from MR with robust colocalization evidence and results of replication analysis. Squares indicate the effect sizes of the corresponding metabolites, with horizontal lines representing the 95% confidence intervals (CIs).
Ijms 25 12310 g003
Figure 4. Overview of the study design and analytical process.
Ijms 25 12310 g004
Table 1. Summary of results from metabolome-wide MR analysis of sarcopenia-related phenotypes.
PhenotypesStratified AnalysisNumber of Metabolites
with Available IVsp < 0.05p < Bonferroni-Corrected Threshold
ALMBoth sexes66523995
Male66518460
Female66521177
HGSBoth sexes6458618
Male657865
Female6579212
WBLMBoth sexes64519864
Male65714236
Female65712331
Usual walking paceBoth sexes645732
Male657252
Female657490
IVs, instrumental variables; WBLM, whole-body lean mass; ALM, appendicular lean mass; HGS, handgrip strength.
Table 2. Results of metabolites with cross-sarcopenia effect in Mendelian randomization analysis.
MetabolitesAssociation Between Metabolites with Sarcopenia-Related Traits
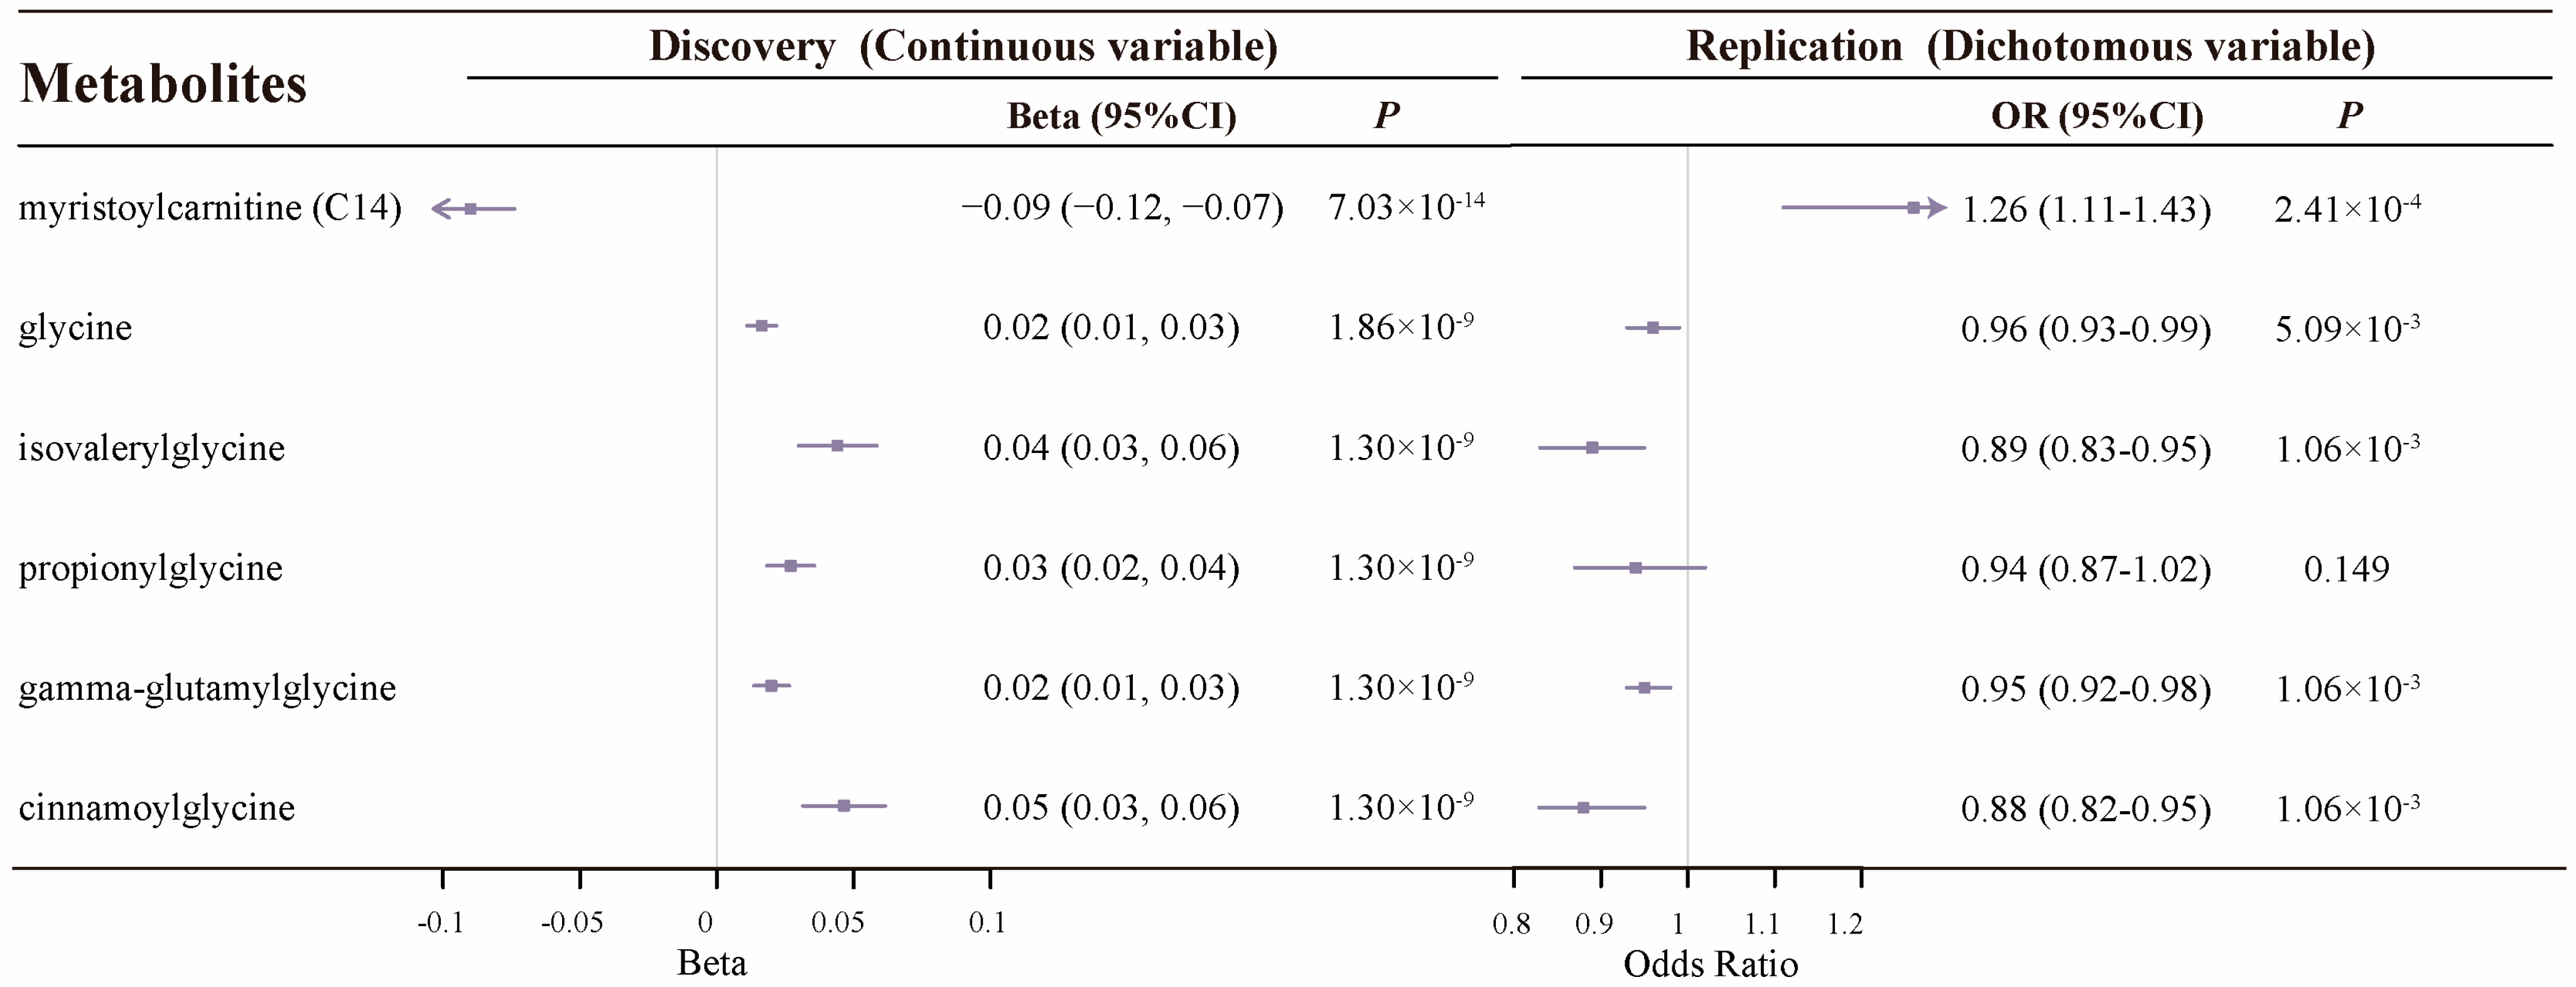
Sarcopenia-Related TraitsSNPBeta (95%CI)p Value
myristoylcarnitineALM *1−0.23 (−0.28, −0.18)1.6 × 10⁻²⁰
WBLM *1−1.52 (−1.97, −1.07)2.91 × 10⁻¹¹
HGS1−0.09 (−0.12, −0.07)7.03 × 10⁻¹⁴
glycineALM20.04 (0.03, 0.05)7.52 × 10⁻²⁹
WBLM20.03 (0.02, 0.04)4.38 × 10−38
HGS20.02 (0.01, 0.03)1.86 × 10⁻⁹
isovalerylglycineALM *10.04 (0.03, 0.06)7.33 × 10⁻⁹
WBLM10.08 (0.07, 0.09)6.02 × 10−37
HGS10.04 (0.03, 0.06)1.3 × 10⁻⁹
propionylglycineALM *20.05 (0.03, 0.06)2.12 × 10⁻⁹
WBLM20.05 (0.04, 0.06)6.02 × 10−37
HGS20.03 (0.02, 0.04)1.3 × 10⁻⁹
gamma-glutamylglycineALM10.30 (0.27, 0.34)2.29 × 10⁻³¹
WBLM10.03 (0.02, 0.04)6.02 × 10−37
HGS10.02 (0.01, 0.03)1.3 × 10⁻⁹
cinnamoylglycineALM10.08 (0.05, 0.11)2.29 × 10⁻³¹
WBLM10.08 (0.07, 0.09)6.02 × 10−37
HGS10.05 (0.03, 0.06)1.30 × 10⁻⁹
mannoseALM10.12 (0.11, 0.14)8.21 × 10−65
WBLM10.07 (0.06, 0.08)1.1 × 10−50
creatineALM20.11 (0.10, 0.13)4.27 × 10−39
WBLM20.08 (0.06, 0.10)3.39 × 10⁻¹⁷
mannonateALM10.15 (0.14, 0.17)8.21 × 10−65
WBLM10.09 (0.08, 0.10)1.1 × 10−50
beta-hydroxyisovaleroylcarnitineALM2−0.17 (−0.21, −0.13)7.65 × 10⁻²⁶
WBLM2−0.07 (−0.09, −0.05)1.45 × 10⁻¹⁸
(R)-3-hydroxybutyrylcarnitineALM1−0.14 (−0.17, −0.10)1.79 × 10⁻¹³
WBLM1−0.07 (−0.09, −0.04)1.48 × 10⁻⁸
(S)-3-hydroxybutyrylcarnitineALM1−0.09 (−0.12, −0.07)4.51 × 10⁻¹⁴
WBLM1−0.05 (−0.07, −0.04)2.27 × 10⁻⁹
acetylcarnitineALM1−0.08 (−0.10, −0.05)1.79 × 10⁻¹³
WBLM1−0.04 (−0.05, −0.02)1.48 × 10⁻⁸
* Colocalization evidence only supports associations of these metabolites with sarcopenia-related phenotypes in males.
Table 3. MR analysis of modifiable lifestyle factors with sarcopenia-related metabolites.
MetabolitesModifiable FactorsMethodnSNPBeta (95%CI)pFDR
1-lignoceroyl-GPC (24:0)Television watchingIVW88−0.44 (−0.66, −0.22)1.07 × 10−44.05 × 10−3
beta-hydroxyisovaleroylcarnitineSleep durationIVW58−0.007 (−0.010, −003)1.13 × 10−32.63 × 10−2
beta-hydroxyisovaleroylcarnitineSmoking initiationIVW1920.20 (0.08, 0.32)1.38 × 10−32.63 × 10−2
gamma-glutamylglycineWHRadjBMIIVW292−0.21 (−0.32, −0.10)2.68 × 10−41.02 × 10−2
glycineWHRadjBMIIVW292−0.23 (−0.35, −0.12)3.89 × 10−51.48 × 10−3
levulinoylcarnitineTea consumptionIVW121.82 (0.83, 2.81)3.19 × 10−41.21 × 10−2
mannoseSmoking initiationIVW1920.22 (0.10, 0.35)2.98 × 10−41.13 × 10−2
mannoseMilk intakeWald ratio10.08 (0.03, 0.13)2.41 × 10−34.59 × 10−2
sphingomyelin
(d18:2/14:0, 18:1/14:1)
WHRadjBMIIVW292−0.22 (−0.31, −0.12)7.77 × 10−62.95 × 10−4
IVW, inverse-variance weighted; FDR, false discovery rate; WHRadjBMI, waist-to-hip ratio adjusted for body mass index.
Disclaimer/Publisher’s Note: The statements, opinions and data contained in all publications are solely those of the individual author(s) and contributor(s) and not of MDPI and/or the editor(s). MDPI and/or the editor(s) disclaim responsibility for any injury to people or property resulting from any ideas, methods, instructions or products referred to in the content.

