Article

Genome-Wide Identification of the CAT Genes and Molecular Characterization of Their Transcriptional Responses to Various Nutrient Stresses in Allotetraploid Rapeseed

School of Agricultural Sciences, Zhengzhou University, Zhengzhou 450001, China
*
Authors to whom correspondence should be addressed.
Int. J. Mol. Sci. 2024, 25(23), 12658; https://doi.org/10.3390/ijms252312658
Submission received: 6 September 2024 / Revised: 6 November 2024 / Accepted: 8 November 2024 / Published: 25 November 2024
(This article belongs to the Section Molecular Plant Sciences)

Abstract

:
Brassica napus is an important oil crop in China and has a great demand for nitrogen nutrients. Cationic amino acid transporters (CAT) play a key role in amino acid absorption and transport in plants. However, the CATs family has not been reported in B. napus so far. In this study, genome-wide analysis identified 22 CAT members in the B. napus genome. Based on phylogenetic and synteny analysis, BnaCATs were classified into four groups (Group I–Group IV). The members in the same subgroups showed similar physiochemical characteristics and intron/exon and motif patterns. By evaluating cis-elements in the promoter regions, we identified some cis-elements related to hormones, stress and plant development. Darwin’s evolutionary analysis indicated that BnaCATs might have experienced strong purifying selection pressure. The BnaCAT family may have undergone gene expansion; the chromosomal location of BnaCATs indicated that whole-genome replication or segmental replication may play a major driving role. Differential expression patterns of BnaCATs under nitrate limitation, phosphate shortage, potassium shortage, cadmium toxicity, ammonium excess and salt stress conditions indicated that they were responsive to different nutrient stresses. In summary, these findings provide a comprehensive survey of the BnaCAT family and lay a foundation for the further functional analysis of family members.

1. Background

Amino acids are not only a source of nitrogen (N) nutrients that can be directly absorbed by plants but are also the major transport form of organic n in plants [1]. Amino acids are distributed within the plant through both xylem and phloem to supply organs that are net importers, such as seeds or tubers [2]. The two major amino acid transporter families in plants can be classified as ATF (amino acid transporter family) and APC (amino acid polyamine choline transporters) [3]. Among them, cationic amino acid transporters (CAT) belong to the APC family and play a key role in amino acid transport and N metabolism in plants [4]. In Arabidopsis thaliana, the CAT family contains nine protein members (AtCAT19) that are widely expressed in different tissues including roots, stems, leaves, flowers and fruits of A. thaliana [5,6,7,8,9,10]. AtCAT1 (cationic amino acid transporter 1) plays a role in nitrogen distribution and balance [5]. AtCAT2 is a critical target of leaf amino acid concentrations, and manipulation of this tonoplast transporter can significantly alter total tissue amino acid concentrations [6]. AtCAT5 functions as a high-affinity basic amino acid transporter at the plasma membrane [7]. AtCAT3 and AtCAT4 play roles in intracellular compartmentalization of amino acids, intercellular transport across plasmodesmata and loading/unloading of vascular tissue, respectively [8]. AtCAT6 and AtCAT8 are involved in the delivery of amino acids to library tissues [9]. AtCAT9 plays an important role in amino acid homeostasis [10]. In wheat, ten identified CAT proteins may be related to the response to various stresses, are cytoplasm localized and may function as antioxidant enzymes [11]. Four proteins have been identified in soybean that play important roles in plant defense, development, and senescence [12]. Four candidate CsCATs were identified in cucumber. Based on the expression pattern comparison, CsCATs exhibited an expression pattern similar to Arabidopsis counterparts [13]. In addition, the ectopic expression of maize CAT2 (ZmCAT2) in tobacco can induce CATs activity, improving pathogen resistance [14]. The allotetraploid Brassica napus (AnAnCnCn, 2n = 4x = 38) is the second most important oilseed crop in the world and originated from the spontaneous hybridization of the diploid B. rapa (ArAr, 2n = 2x = 20) and B. oleracea (CoCo, 2n = 2x = 18) [15,16,17]. Rapeseed is one of the most important oil crops in China, and its area and production rank first in the world. It can provide about 5 million tons of edible oil for China annually. Increasing the yield per unit area is an important way to increase output value per unit area of rapeseed [18]; its yield and quality are greatly affected by the N element. Due to the low efficiency of N use in rapeseed, a large amount of N fertilizers should be invested to ensure rapeseed yield [7]. Therefore, improving the N remobilization efficiency in oilseed rape is important for increasing N use efficiency through molecular modulation of amino acids transporters, especially CATs.
However, there are few systematic analyses of CATs in B. napus. Therefore, it is very important to analyze the nutritional physiological and biological characteristics of CAT members in B. napus. In this study, we aimed to (i) identify the genome-wide CATs in B. napus, (ii) characterize the genomic properties and transcriptional responses of CAT members to N stresses, including nitrate limitation and ammonium toxicity, and (iii) investigate the transcriptional responses of CATs to other nutrient stresses, including phosphate limitation, boron deficiency, cadmium toxicity and salt stress. Bioinformatics and molecular biology methods were used to identify compare and analyze the expression of the B. napus CATs (named as BnaCAT). Through the statistics of the transmembrane region of BnaCAT proteins, active site prediction, phylogenetic analysis, protein interaction and expression pattern exploration, such data can provide a partial reference for related studies of amino acid transport and nitrogen nutrient metabolism in rapeseed.

2. Results

2.1. Identification of BnaCAT Family Members and Construction of Phylogenetic Tree in B. napus

According to the protein sequences of the AtCATs family in A. thaliana, 22 BnaCAT members have been identified in the B. napus genome. According to the sequence on the B. napus chromosome, the 22 BnaCATs were renamed. Furthermore, using the amino acid sequences of Arabidopsis family members as query conditions, we screened and identified the homolog of B. oleracea and B. rapa in the BRAD database through the PFAM domain. As shown in Table 1, CATs had nine members (CAT1CAT9) in the A. thaliana model and each CAT member had a single copy. A total of 13, 13, and 22 CAT homologues were identified in B. rapa, B. oleracea, and B. napus, respectively. The results showed that the number of CATs in B. napus was similar to the sum of CATs in B. rapa and B. oleracea. This suggests that most CATs were conserved during spontaneous hybridization between B. rapa and B. oleracea to from the allotetraploid B. napus. However, we found that CAT7 was lost in B. napus. The changes in the number of BanCATs may indicate their critical differential roles in the resistance of B. napus to N stress. To explore the phylogenetic relationship between 22 members of the CATs family, an unrooted phylogenetic tree was constructed using 10.2.2 (Figure 1). We performed phylogenetic analysis of CAT proteins in A. thaliana and B. napus. The phylogenetic tree could be divided into four major clades, which could be further subdivided into nine smaller categories, and each BnaCAT member was closely clustered with the corresponding homologs in A. thaliana (Figure 1). There were no homologous genes of AtCAT7 in B. napus, suggesting that the homologs in B. napus were lost during evolutionary history. In conclusion, these results showed that the CAT family in B. napus underwent specific evolutionary events after the divergence of A. thaliana.

2.2. Molecular Characterization of BnaCATs

In order to gain insight into the molecular characteristics of the BnaCAT proteins, we calculated the physicochemical parameters of each BnaCAT protein using ExPASy. The results demonstrated that the majority of proteins within the same CAT subfamily exhibited comparable physicochemical parameters (Table 2). In conclusion, the coding sequence (CDS) lengths of BnaCATs exhibited considerable variation, ranging from 1590 bp (BnaA3.CAT6 and BnaC3.CAT6) to 1917 bp (BnaA9.CAT2a). This variation was reflected in the deduced amino acid (AA) number, which ranged from 529 (BnaC3.CAT6, BnaC3.CAT6) to 638 (BnaA9.CAT2a) (Table 2). The computed molecular weights of BnaCATs exhibited a range from 56.9 KD (BnaA3.CAT6 and BnaC3.CAT6) to 68.0 KD (BnaCn.CAT3) (Table S1). Theoretical isoelectric points (pIs) of BnaCATs exhibited a range from 5.56 (BnaAn.CAT4) to 9.02 (BnaC7.CAT6), with some values exceeding 7.0 (Table S1). The GRAVY index reflects the hydrophilic and hydrophobic nature of the protein physicochemical properties. The results showed that the GRAVY values of the BnaCATs ranged from 0.512 (BnaC7.CAT1) to 0.795 (BnaC3.CAT6) (Table S1). Therefore, it can be assumed that all the CAT proteins in Brassica napus are hydrophobic. The majority of BnaCATs exhibited instability 40.0 (Table S1), indicating that the majority of BnaCATs demonstrated robust protein stability, with the expectation of BnaAn.CAT9 (41.71) to exhibit an instability index above >40.0. One study revealed the subcellular localization of 9 AtCATs, while the online WoLF PSORT was employed to predict the subcellular localization of 22 BnaCATs (Table S1). The finding indicated that the majority of them were localized in the plasma membrane, suggesting that they might be involved in the trans-membrane transport of AAs. In detail, BnaAn.CAT9 was mainly distributed in the plasma membrane and endoplasmic reticulum, suggesting that it might play an important role in amino acid homeostasis. We utilized the TMHMM tool to characterize the transmembrane structures of CATs in A. thaliana and B. napus, and found that AtCATs and BnaCATs had twelve to fifteen membrane-spanning regions (Table S1; Figure S1). In detail, AtCAT2/BnaCAT2s, AtCAT3/BnaCAT3s, AtCAT4/BnaCAT4s and AtCAT5/BnaCAT5s had fourteen trans-membrane regions. AtCAT8/BnaCAT8s had thirteen trans-membrane regions, and the other three subgroup members had different membrane-spanning regions between Arabidopsis and B. napus. The NetPhos tool was employed to identify phosphorylation sites in BnaCATs. The results indicated that serine is the most prevalent site for phosphorylation (Figure S2). In line with AtCATs lacking signal peptides, BnaCATs were also found to lack any signal peptides (Figure S3).

2.3. Identification of Evolutionary Selection Pressure on BnaCATs

To explore the selective pressure on BnaCATs, the non-synonymous/synonymous mutation ratio (Ka/Ks) was calculated; Ka/Ks > 1.0 indicates positive selection, Ka/Ks = 1.0 indicates neutral selection, and Ka/Ks < 1.0 indicates purifying selection (Table 2).
The Ka values of BnaCATs exhibited a wide range, from 0.0362 (BnaC3.CAT6) to 0.429 (BnaC7.CAT6), with an average of 0.0709. Similarly, the Ks values of BnaCATs demonstrated considerable variation from 0.2769 (BnaAn.CAT9) to 2.1475 (BnaC7.CAT6), with an average of 0.5433. Furthermore, it was observed that all Ka/Ks values of BnaCATs were less than 1.0 (Table 2). Consequently, it was postulated that the BnaCATs may have been subjected to a particularly intense negative selection pressure in order to maintain their functionality. The Ks values of duplicated homologs among gene families are typically regarded as molecular clocks, with the assumption that they remain unaltered over time. The divergence between the model Arabidopsis and its derived Brassica species is estimated to have occurred approximately 12–20 million years ago (Mya) [19,20]. The results indicated that the majority of BnaCATs diverged from AtCATs approximately 11.0–20.0 Mya (Figure 1), suggesting that the divergence of the Brassica species may have occurred concurrently with the divergence of the CATs.

2.4. Chromosomal Distribution and Syntenic Analysis of BnaCATs

Gene expansion is a phenomenon observed during the evolution of species [21]. According to chromosomal annotation information of B. napus, CATs identified were mapped on chromosomes (Figure 2). Twenty-two BnaCATs were distributed unevenly in the B. napus genome, with each chromosome containing one to three genes (Figure 2). Chromosome Ann random had the highest number of BnaCATs, with three BnaCATs. Furthermore, the distribution of A and C chromosomes in B. napus was also unequal, with 12 in the A genome and 10 in the C genome (Figure 2).
Gene family expansion occurs primarily through four pathways: tandem replication, fragment replication, whole genome replication (polyploidy) and replication transposition [4]. Gene duplication plays a pivotal role in plant evolution. Comparative genomics has revealed that the Arabidopsis genome can be divided into 24 ancestral cruciferous blocks, labeled A–X [22]. The results demonstrated that CATs family members in Arabidopsis and their corresponding homologues in B. napus are located in the same chromosomal segment (Table 2). The inter-chromosomal relationship of BnaCATs exhibited 18 pairs of segmental duplications. These findings indicated that gene replication played a pivotal role in the amplification of CATs in the B. napus genome, with whole genome replication or segmental replication may serve as a primary driving force.
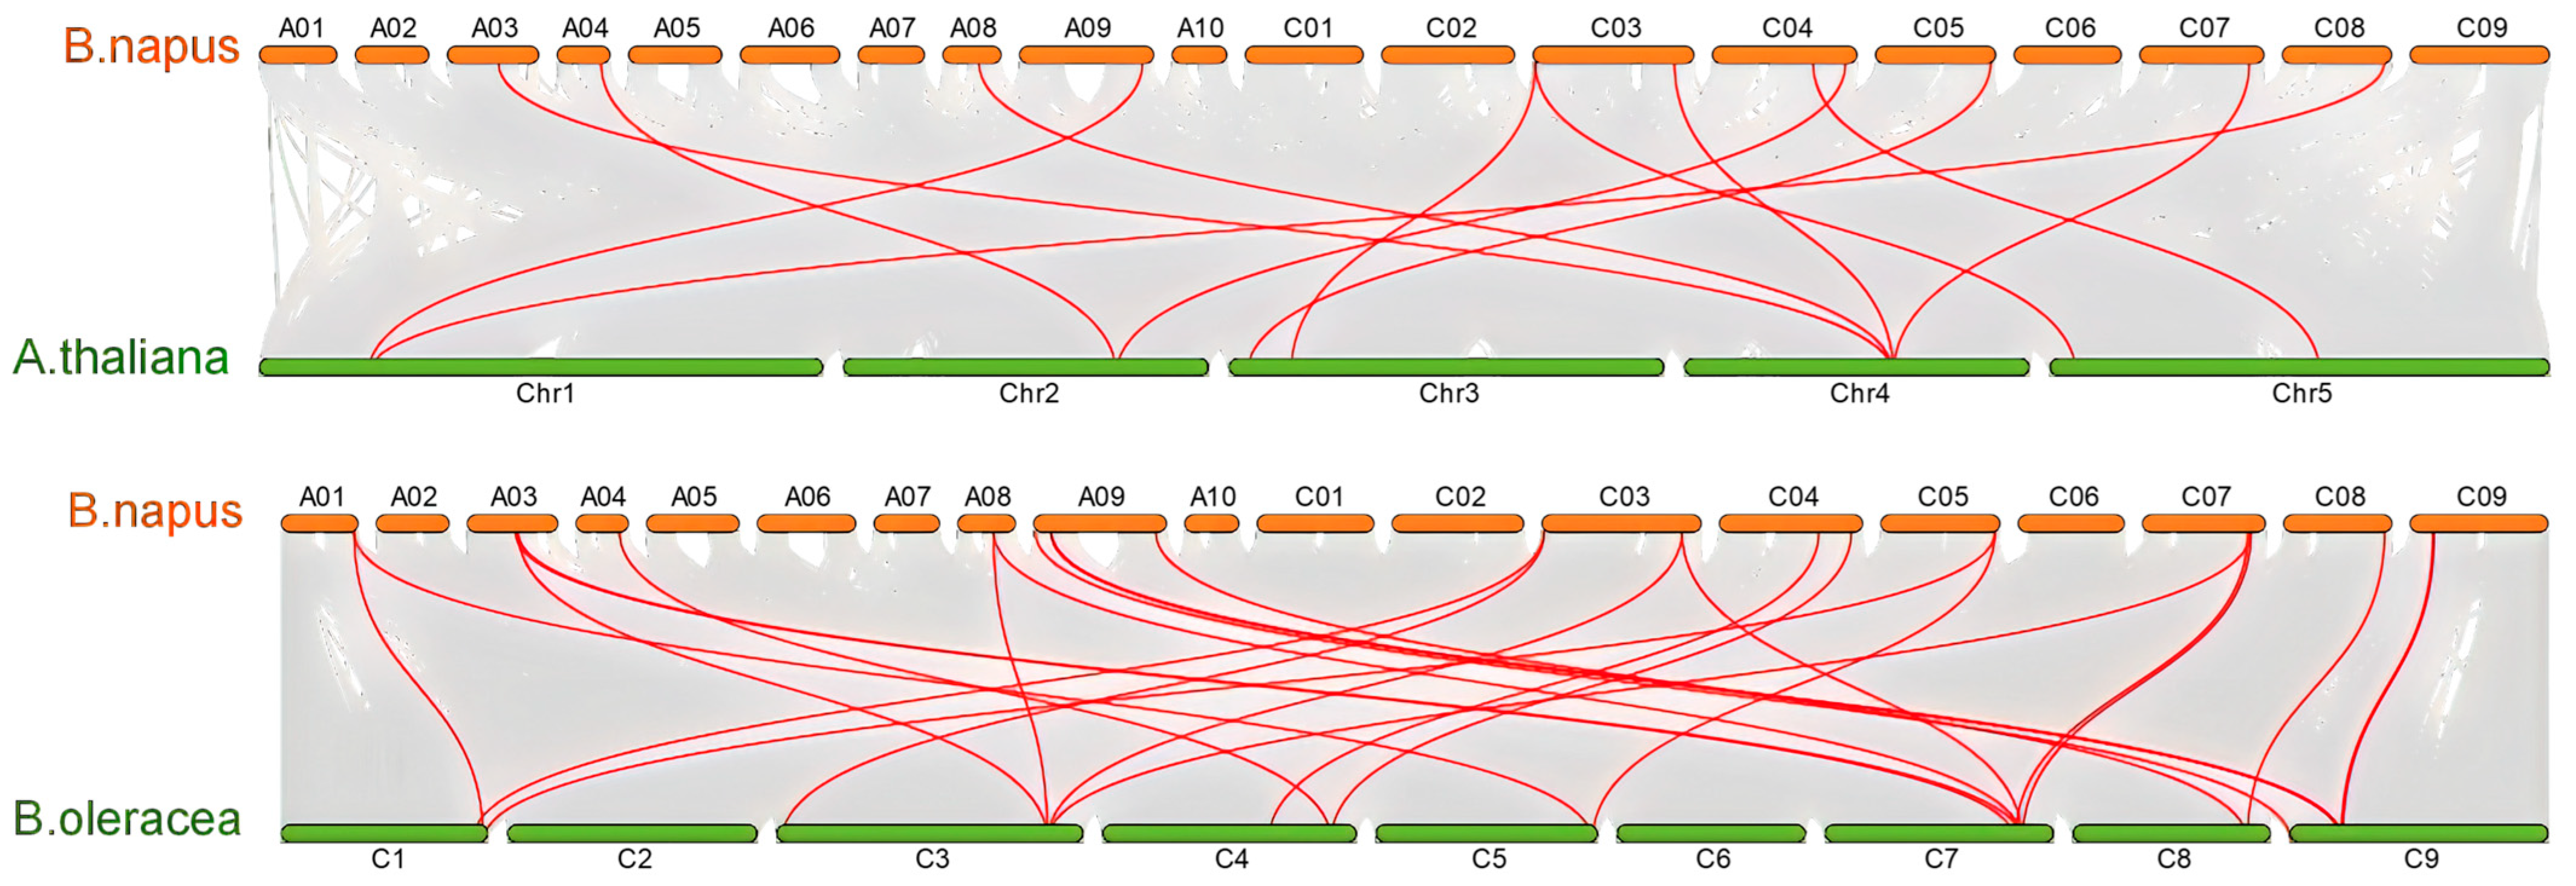
The evolution of the CATs gene family in the genus Brassica was investigated by analyzing the homologous relationships among B. napus, A. thaliana, B. rapa, and B. oleracea. A collinear analysis revealed that a considerable number of homologous CATs were present in B. napus, A. thaliana, B. rapa, and B. oleracea. A total of twelve pairs of genes were collinear in B. napus and A. thaliana (Figure 3), and 11 CATs in B. napus had homologous genes in A. thaliana (Figure 3). Furthermore, 23 pairs of genes in B. napus and B. rapa demonstrated collinearity (Figure 3). Of the 16 B. napus CATs with homologous genes in B. rapa (Figure 3), there were 23 pairs of genes in B. napus and B. oleracea, and 72.7% (16) of CATs in B. napus had homologs in B. oleracea (Figure 3). These findings suggest that the majority of CATs remained intact throughout the formation and evolution of B. napus.

2.5. Conserved Motifs, Gene Structure Analysis of BnaCATs

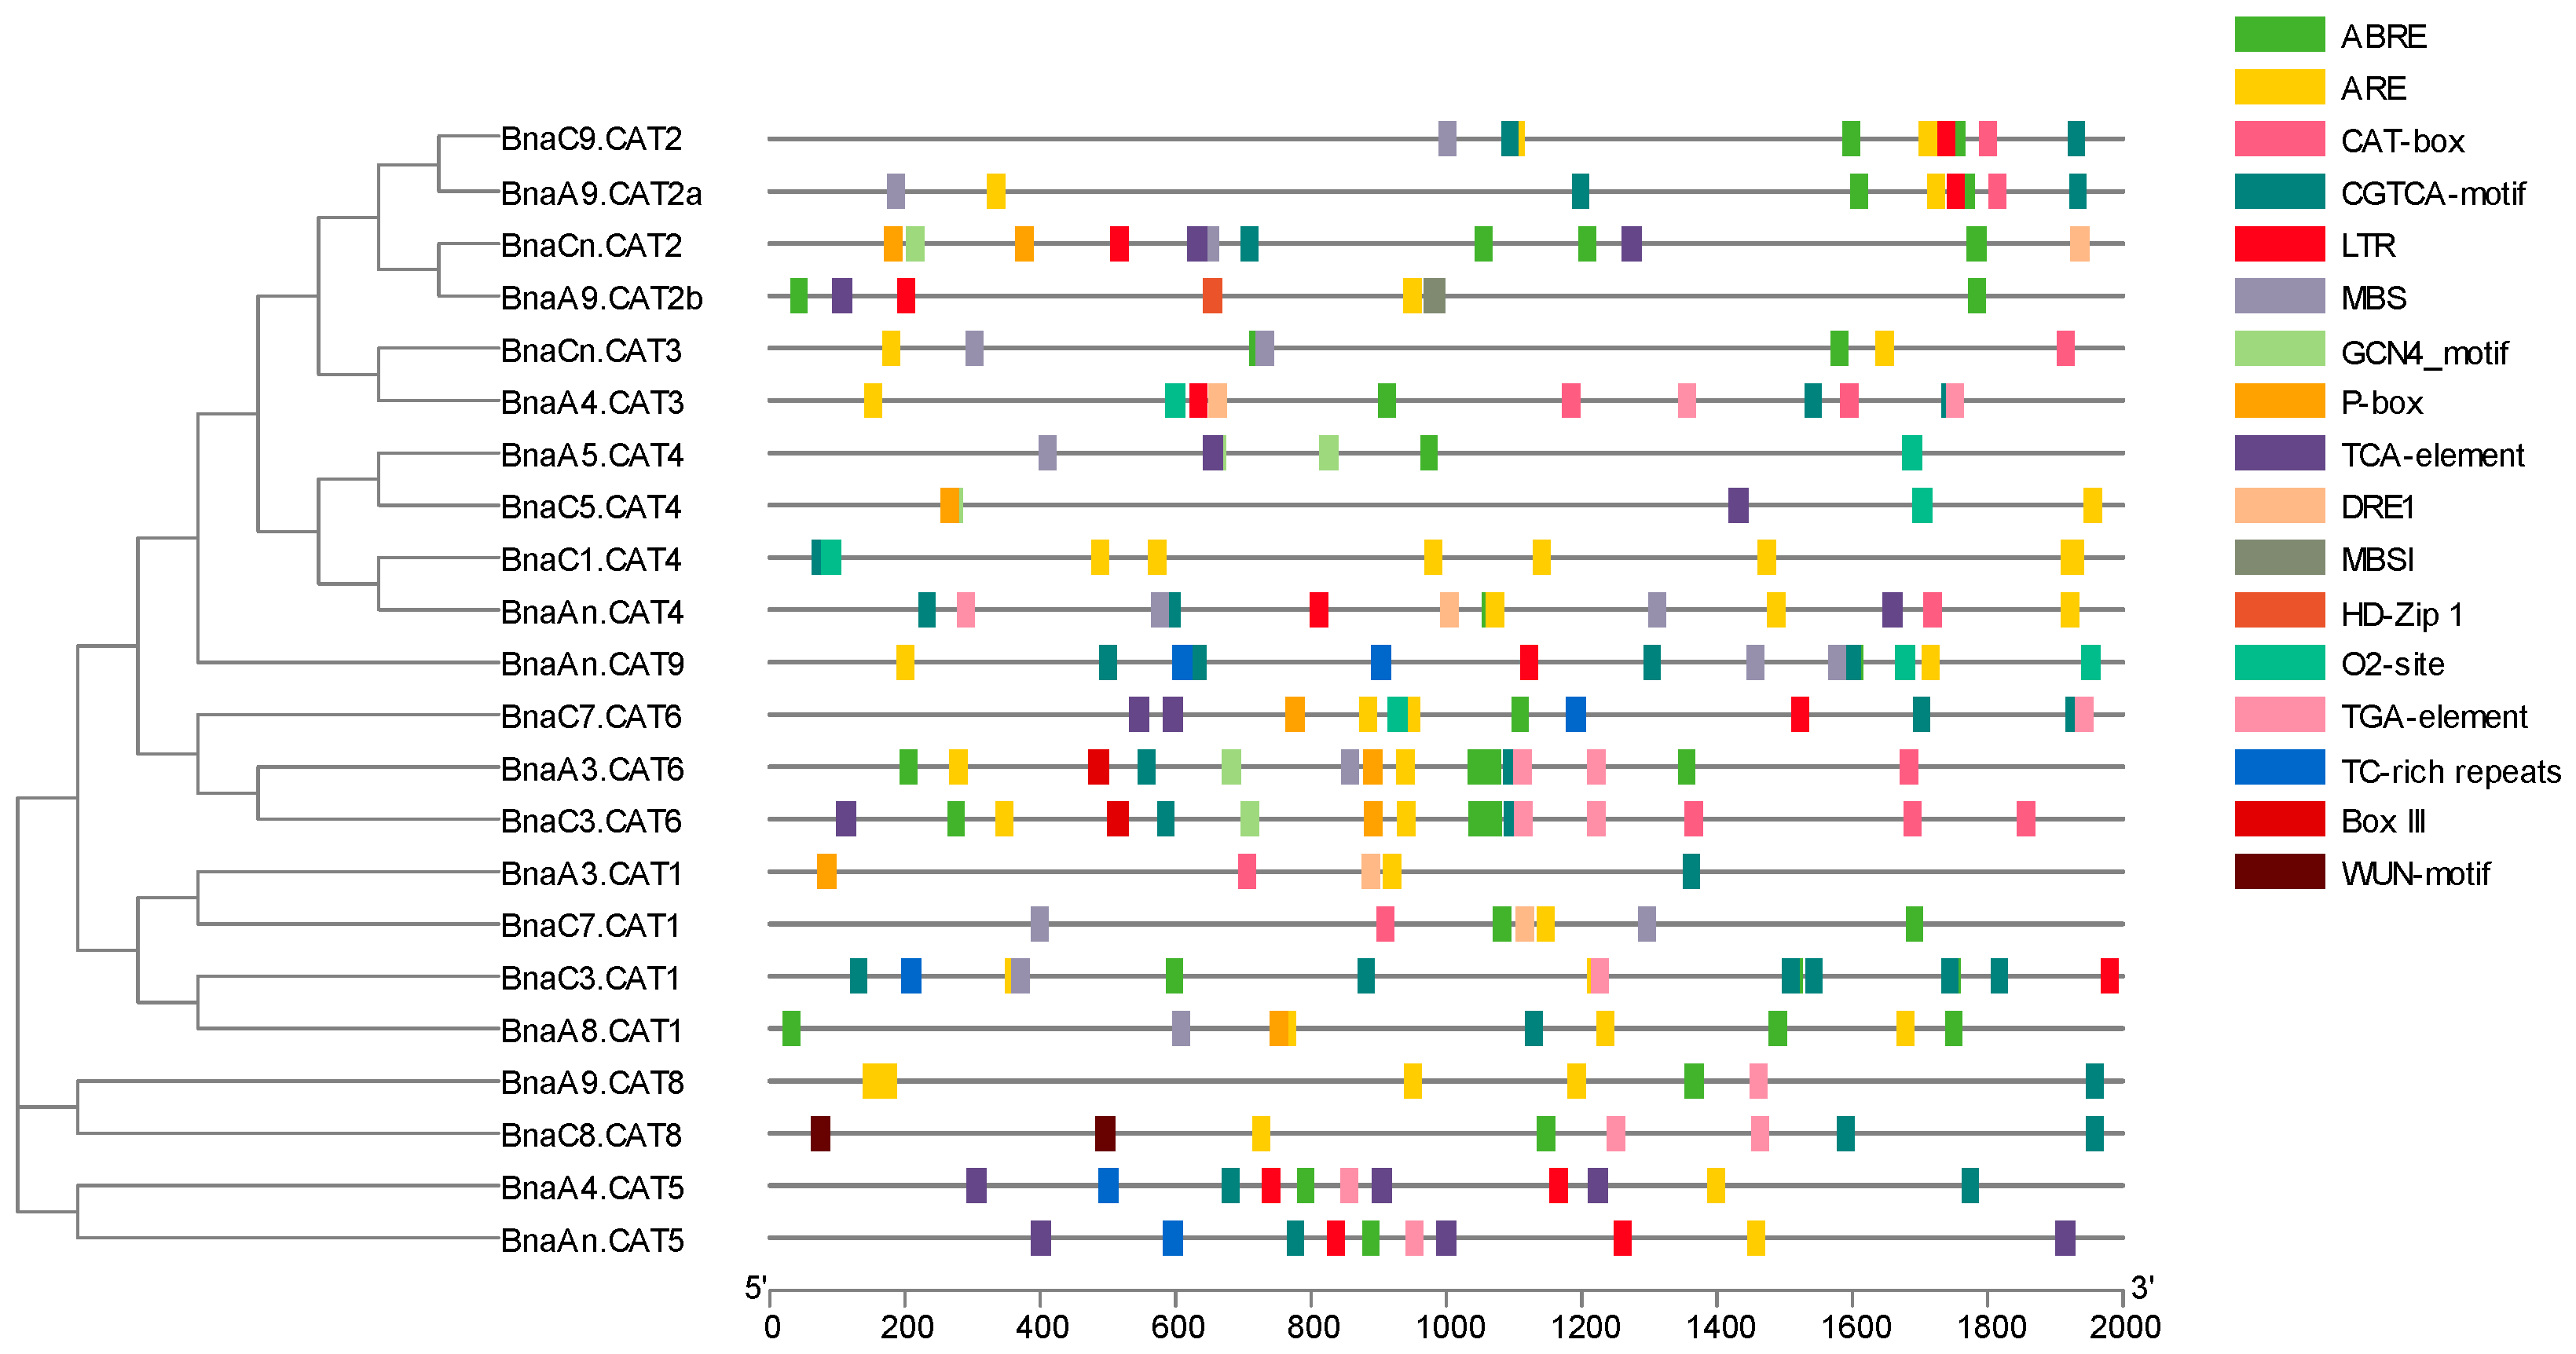
To further clarify the potential functions of CATs in B. napus, MEME was used to identify 15 conserved motifs. We found that the amino acid sequences of the motifs 1, 2, 3, 5, 6, 7, 8, 12, and 14 had the highest identity among all the BnaCATs (Figure 4), and thus might be used as indicators of the CAT family members. The genetic classification revelated that the CAT proteins exhibited similarities among the four groups, while there were also differences among the groups (Figure 4). For instance, motif 15 was specific to group I and motif 9 was specific to the group IV (Figure 4). This indicated that the CAT sequence is evolutionarily conserved but differentiated.
To evaluate the sequence diversity of BnaCATs, the exon–intron structures of each BnaCAT were detected. In detail, the number of introns and exons varies among each group of BnaCATs (Figure 4). It was observed that similar structures were typically found within the same group (Figure 4). The number of introns in Group I is 13, with the exception of BnaA4.CAT3 (Figure 4). The BnaAn.CAT9 sequence exhibited six introns (Figure 4). The Group III genes exhibited two or four introns (Figure 4). The number of introns present in the Group IV genes exhibited a range from zero to two (Figure 4). These results indicated the clusters of BnaCATs had a similar intron/exon pattern. Studies on the conserved motif composition, gene structure and phylogenetic relationship have demonstrated that BnaCAT proteins have very conserved amino acid residues, and members within the group may have similar functions.

2.6. Cis-Element Analysis of the Promoter Regions of the BnaCATs

Cis-acting elements play a key role in the regulation of gene expression. To investigate the function and regulatory patterns, a 2000 bp sequence of these genes was submitted to the PlantCare database. The cis-elements of BnaCATs were primarily classified into three categories: plant growth and development, stress-responsive elements and phytohormone responsive elements. The first category of elements primarily encompasses meristem expression (CAT-box), zein metabolism regulation (O2-site), endosperm expression (GCN4-motif) and flavonoid biosynthetic gene regulation (MBSI) (Figure 5). In the second category, which pertains to stress-responsive elements, the following elements were identified: wound-responsive (WUN motif), anaerobic induction (ARE), low-temperature-responsive (LTR) and MYB-binding sites involved in drought inducibility (MBS), and stress responsiveness (TC-rich repeats) (Figure 5). In the second category (phytohormone responsive), the elements included gibberellin responsiveness (P-box) and methyl methyl jasmine-responsive (CGTCA-motif), auxin-responsive (TGA-element) and abscisic acid-responsive (ABRE) (Figure 5) elements. Among these cis-elements, ABRE-, ARE-, and CGTCA-motif elements were particularly noteworthy, as they were involved in abscisic acid responsiveness, anaerobic induction and MeJA responsiveness (Figure 5). These results indicate that BnaCATs may be induced or repressed by abiotic stresses, subsequently participating in plant stress resistance. It is noteworthy that each BnaCAT exhibited a distinct array of cis-elements; this suggested that under varying growth and developmental stages, environmental conditions and other factors, BnaCATs may function independently or in concert to ensure optimal plant growth and development.

2.7. Protein–Protein Interaction Analysis of BnaCATs

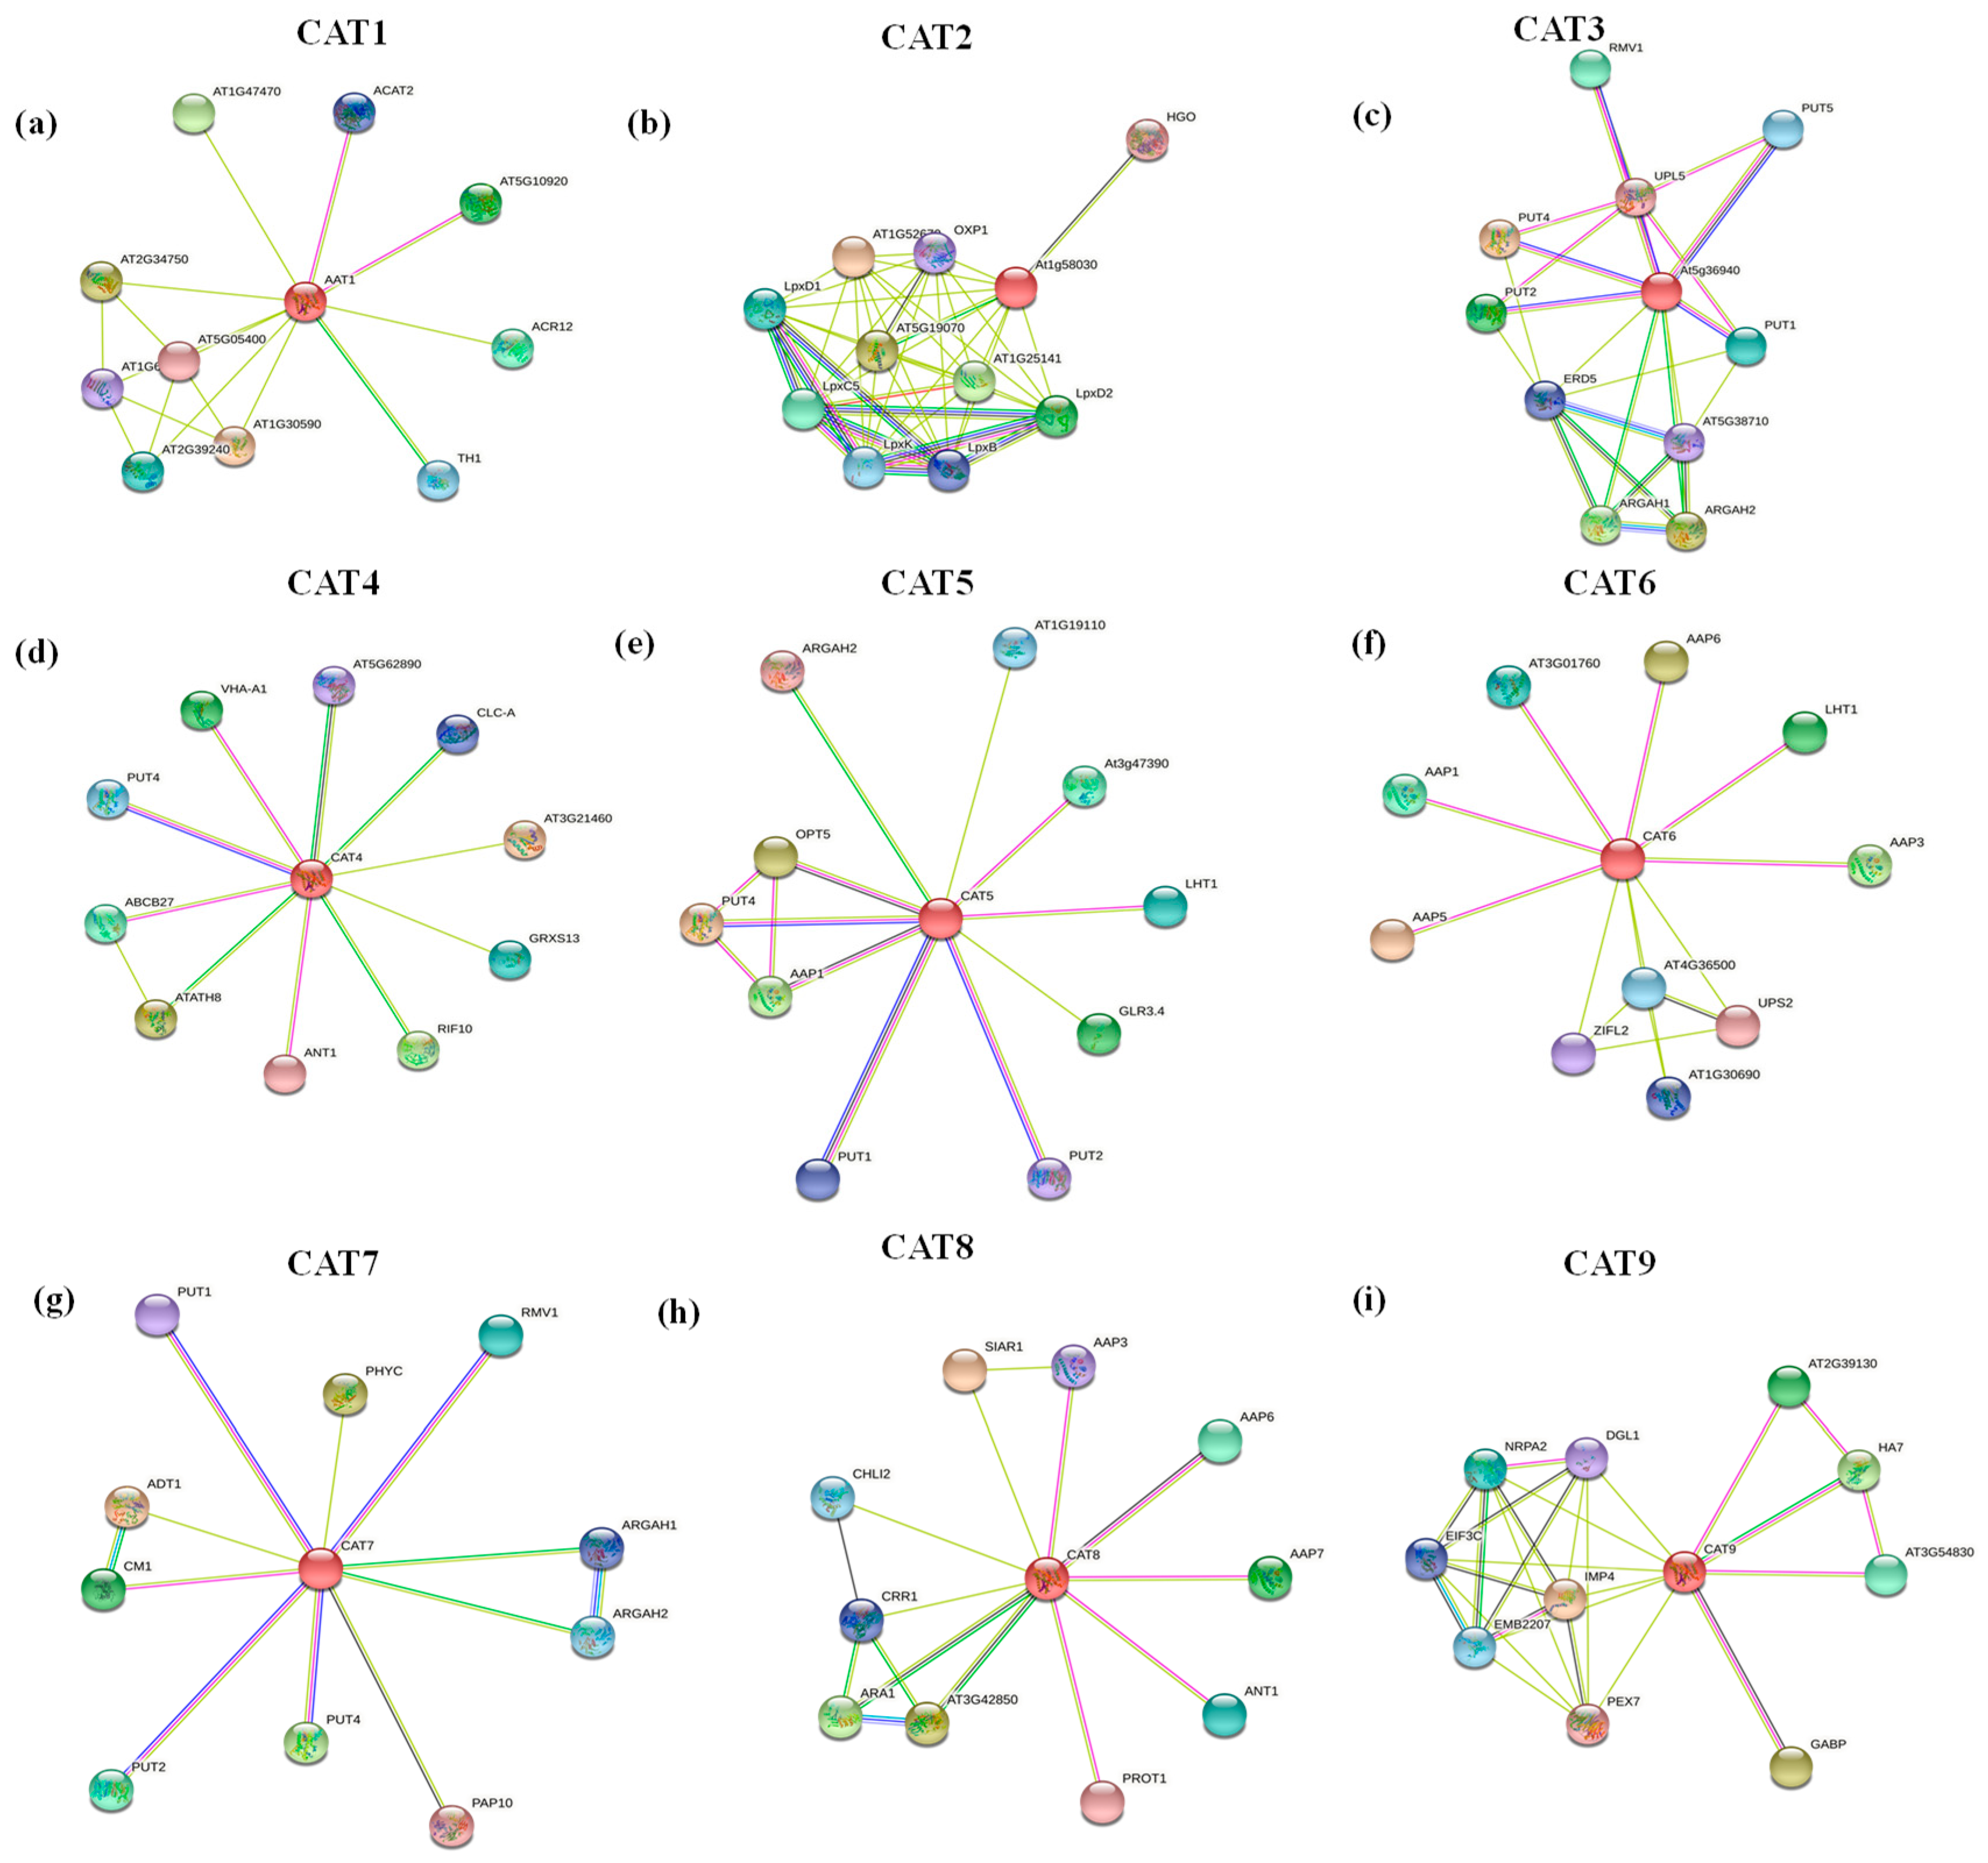
To further identify the protein(s) potentially interacting with the CAT family members, we constructed a protein interaction network of CATs using the STRING database. As illustrated in Figure 6, the proteins closely related to CAT proteins in Arabidopsis thaliana are primarily polyamine absorption transporters (PUT, polyamine uptake transporter) and certain amino acid permeases (AAPs). AAPs play roles in the transport of a wide range of amino acids and the regulation of physiological processes in plants [21]. The secondary structures of CATs were predicted using the SOPMA [4]. The three-dimensional structure of BnaCAT proteins was predicted using the Phyre2 software V2.0 (https://www.sbg.bio.ic.ac.uk/, accessed on 10 September 2024) (Figure S4). The secondary structures of the eight BnaCAT proteins were found to be composed of four structural elements: α-helix, extended chain, β-fold, and random curl (Table S2, Figure S4). The percentages of α secondary structures ranged from 39.78% (BnaA4.CAT3) to 55.05% (BnaC7.CAT1), with an average of 48.39% (Table S2, Figure S4). The random coil ratios of BnaCATs exhibited considerable variation, ranging from 27.54% (BnaAn.CAT5, BnaA4.CAT5) to 39.87% (BnaA9.CAT2a), with an average of 32.26% (Table S2, Figure S4). The proportion of β-fold in BnaCATs ranged from 3.36% (BnaA3.CAT1) to 5.44% (BnaAn.CAT9), with an average of 4.17% (Table S2, Figure S4). This suggests that the α-helix constitutes a significant component of the BnaCAT secondary structure, with the random coil and β-fold elements being the least abundant. Eight BnaCAT proteins exhibited a high proportion of random coil structure (Table S2, Figure S4), which is often affected by the side chain to form the active site of the protein [22].

2.8. Expression Profiles of BnaCATs in Response to Diverse Nutrient Stresses

To identify the expression patterns of BnaCATs, we initially investigated the tissue-specific expression patterns of BnaCATs in various tissues through the BnIR. The results demonstrated that BnaCATs exhibited distinct expression patterns. BnaA9.CAT8, BnaC8.CAT8 and BnaAn.CAT9 were found to be constitutively expressed in multiple tissues, whereas others displayed preferential expression in specific tissues (Figure S5). For example, BnaC7.CAT1, BnaA3.CAT1, BnaA9.CAT2a, BnaCn.CAT2, BnaCn.CAT3 and BnaA5.CAT4 were found to be predominantly expressed in senescent leaves and dried seeds (Figure S5). The BnaA8.CAT1, BnaC3.CAT1, BnaAn.CAT4, BnaC1.CAT4, BnaA9.CAT2b, BnaA4.CAT3, BnaC9.CAT2 and BnaC3.CAT6 genes were found to be highly expressed in buds or flowers, indicating a potential involvement in seed development (Figure S5). BnaC5.CAT4 was predominantly expressed in buds and dried seeds (Figure S5). The preferential expression of BnaA4.CAT5 in the lower stem indicated its participation in long-distance translocation of AA (Figure S5). BnaA3.CAT6 and BnaC7.CAT6 exhibited no expression in most tissues (Figure S5). In order to ascertain the functions of BnaCATs in regulating rapeseed against various nutrient stresses, we conducted a transcriptional analysis of their responses under different stress conditions.
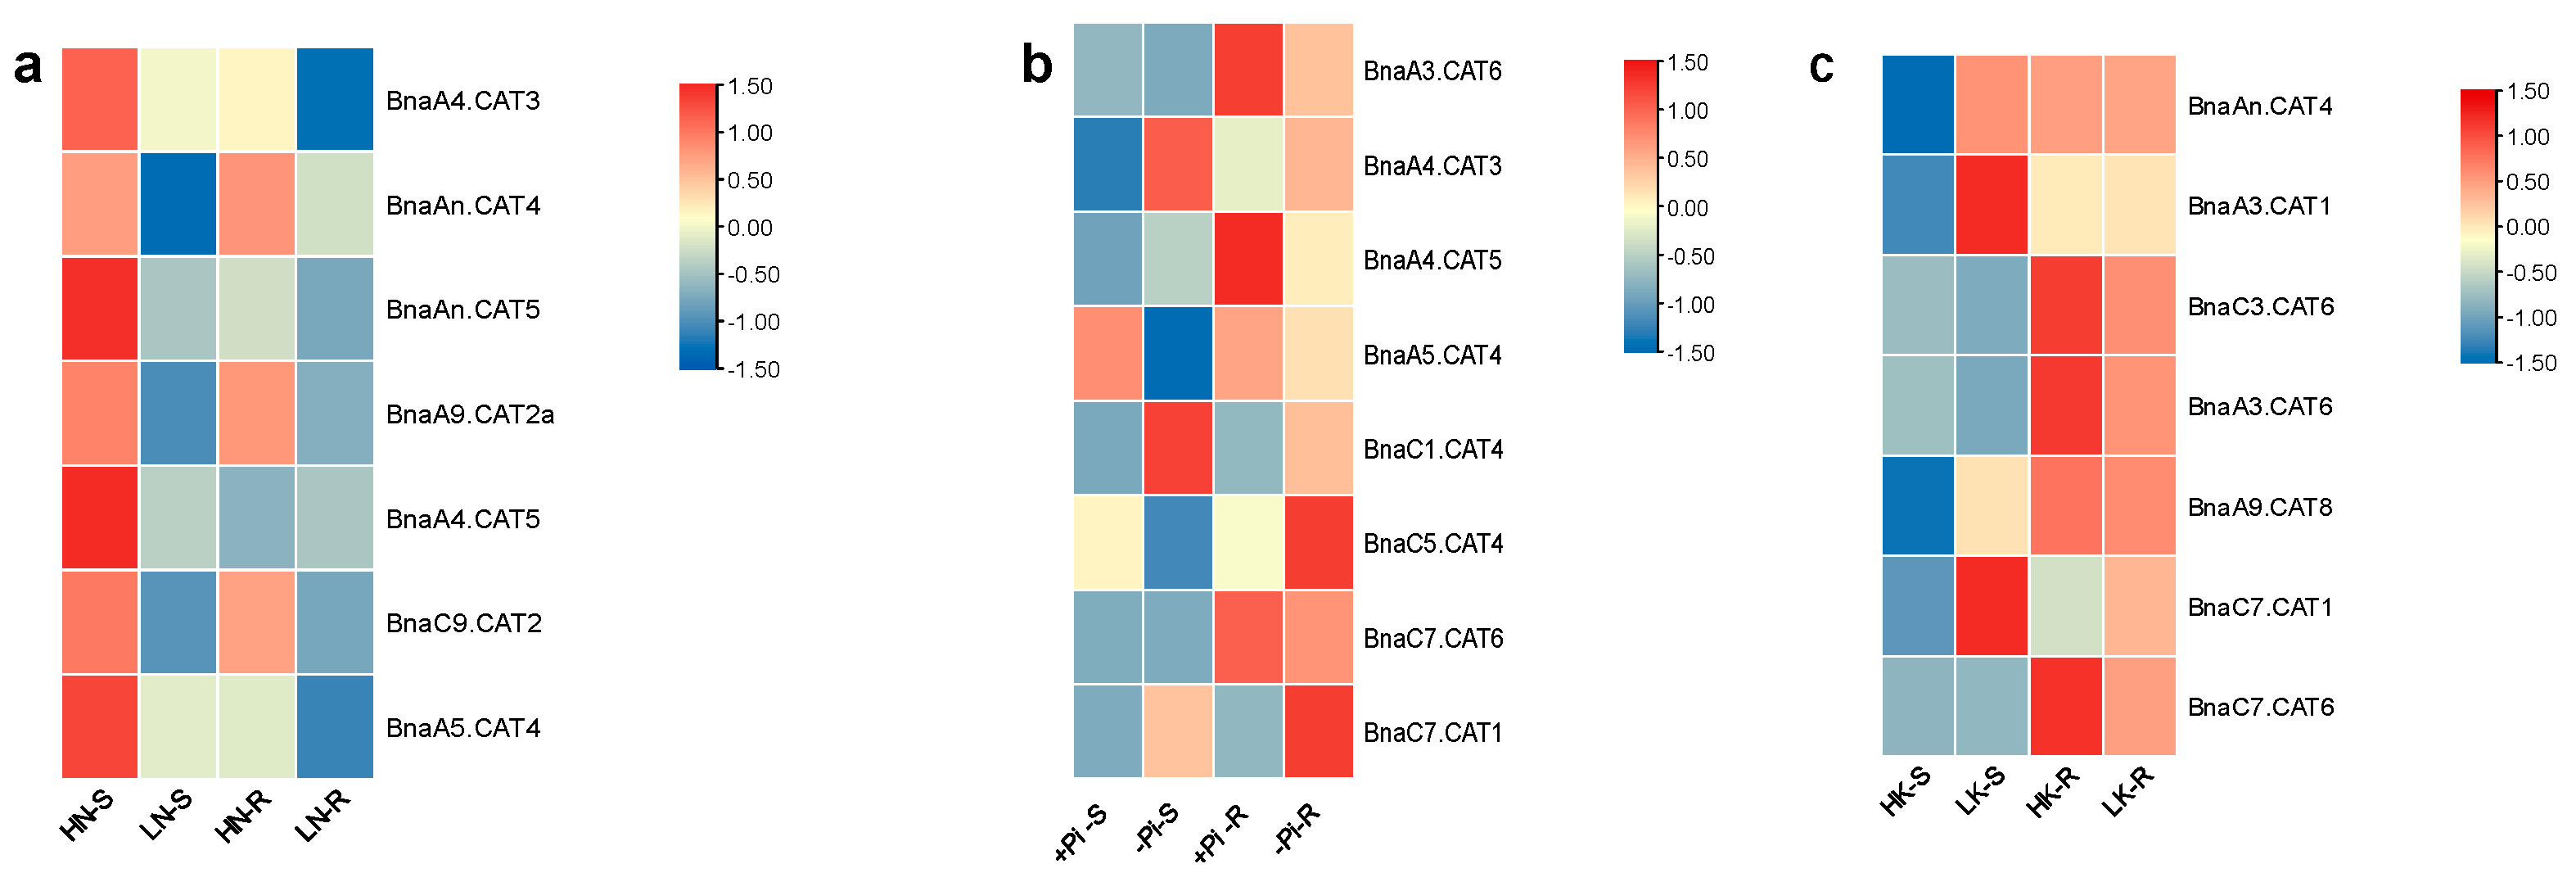
The transcriptional identification of the core CAT members was significant for the further understanding the functions of BnaCATs. The high yield of rapeseed is contingent upon the extensive application of nitrogen fertilizer, yet N use efficiency is low [23]. When N supply is insufficient, plants typically exhibit a suite of adaptive responses to limited N growth conditions [24]. However, the molecular mechanisms underlying the use of N by plants are not fully understood [25]. The transcript levels of BnaCATs after low-N treatment were investigated to gain a deeper understanding of their role in assimilating N. Under N stress, the expression of seven BnaCATs was found to be significantly altered in the shoots and roots. Six BnaCATs (BnaA4.CAT3, BnaAn.CAT4, BnaAn.CAT5, BnaA9.CAT2a, BnaC9.CAT2, and BnaA5.CAT4) exhibited a significant downregulation in both shoots and roots (Figure 7a). In the context of nitrate limitation, the expression of BnaA4.CAT5 was downregulated in the shoots, while it was induced in the roots (Figure 7a). It can be observed that BnaA4.CAT5 was the sole gene to exhibit induction in the root under nitrogen deficiency conditions.
Phosphorus (P) is a vital nutrient element for crop growth, occupying a unique and indispensable position in agricultural production [26]. In conditions of phosphate limitation, a total of eight differentially expressed genes (DEGs) were identified in the shoots or roots (Figure 7b). In the shoots, no differential expression of BnaA3.CAT6 and BnaC7.CAT6 was observed between sufficient phosphate and insufficient phosphate conditions (Figure 7b). The expression of four BnaCATs (BnaA4.CAT3, BnaA4.CAT5, BnaC1.CAT4 and BnaC7.CAT1) was markedly elevated in the shoots in response to limited phosphate, whereas the expressions of BnaA5.CAT4 and BnaC5.CAT4 were significantly repressed (Figure 7b).
No differential expression of BnaA5.CAT4 was observed in the roots between sufficient and insufficient phosphate conditions (Figure 7b). Under phosphate limitation conditions, the expressions of BnaA3.CAT6, BnaA4.CAT5 and BnaC7.CAT6 were distinctly downregulated, while BnaA4.CAT3, BnaC5.CAT4 and BnaC7.CAT1 exhibited higher expression levels (Figure 7b).
Potassium (K) is an important macronutrient in plants [27]. Potassium enhances crop resistance to a variety of biological and abiotic stresses [28,29]. Under the condition of low potassium treatment, the expressions of BnaC3.CAT6 and BnaA3.CAT6 were significantly decreased but the expressions of five, especially BnaA3.CAT1 and BnaC7.CAT1, clearly increased in the shoots (Figure 7c). In the roots, K deficiency resulted in an increase in the expressions of BnaA3.CAT1 and BnaC7.CAT1, especially the expression of BnaC7.CAT1, significantly increased, while the expression levels of other genes decreased (Figure 7c).
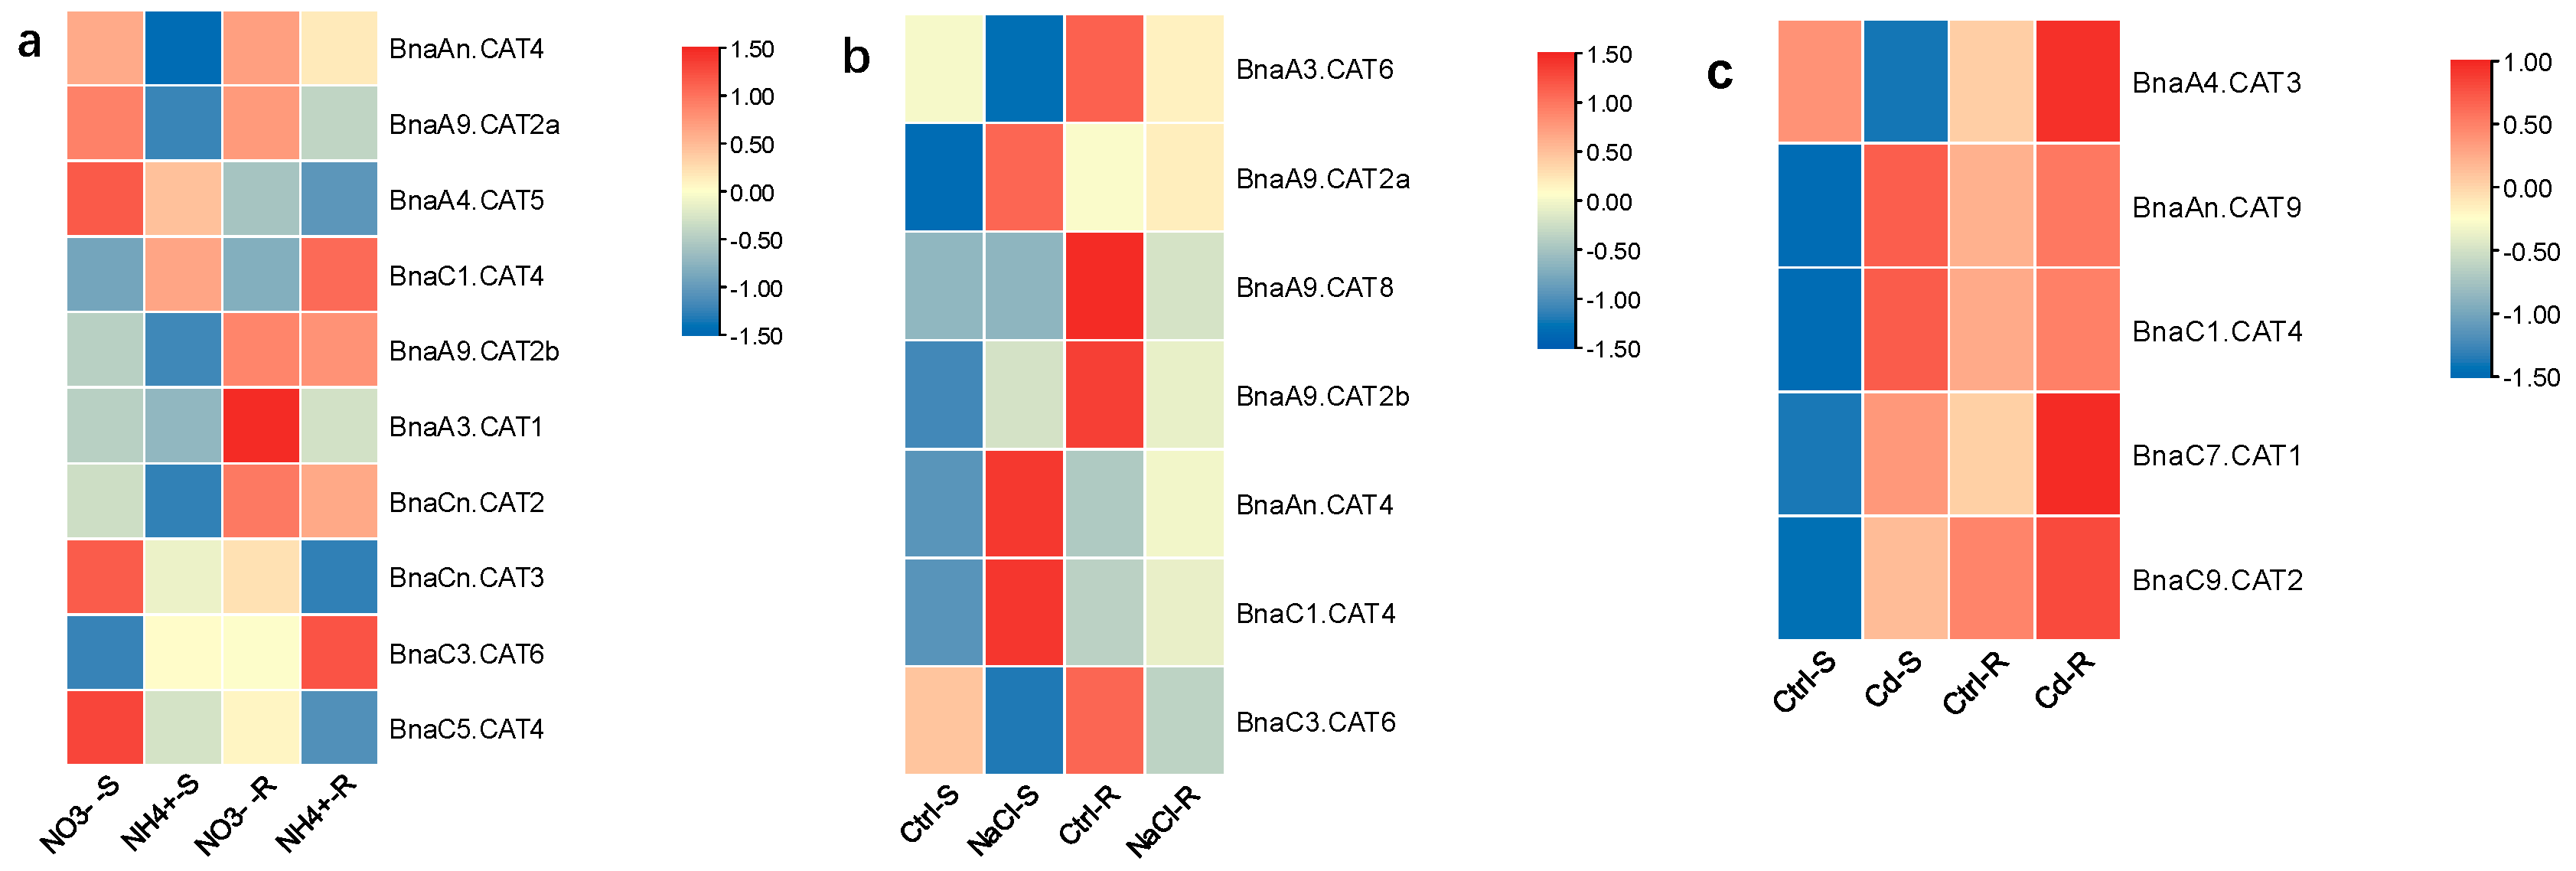
In the shoots, we identified that the DEGs of only BnaC1.CAT4 and BnaC3.CAT6 showed higher expression levels under ammonium toxicity than under nitrate sufficiency (Figure 8a), while the DEGs of other BnaCATs were significantly downregulated only when ammonium was supplied as the sole N nutrient source (Figure 8a). In the roots, the expressions of most family members (BnaAn.CAT4, BnaA9.CAT2a, BnaA4.CAT5, BnaA3.CAT1, BnaCn.CAT2, BnaCn.CAT3, and BnaC5.CAT4) were obviously suppressed only when ammonium was supplied as the sole N nutrient source, whereas the DEGs of BnaC1.CAT4 and BnaC3.CAT6 were distinctly upregulated (Figure 8a). It is worth noting that the expression of BnaC1.CAT4 and BnaC3.CAT6 was consistently induced in both the shoots and roots (Figure 8a).
Salt stress will induce accumulation of misfolded or unfolded proteins in plants to inhibit their normal growth and development [30]. Salt altered the expression of seven BnaCATs in the roots and shoots. Under salt stress, BnaA3.CAT6 and BnaC3.CAT6 were obviously downregulated in both roots and shoots (Figure 8b) whereas BnaAn.CAT4 and BnaC1.CAT4 were induced in both the shoots and roots (Figure 8b). BnaA9.CAT8 showed no significant difference in the shoots but it was significantly downregulated in the roots (Figure 8b). BnaA9.CAT2b was significantly induced in the shoots but significantly downregulated in the roots (Figure 8b). BnaA9.CAT2a showed no significant difference in the roots but was obviously upregulated in the shoots (Figure 8b).
Cadmium (Cd) is known as one of the most hazardous elements in the environment and is a persistent soil constraint toxic to all flora and fauna [31]. To better understand the role of rapeseed CATs in response to cadmium toxicity, we analyzed their transcriptional expression under cadmium toxicity. Under cadmium toxicity, the expression of four BnaCATs (BnaAn.CAT9, BnaC1.CAT4, BnaC7.CAT1, and BnaC9.CAT2) was elevated in both shoots and roots. Moreover, the expression of BnaA4.CAT3 was distinctly suppressed in the shoots but induced in the roots (Figure 8c).

3. Discussion

CAT family members have been reported to play an important role in plant growth and development, nutrient metabolism and stress resistance [32]. CATs are widely present in organisms, playing essential roles in regulating plant growth, development and responses to environmental stimuli [33]. In A. thaliana, AtCAT1, AtCAT2 and AtCAT3 control ROS homeostasis by catalyzing H2O2 decomposition. AtCAT1 expression is regulated by ABA and MAPK pathways [34], while AtCAT2 is primarily expressed in leaves and is responsive to light, low temperature and circadian rhythms. AtCAT3 is highly expressed across developmental stages and is involved in ABA-mediated stomatal regulation [35]. In Oryza sativa, OsCATA and OsCATC are stress responsive; their overexpression enhances drought tolerance, and OsCATC phosphorylation by STRK1 improves both salt and oxidative stress tolerance [36]. Similarly, CAT in Nicotiana tabacum and Ipomoea batatas contribute to H2O2 homeostasis and stress response [37]. Heterologous expression of CATs can further enhance plant stress tolerance; for instance, wheat CAT expression in rice increases cold tolerance [38], and maize CAT2 expression in tobacco enhances pathogen resistance [14]. CAT members have also been widely studied in other species. For example, CATs had nine members (CAT1–CAT9) in A. thaliana, and each AAP member only had a single copy. There were totals of 11 CATs in rice [39], 19 CATs in soybean [40], 12 CATs in maize [41], 9 CATs in potato [42] and 31 CATs in wheat [43]. However, the information about Brassicaceae CATs is limited so far. In this study, 22 CATs were identified in B. napus. We used bioinformatics methods to analyze the physical and chemical properties, structure and function of proteins encoded by the BnaCATs family. Subsequently, we performed conserved domain, gene structure, gene phylogeny, promoter and synteny analyses. Furthermore, we constructed their protein–protein interaction network. Furthermore, differential expressions of BnaCATs under different nutrient conditions were analyzed. These results might provide an integrated insight into the functions of the CAT family.
From the analysis on the proteins encoded by the BnaCAT family, we found that the subcellular localization of proteins encoded by the BnaCAT family is mainly in plasma membranes (Table S1). All proteins encoded by BnaCATs contain 13–15 transmembrane regions, which may be closely related to the regulation of amino acid absorption and transport by the BnaCATs (Table S1, Figure S1). The secondary and three-dimensional structures of the BnaCAT family genes showed that the secondary structure of proteins encoded by the BnaCAT family genes consists of α -helix, extending chain, β-fold, and random coil elements. These results suggested that the BnaCATs may have high similarity in function (Table S2, Figure S4).
According to phylogenetic analysis, 22 BnaCATs were classified into four groups (Figure 1). These results are consistent with previously reported findings in Arabidopsis, tea, and tomato [18,44]. Motifs of CAT genes clustered in the same clade were very close, including the number and type (Figure 4). However, different subgroups contained different conserved motifs. Therefore, we speculated that different types of unique motifs may be the main cause of BnaCATs functional differentiation.
In the present study, a total of 22 BnaCATs (12 on A-subgenome and 10 on C-subgenome) were identified in the rapeseed genome (Table 1). The collinearity results showed that there were a large number of collinearity relationships among BnaCATs, and genome-wide replication events/fragment replication may be the main cause of BnaCATs gene family amplification. Comparative genomics studies have shown that Brassica species, such as B. rapa and B. oleracea, experienced triploid events at the genomic level about 20 million years ago [45,46]. As a result, there are three copies of each A. thaliana gene in B. rapa and B. oleracea. Nine CATs were identified in the A. thaliana genome (Table 1). Theoretically, 27 CATs should be included in B. rapa and B. oleracea after complete genome replication, but only 13 genes were found in B. oleracea genome. B. napus originates from spontaneous hybridization of the diploid B. rapa (ArAr, 2n = 2x = 20) and B. oleracea (CoCo, 2n = 2x = 18) [15,16,17]. Therefore, there should be six homologous genes for each Arabidopsis gene in Brassica napus. Unlike conventional theory, only 22 BnaCATs were identified in this study, indicating that some CATs were lost after whole genome replication. Therefore, we speculated that CATs underwent strong selection during the evolution of B. napus, and the retained CATs should have an important function in B. napus. Most of the AtCATs in B. napus had more than one and less than six direct homologous genes, suggesting that the CATs gene family has expanded but contracted during the diversification of B. napus. In addition, the homologous genes of AtCAT7s were not found in the genome of Brassica napus. The lost CATs may be redundant genes that are gradually replaced by other genes with similar functions [47,48]. This research also revealed that all CATs in B. napus may have undergone rigorous purification selection, which plays a key role in maintaining gene numbers.
Analyzing cis-elements in promoter sequences is extremely important for understanding genes regulation and function [21]. This research revealed that the BnaCAT family members contained many cis-regulatory elements related to phytohormone responsive (ABRE, P-box, TCA-element, TGA-element) (Figure 5). In detail, the content of ABRE is the highest, the number of P-box is lowest (Figure 5). It can be speculated that the BnaCATs may be involved in hormone metabolism and regulation. It has been reported that the amino acid transporters can be transported and regulated by hormones [49,50,51]. Furthermore, cis-regulatory elements related to stress response (ARE, MBS, LTR, TC-rich repeats, and WUN-motif) can be found in most of BnaCAT family members. Some studies indicated that amino acid transporters expression levels were affected by abiotic or biotic factors such as N, salt and drought stress [52,53]. These findings indicated that CATs were involved in stress tolerance, especially ABA-mediated biological processes.
We investigated the tissue-specific pattern of BnaCATs through BnIR. BnaA9.CAT8, BnaC8.CAT8, and BnaAn.CAT9 are widely expressed in most tissues, suggesting that these BnaCATs that remained after WGD events are likely functional (Figure S5).
AtCAT8 in Arabidopsis has been reported to provide amino acids to library tissues and participates in early seedling development, and it is widely expressed in all kinds of tissues [7,9]. BnaA9.CAT8, BnaC8.CAT8, and BnaAn.CAT9 showed high expression in various tissues, suggesting that they might play important roles in the transfer of amino acids to library tissues (Figure S5). Most of B. napus grain nitrogen originates from senescing leaves [53,54,55] and is transported through phloem transport. As a result, phloem loading and transport of amino acids is particularly important for seed yield and quality. It has been reported that AtAAP8 was mainly expressed in the phloem of the source leaf and located on the plasma membrane of the cell. It is mainly involved in amino acid loading in phloem and nitrogen distribution in source to sink, and then affects the growth of source leaf and seed yield [55]. PtCAT11 was mainly expressed in phloem and played an important role in amino acid transport between “source” and “sink” tissues during leaf senescence [56]. Our research found that BnaC7.CAT1, BnaA3.CAT1, BnaA9.CAT2a, BnaCn.CAT2, BnaCn.CAT3 and BnaA5.CAT4 (Figure S5) were highly expressed in senescing leaves. Therefore, we speculated that these genes might be responsible for transport of removable amino acids from source tissues to sink grains for protein synthesis after anthesis.
In order to determine the role of member BnaCATs in various stresses, the expression patterns of BnaCATs were studied. Seven BnaCATs were altered in the upper and lower parts of allotetraploid rapeseed seedlings after N stress. It has been reported in apple that CATs were upregulated with the time of nitrogen starvation treatment, and reached the maximum value at 12 h of treatment. And CAT was closely related to nitrogen nutrition and may be involved in N metabolism [32]. However, most of the genes in our study were downregulated. We suspected that the amount of gene expression may be closely related to the timing and processing of sampling. In the roots and shoots, many BnaCATs were influenced by P stress, while seven BnaCATs were differentially expressed in response to K insufficiency.
As the main source of inorganic N in plants, ammonium can promote plant growth at low exogenous levels, but can cause toxicity at high exogenous levels [57]. In this study, we found that the expressions of some BnaCATs were altered in response to ammonium toxicity, especially BnaC3.CAT6, which indicated BnaCATs play an important role in reducing the harm of excessive ammonia to rape plants. The majority of cadmium-responsive BnaCATs, except BnaA4.CAT3, were induced in both shoots and roots under cadmium toxicity than under the cadmium-free condition. We proposed that the enhanced expression of BnaCATs might contribute to efficient amino acid transport and further facilitate the biosynthesis of cadmium chelators [58]. Consequently, it enhances the resistance of plants to cadmium toxicity. Furthermore, the expressions of some genes in shoot increased obviously under salt stress, and might be associated with salt stress.
In addition, this research investigated how some BnaCATs were simultaneously responsive to diverse stresses. For example, the expressions of BnaAn.CAT4 and BnaC1.CAT4 were affected by four stresses in the shoots or roots simultaneously. Moreover, several BnaCATs were involved in three or two stress signals in both roots and shoots of B. napus. However, some genes are regulated by a single stress. Thus, our studies suggested that some BnaCATs played key roles in responses to various stresses and some were only particular to a specific stress. These all need our further verification.

4. Conclusions

Cationic amino acid transporters play key roles in the growth and development of plants. In this study, we identified 22 BnaCATs, 13 BolCATs, 13 BraCATs and 9 AtCATs genes via genome-wide analysis. The whole-genome replication or segmental replication was the major driving force of BnaCATs evolution. We presented an overview of the chromosomal distributions, gene structures, conserved motifs, cis-element, and phylogeny in BnaCATs. The transcriptome analysis of BnaCATs provides insights for their diverse roles in Brassica napus growth and development, especially in nitrate uptake regulation. In summary, our research presented here can serve as useful resources for understanding the structure–function relationship of BnaCAT members and reveal regulation mechanisms underlying nutrient stress resistance in the BnaCAT family.

5. Materials and Methods

5.1. Identification of Members of the CAT Gene Family

To identify genome-wide BnaCATs, predicted proteins from the B. napus genomic database were searched by HMMER v3 using the hidden Markov model (HMM) file that corresponded to the amino acid permease domain (PF13520.8) downloaded from the Pfam database (http://pfam.xfam.org/, accessed on 10 August 2024) as a query [59].The obtained protein sequences had an expected value (E) < 1 × 10⁻²⁰ and contained the amino acid permease domain. Then, we used TBtools to extract our sequence and simplify the ID. Using the amino acid sequences of Arabidopsis CATs as source sequences, we built the evolutionary tree with the amino acid sequences of B. napus to identify our sequences. In this study, we retrieved the CAT sequences using the following databases: The Arabidopsis Information Resource (TAIR10, https://www.arabidopsis.org/, accessed on 10 August 2024) for A. thaliana and the Brassica Database (BRAD) v. 4.1 (http://brassicadb.org/brad/, accessed on 14 August 2024) for B. napus [60].

5.2. Gene Nomenclature of CATs in B. napus

In this study, according to the nomenclature previously reported [61], we renamed CATs in Brassica species based on the following criterion: genus (one capital letter) + plant species (two lowercase letters) + chromosome (followed by a period) + name of the CAT homologs in A. thaliana. For example, BnaA8.CAT1 represents an Arabidopsis CAT1 homolog on the chromosome A8 of B. napus.

5.3. Multiple Sequence Alignment and Phylogeny Analysis of BnaCATs

To analyze the evolutionary relationships, 22 BnaCATs and 9 AtCATs amino acid residues were aligned via the ClustalW program in MEGA 10.2.2 with default settings. A neighbor-joining tree was then constructed based on the alignment results, and the Interactive Tree of Life (iTOLv5) online tool (https://itol.embl.de/, accessed on 12 August 2024) was finally used to polish the NJ-tree [57].

5.4. Molecular Characterization of BnaCATs

The molecular weight (MW, kD), isoelectric point (pI), grand average of hydropathy (GRAVY) and instability index (II) of BnaCATs were calculated by the ProtParam tool in ExPASy Server (https://web.expasy.org/protparam/, accessed on 13 August 2024) [58]. To characterize the transmembrane helices of AtCATs and BnaCATs, we submitted their amino acid sequences to the TMHMM v. 2.0 (http://www.cbs.dtu.dk/services/TMHMM/, accessed on 14 August 2024) program. We employed the online SignalP v. 4.1 (http://www.cbs.dtu.dk/services/SignalP/, accessed on 15 August 2024) [60] to predict the presence of signal peptides in the amino acid sequences of BnaCATs. We used the STRING (Search Tool for Recurring Instances of Neighboring Genes) v 11.0 (https://string-db.org, accessed on 14 August 2024) [61] web-server to retrieve and display the repeatedly occurring association networks, including direct (physical) and indirect (function) association, of the CAT proteins in A. thaliana and B. napus.

5.5. Analysis of Evolutionary Selection Pressure and Functional Divergence of BnaCATs

To determine positive or negative (purifying) selection pressures on BnaCATs, we calculated the values of Ka, Ks and Ka/Ks. First, we performed pairwise alignment of the BnaCAT-AtCAT CDS in an Excel spreadsheet. Then, we submitted the paired CDS sequence to TBtools for the calculation of Ka and Ks [62]. According to Darwin’s evolution theory, Ka/Ks > 1.0 means positive selection, Ka/Ks < 1.0 indicates purifying selection, and Ka/Ks = 1.0 denotes neutral selection. Furthermore, we calculated the divergence time of BnaCATs from their progenitors by the following formula: T = Ks/2λ; λ = 1.5 × 10⁻⁸ for Brassicaceae species [63].

5.6. Chromosomal Distribution and Gene Duplication

We used “One Step MCScanX” of TBtools to analyze CATs duplication events with genome sequences and gff3 files. The syntenic analysis maps of orthologous CATs were constructed using the Dual Systeny Plotter software V2.119 (https://github.com/CJ-Chen/TBtools, accessed on 14 August 2024) [63].

5.7. Protein Motif, Gene Structure, and Cis-Element Analyses

The conserved motifs of BnaCATs were identified by the MEME Suite web server [63] (v4.12.0, http://meme-suite.org/, accessed on 15 August 2024). The number of motifs was set to 15, and all other parameters were the default ones. The gene structure and conserved domain were visualized via TBtools [59].
The 2000 bp upstream DNA sequence of the 5-UTR of the BnaCATs was selected as the promoter sequence. The promoter sequences were uploaded to the PlantCare database (http://bioinformatics.psb.ugent.be/webtools/plantcare/html/, accessed on 15 August 2024) to scan for cis-elements. The cis-elements from the PlantCare database were subsequently screened manually. The cis-elements were visualized via TBtools [59].

5.8. Transcriptional Analysis of BnaCATs Under Diverse Nutrient Stresses

We used the BnIR online website (http://yanglab.hzau.edu.cn/BnIR, accessed on 15 August 2024) to analyze the tissue-specific expression of CATs in B. napus. RNA-seq sequencing libraries were used to sequence via the Illumina HiSeq Xten system (Illumina, San Diego, CA, USA). To identify DEGs (differential expression genes) between two different samples, the expression level of each transcript was calculated according to the transcripts per million reads (TPM) method. RSEM (http://deweylab.github.io/RSEM/, accessed on 1 October 2024) [64] was used to quantify gene abundances. Essentially, differential expression analysis was performed using the DESeq2 [65] or DEGseq [66]. DEGs with |log2FC| ≥ 1 and FDR< 0.05 (DESeq2) or FDR < 0.001 (DEGseq) were considered to be significantly different expressed genes.

5.9. Plant Materials and Treatments

The B. napus seedlings (ZS11) were germinated in this experiment. Firstly, full-sized oilseed rape seeds were selected and sterilized for 10 min with 1% NaClO, washed with ultrapure water, soaked overnight at 4 °C and sown on seedling trays. After germination, uniform 7-day-old rape seedlings were transplanted into black plastic containers with 10 L of Hochler. The basic nutrition solution contained 1.0 mM KH2PO4, 5.0 mM KNO3, 5.0 mM Ca(NO3)2·4H2O, 2.0 mM MgSO4·7H2O, 0.050 mM EDTA-Fe, 9.0 μM MnCl2·4H2O, 0.80 μM ZnSO4·7H2O, 0.30 μM CuSO4·5H2O, 0.10 μM Na2MoO4·2H2O and 46 μM H3BO3.
The rapeseed seedlings were cultivated for 10 days (d) in a chamber under the following conditions: light intensity of 300–320 μmol m−2 s−1, temperature of 25 °C daytime/22 °C night, light period of 16 h photoperiod/8 h dark and relative humidity of 70%. For the low-nitrate treatment, the 7-day-old uniform B. napus seedlings after germination were hydroponically cultivated under high (6.0 mM) nitrate for 10 d, and then were transferred into low (0.30 mM) nitrate solution for 3 d until sampling.
For the ammonium (NH4+) toxicity treatment, the 7-day-old uniform B. napus seedlings after seed germination were hydroponically cultivated under high nitrate (6.0 mM) for 10 d, and then were transferred to N-free conditions for 3 d. Finally, the above seedlings were sampled after exposure to 9.0 mM ammonium for 3 d until sampling.
For the inorganic phosphate (Pi) starvation treatment, the 7-day-old uniform B. napus seedlings after seed germination were first hydroponically grown under 250 μM phosphate (KH2PO4) for 10 d, and then were transferred to 5 μM phosphate for 3 d until sampling.
For the potassium deficiency treatment, the 7-day-old uniform rapeseed seedlings after seed germination were hydroponically cultivated under high (6.0 mM) potassium for 10 d and then were transferred to low (0.05 mM) potassium for 3 d until sampling.
For the salt stress treatment, the 7-day-old uniform B. napus seedlings after seed germination were hydroponically cultivated in a NaCl-free solution for 10 d, and were subsequently transferred to 200 mM NaCl for 1 d until sampling.
For the cadmium (Cd) toxicity treatment, the 7-day-old uniform B. napus seedlings after seed germination were hydroponically cultivated in a Cd-free solution for 10 d, and then were grown under 10 μM CdCl2 for 1 d until sampling.

Supplementary Materials

The following supporting information can be downloaded at: https://www.mdpi.com/article/10.3390/ijms252312658/s1.

Author Contributions

All authors contributed to the study’s conception and design. X.-Q.D., K.-L.Z. and Y.-P.H. conceptualized the project, and T.Z. were responsible for acquiring the funding. S.-S.S., L.Z. and Y.-N.F. analyzed the data. X.-Q.D. and K.-L.Z. performed the experiments. T.Z., X.-Q.D. and K.-L.Z. wrote the original manuscript. Y.-P.H. and T.Z. reviewed and edited the manuscript. All authors have read and agreed to the published version of the manuscript.

Funding

This work was financially supported by the National Natural Science Foundation of China (42407019 and 32470396) and the Natural Science Foundation of Henan Province (242300421309).

Institutional Review Board Statement

Not applicable.

Informed Consent Statement

Not applicable.

Data Availability Statement

All the data and plant materials in relation to this work can be obtained through contacting with the corresponding author Dr. Ying-Peng Hua (yingpenghua@zzu.edu.cn).

Conflicts of Interest

The authors declare no conflict of interest.

References

  1. Raza, A.; Su, W.; Gao, A.; Mehmood, S.S.; Hussain, M.A.; Nie, W.; Lv, Y.; Zou, X.; Zhang, X. Catalase (CAT) Gene Family in Rapeseed (Brassica napus L.): Genome-Wide Analysis, Identification, and Expression Pattern in Response to Multiple Hormones and Abiotic Stress Conditions. Int. J. Mol. Sci. 2021, 22, 4281. [Google Scholar] [CrossRef] [PubMed]
  2. Sarcheshmeh, M.K.; Abedi, A.; Aalami, A. Genome-wide survey of catalase genes in Brassica rapa, Brassica oleracea, and Brassica napus: Identification, characterization, molecular evolution, and expression profiling of BnCATs in response to salt and cadmium stress. Protoplasma 2023, 260, 899–917. [Google Scholar] [CrossRef]
  3. Yang, G.; Wei, Q.; Huang, H.; Xia, J. Amino Acid Transporters in Plant Cells: A Brief Review. Plants 2020, 9, 967. [Google Scholar] [CrossRef]
  4. Duan, Y.; Zhu, X.; Shen, J.; Xing, H.; Zou, Z.; Ma, Y.; Wang, Y.; Fang, W. Genome-wide identification, characterization and expression analysis of the amino acid permease gene family in tea plants (Camellia sinensis). Genomics 2020, 112, 2866–2874. [Google Scholar] [CrossRef]
  5. Frommer, W.B.; Hummel, S.; Riesmeier, J.W. Expression cloning in yeast of a cDNA encoding a broad specificity amino acid permease from Arabidopsis thaliana. Proc. Natl. Acad. Sci. USA 1993, 90, 5944–5948. [Google Scholar] [CrossRef] [PubMed]
  6. Wipf, D.; Ludewig, U.; Tegeder, M.; Rentsch, D.; Koch, W.; Frommer, W.B. Conservation of amino acid transporters in fungi, plants and animals. Trends Biochem. Sci. 2002, 27, 139–147. [Google Scholar] [CrossRef] [PubMed]
  7. Yang, H.; Postel, S.; Kemmerling, B.; Ludewig, U. Altered growth and improved resistance of Arabidopsis against Pseudomonas syringae by overexpression of the basic amino acid transporter AtCAT1. Plant Cell Environ. 2014, 37, 1404–1414. [Google Scholar] [CrossRef]
  8. Yang, H.; Krebs, M.; Stierhof, Y.D.; Ludewig, U. Characterization of the putative amino acid transporter genes AtCAT2, 3 &4: The tonoplast localized AtCAT2 regulates soluble leaf amino acids. J. Plant Physiol. 2014, 171, 594–601. [Google Scholar]
  9. Su, Y.H.; Frommer, W.B.; Ludewig, U. Molecular and functional characterization of a family of amino acid transporters from Arabidopsis. Plant Physiol. 2004, 136, 3104–3113. [Google Scholar] [CrossRef]
  10. Yang, Y.; Yang, L.; Li, Z. Molecular cloning and identification of a putative tomato cationic amino acid transporter-2 gene that is highly expressed in stamens. Plant Cell Tissue Organ Cult. 2013, 112, 55–63. [Google Scholar] [CrossRef]
  11. Zhang, Y.; Zheng, L.; Yun, L.; Ji, L.; Li, G.; Ji, M.; Shi, Y.; Zheng, X. Catalase (CAT) Gene Family in Wheat (Triticum aestivum L.): Evolution, Expression Pattern and Function Analysis. Int. J. Mol. Sci. 2022, 23, 542. [Google Scholar] [CrossRef] [PubMed]
  12. Aleem, M.; Aleem, S.; Sharif, I.; Aleem, M.; Shahzad, R.; Khan, M.I.; Batool, A.; Sarwar, G.; Farooq, J.; Iqbal, A.; et al. Whole-Genome Identification of APX and CAT Gene Families in Cultivated and Wild Soybeans and Their Regulatory Function in Plant Development and Stress Response. Antioxidants 2022, 11, 1626. [Google Scholar] [CrossRef]
  13. Hu, L.; Yang, Y.; Jiang, L.; Liu, S. The catalase gene family in cucumber: Genome-wide identification and organization. Genet. Mol. Biol. 2016, 39, 408–415. [Google Scholar] [CrossRef]
  14. Polidoros, A.N.; Mylona, P.V.; Scandalios, J.G. Transgenic tobacco plants expressing the maize Cat2 gene have altered catalase levels that affect plant-pathogen interactions and resistance to oxidative stress. Transgenic Res. 2001, 10, 555–569. [Google Scholar] [CrossRef]
  15. Hammes, U.Z.; Nielsen, E.; Honaas, L.A.; Taylor, C.G.; Schachtman, D.P. AtCAT6, a sink-tissue-localized transporter for essential amino acids in Arabidopsis. Plant J. 2006, 48, 414–426. [Google Scholar] [CrossRef] [PubMed]
  16. Yang, H.; Stierhof, Y.D.; Ludewig, U. The putative Cationic Amino Acid Transporter 9 is targeted to vesicles and may be involved in plant amino acid homeostasis. Front. Plant Sci. 2015, 6, 212. [Google Scholar] [CrossRef] [PubMed]
  17. Bayer, P.E.; Hurgobin, B.; Golicz, A.A.; Chan, C.K.; Yuan, Y.; Lee, H.; Renton, M.; Meng, J.; Li, R.; Long, Y.; et al. Assembly and comparison of two closely related Brassica napus genomes. Plant Biotechnol. J. 2017, 15, 1602–1610. [Google Scholar] [CrossRef] [PubMed]
  18. Chalhoub, B.; Denoeud, F.; Liu, S.; Parkin, I.A.; Tang, H.; Wang, X.; Chiquet, J.; Belcram, H.; Tong, C.; Samans, B.; et al. Plant genetics. Early allopolyploid evolution in the post-Neolithic Brassica napus oilseed genome. Science 2014, 345, 950–953. [Google Scholar] [CrossRef]
  19. Sun, F.; Fan, G.; Hu, Q.; Zhou, Y.; Guan, M.; Tong, C.; Li, J.; Du, D.; Qi, C.; Jiang, L.; et al. The high-quality genome of Brassica napus cultivar ‘ZS11’ reveals the introgression history in semi-winter morphotype. Plant J. 2017, 92, 452–468. [Google Scholar] [CrossRef]
  20. Ding, X.; Li, J.; Pan, Y.; Zhang, Y.; Ni, L.; Wang, Y.; Zhang, X. Genome-Wide Identification and Expression Analysis of the UGlcAE Gene Family in Tomato. Int. J. Mol. Sci. 2018, 19, 1583. [Google Scholar] [CrossRef]
  21. Verma, D.; Lakhanpal, N.; Singh, K. Genome-wide identification and characterization of abiotic-stress responsive SOD (superoxide dismutase) gene family in Brassica juncea and B. rapa. BMC Genomics 2019, 20, 227. [Google Scholar] [CrossRef] [PubMed]
  22. Zhang, Z.H.; Zhou, T.; Liao, Q.; Yao, J.Y.; Liang, G.H.; Song, H.X.; Guan, C.Y.; Hua, Y.P. Integrated physiologic, genomic and transcriptomic strategies involving the adaptation of allotetraploid rapeseed to nitrogen limitation. BMC Plant Biol. 2018, 18, 322. [Google Scholar] [CrossRef]
  23. Ding, L.; Wang, K.J.; Jiang, G.M.; Biswas, D.K.; Xu, H.; Li, L.F.; Li, Y.H. Effects of nitrogen deficiency on photosynthetic traits of maize hybrids released in different years. Ann. Bot. 2005, 96, 925–930. [Google Scholar] [CrossRef]
  24. Zheng, L.W.; Ma, S.J.; Zhou, T.; Yue, C.P.; Hua, Y.P.; Huang, J.Y. Genome-wide identification of Brassicaceae B-BOX genes and molecular characterization of their transcriptional responses to various nutrient stresses in allotetraploid rapeseed. BMC Plant Biol. 2021, 21, 288. [Google Scholar] [CrossRef] [PubMed]
  25. Gan, H.; Jiao, Y.; Jia, J.; Wang, X.; Li, H.; Shi, W.; Peng, C.; Polle, A.; Luo, Z.B. Phosphorus and nitrogen physiology of two contrasting poplar genotypes when exposed to phosphorus and/or nitrogen starvation. Tree Physiol. 2016, 36, 22–38. [Google Scholar] [CrossRef]
  26. Amrutha, R.N.; Sekhar, P.N.; Varshney, R.K.; Kishor, P.B.K. Genome-wide analysis and identification of genes related to potassium transporter families in rice (Oryza sativa L.). Plant Sci. 2007, 172, 708–721. [Google Scholar] [CrossRef]
  27. Ashley, M.K.; Grant, M.; Grabov, A. Plant responses to potassium deficiencies: A role for potassium transport proteins. J. Exp. Bot. 2006, 57, 425–436. [Google Scholar] [CrossRef] [PubMed]
  28. He, J.; Zhuang, Y.; Li, C.; Sun, X.; Zhao, S.; Ma, C.; Lin, H.; Zhou, H. SIMP1 modulates salt tolerance by elevating ERAD efficiency through UMP1A-mediated proteasome maturation in plants. New Phytol. 2021, 232, 625–641. [Google Scholar] [CrossRef]
  29. Zhang, Y.; Chao, J.; Li, X.; Zhang, C.; Khan, R.; Du, S.; Xu, N.; Song, L.; Liu, H.; Shi, Y. Comparative transcriptome combined with biochemical and physiological analyses provide new insights toward cadmium accumulation with two contrasting Nicotiana species. Physiol. Plant. 2021, 173, 369–383. [Google Scholar]
  30. Zhao, H.; Ma, H.; Yu, L.; Wang, X.; Zhao, J. Genome-wide survey and expression analysis of amino acid transporter gene family in rice (Oryza sativa L.). PLoS ONE 2012, 7, e49210. [Google Scholar] [CrossRef]
  31. Cheng, L.; Yuan, H.Y.; Ren, R.; Zhao, S.Q.; Han, Y.P.; Zhou, Q.Y.; Ke, D.X.; Wang, Y.X.; Wang, L. Genome-Wide Identification, Classification, and Expression Analysis of Amino Acid Transporter Gene Family in Glycine Max. Front. Plant Sci. 2016, 7, 515. [Google Scholar] [CrossRef] [PubMed]
  32. Liu, H.; Wu, M.; Zhu, D.; Pan, F.; Wang, Y.; Wang, Y.; Xiang, Y. Genome-Wide analysis of the AAAP gene family in moso bamboo (Phyllostachys edulis). BMC Plant Biol. 2017, 17, 29. [Google Scholar] [CrossRef] [PubMed]
  33. Zhou, Y.-B.; Liu, C.; Tang, D.-Y.; Yan, L.; Wang, D.; Yang, Y.-Z.; Gui, J.-S.; Zhao, X.-Y.; Li, L.-G.; Tang, X.-D.; et al. The Receptor-Like Cytoplasmic Kinase STRK1 Phosphorylates and Activates CatC, Thereby Regulating H2O2 Homeostasis and Improving Salt Tolerance in Rice. Plant Cell 2018, 30, 1100–1118. [Google Scholar] [CrossRef] [PubMed]
  34. Du, Y.-Y.; Wang, P.; Chen, J.; Song, C.-P. Comprehensive Functional Analysis of the Catalase Gene Family in Arabidopsis thaliana. J. Integr. Plant Biol. 2008, 50, 1318–1326. [Google Scholar] [CrossRef]
  35. Su, T.; Wang, P.P.; Li, H.J.; Zhao, Y.W.; Lu, Y.; Dai, P.; Ren, T.Q.; Wang, X.F.; Li, X.Z.; Shao, Q.; et al. The Arabidopsis catalase triple mutant reveals important roles of catalases and peroxisome-derived signaling in plant development. J. Integr. Plant Biol. 2018, 60, 591–607. [Google Scholar] [CrossRef]
  36. Schmidt, R.; Mieulet, D.; Hubberten, H.-M.; Obata, T.; Hoefgen, R.; Fernie, A.R.; Fisahn, J.; Segundo, B.S.; Guiderdoni, E.; Schippers, J.H.M.; et al. SALT-RESPONSIVE ERF1 Regulates Reactive Oxygen Species-Dependent Signaling during the Initial Response to Salt Stress in Rice. Plant Cell 2013, 25, 2115–2131. [Google Scholar] [CrossRef]
  37. Willekens, H.; Villarroel, R.; Van Montagu, M.; Inzé, D.; Van Camp, W. Molecular identification of catalases from Nicotianaplumbaginifolia (L.). FEBS Lett. 1994, 352, 79–83. [Google Scholar] [CrossRef]
  38. Matsumura, T.; Tabayashi, N.; Kamagata, Y.; Souma, C.; Saruyama, H. Wheat catalase expressed in transgenic rice can improve tolerance against low temperature stress. Physiol. Plant. 2002, 116, 317–327. [Google Scholar] [CrossRef]
  39. Ma, H.; Cao, X.; Shi, S.; Li, S.; Gao, J.; Ma, Y.; Zhao, Q.; Chen, Q. Genome-wide survey and expression analysis of the amino acid transporter superfamily in potato (Solanum tuberosum L.). Plant Physiol. Biochem. 2016, 107, 164–177. [Google Scholar] [CrossRef]
  40. Wan, Y.; King, R.; Mitchell, R.A.C.; Hassani-Pak, K.; Hawkesford, M.J. Spatiotemporal expression patterns of wheat amino acid transporters reveal their putative roles in nitrogen transport and responses to abiotic stress. Sci. Rep. 2017, 7, 5461. [Google Scholar] [CrossRef]
  41. Wu, X.M.; Kou, S.J.; Liu, Y.L.; Fang, Y.N.; Xu, Q.; Guo, W.W. Genomewide analysis of small RNAs in nonembryogenic and embryogenic tissues of citrus: microRNA- and siRNA-mediated transcript cleavage involved in somatic embryogenesis. Plant Biotechnol. J. 2015, 13, 383–394. [Google Scholar] [CrossRef] [PubMed]
  42. Aan den Toorn, M.; Albrecht, C.; de Vries, S. On the Origin of SERKs: Bioinformatics Analysis of the Somatic Embryogenesis Receptor Kinases. Mol. Plant 2015, 8, 762–782. [Google Scholar] [CrossRef] [PubMed]
  43. Lynch, M.; Conery, J.S. The evolutionary fate and consequences of duplicate genes. Science 2000, 290, 1151–1155. [Google Scholar] [CrossRef] [PubMed]
  44. Krouk, G.; Lacombe, B.; Bielach, A.; Perrine-Walker, F.; Malinska, K.; Mounier, E.; Hoyerova, K.; Tillard, P.; Leon, S.; Ljung, K.; et al. Nitrate-regulated auxin transport by NRT1.1 defines a mechanism for nutrient sensing in plants. Dev. Cell 2010, 18, 927–937. [Google Scholar] [CrossRef] [PubMed]
  45. Lee, B.R.; Zhang, Q.; Bae, D.W.; Kim, T.H. Pod removal responsive change in phytohormones and its impact on protein degradation and amino acid transport in source leaves of Brassica napus. Plant Physiol. Biochem. 2016, 106, 159–164. [Google Scholar] [CrossRef]
  46. Shin, K.; Lee, S.; Song, W.Y.; Lee, R.A.; Lee, I.; Ha, K.; Koo, J.C.; Park, S.K.; Nam, H.G.; Lee, Y.; et al. Genetic identification of ACC-RESISTANT2 reveals involvement of LYSINE HISTIDINE TRANSPORTER1 in the uptake of 1-aminocyclopropane-1-carboxylic acid in Arabidopsis thaliana. Plant Cell Physiol. 2015, 56, 572–582. [Google Scholar] [CrossRef]
  47. Perchlik, M.; Tegeder, M. Improving Plant Nitrogen Use Efficiency through Alteration of Amino Acid Transport Processes. Plant Physiol. 2017, 175, 235–247. [Google Scholar] [CrossRef]
  48. Pratelli, R.; Pilot, G. Regulation of amino acid metabolic enzymes and transporters in plants. J. Exp. Bot. 2014, 65, 5535–5556. [Google Scholar] [CrossRef]
  49. Avice, J.C.; Etienne, P. Leaf senescence and nitrogen remobilization efficiency in oilseed rape (Brassica napus L.). J. Exp. Bot. 2014, 65, 3813–3824. [Google Scholar] [CrossRef]
  50. Santiago, J.P.; Tegeder, M. Connecting Source with Sink: The Role of Arabidopsis AAP8 in Phloem Loading of Amino Acids. Plant Physiol. 2016, 171, 508–521. [Google Scholar] [CrossRef]
  51. Couturier, J.; Doidy, J.; Guinet, F.; Wipf, D.; Blaudez, D.; Chalot, M. Glutamine, arginine and the amino acid transporter Pt-CAT11 play important roles during senescence in poplar. Ann. Bot. 2010, 105, 1159–1169. [Google Scholar] [PubMed]
  52. Liu, Y.; von Wirén, N. Ammonium as a signal for physiological and morphological responses in plants. J. Exp. Bot. 2017, 68, 2581–2592. [Google Scholar]
  53. Sun, S.K.; Xu, X.; Tang, Z.; Tang, Z.; Huang, X.Y.; Wirtz, M.; Hell, R.; Zhao, F.J. A molecular switch in sulfur metabolism to reduce arsenic and enrich selenium in rice grain. Nat. Commun. 2021, 12, 1392. [Google Scholar]
  54. El-Gebali, S.; Mistry, J.; Bateman, A.; Eddy, S.R.; Luciani, A.; Potter, S.C.; Qureshi, M.; Richardson, L.J.; Salazar, G.A.; Smart, A.; et al. The Pfam protein families database in 2019. Nucleic Acids Res. 2019, 47, D427–D432. [Google Scholar]
  55. Wang, X.; Wu, J.; Liang, J.; Cheng, F.; Wang, X. Brassica database (BRAD) version 2.0: Integrating and mining Brassicaceae species genomic resources. Database 2015, 2015, bav093. [Google Scholar]
  56. Ostergaard, L.; King, G.J. Standardized gene nomenclature for the Brassica genus. Plant Methods 2008, 4, 10. [Google Scholar]
  57. Su, D.; Xiang, W.; Wen, L.; Lu, W.; Shi, Y.; Liu, Y.; Li, Z. Genome-wide identification, characterization and expression analysis of BES1 gene family in tomato. BMC Plant Biol. 2021, 21, 161. [Google Scholar]
  58. Wilkins, M.R.; Gasteiger, E.; Bairoch, A.; Sanchez, J.C.; Williams, K.L.; Appel, R.D.; Hochstrasser, D.F. Protein identification and analysis tools in the ExPASy server. Methods Mol. Biol. 1999, 112, 531–552. [Google Scholar]
  59. Chen, C.; Chen, H.; Zhang, Y.; Thomas, H.R.; Frank, M.H.; He, Y.; Xia, R. TBtools: An Integrative Toolkit Developed for Interactive Analyses of Big Biological Data. Mol. Plant 2020, 13, 1194–1202. [Google Scholar] [CrossRef]
  60. Petersen, T.N.; Brunak, S.; von Heijne, G.; Nielsen, H. SignalP 4.0: Discriminating signal peptides from transmembrane regions. Nat. Methods 2011, 8, 785–786. [Google Scholar] [CrossRef]
  61. Szklarczyk, D.; Gable, A.L.; Lyon, D.; Junge, A.; Wyder, S.; Huerta-Cepas, J.; Simonovic, M.; Doncheva, N.T.; Morris, J.H.; Bork, P.; et al. STRING v11: Protein-protein association networks with increased coverage, supporting functional discovery in genome-wide experimental datasets. Nucleic Acids Res. 2019, 47, D607–D613. [Google Scholar] [CrossRef] [PubMed]
  62. Blanc, G.; Wolfe, K.H. Widespread paleopolyploidy in model plant species inferred from age distributions of duplicate genes. Plant Cell 2004, 16, 1667–1678. [Google Scholar] [CrossRef] [PubMed]
  63. Bailey, T.L.; Boden, M.; Buske, F.A.; Frith, M.; Grant, C.E.; Clementi, L.; Ren, J.; Li, W.W.; Noble, W.S. MEME SUITE: Tools for motif discovery and searching. Nucleic Acids Res. 2009, 37, W202–W208. [Google Scholar] [CrossRef] [PubMed]
  64. Li, B.; Dewey, C.N. RSEM: Accurate transcript quantification from RNA-Seq data with or without a reference genome. BMC Bioinform. 2011, 12, 323. [Google Scholar] [CrossRef] [PubMed]
  65. Love, M.I.; Huber, W.; Anders, S. Moderated estimation of fold change and dispersion for RNA-seq data with DESeq2. Genome Biol. 2014, 15, 550. [Google Scholar] [CrossRef]
  66. Wang, L.; Feng, Z.; Wang, X.; Wang, X.; Zhang, X. DEGseq: An R package for identifying differentially expressed genes from RNA-seq data. Bioinformatics 2009, 26, 136–138. [Google Scholar] [CrossRef]
Figure 1. Phylogeny analysis of the cationic amino acid transporters (CATs) in Arabidopsis thaliana and Brassica napus. The CAT protein sequences were multi-aligned using the ClustalW program, and then an unrooted phylogenetic tree was constructed using MEGA 10.2.2 with the neighbor-joining method. Overall, 11 BnaCATs from B. napus and 9 AtCATs from A. thaliana were clustered into four groups (Group I–IV) based on high bootstrap values signified with different background colors.
Ijms 25 12658 g001
Figure 2. Chromosomal distribution and interchromosomal relationships of B. napus NLP. The inner-species collinearity of BnaCATs. Gray lines indicate all syntenic blocks in the B. napus genome, and the red lines indicate the duplicated BnaCATs pairs. The number in the gray box area is the chromosome number.
Ijms 25 12658 g002
Figure 3. Syntenic CAT pairs between B. napus and three other plant species, including A. thaliana, B. oleracea, and B. rapa. Gray lines indicate all the collinear blocks in the genome, and the red lines indicate the syntenic CATs pairs.
Ijms 25 12658 g003aIjms 25 12658 g003b
Figure 4. Phylogenetic relationships, architecture of conserved protein motifs and gene structure in BnaCATs. (a) A phylogenetic tree based on the BnaCAT sequences. According to phylogenetic relationships, 22 BnCATs were clustered into four groups (I–IV) and are represented with different colors. (b) The motif composition of BnaCATs. Different colored boxes display different motifs. (c) The exon–intron structure of BnaCATs. Green boxes indicate UTR regions, yellow boxes indicate exons, blackish-grey lines indicate introns. The bottom scale shows the protein length.
Ijms 25 12658 g004
Figure 5. Cis-elements that are related to different stress and hormone responses in the putative promoters of BnaCATs. Cis-elements with similar functions are displayed in the same color. Different color boxes show different identified cis-elements.
Ijms 25 12658 g005
Figure 6. Protein–protein interaction networks of the cationic amino acid transporter (CAT) proteins in B. napus. The interaction networks of the CAT1 (a), CAT2 (b), CAT3 (c) CAT4 (d), CAT5 (e), CAT6 (f), CAT7 (g), CAT8 (h) and CAT9 (i) and other proteins were constructed using the STRING web-server.
Ijms 25 12658 g006
Figure 7. The expression patterns of BnaCATs under different N, P and K levels. Expression analysis of BnaCATs in the shoots (S) and roots (R) of rapeseed plants grown under different nutrient stresses. Chart legend indicates the values of log2(fold-change). (a) HN, high nitrogen (N); LN, low N; (b) +Pi, add phosphorus; −Pi, lack phosphorus; (c) HK, high potassium; LK, low K.
Ijms 25 12658 g007
Figure 8. The expression patterns of BnaCATs under different nitrogen regimes, salt and Cd toxicity. (a) Expression analysis of BnaCATs in shoot and root under nitrate sufficiency (NO3−) and ammonium toxicity (NH4+). (b) Expression analysis of BnaCATs in root and shoot under salt toxicity (NaCl) and salt-free (Ctrl) conditions. (c) Expression analysis of BnaCATs in root and shoot under Cd toxicity (Cd) and Cd-free (Ctrl) conditions.
Ijms 25 12658 g008
Table 1. Copy number of the Cationic amino acid transporters (CATs) in Arabidopsis and three Brassica species.
Gene NameArabidopsis thaliana
(125 Mb)
Brassica rapa (465 Mb)Brassica oleracea
(485 Mb)
Brassica napus (1130 Mb)
CAT11224
CAT21224
CAT31112
CAT41224
CAT51112
CAT61223
CAT71110
CAT81112
CAT91111
Total9131322
Table 2. Molecular characterization of the cationic amino acid transporters (CATs) in Arabidopsis thaliana and Brassica napus.
Gene IDGene NameBlockAmino Acids
(aa)
CDS (bp)KaKsKa/KsDivergent Times
(Mya)
BnaC07g36580DBnaC7.CAT1U59517880.0650.490.1316.56
BnaC03g64380DBnaC3.CAT1U59817970.0760.500.1516.91
BnaA03g58530DBnaA3.CAT1U59617910.0630.480.1316.07
AT1G58030.1AtCAT2D6351908
BnaA09g12110DBnaA9.CAT2aD63819170.0560.460.1215.37
BnaA09g53040DBnaA9.CAT2bD63419050.0560.430.1214.46
BnaCnng25140DBnaCn.CAT2D63419050.0560.430.1314.42
BnaC09g12080DBnaC9.CAT2D63919200.0570.430.1314.64
AT5G36940.1AtCAT3S6091830
BnaCnng50730DBnaCn.CAT3S63619110.0640.360.1712.07
BnaA04g07800DBnaA4.CAT3S63218990.0670.360.1812.05
AT3G03720.2AtCAT4F6001803
BnaC01g40540DBnaC1.CAT4F60418150.0460.340.1311.51
BnaA05g32770DBnaA5.CAT4F61418450.0460.330.1411.12
BnaC05g48070DBnaC5.CAT4F61318420.0460.330.1411.02
BnaAnng23630DBnaAn.CAT4F60418150.0420.340.1211.52
AT2G34960.1AtCAT5J5691710
BnaAnng19530DBnaAn.CAT5J57017130.0450.550.0818.61
BnaA04g20450DBnaA4.CAT5J57117160.0460.550.0818.35
AT5G04770.1AtCAT6R5831752
BnaA03g01440DBnaA3.CAT6R52915900.0360.590.06119.86
BnaC03g01740DBnaC3.CAT6R52915900.0360.530.06717.98
BnaC07g34120DBnaC7.CAT6R58017430.422.140.1971.58
AT1G17120.1AtCAT8A5901773
BnaC08g37970DBnaC8.CAT8A58617610.0410.750.05425.29
BnaA09g45150DBnaA9.CAT8A58617610.0370.680.05422.92
AT1G05940.1AtCAT9A5691710
BnaAnng20490DBnaAn.CAT9A57117160.0370.270.139.23
Disclaimer/Publisher’s Note: The statements, opinions and data contained in all publications are solely those of the individual author(s) and contributor(s) and not of MDPI and/or the editor(s). MDPI and/or the editor(s) disclaim responsibility for any injury to people or property resulting from any ideas, methods, instructions or products referred to in the content.