Article

The Role of Glutamate Metabolism and the GABA Shunt in Bypassing the Tricarboxylic Acid Cycle in the Light

by
Alexander T. Eprintsev
1,
Galina B. Anokhina
1,
Zakhar N. Shakhov
1,
Polina P. Moskvina
1 and
Abir U. Igamberdiev
2,*
1
Department of Biochemistry and Cell Physiology, Voronezh State University, 394018 Voronezh, Russia
2
Department of Biology, Memorial University of Newfoundland, St. John’s, NL A1C 5S7, Canada
*
Author to whom correspondence should be addressed.
Int. J. Mol. Sci. 2024, 25(23), 12711; https://doi.org/10.3390/ijms252312711
Submission received: 8 October 2024 / Revised: 18 November 2024 / Accepted: 24 November 2024 / Published: 26 November 2024
(This article belongs to the Section Molecular Plant Sciences)

Abstract

:
Glutamate is an essential amino acid in both the energy and biosynthetic processes in plant cells. The aim of this work was to study changes in glutamate metabolism upon irradiation of maize (Zea mays L.) leaves with light of different spectral compositions, as well as to identify mechanisms regulating the work of enzymes involved in the studied process. A study was conducted of light-induced changes in glutamate metabolism in maize leaves, mediated by redirecting the glutamate flow to the γ-aminobutyric acid (GABA) shunt. Glutamate dehydrogenase (GDH) was more active in darkness, and the irradiation by red light inhibited the expression of both the Gdh1 and Gdh2 genes. EGTA and ruthenium red abolished the effects of light, indicating the participation of Ca2+ ions in phytochrome signal transduction. Contrary to GDH, glutamate decarboxylase (GAD) activity was moderately higher in the light, stimulated by red light, while far-red light reversed the effect. The effect of light on Gad expression was more pronounced than on GAD activity. Irradiation by red light also resulted in the increase in activity of GABA transaminase (GTA), which was abolished by far-red light. The third enzyme of the GABA shunt, succinic semialdehyde dehydrogenase (SSADH), was also activated by light. The effect of light on the expression of Ssadh1, but not on Ssadh2, was phytochrome-dependent. It is concluded that irradiation by light shifts glutamate metabolism from GDH to GAD with the activation of GABA transaminase and SSADH. This suggests that the GABA pathway plays a role in the maintenance of the tricarboxylic acid cycle in the light via bypassing its reactions when the 2-oxoglutarate dehydrogenase complex is inhibited and the cycle switches to the open mode.

1. Introduction

The transitions from darkness to light and changes in light intensity are fundamental for the survival of plants. The ability to perceive light of different wavelengths and intensities activates several signal transduction pathways, which in turn regulate plant growth, physiology, morphology, and immunity [1]. In addition, photosynthetic reactions themselves regulate biochemical mechanisms in plant tissues [2]. This is evidenced by the fact that in Arabidopsis and other studied plants, a number of genes are transcriptionally induced by circadian rhythms [3]. Higher plants possess several families of photoreceptors that can detect light ranging from UVB to far-red [4,5]. Due to the differences in the light spectrum, intensity, direction, and photoperiod, a number of photoreceptors, including phytochrome, cryptochrome, and phototropin, have evolved to adapt plants to different light conditions [6]. Functional specialization within photoreceptor families led to the emergence of photoreceptors that are capable of detecting light over a wide range of wavelengths and intensities. Genetic and photobiological studies conducted on A. thaliana plants have shown that these light sensors mediate numerous adaptive responses (e.g., phototropism and shade avoidance) and developmental transitions (e.g., germination and flowering). Some physiological responses are specialized to be triggered by a specific photoreceptor; however, often multiple photoreceptors are known to mediate a coordinated response. A. thaliana exhibits cross-responses to various environmental stressors, which may be mutually exclusive and/or substitutive, e.g., between light and temperature, or light and pathogens [1].
Phytochrome is an important class of photoreceptors that sense red and far-red light [7,8,9]. To date, five types of phytochromes have been identified in Arabidopsis (phyA, phyB, phyC, phyD, phyE), which have two photo-interconvertible forms [10,11]. Upon exposure to red light, the conformation of phytochromes allosterically changes from an inactive form that absorbs red light to an active form that absorbs far-red light. The inactive form is located in the cytosol, whereas the active form is translocated to the nucleus [10,11], where it interacts with a variety of factors to regulate the transcription of target genes and mediate subsequent photoreactions [11]. Phytochrome interacting factors (PIFs) primarily act as negative regulators of photomorphogenesis in response to light. They also regulate many pathways and processes, including anthocyanin biosynthesis, thermomorphogenesis, humoral signaling, and responses to biotic and abiotic stresses by interacting with a variety of cellular molecules [12]. In maize (Zea mays), there is evidence that the ZmPIF1 and ZmPIF3 genes can increase drought tolerance by causing stomatal closure [13,14]. In the PIF4 mutant of Arabidopsis, hypocotyl growth is insensitive to high temperatures, indicating a key role of AtPIF4 in thermoresponsive plant growth. Thus, PIF is considered a hub for the integration of environmental and hormonal signaling pathways [12].
The scheme of light signal transduction with the participation of phytochromes can be represented as follows [15,16,17]:
Reception of light quanta by phytochrome chromoproteins → conformational
transformations of phytochrome → opening/closing of ion channels including Ca2+
channels → translocation of chromoproteins into the nucleus → interaction of
chromoproteins with transcription factors with their subsequent interaction with
genes → activation/inhibition of gene transcription → biological effect
The physiological action of phytochrome spans the cytoplasm and the nucleus. In the cytoplasm, red light controls Ca2+ transport and its absorption by the cell [18]. Among the transport systems that maintain a constant level of Ca2+ in the cell, Ca2+-ATPase is under the control of phytochrome. Light causes conformational changes in phytochrome molecules, which, moving into the nucleus, cause the activation of ATP-dependent calcium channels, which results in Ca2+ movement from the cytoplasm to the nucleus. In addition, an increase in the Ca2+ concentration regulates the cGMP level [19]. Phytochrome controls the cGMP content in the cytoplasm via guanylate cyclase [20]. Ca2+ acts as a secondary messenger—an information carrier—thus being located between the receptor and reactive parts of various cell signaling systems. Calmodulins (CaMs) are proteins that are among the most common sensory proteins and are found in the apoplast, cytosol, endoplasmic reticulum, and nucleus. CaMs, with the participation of calcium, interact with various target proteins [21], which participate in various physiological processes in plant cells, including transport, cytoskeletal rearrangements, cell division, and gene expression [22,23,24].
The light-induced transition of phytochrome to the active form is caused by a change in the calcium concentration gradient due to calcium transport from the cytoplasm to the nucleus, which in turn causes a calcium–calmodulin-dependent cascade of reactions that promotes changes in the transcription of various genes, including genes for TCA cycle enzymes [17,25]. It is currently known that the activity of a number of enzyme systems is regulated with the participation of the calcium–calmodulin-dependent system. Regulation of glutamate decarboxylase (GAD) activity by calcium is carried out through the calmodulin (CaM)-binding domain. Ca2+/CaM binding eliminates dissociation of the oligomer encoded by the AtGAD1 gene. The N-terminal domain of this protein plays a key role in maintaining the oligomeric form, since the removal of the first twenty-four N-terminal residues significantly affects oligomerization due to the formation of the dimeric form of the enzyme [26]. Positive regulation by Ca2+ and CaM, as shown in the studies of Snedden et al. [27], occurs through a 2.4-fold stimulation of Vmax and a 55% decrease in Km. Regulation by the Ca2+/CaM-coupled system may reflect the need for rapid modulation of GAD in response to external signals [28]. Thus, the Ca2+/CaM-dependent system is involved in regulating the operation of the entire GABA shunt by regulating the catalytic activity of GAD [29]. The activity of several other enzymes of respiratory metabolism is regulated by phytochrome via a calcium-dependent system [25,30]. In plants, the tricarboxylic acid (TCA) cycle operation in the light is partially inhibited when the photosynthetic system takes on the main role in providing the cell with energy [31,32,33,34]. Most of the mitochondrial enzymes that participate in the TCA cycle, such as succinate dehydrogenase (EC 1.3.99.1), malate dehydrogenase (EC 1.1.1.37), aconitate hydratase (EC 4.2.1.3), citrate synthase (EC 2.3.3.1), fumarase (EC 4.2.1.2), and 2-oxoglutarate dehydrogenase (2-OGDH; EC 1.2.4.2), are more active in darkness and suppressed in the light [35,36,37,38,39,40]. The use of specific inhibitors, succinylphosphonate and carboxyethyl ether, confirmed the inhibitory effect of light on the operation of the 2-OGDH complex [41]. A decrease in the respiratory rate is associated with changes in the regulation of metabolic and signaling pathways, which leads to an imbalance of carbon–nitrogen metabolism and cellular homeostasis. The inducible changes in primary metabolism have been associated with modulations in the expression of genes belonging to amino acid biosynthesis, plant respiration, and sugar metabolism [42,43,44]. Oxidation of 2-oxoglutarate (2-OG) by the 2-OGDH complex strongly affects the distribution of TCA cycle intermediates and the operation of the γ-aminobutyric acid (GABA) shunt. The TCA cycle apparently functions in a non-cyclic manner upon the inhibition of the 2-OGDH complex during the photoperiod [31,34,41,45,46].
In illuminated leaves, the intensity of decarboxylation in the TCA cycle can decrease by up to 80%, and the decarboxylation reaction carried out by pyruvate dehydrogenase is inhibited by 30% compared to dark respiration [31]. In photosynthetic tissues, the activity of the complete citric acid cycle appears to be reduced, and the non-cyclic pathway is likely more important in illuminated leaves due to the transport of organic acids from mitochondria [34,45]. There is strong evidence that the operation of the TCA cycle in illuminated leaves provides 2-OG for ammonium assimilation and for the reactions of secondary metabolism [46,47]. The intensity of nitrogen assimilation influences respiration during the photoperiod [46]. An important role of glutamate dehydrogenase (GDH; EC 1.4.1.3) in adaptation [48] may indicate its participation in the regulation of metabolism by light. In the dark, GDH deaminates glutamate to 2-OG, which is supplied to the TCA cycle for additional energization of the cell. This pathway is essential under conditions of carbohydrate starvation during prolonged incubation of plants in the dark. The discovery of the receptors of GABA and glutamate in plants has led to greater evidence that GABA also plays a role as a signaling molecule in plants [49,50]. However, very little is known about the participation of GABA in the transmission of light signals.
Not only does the TCA cycle itself undergo significant functional changes depending on the light regime but high-intensity daylight and UV radiation are known to induce the GABA shunt activity and GABA accumulation as well [51,52]. In plants, two control points of GABA shunt regulation have been described: positive regulation of GAD by the Ca2+/CaM system in the cytoplasm and negative regulation of SSADH by ATP and NADH in mitochondria. The Ca2+/CaM-dependent system is involved in the regulation of the entire GABA shunt by affecting the catalytic activity of GAD [29]. Experiments with the mutants for the genes encoding SSADH have demonstrated the important role of this enzyme in protecting plant cells from UV rays: UV-B had the most adverse effect, while light from the photosynthetic active range had a much lower effect. UV light in mutant plants caused a rapid increase in the levels of hydrogen peroxide and reactive oxygen species [53]. It was demonstrated that blue light activates GABA transaminase in tomato [54]. There is evidence that the GABA shunt activation in illuminated leaves of higher plants is caused by a decrease in the activity of the 2-OGDH complex, and in these conditions, the GABA bypass pathway regenerates succinate via succinic semialdehyde dehydrogenase (SSADH; EC 1.2.1.24) [55]. However, there are practically no data on the direct participation of the GABA shunt enzymes in the transmission of light signals.
In the current work, we studied the regulation by light of glutamate metabolism via the phytochrome control of GDH and of the enzymes of the GABA shunt. We showed that GDH is inhibited by light via the phytochrome mechanism, while the GABA shunt is stimulated in the light, apparently compensating for the inhibition of several reactions of the TCA cycle by the increased redox level. We demonstrated the participation of phytochrome in the transduction of the light signal to the genes of GAD, GABA transaminase, and SSADH. We conclude that the GABA shunt is an important compensatory bypass mechanism not only during the adaptation to different stresses but also in the adjustment of plant respiration to light conditions.

2. Results

2.1. Glutamate Dehydrogenase Activity

The study of the influence of light and its spectral composition on the operation of GDH in maize leaves revealed that in the plants exposed to light, the total activity of the studied enzyme was more than three times lower than in the plants kept in darkness (Figure 1A). Irradiation with red light (660 nm) decreased GDH activity by several times relative to the values observed in darkness. Irradiation with far-red light (730 nm) resulted in values of GDH activity of ~60% as compared to darkness; when seedlings were irradiated sequentially with red light and far-red light, the activity remained at the level observed upon irradiation with far-red light.
Analysis of the GDH activity in the isolated maize leaf mitochondria showed a similar, although less striking, pattern of GDH inhibition in the light and upon irradiation with red light (Figure 1B). In darkness, the values of enzymatic activity were almost twice as high as in light. Maize seedlings exposed to far-red light for 15 min showed similar levels of GDH activity in mitochondria as in darkness. The inhibitory effect of red light was abolished in the sequential irradiation with red and far-red light.
The use of EGTA, a chelating agent with a high affinity for Ca2+, made it possible to identify the effect of free calcium cations on the transmission of the light signal. The treatment with EGTA resulted in the removal of the inhibitory effect of red light (Figure 1C). A similar effect as with EGTA, although less pronounced, was observed in the experiments, where ruthenium red, acting as a blocker of calcium channels, was applied (Supplementary Figure S1A).

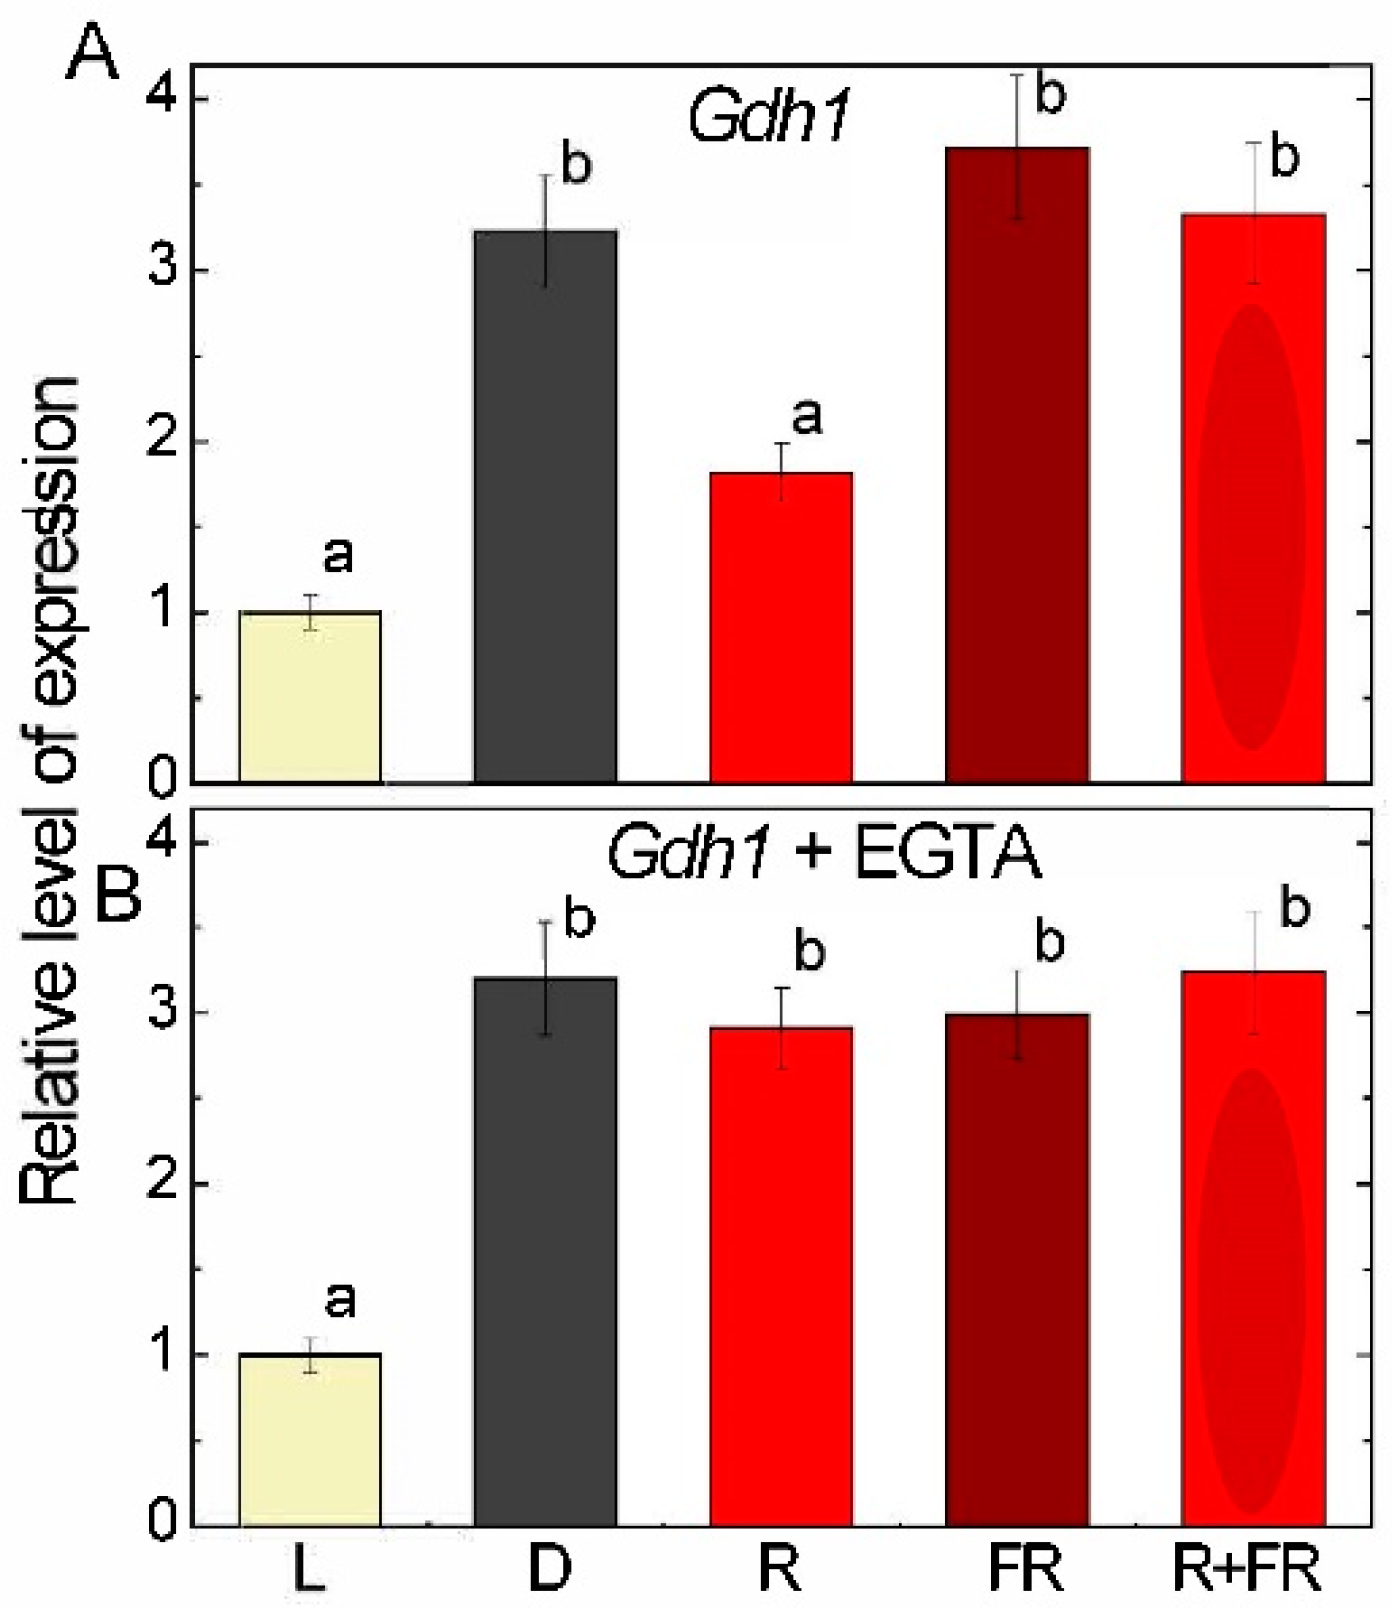
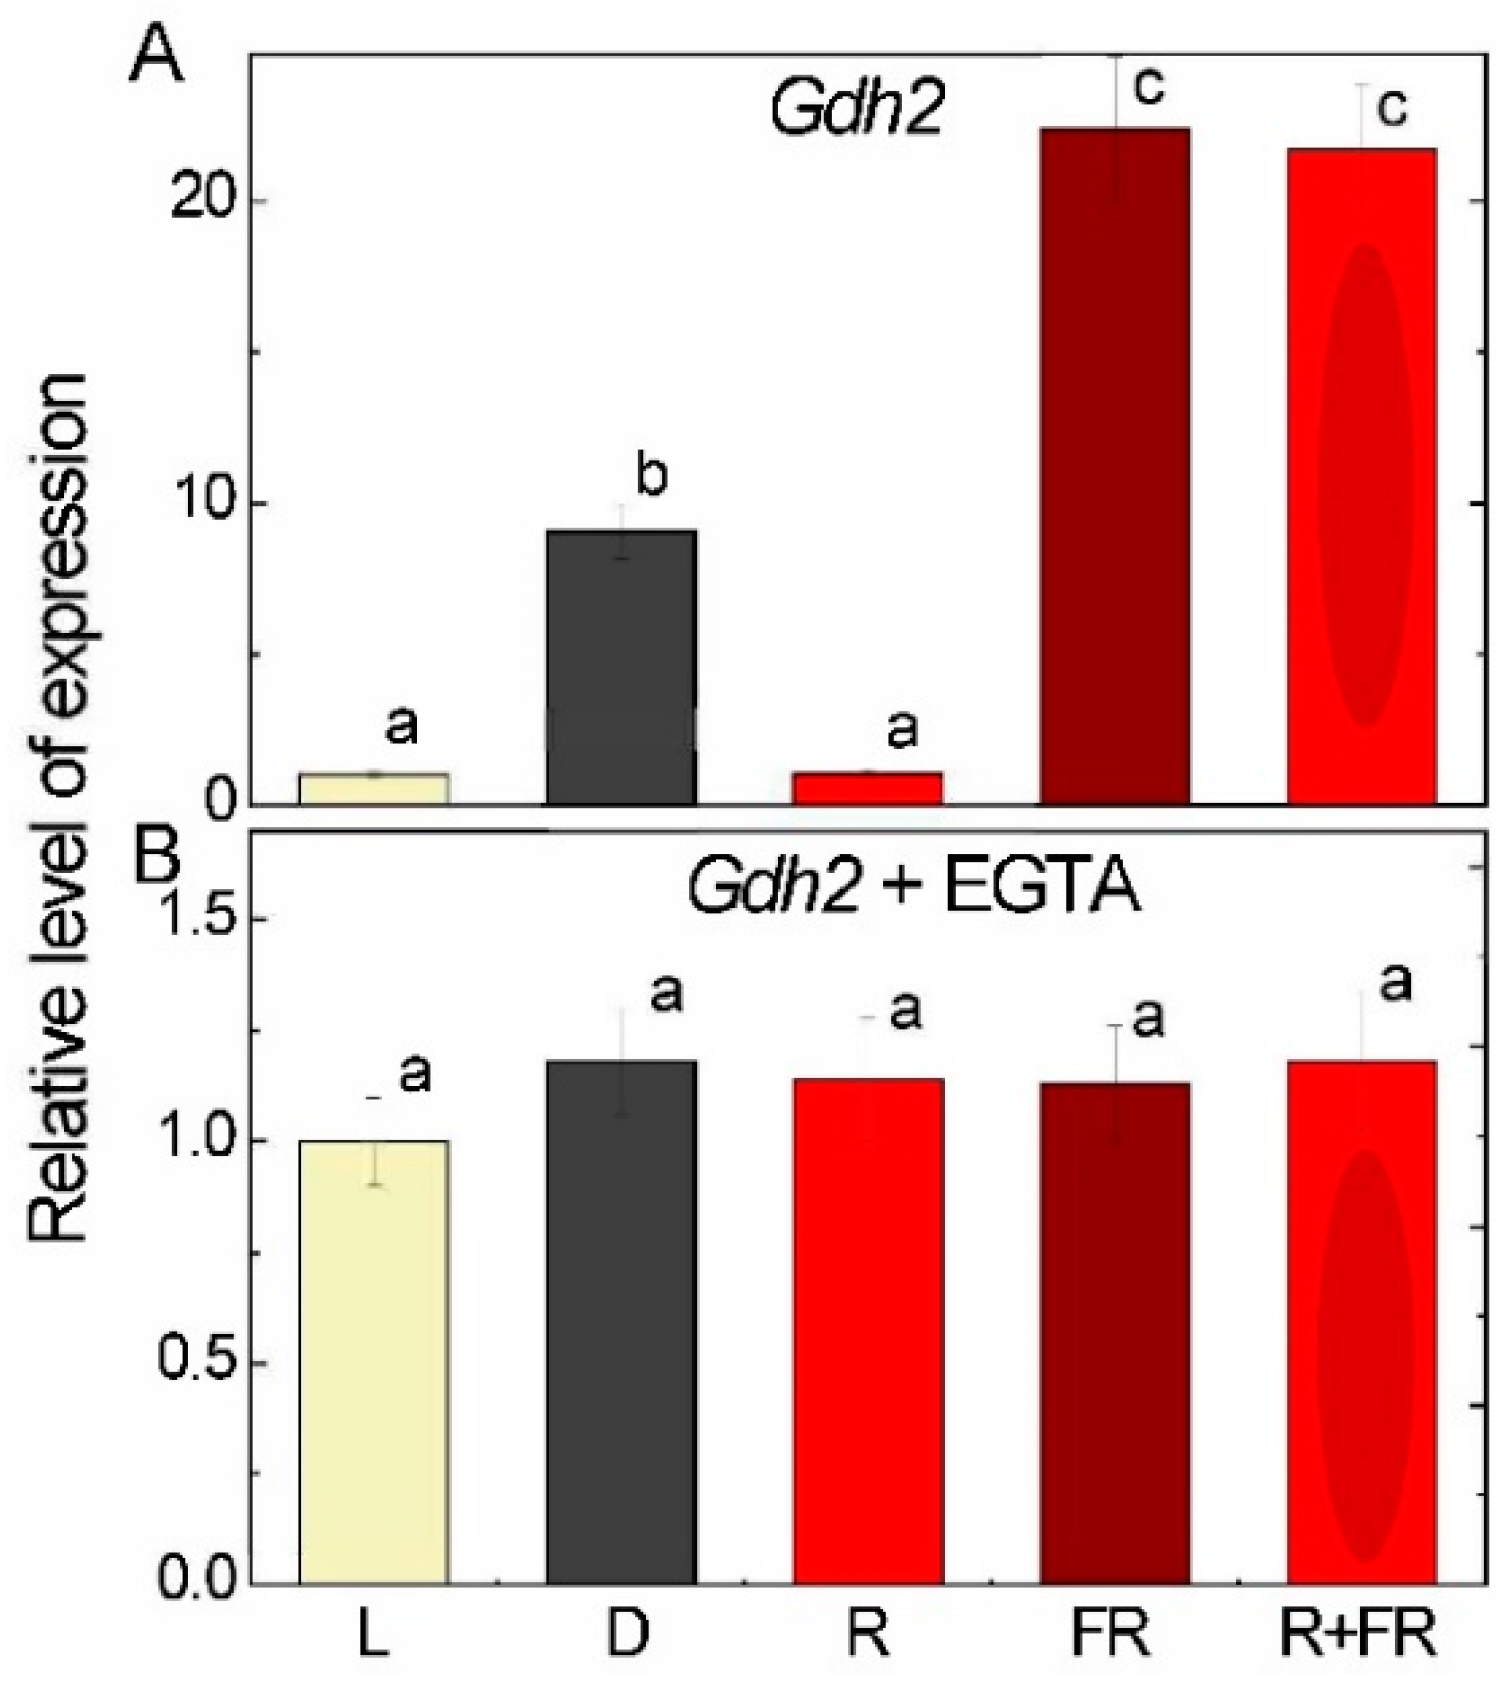
2.2. Glutamate Dehydrogenase Expression

Analysis of the relative level of transcripts of the Gdh1 gene showed a marked decrease in mRNA transcripts in the light and upon irradiation by red light as compared to darkness. Far-red light irradiation of darkened plants did not cause significant changes in the transcriptional activity of the Gdh1 (LOC542220) gene. Irradiation with far-red light after red light led to the elimination of the inhibitory effect of red light on the transcription of the Gdh1 gene (Figure 2A). The treatment with EGTA abolished the inhibitory effect of red light (Figure 2B); the same pattern was observed for the plants treated with ruthenium red (Supplementary Figure S1B).
A study on the effect of light of different wavelengths on the expression of the Gdh2 (LOC100193614) gene showed a severe inhibition of expression in the light and by irradiation of red light (Figure 3A). The levels of Gdh2 gene expression were even more than twice as high upon irradiation by far-red light than in darkness, and they exhibited the same high level when far-red light was applied after red light. The treatment with EGTA abolished the inhibitory effect of light and of the irradiation by red light (Figure 3B). A similar effect was observed when the plants were treated with ruthenium red (Supplementary Figure S1C).

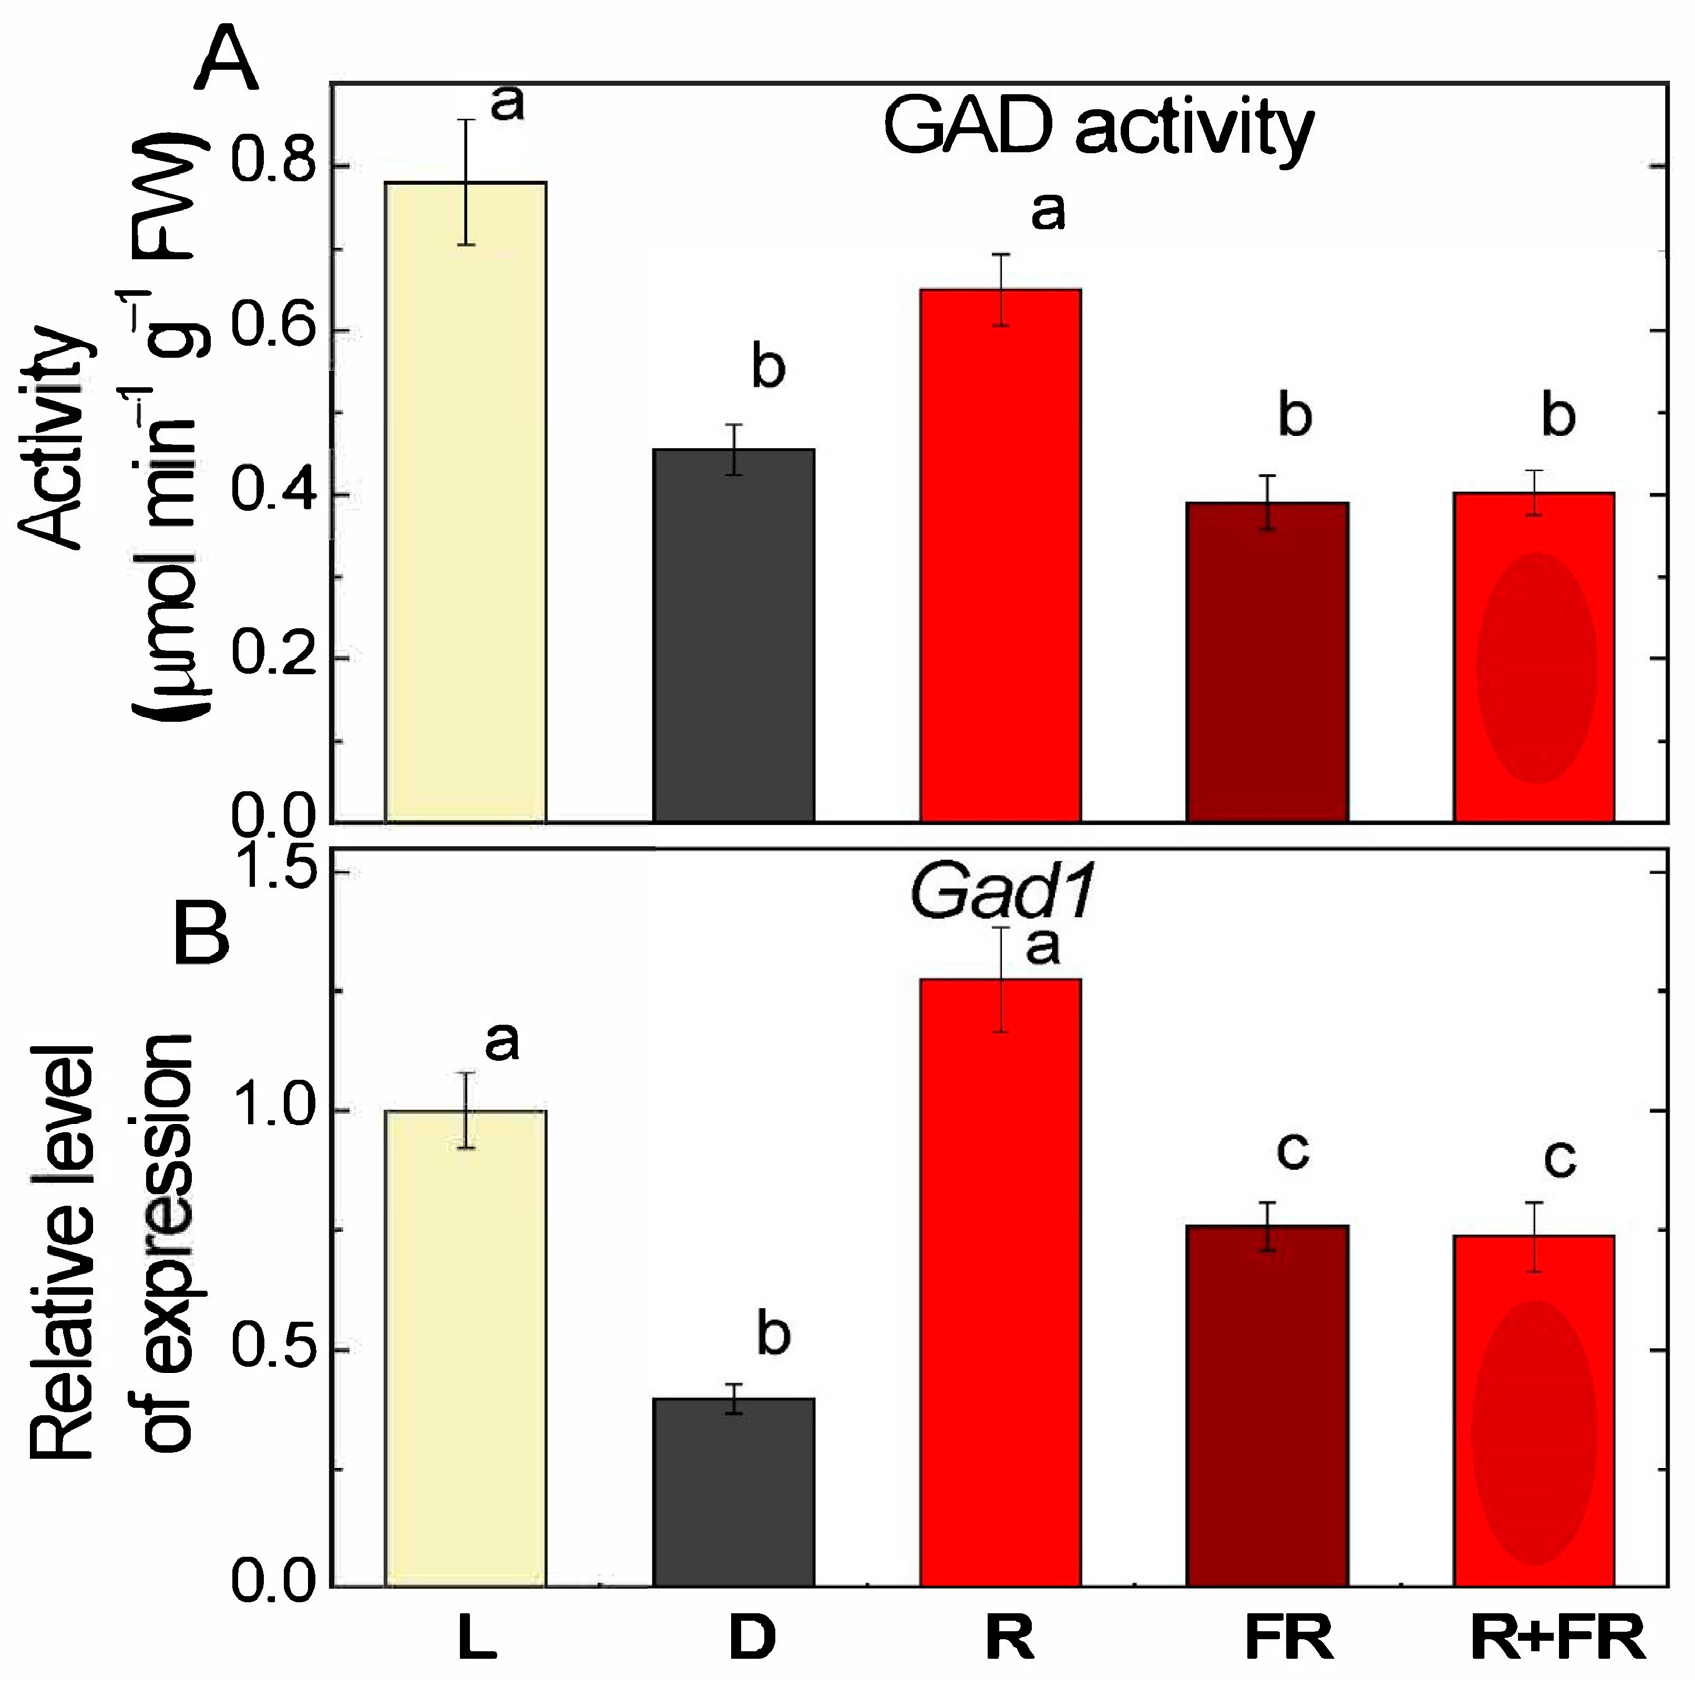
2.3. Glutamate Decarboxylase Activity and Expression

The values of glutamate decarboxylase (GAD) activity in the plants exposed to light were almost twice as high than in darkness. Irradiation with red light caused an increase in GAD activity relative to the group of plants exposed in the dark, while irradiation with far-red light after darkness and after red light resulted in similar values as in darkness (Figure 4A).
Analysis of the relative level of transcripts of the Gad1 (LOC100381655) gene showed that in darkness, its transcriptional activity was ~2.5 times lower than in the light, while irradiation by red light increased the concentration of Gad1 transcripts to the level observed in the light (Figure 4B). In the plants irradiated by far-red light after darkness and after red light, a slight increase in the relative level of transcripts was observed relative to the values recorded in the plants incubated in darkness.

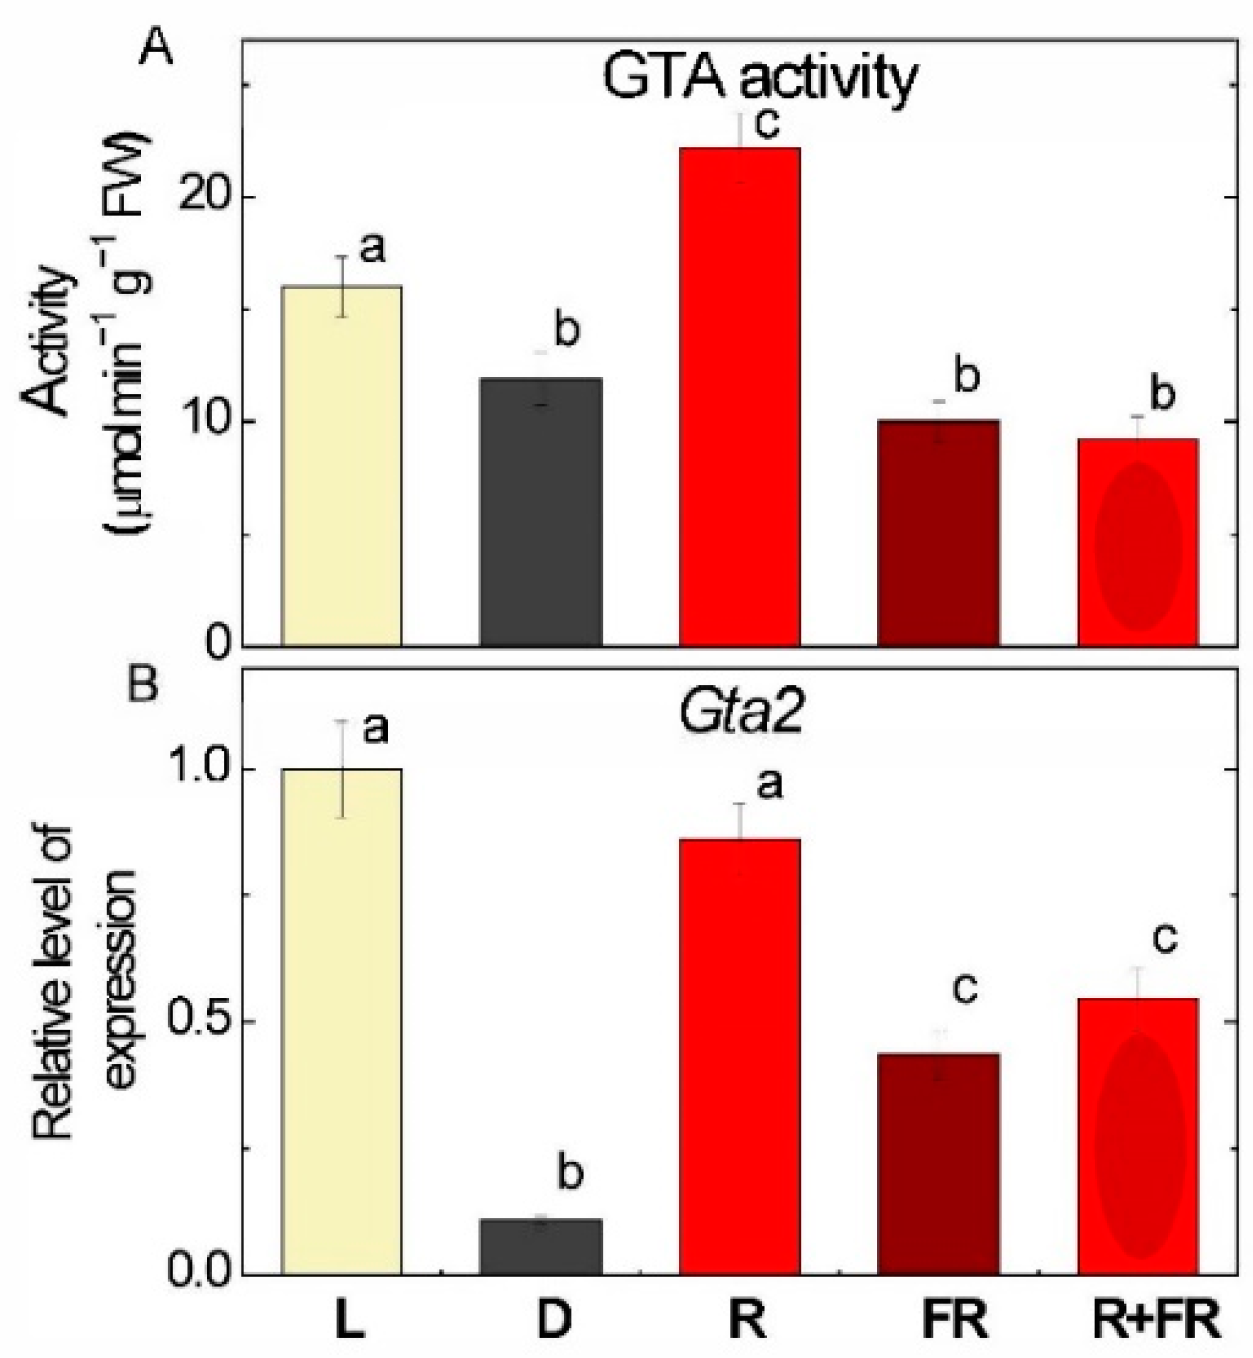
2.4. GABA Transaminase Activity and Expression

Measurement of the catalytic activity of GABA transaminase (GTA) in maize leaves irradiated with light of different wavelengths demonstrated the light-dependent nature of the regulation of this enzyme (Figure 5A). In the leaves of plants exposed to light, GTA activity was slightly (1.2 times) higher than in the leaves of dark-growing plants. Irradiation with red light increased GTA activity by 1.6 times as compared with the values in darkness. Irradiation with far-red light after darkness and after red light resulted in activity levels comparable to those in darkness.
Analysis of changes in the transcription profile of the Gta2 (LOC103645944) gene showed that light caused an almost 9-fold increase in the relative level of transcripts of the gene relative to the plants incubated in darkness (Figure 5B). Irradiation with red light also had an inducing effect on the transcriptional activity of this gene. The plants exposed to far-red light (applied after darkness or after red light) showed an intermediate concentration of the Gta2 mRNA in leaves, which was lower than in the light, and higher than in darkness.

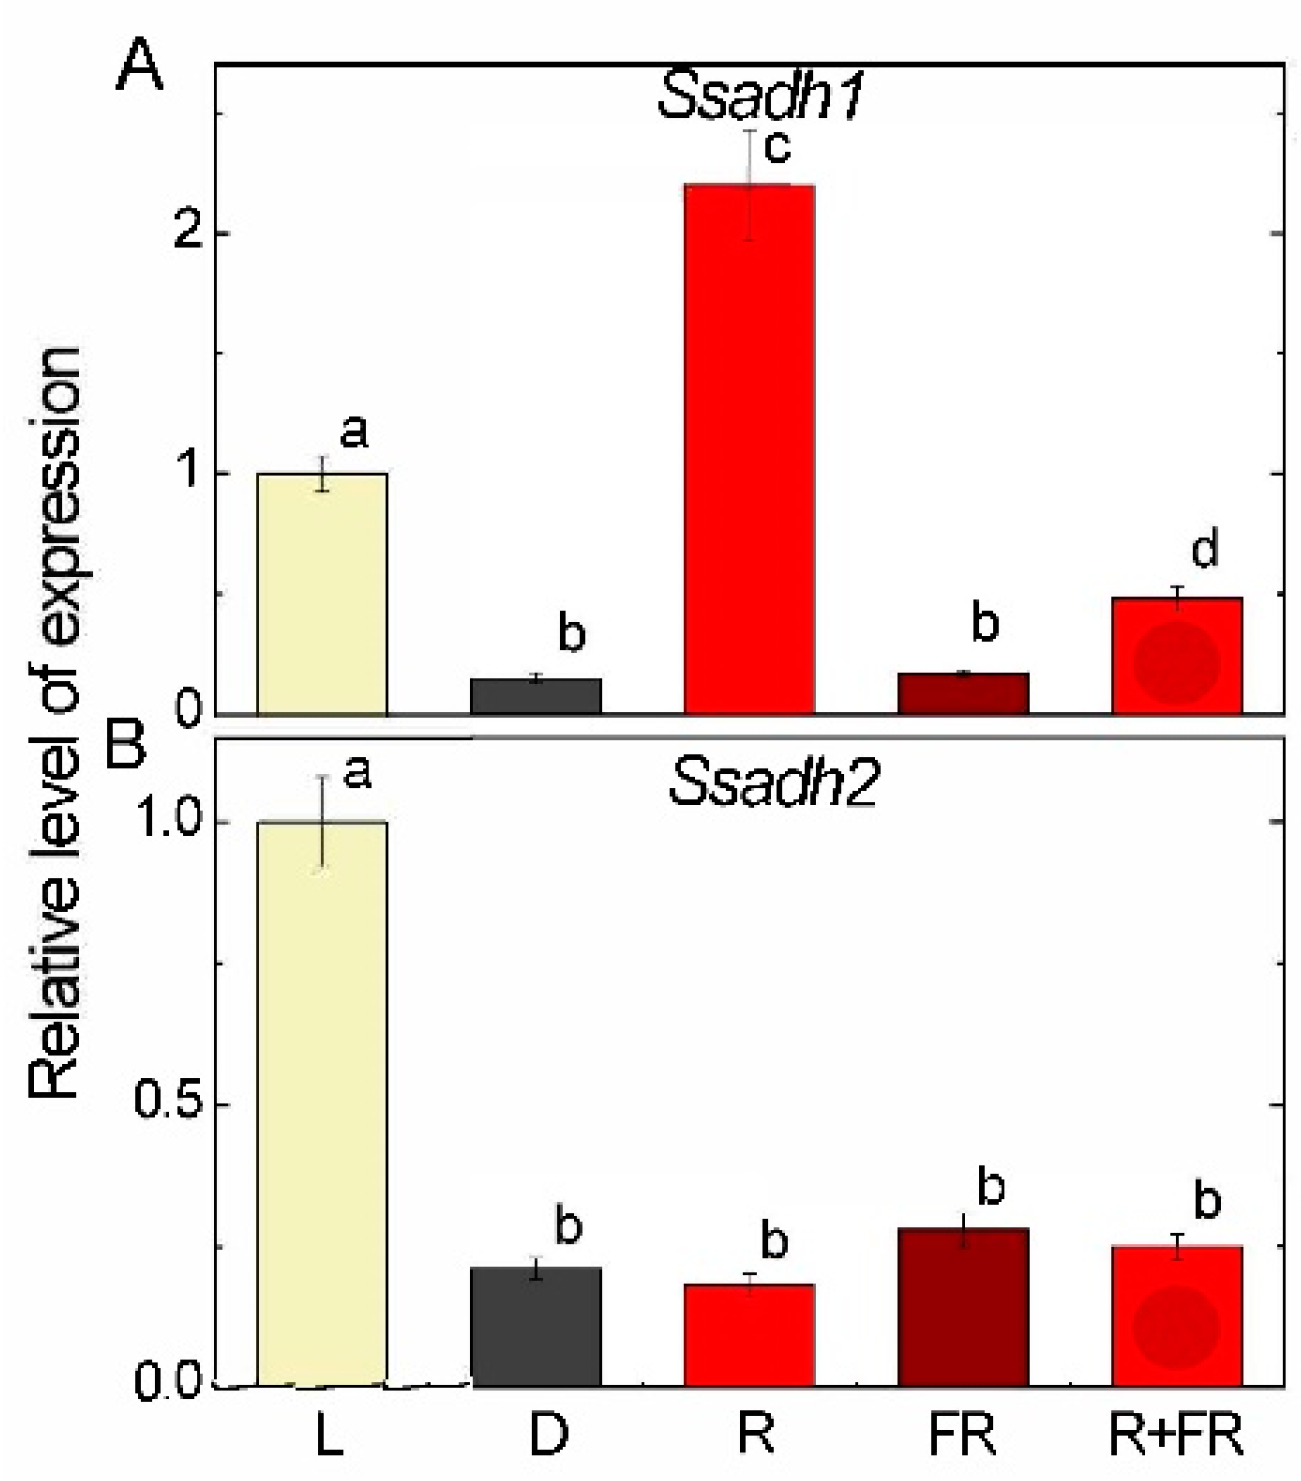
2.5. Succinic Semialdehyde Dehydrogenase Expression

Measurement of the relative level of transcripts of the Ssadh1 gene showed an almost 10-fold increase in the mRNA concentration of the studied gene when exposed to light as compared to darkness (Figure 6A). Upon irradiation with red light, the concentration of Ssadh1 transcripts was more than 20 times higher than in darkness. Far-red light applied after darkness had no effect on changes in the mRNA level of the Ssadh1 (LOC100280779) gene. When far-red light was applied after red light, a moderate increase in the transcriptional activity of the Ssadh1 gene as compared to the dark and red light levels was observed.
Analysis of changes in the transcriptional activity of the Ssadh2 (LOC100284047) gene upon irradiation of maize leaves with different wavelengths showed a different pattern as compared to the Ssadh1 gene (Figure 6B). Exposure of seedlings to light caused an increase in the Ssadh2 gene transcripts by five times as compared to the plants incubated in darkness. Irradiation with red, with far-red light, and with both did not significantly change the transcriptional activity of the Ssadh2 gene.

3. Discussion

Irradiation of plants leads to conformational changes in the structure of the phytochrome molecule and to concentration changes in Ca2+ ions, as a result of which the active form of phytochrome moves to the nucleus, where it indirectly regulates (suppresses) the transcription of GDH genes through a system of transcription factors [11,12]. Previously, we showed that in the light and upon irradiation with red light, a significant decrease in 2-OGDH expression and activity is observed, which limits the rate of the entire TCA cycle [39]. GDH activity and expression increase in the dark and upon irradiation with far-red light (Figure 1, Figure 2 and Figure 3), which leads to the intensification of the operation of the TCA cycle via the supply of 2-OG derived from glutamate. These observations confirm the evidence that light suppresses the TCA cycle activity [31,39,40]. Our data are consistent with the results of experiments by Garnik et al. [56], who showed that the GDH activity in A. thaliana seedlings rapidly declines during the transition from dark to light within half an hour. During the transition from light to dark, the activity increases and reaches a maximum after 8 h incubation in the dark, and the expression of Arabidopsis GDH1 and GDH2 genes depends on the redox state of the plastoquinone pool [57]. Miyashita and Good [58] showed that Arabidopsis plants are more resistant to prolonged incubation in the dark than knockout mutants of the GDH1 and GDH2 genes. Based on these data, it was suggested that in plants, GDH represents a mechanism of adaptation of cellular metabolism to carbohydrate starvation due to the use of glutamate as an alternative energy source [58]. This is confirmed by the observation that soluble sugars affect the expression of GDH genes, e.g., treatment of 7-day-old Arabidopsis seedlings with 3% glucose solution led to a decrease in the relative level of GDH1 and GDH2 gene transcripts [59]. In the light, the photosynthetic system is the main source of energy for the plant cell. In this regard, the need for intensive functioning of the TCA cycle decreases and the activity of its enzymes is maintained at a lower level. Our results demonstrate that upon irradiation, the maintenance of the TCA cycle and of the mitochondrial electron transport occurs in part due to the operation of the GABA shunt. At the same time, the supplier of glutamate for the GABA shunt in the light is likely not GDH (which is inhibited), but the GS/GOGAT system of chloroplasts, which is active in photosynthetic tissues [34]. Activation of GAD, the first enzyme of the GABA shunt, in the light (Figure 4) can be related to the supply of glutamate from chloroplasts. Glutamate in the cytoplasm is decarboxylated into GABA, which is subsequently transported into mitochondria, where GABA is transaminated to form succinic semialdehyde due to light-induced transcription of the Gta genes encoding GABA transaminase (Figure 5). The activation of SSADH by induction of the Ssadh1 gene in the light (Figure 6A) ensures the supply of succinate for the TCA cycle. The second gene Ssadh2 is also induced in the light, but the mechanism of this induction does not involve phytochrome (Figure 6B). The obtained data suggest that the active form of phytochrome activates a Ca2+-dependent cascade of reactions, which leads to the induction of genes encoding the enzymes of the GABA shunt.
In illuminated leaves, the intensity of decarboxylation in the TCA cycle reactions significantly decreases [60], and the non-cyclic operation of the TCA pathway takes place due to the transport of organic acids from the mitochondria [31,34,45]. In these conditions, when the operation of the 2-OGDH complex is inhibited [39,46], the GABA shunt undergoes activation [61,62] due to the induction of the enzymes of GABA metabolism. GABA can act as an important source of succinate for the TCA cycle in illuminated leaves [55]. This is supported by experimental data obtained by Ludewig et al. [63], who showed that high-intensity daylight and UV radiation induce the functioning of the GABA shunt while promoting the accumulation of GABA. It was shown earlier that light affects nitrogen metabolism in different ways, e.g., in salt-stressed durum wheat, it inhibits the synthesis of glycine betaine [64], suppresses proline and glutamate accumulation, while the content of GABA, amides, and minor amino acids increases [51]. Araújo et al. [41] demonstrated that the inhibition of the 2-OGDH complex by phosphonate analogs that can mimic the suppression of the complex in the light leads to the switch to the GABA shunt.
The process of oxidation of 2-oxoglutarate to succinyl-CoA via the 2-OGDH complex occurs more intensively in the dark and is inhibited in the light, which is associated with the high level of photosynthetically formed ATP [65]. ATP inhibits 2-OGDH, which also leads to the suppression of the GDH in the direction of glutamate deamination via the feedback mechanism [66,67]. Moreover, high levels of NADH and ATP inhibit SSADH operation [29], and the increase in its expression in the light observed in this study can partly compensate for this suppression.
The mechanism of transduction of the light signal to the genes Gdh1, Gdh2, Gad1, Gta2, and Ssadh1 described in this paper involves the control of the expression of these genes by the phytochrome system mediated by Ca2+ ions. From the results obtained in this study, it is seen that GDH activity and the expression of both Gdh genes are suppressed by light via the phytochrome mechanism, and the effect of phytochrome is mediated by Ca2+ ions (as seen from the incubation with EGTA and ruthenium red) (Figure 1, Figure 2 and Figure 3). Disruption of calcium transport caused by the use of EGTA and ruthenium red leads to the disruption of light signal transmission and thus to the absence of the inhibitory effect of red light on the transcription of Gdh genes and, as a consequence, on GDH activity. The Gdh2 gene is inhibited by red light and white light much stronger than the Gdh1 gene; its inhibition is more than 10-fold as compared to the 2–3-fold inhibition of Gdh1. Previously, it was shown [68] that the Gdh2 gene encodes the subunits of GDH that more readily catalyze the reverse reaction of 2-OG amination. This means that while glutamate oxidation via GDH is partially suppressed in the light, glutamate formation from 2-OG by GDH is almost fully blocked; hence, glutamate should be formed in the light exclusively in chloroplasts via the GS/GOGAT system.
Glutamate in the light is readily decarboxylated with the formation of GABA, which is evidenced by the experiments on the measurements of GAD activity and on the expression of the Gad1 gene. The effect is significant, especially for the expression of the Gad1 gene, which is activated three times by white light and four times by red light (Figure 4). Even stronger is the activation of Gta2 expression by red and white light (near 10-fold), although the changes in GTA activity are less pronounced (Figure 5). The observed differences in light effects can be explained by the fact that the regulation of transcription of the studied genes in response to light signal is a complex process and includes a Ca2+-dependent mechanism, transcription factors, etc.; in addition, changes in the transcription level of the Gad1 and Gta2 genes may be associated with the transport of GABA through the mitochondrial membrane [69,70,71,72,73,74,75].
The expression of both genes encoding SSADH is strongly activated by light, but the mechanisms are different, as seen from the study of the effects of red and white light (Figure 6). The gene Ssadh1 is regulated via the phytochrome mechanism, with red light activation of this gene by more than 10 times as compared to darkness, while the gene Ssadh2 is controlled by light independently from phytochrome effects. Red and far-red light were inefficient for this gene, which may indicate the participation of other mechanisms involving either cryptochrome or other light receptors.
The obtained results demonstrate that the GABA shunt provides the maintenance of the TCA cycle and the mitochondrial electron transport in the conditions of an actively photosynthetic cell and decreased operation of the TCA cycle caused by the high level of ATP and reducing equivalents (Figure 7). They can serve as a basis for creating varieties/lines of crop plants with the increased expression of the genes encoding the enzymes of the GABA shunt—GDH, GAD, GTA, SSADH—which will be adapted to grow in regions with suboptimal or excessive sun irradiation. This will aim to expand the areas of arable land used in agriculture.

4. Materials and Methods

4.1. Object of Investigation

Leaves of two-week-old maize (Zea mays L., cv. Voronezhskaya-76 obtained from the Voronezh branch of the All-Russian Research Institute of Maize) seedlings were used in this study. Maize plants were germinated in water and grown hydroponically under 10 h daylight with the intensity of 90 µmol quanta m−2 s−1 in the climatic chamber “LabTech” (Namyangju, Republic of Korea) and ambient temperature of 25 °C.

4.2. Irradiation by Light of Different Wavelengths

Plants were placed in a chamber for 24 h (darkness option), after which they were irradiated with red (640–680 nm) and/or far-red (710–750 nm) light for 15 min, with the intensity of 4 µmol m−2 s−1, using, respectively, LEDs 640–680 nm (KIPD40M40-K-P6, Kaskad-Elektro, Moscow, Russia) and 710–750 nm (ZL127A-5-5, Kaskad-Elektro, Moscow, Russia). Samples for analysis were taken 3 h after irradiation. Additional incubation in the dark (3 h after irradiation) was necessary to trigger the mechanism of transduction of the light signal into the nucleus and obtain a response to this signal. To ensure that the change in enzyme activity was not related to the time of incubation in the dark, we used a dark control incubated in the dark (D) for 24 h. We also had an additional dark control of plants incubated in the dark for 27 h, which showed the same result as D, so we do not present it in the figures.
The exposure of plants to white light was carried out under normal conditions with a 12 h light incubation.

4.3. Treatment with EGTA and Ruthenium Red

To study the involvement of calcium in the regulation of GDH, two-week-old maize seedlings were incubated in darkness for 1 h with a 5 mM EGTA solution to bind Ca2+ ions or with ruthenium red (ammoniated ruthenium oxychloride, 25 µM) to block calcium channels or Ca-ATPases [35,76]. Following the treatment, the measurement of GDH activity in isolated mitochondria and the extraction of RNA for the study of the expression of GDH genes were performed.

4.4. Isolation and Assay of Glutamate Dehydrogenase

To determine GDH activity in the total cellular fraction, a sample of plant material was ground at +4 °C with the following extraction medium: 50 mM Tris-HCl (pH 8), 1 mM EDTA, 0.05% Triton X-100, 0.5% PVP-40. The homogenate was filtered, and the cell walls were precipitated at 5000× g for 3 min.
The mitochondrial fraction for the analysis of GDH activity in mitochondria was isolated by homogenizing the plant material in a porcelain mortar with the following isolation medium: 0.15 M Tris-HCl buffer (pH 7.4), 0.4 M sucrose, 2.5 mM EDTA, 1 mM KCl, 4 mM MgCl2, 0.05% Triton X-100 in a ratio of 1:10. The homogenate was filtered through four layers of cheesecloth and centrifuged for 3 min at 3000× g in an Eppendorf Centrifuge 5804 R (“Eppendorf”, Hamburg, Germany) to discard cell walls. The supernatant was centrifuged for 10 min at 18,000× g.
Cross-contamination of mitochondria by the cytosolic fraction was determined by analyzing the activity of alcohol dehydrogenase [77,78], while the degree of chloroplast contamination was assessed by analyzing the concentration of chlorophylls a and b [56,79]. The degree of cross-contamination of the cytoplasmic fraction did not exceed 4.5%, and chloroplast fraction—8%.
The isolated mitochondrial fraction was destroyed by osmotic shock in 0.15 M Tris-HCl buffer (pH 7.4). The degree of mitochondrial destruction was more than 90%, which was controlled by microscopy on an Olympus CX41RF (“Olympus”, Tokyo, Japan). The resulting mitochondrial fraction was used to determine GDH activity. All steps were carried out at a temperature of +4 °C.
Glutamate dehydrogenase (GDH; EC 1.4.1.3) activity in the amination reaction was determined spectrophotometrically at 340 nm in 0.1 M Tris-HCl buffer (pH 8.0) containing 13 mM 2-oxoglutarate, 0.25 mM NADH, 1 mM CaCl2, 50 mM (NH4)2SO4 [80]. The amount of enzyme that converts (aminates) 1 μmol 2-OG in 1 min at the optimal pH value was taken as a unit of GDH enzymatic activity.

4.5. Isolation and Assay of Glutamate Decarboxylase

Extraction of glutamate decarboxylase (GAD; EC 4.1.1.15) was performed by homogenizing plant material in 20 mM acetate buffer (pH 4.8) with the addition of 10 mM pyridoxal phosphate, followed by centrifugation at 12,000× g for 30 min. The supernatant was used to determine GAD activity spectrophotometrically by measuring the change in optical density of a solution containing 20 mM acetate buffer (pH 4.8), 70 μM bromocresol green, 10 mM pyridoxal-5-phosphate, 2 mM sodium glutamic acid at 620 nm for 3 min [81,82]. The amount of enzyme (GAD) that converts (decarboxylates) 1 μmol of glutamate in 1 min at the optimal pH value was taken as a unit of enzymatic activity.

4.6. Isolation and Assay of GABA Transaminase

Extraction of GABA transaminase (GTA; EC 2.6.1.19) was carried out by homogenizing leaves (1:10) in 50 mM Tris-HCl buffer (pH 8.5) containing 0.1 μM pyridoxal-5-phosphate, 0.05% Triton X100, and 20 μM β-mercaptoethanol, followed by centrifugation at 12,000× g for 30 min. GTA activity was determined in 50 mM Tris-HCl buffer (pH 8.5) containing 0.1 μM pyridoxal-5-phosphate, 5 mM 2-oxoglutarate, 200 μL of mitochondrial fraction, and 4 mM NAD+. The sample was incubated for 10 min at 25 °C, after which 16 mM GABA was added and the change in optical density was recorded at 340 nm [83]. The amount of enzyme that converts 1 μmol GABA in 1 min at 25 °C at the optimal pH value was taken as a unit of GTA enzymatic activity.

4.7. RNA Isolation and Reverse Transcription

To assess changes in the transcriptional activity of the Gdh, Gad, Gta, and Ssadh genes in maize leaves, we analyzed changes in the relative levels of their transcripts in real-time PCR using specific primers (Supplementary Table S1). The following genes were studied: the Gdh1 (LOC542220) and Gdh2 (LOC100193614) genes encoding the α and β subunits of GDH, the Gad1 (LOC100381655) gene encoding GAD, the Gta2 (LOC103645944) gene encoding GTA, and the Ssadh1 (LOC100280779) and Ssadh2 (LOC100284047) genes encoding SSADH. The efficiency of primers was estimated in the range of 0.2–0.8 μM by performing a series of dilutions followed by amplification by real-time PCR. The range of primer efficiency for the genes Gdh1, Gdh2, Gad1, Gta2, Ssadh1, and Ssadh2 was 0.3–0.5 μM.
Total RNA was isolated by phenol/chloroform/isoamyl alcohol extraction using LiCl to remove DNA [84,85]. As a template for RT-PCR, we used cDNA obtained through a reverse transcription reaction with the MMLV-RT Kit (JSC Evrogen, Moscow, Russia) in accordance with the manufacturer’s protocol. The plant material (100 mg tissue per 1 mL medium) was ground in a porcelain mortar with an extraction medium containing 4 M guanidine thiocyanate, 30 mM sodium citrate, 30 mM β-mercaptoethanol, pH 7.0–7.5; then, 2 M sodium acetate (pH 4.0) was added (1/10 of the volume) and mixed, followed by adding 1 volume of phenol saturated with water. After vortexing, a mixture of chloroform and isoamyl alcohol (49:1) was added, mixed (20 s), and incubated on ice for 15–20 min. After centrifugation for 20 min at 10,000× g at 4 °C, the upper aqueous phase was transferred to a new Eppendorf tube and 1 mL of isopropanol was added, after which the mixture was incubated at −20 °C for 1 h. RNA was precipitated by centrifugation for 20 min at 10,000× g at 4 °C. The supernatant was removed, and the pellet was washed twice with 500 μL of 80% ethanol, dried, and dissolved in RNase-free water (100 μL).

4.8. Polymerase Chain Reaction

Real-time PCR was performed on a LightCycler96 device (Roche, Solna, Sweden) with the designed gene-specific primers (Supplementary Table S1), using SYBR Green I as an intercalating dye. Amplification was carried out according to the following parameters: preliminary denaturation—95 °C for 5 min, followed by 35 cycles, each containing the following steps: 95 °C—10 s, 57, 58, or 59 °C (see annealing temperature in the tables)—10 s, 72 °C—10 s. Finally, a 10 min final elongation was performed at 72 °C. Quantitative matrix control was carried out using gene-specific primers for housekeeping genes (Ef-1α elongation factor). Total RNA without the RT-PCR step was used as a negative control. Calculation of the relative levels of transcripts of the studied genes was performed using the 2−∆∆Ct method [86].

4.9. Statistical Analysis

The number of plants within each group in each experiment was 6–14. The experiments were carried out in 3–4 biological replicates; analytical determinations for each sample were performed in triplicate. Statistical analysis of the obtained data was performed using the STATISTICA 12.0 program. Quantitative data were assessed for compliance with normal distribution using the Shapiro–Wilk test. The results in the graphs were expressed as the average ± standard error of the mean (SEM). Differences were analyzed for statistical significance using Student’s t-test with Bonferroni correction for multiple comparisons. Additionally, a one-way analysis of variance was used. The statistically significant differences (p ≤ 0.05) are discussed [87].

5. Conclusions

The results obtained in this study suggest that the irradiation of maize plants by light results in the suppression of GDH and activation of the enzymes participating in the GABA shunt. In most cases, this regulation occurs via the phytochrome mechanism, except for the second gene encoding SSADH. Phytochrome regulation, as shown for GDH, is mediated by concentration changes in Ca2+ ions. The induction of expression of the genes encoding the enzymes of the GABA shunt by light activates the bypass, leading to succinate production in the conditions when the metabolic flow through the 2-OGDH complex is suppressed. Thus, the GABA shunt is essential for the adaptation of plants to light conditions. Further studies of the mechanisms regulating the operation of enzymes involved in the GABA shunt will provide new insights into the epigenetic mechanisms of adaptation of plant cells to changes in the spectral composition of light.

Supplementary Materials

The following supporting information can be downloaded at: https://www.mdpi.com/article/10.3390/ijms252312711/s1.

Author Contributions

Conceptualization, A.T.E., G.B.A., A.U.I.; investigation, A.T.E., G.B.A., Z.N.S., P.P.M.; methodology, A.T.E., G.B.A., Z.N.S., P.P.M.; writing—original draft preparation, A.T.E., G.B.A.; writing—review and editing, A.T.E., G.B.A., A.U.I.; project administration, A.T.E., A.U.I.; funding acquisition, A.T.E. All authors have read and agreed to the published version of the manuscript.

Funding

This research was funded (to A.T.E.) by the Ministry of Science and Higher Education of the Russian Federation as part of the state task for universities in the field of scientific activity for 2023–2025, project No FZGU-2023-0009.

Institutional Review Board Statement

Not applicable.

Informed Consent Statement

Not applicable.

Data Availability Statement

The datasets generated for this study are available upon request from the corresponding author.

Conflicts of Interest

The authors declare no conflicts of interest.

Abbreviations

GABAγ-aminobutyric acid
GADglutamate decarboxylase
GDHglutamate dehydrogenase
GTAGABA transaminase
2-OG2-oxoglutarate
2-OGDH2-oxoglutarate dehydrogenase
SSAsuccinic semialdehyde
SSADHsuccinic semialdehyde dehydrogenase
TCA cycletricarboxylic acid cycle

References

  1. Kami, C.; Lorrain, S.; Hornitschek, P.; Fankhauser, C. Light-regulated plant growth and development. Curr. Top. Dev. Biol. 2010, 91, 29–66. [Google Scholar] [CrossRef] [PubMed]
  2. Lu, Y.; Yao, J. Chloroplasts at the Crossroad of Photosynthesis, Pathogen Infection and Plant Defense. Int. J. Mol. Sci. 2018, 19, 3900. [Google Scholar] [CrossRef]
  3. Creux, N.; Harmer, S. Circadian rhythms in plants. Cold Spring Harb. Perspect. Biol. 2019, 11, a034611. [Google Scholar] [CrossRef]
  4. Voskresenskaya, N.P. Blue Light and Carbon Metabolism. Annu. Rev. Plant Physiol. 1972, 23, 219–234. [Google Scholar] [CrossRef]
  5. Voskresenskaya, N.P. Effect of Light Quality on Carbon Metabolism. In Photosynthesis II, Encyclopedia of Plant Physiology; Gibbs, M., Latzko, E., Eds.; Springer: Berlin/Heidelberg, Germany, 1979; Volume 6. [Google Scholar] [CrossRef]
  6. Iqbal, Z.; Iqbal, M.S.; Hashem, A.; Abd Allah, E.F.; Ansari, M.I. Plant defense responses to biotic stress and its interplay with fluctuating dark/light conditions. Front. Plant Sci. 2021, 12, 631810. [Google Scholar] [CrossRef]
  7. Franklin, K.A.; Lee, S.H.; Patel, D.; Kumar, S.V.; Spartz, A.K.; Gu, C.; Ye, S.; Yu, P.; Breen, G.; Cohen, J.D.; et al. Phytochrome-interacting factor 4 (PIF4) regulates auxin biosynthesis at high temperature. Proc. Natl. Acad. Sci. USA 2011, 108, 20231–20235. [Google Scholar] [CrossRef] [PubMed]
  8. Franklin, K.A.; Praekelt, U.; Stoddart, W.M.; Billingham, O.E.; Halliday, K.J.; Whitelam, G.C. Phytochromes B, D, and E act redundantly to control multiple physiological responses in Arabidopsis. Plant Physiol. 2001, 131, 1340–1346. [Google Scholar] [CrossRef] [PubMed]
  9. Li, J.; Li, G.; Wang, H.; Deng, X.W. Phytochrome signaling mechanisms. Arab. Book 2011, 9, e0148. [Google Scholar] [CrossRef]
  10. Van Buskirk, E.K.; Decker, P.V.; Chen, M. Photobodies in light signaling. Plant Physiol. 2012, 158, 52–60. [Google Scholar] [CrossRef]
  11. Klose, C.; Viczián, A.; Kircher, S.; Schäfer, E.; Nagy, F. Molecular mechanisms for mediating light-dependent nucleo/cytoplasmic partitioning of phytochrome photoreceptors. New Phytol. 2015, 206, 965–971. [Google Scholar] [CrossRef]
  12. Zheng, P.F.; Wang, X.; Yang, Y.Y.; You, C.X.; Zhang, Z.L.; Hao, Y.J. Identification of Phytochrome-Interacting Factor Family Members and Functional Analysis of MdPIF4 in Malus domestica. Int. J. Mol. Sci. 2020, 21, 7350. [Google Scholar] [CrossRef] [PubMed]
  13. Gao, Y.; Ren, X.; Qian, J.; Li, Q.; Tao, H.; Chen, J. The phytochrome-interacting family of transcription factors in maize (Zea mays L.): Identification, evolution, and expression analysis. Acta Physiol. Plant 2019, 41, 8. [Google Scholar] [CrossRef]
  14. Gao, Y.; Wu, M.; Zhang, M.; Jiang, W.; Ren, X.; Liang, E.; Zhang, D.; Zhang, C.; Xiao, N.; Li, Y.; et al. A maize phytochrome-interacting factors protein ZmPIF1 enhances drought tolerance by inducing stomatal closure and improves grain yield in Oryza sativa. Plant Biotechnol. J. 2018, 16, 1375–1387. [Google Scholar] [CrossRef] [PubMed]
  15. Volotovski, I.D.; Sokolovsky, S.G.; Molchan, O.V.; Knight, M.R. Second messengers mediate increases in cytosolic calcium in tobacco protoplasts. Plant Physiol. 1998, 117, 1023–1030. [Google Scholar] [CrossRef]
  16. Kim, J.I.; Park, J.E.; Zarate, X.; Song, P.S. Phytochrome phosphorylation in plant light signaling. Photochem. Photobiol. Sci. 2005, 4, 681–687. [Google Scholar] [CrossRef] [PubMed]
  17. Volotovski, I.D. Role of calcium ions in photosignaling processes in a plant cell. Biophysics 2011, 56, 778–788. [Google Scholar] [CrossRef]
  18. Bossen, M.E.; Dassen, H.H.; Kendrick, R.E.; Vredenberg, W.J. The role of calcium ions in phytochrome-controlled swelling of etiolated wheat (Triticum aestivum L.) protoplasts. Planta 1988, 174, 94–100. [Google Scholar] [CrossRef]
  19. Volotovski, I.D. Ca2+ and intracellular signalling in plant cells: A role in phytochrome transduction. Memb. Cell Biol. 1998, 12, 721–742. [Google Scholar]
  20. Dubovskaya, L.V.; Molchan, O.V.; Volotovsky, I.D. Photoregulation of the endogenous cGMP content in oat seedlings. Russ. J. Plant Physiol. 2001, 48, 19–22. [Google Scholar] [CrossRef]
  21. Ikura, M.; Ames, J.B. Genetic polymorphism and protein conformational plasticity in the calmodulin superfamily: Two ways to promote multifunctionality. Proc. Natl. Acad. Sci. USA 2006, 103, 1159–1164. [Google Scholar] [CrossRef]
  22. Reddy, A.S. Calcium: Silver bullet in signaling. Plant Sci. 2001, 160, 381–404. [Google Scholar] [CrossRef]
  23. Snedden, W.A.; Fromm, H. Calmodulin as a versatile calcium signal transducer in plants. New Phytol. 2001, 151, 35–66. [Google Scholar] [CrossRef]
  24. Luan, S.; Kudla, J.; Rodriguez-Concepcion, M.; Yalovsky, S.; Gruissem, W. Calmodulins and calcineurin B-like proteins: Calcium sensors for specific signal response coupling in plants. Plant Cell 2002, 14, S389–S400. [Google Scholar] [CrossRef]
  25. Eprintsev, A.T.; Fedorin, D.N.; Sazonova, O.V.; Igamberdiev, A.U. Light inhibition of fumarase in Arabidopsis leaves is phytochrome A-dependent and mediated by calcium. Plant Physiol. Biochem. 2016, 102, 161–166. [Google Scholar] [CrossRef]
  26. Astegno, A.; Capitani, G.; Dominici, P. Functional roles of the hexamer organization of plant glutamate decarboxylase. Biochim. Biophys. Acta 2015, 1854, 1229–1237. [Google Scholar] [CrossRef] [PubMed]
  27. Snedden, W.A.; Arazi, T.; Fromm, H.; Shelp, B.J. Calcium/Calmodulin Activation of Soybean Glutamate Decarboxylase. Plant Physiol. 1995, 108, 543–549. [Google Scholar] [CrossRef]
  28. Snedden, W.A. Regulation of the γ-aminobutyrate-synthesizing enzyme, glutamate decarboxylase, by calcium-calmodulin: A mechanism for rapid activation in response to stress. In Plant Responses to Environmental Stresses; Lerner, H.R., Ed.; Routledge: London, UK, 2018; pp. 549–574. [Google Scholar] [CrossRef]
  29. Busch, K.B.; Fromm, H. Plant succinic semialdehyde dehydrogenase. Cloning, purification, localization in mitochondria, and regulation by adenine nucleotides. Plant Physiol. 1999, 121, 589–597. [Google Scholar] [CrossRef]
  30. Eprintsev, A.T.; Selivanova, N.V.; Fedorin, D.N.; Bashkin, S.S.; Selezneva, E.A.; Dadakina, I.V.; Makhmud Ali, S. The role of calcium cations in the mechanism of phytochrome-dependent regulation of the sdh1-2 gene expression and succinate dehydrogenase activity in maize leaves. Biochem. Mosc. 2012, 6, 310–313. [Google Scholar] [CrossRef]
  31. Tcherkez, G.; Mahé, A.; Gauthier, P.; Mauve, C.; Gout, E.; Bligny, R.; Cornic, G.; Hodges, M. In folio respiratory fluxomics revealed by 13C isotopic labeling and H/D isotope effects highlight the noncyclic nature of the tricarboxylic acid “cycle” in illuminated leaves. Plant Physiol. 2009, 151, 620–630. [Google Scholar] [CrossRef]
  32. Tcherkez, G.; Boex-Fontvieille, E.; Mahé, A.; Hodges, M. Respiratory carbon fluxes in leaves. Curr. Opin. Plant Biol. 2012, 15, 308–314. [Google Scholar] [CrossRef]
  33. Igamberdiev, A.U.; Eprintsev, A.T.; Fedorin, D.N.; Popov, V.N. Phytochrome-mediated regulation of plant respiration and photorespiration. Plant Cell Environ. 2014, 37, 290–299. [Google Scholar] [CrossRef] [PubMed]
  34. Igamberdiev, A.U.; Bykova, N.V. Mitochondria in photosynthetic cells: Coordinating redox control and energy balance. Plant Physiol. 2023, 191, 2104–2119. [Google Scholar] [CrossRef] [PubMed]
  35. Eprintsev, A.T.; Fedorin, D.N.; Igamberdiev, A.U. Ca2+ is involved in phytochrome A-dependent regulation of the succinate dehydrogenase gene sdh1-2 in Arabidopsis. J. Plant Physiol. 2013, 170, 1349–1352. [Google Scholar] [CrossRef]
  36. Eprintsev, A.T.; Fedorin, D.N.; Dobychina, M.A.; Igamberdiev, A.U. Regulation of expression of the mitochondrial and peroxisomal forms of citrate synthase in maize during germination and in response to light. Plant Sci. 2018, 272, 157–163. [Google Scholar] [CrossRef] [PubMed]
  37. Eprintsev, A.T.; Fedorin, D.N.; Cherkasskikh, M.V.; Igamberdiev, A.U. Expression of succinate dehydrogenase and fumarase genes in maize leaves is mediated by cryptochrome. J. Plant Physiol. 2018, 221, 81–84. [Google Scholar] [CrossRef]
  38. Eprintsev, A.T.; Fedorin, D.N.; Cherkasskikh, M.V.; Igamberdiev, A.U. Regulation of expression of the mitochondrial and cytosolic forms of aconitase in maize leaves via phytochrome. Plant Physiol. Biochem. 2020, 146, 157–162. [Google Scholar] [CrossRef] [PubMed]
  39. Eprintsev, A.T.; Fedorin, D.N.; Anokhina, G.B.; Sedykh, A.V. Molecular and Biochemical Aspects of Light Regulation of 2-Oxoglutarate Dehydrogenase in Plants. Russ. J. Plant Physiol. 2020, 67, 378–385. [Google Scholar] [CrossRef]
  40. Eprintsev, A.T.; Fedorin, D.N.; Igamberdiev, A.U. Light-Dependent Expression and Promoter Methylation of the Genes Encoding Succinate Dehydrogenase, Fumarase, and NAD-Malate Dehydrogenase in Maize (Zea mays L.) Leaves. Int. J. Mol. Sci. 2023, 24, 10211. [Google Scholar] [CrossRef]
  41. Araújo, W.L.; Tohge, T.; Nunes-Nesi, A.; Daloso, D.M.; Nimick, M.; Krahnert, I.; Bunik, V.I.; Moorhead, G.B.; Fernie, A.R. Phosphonate analogs of 2-oxoglutarate perturb metabolism and gene expression in illuminated Arabidopsis leaves. Front. Plant Sci. 2012, 3, 114. [Google Scholar] [CrossRef]
  42. Quail, P.H.; Boylan, M.T.; Parks, B.M.; Short, T.W.; Xu, Y.; Wagner, D. Phytochromes: Photosensory perception and signal transduction. Science 1995, 268, 675–680. [Google Scholar] [CrossRef]
  43. Igamberdiev, A.U.; Kleczkowski, L.A. The Glycerate and Phosphorylated Pathways of Serine Synthesis in Plants: The Branches of Plant Glycolysis Linking Carbon and Nitrogen Metabolism. Front. Plant Sci. 2018, 9, 318. [Google Scholar] [CrossRef]
  44. Kleczkowski, L.A.; Igamberdiev, A.U. Multiple Roles of Glycerate Kinase-From Photorespiration to Gluconeogenesis, C4 Metabolism, and Plant Immunity. Int. J. Mol. Sci. 2024, 25, 3258. [Google Scholar] [CrossRef] [PubMed]
  45. Sweetlove, L.J.; Beard, K.F.; Nunes-Nesi, A.; Fernie, A.R.; Ratcliffe, R.G. Not just a circle: Flux modes in the plant TCA cycle. Trends Plant Sci. 2010, 15, 462–470. [Google Scholar] [CrossRef] [PubMed]
  46. Araújo, W.L.; Nunes-Nesi, A.; Trenkamp, S.; Bunik, V.I.; Fernie, A.R. Inhibition of 2-oxoglutarate dehydrogenase in potato tuber suggests the enzyme is limiting for respiration and confirms its importance in nitrogen assimilation. Plant Physiol. 2008, 148, 1782–1796. [Google Scholar] [CrossRef]
  47. Hodges, M. Enzyme redundancy and the importance of 2-oxoglutarate in plant ammonium assimilation. J. Exp. Bot. 2002, 53, 905–916. [Google Scholar] [CrossRef]
  48. Lea, P.J.; Miflin, B.J. Glutamate synthase and the synthesis of glutamate in plants. Plant Physiol. Biochem. 2003, 41, 555–564. [Google Scholar] [CrossRef]
  49. Hoekenga, O.A.; Maron, L.G.; Piñeros, M.A.; Cançado, G.M.; Shaff, J.; Kobayashi, Y.; Ryan, P.R.; Dong, B.; Delhaize, E.; Sasaki, T.; et al. AtALMT1, which encodes a malate transporter, is identified as one of several genes critical for aluminum tolerance in Arabidopsis. Proc. Natl. Acad. Sci. USA 2006, 103, 9738–9743. [Google Scholar] [CrossRef]
  50. Yu, B.; Wu, Q.; Li, X.; Zeng, R.; Min, Q.; Huang, J. GLUTAMATE RECEPTOR-like gene OsGLR3.4 is required for plant growth and systemic wound signaling in rice (Oryza sativa). New Phytol. 2022, 233, 1238–1256. [Google Scholar] [CrossRef]
  51. Woodrow, P.; Ciarmiello, L.F.; Annunziata, M.G.; Pacifico, S.; Iannuzzi, F.; Mirto, A.; D’Amelia, L.; Dell’Aversana, E.; Piccolella, S.; Fuggi, A.; et al. Durum wheat seedling responses to simultaneous high light and salinity involve a fine reconfiguration of amino acids and carbohydrate metabolism. Physiol. Plant. 2017, 159, 290–312. [Google Scholar] [CrossRef]
  52. Ji, J.; Shi, Z.; Xie, T.; Zhang, X.; Chen, W.; Du, C.; Sun, J.; Yue, J.; Zhao, X.; Jiang, Z.; et al. Responses of GABA shunt coupled with carbon and nitrogen metabolism in poplar under NaCl and CdCl2 stresses. Ecotoxicol. Environ. Saf. 2020, 193, 110322. [Google Scholar] [CrossRef]
  53. Bouché, N.; Fait, A.; Bouchez, D.; Møller, S.G.; Fromm, H. Mitochondrial succinic-semialdehyde dehydrogenase of the gamma-aminobutyrate shunt is required to restrict levels of reactive oxygen intermediates in plants. Proc. Natl. Acad. Sci. USA 2003, 100, 6843–6848. [Google Scholar] [CrossRef] [PubMed]
  54. Esmaelpour, S.; Iranbakhsh, A.; Dilmaghani, K.; Marandi, S.J.; Oraghi Ardebili, Z. The potential contribution of the WRKY53 transcription factor, gamma-aminobutyric acid (GABA) transaminase, and histone deacetylase in regulating growth, organogenesis, photosynthesis, and transcriptional responses of tomato to different light-emitting diodes (LEDs). J. Photochem. Photobiol. B 2022, 229, 112413. [Google Scholar] [CrossRef]
  55. Gilliham, M.; Tyerman, S.D. Linking Metabolism to Membrane Signaling: The GABA-Malate Connection. Trends Plant Sci. 2016, 21, 295–301. [Google Scholar] [CrossRef] [PubMed]
  56. Garnik, E.Y.; Vilyanen, D.V.; Vlasova, A.A.; Tarasenko, V.I.; Konstantinov, Y.M. Arabidopsis GDH1 and GDH2 genes double knock-out results in a stay-green phenotype during dark-induced senescence. Physiol. Mol. Biol. Plants 2024, 30, 1631–1642. [Google Scholar] [CrossRef]
  57. Garnik, E.Y.; Belkov, V.I.; Tarasenko, V.I.; Rudikovskii, A.V.; Konstantinov, Y.M. Expression of glutamate dehydrogenase genes in Arabidopsis thaliana depends on the redox state of plastoquinone pool. Plant Cell Tissue Organ Cult. 2021, 147, 107–116. [Google Scholar] [CrossRef]
  58. Miyashita, Y.; Good, A.G. NAD(H)-dependent glutamate dehydrogenase is essential for the survival of Arabidopsis thaliana during dark-induced carbon starvation. J. Exp. Bot. 2008, 59, 667–680. [Google Scholar] [CrossRef]
  59. Li, Y.; Lee, K.K.; Walsh, S.; Smith, C.; Hadingham, S.; Sorefan, K.; Cawley, G.; Bevan, M.W. Establishing glucose- and ABA-regulated transcription networks in Arabidopsis by microarray analysis and promoter classification using a Relevance Vector Machine. Genome Res. 2006, 16, 414–427. [Google Scholar] [CrossRef]
  60. Tcherkez, G.; Bligny, R.; Gout, E.; Mahé, A.; Hodges, M.; Cornic, G. Respiratory metabolism of illuminated leaves depends on CO2 and O2 conditions. Proc. Natl. Acad. Sci. USA 2008, 105, 797–802. [Google Scholar] [CrossRef]
  61. Yue, J.; Du, C.; Ji, J.; Xie, T.; Chen, W.; Chang, E.; Chen, L.; Jiang, Z.; Shi, S. Inhibition of α-ketoglutarate dehydrogenase activity affects adventitious root growth in poplar via changes in GABA shunt. Planta 2018, 248, 963–979. [Google Scholar] [CrossRef]
  62. Xie, T.; Ji, J.; Chen, W.; Yue, J.; Du, C.; Sun, J.; Chen, L.; Jiang, Z.; Shi, S. GABA negatively regulates adventitious root development in poplar. J. Exp. Bot. 2020, 71, 1459–1474. [Google Scholar] [CrossRef]
  63. Ludewig, F.; Hüser, A.; Fromm, H.; Beauclair, L.; Bouché, N. Mutants of GABA transaminase (POP2) suppress the severe phenotype of succinic semialdehyde dehydrogenase (ssadh) mutants in Arabidopsis. PLoS ONE 2008, 3, e3383. [Google Scholar] [CrossRef] [PubMed]
  64. Carillo, P.; Parisi, D.; Woodrow, P.; Pontecorvo, G.; Massaro, G.; Annunziata, M.G.; Fuggi, A.; Sulpice, R. Salt-induced accumulation of glycine betaine is inhibited by high light in durum wheat. Funct. Plant Biol. 2011, 38, 139–150. [Google Scholar] [CrossRef] [PubMed]
  65. Gardeström, P.; Igamberdiev, A.U. The origin of cytosolic ATP in photosynthetic cells. Physiol. Plant. 2016, 157, 367–379. [Google Scholar] [CrossRef] [PubMed]
  66. Craig, D.W.; Wedding, R.T. Regulation of the 2-oxoglutarate dehydrogenase lipoate succinyltransferase complex from cauliflower by nucleotide. Steady-state kinetic studies. J. Biol. Chem. 1980, 255, 5763–5768. [Google Scholar] [CrossRef]
  67. Dubois, F.; Tercé-Laforgue, T.; Gonzalez-Moro, M.-B.; Estavillo, J.-M.; Sangwan, R.; Gallais, A.; Hirel, B. Glutamate dehydrogenase in plants: Is there a new story for an old enzyme? Plant Physiol. Biochem. 2003, 41, 565–576. [Google Scholar] [CrossRef]
  68. Tercé-Laforgue, T.; Lothier, J.; Limami, A.M.; Rouster, J.; Lea, P.J.; Hirel, B. The Key Role of Glutamate Dehydrogenase 2 (GDH2) in the Control of Kernel Production in Maize (Zea mays L.). Plants 2023, 12, 2612. [Google Scholar] [CrossRef]
  69. Baum, G.; Lev-Yadun, S.; Fridmann, Y.; Arazi, T.; Katsnelson, H.; Zik, M.; Fromm, H. Calmodulin binding to glutamate decarboxylase is required for regulation of glutamate and GABA metabolism and normal development in plants. EMBO J. 1996, 15, 2988–2996. [Google Scholar] [CrossRef]
  70. Bouché, N.; Lacombe, B.; Fromm, H. GABA signaling: A conserved and ubiquitous mechanism. Trends Cell Biol. 2003, 13, 607–610. [Google Scholar] [CrossRef] [PubMed]
  71. Ansari, M.I.; Lee, R.-H.; Chen, S.-C.G. A novel senescence-associated gene encoding γ-aminobutyric acid (GABA): Pyruvate transaminase is upregulated during rice leaf senescence. Physiol. Plant. 2005, 123, 1–8. [Google Scholar] [CrossRef]
  72. Michaeli, S.; Fait, A.; Lagor, K.; Nunes-Nesi, A.; Grillich, N.; Yellin, A.; Bar, D.; Khan, M.; Fernie, A.R.; Turano, F.J.; et al. A mitochondrial GABA permease connects the GABA shunt and the TCA cycle, and is essential for normal carbon metabolism. Plant J. 2011, 67, 485–498. [Google Scholar] [CrossRef]
  73. Mei, X.; Chen, Y.; Zhang, L.; Fu, X.; Wei, Q.; Grierson, D.; Zhou, Y.; Huang, Y.; Dong, F.; Yang, Z. Dual mechanisms regulating glutamate decarboxylases and accumulation of gamma-aminobutyric acid in tea (Camellia sinensis) leaves exposed to multiple stresses. Sci. Rep. 2016, 6, 23685. [Google Scholar] [CrossRef] [PubMed]
  74. Ramesh, S.A.; Tyerman, S.D.; Gilliham, M.; Xu, B. γ-Aminobutyric acid (GABA) signalling in plants. Cell. Mol. Life Sci. 2017, 74, 1577–1603. [Google Scholar] [CrossRef] [PubMed]
  75. Carillo, P. GABA shunt in durum wheat. Front. Plant Sci. 2018, 9, 100. [Google Scholar] [CrossRef] [PubMed]
  76. Trewavas, A.; Knight, M. Mechanical signalling, calcium and plant form. Plant Mol. Biol. 1994, 26, 1329–1341. [Google Scholar] [CrossRef]
  77. Pathuri, I.P.; Reitberger, I.E.; Hückelhoven, R.; Proels, R.K. Alcohol dehydrogenase 1 of barley modulates susceptibility to the parasitic fungus Blumeria graminis f.sp. hordei. J. Exp. Bot. 2011, 62, 3449–3457. [Google Scholar] [CrossRef]
  78. Jelski, W.; Laniewska-Dunaj, M.; Orywal, K.; Kochanowicz, J.; Rutkowski, R.; Szmitkowski, M. The activity of alcohol dehydrogenase (ADH) isoenzymes and aldehyde dehydrogenase (ALDH) in the sera of patients with brain cancer. Neuroch. Res. 2014, 39, 2313–2318. [Google Scholar] [CrossRef]
  79. Eprintsev, A.T.; Fedorin, D.N.; Selivanova, N.V.; Wu, T.L.; Makhmud, A.S.; Popov, V.N. The role of promoter methylation in the regulation of genes encoding succinate dehydrogenase in maize seedlings. Russ. J. Plant Physiol. 2012, 59, 299–306. [Google Scholar] [CrossRef]
  80. Sarasketa, A.; González-Moro, M.B.; González-Murua, C.; Marino, D. Nitrogen source and external medium pH interaction differentially affects root and shoot metabolism in Arabidopsis. Front. Plant Sci. 2016, 7, 29. [Google Scholar] [CrossRef]
  81. Yu, K.; Hu, S.; Huang, J.; Mei, L.H. A high-throughput colorimetric assay to measure the activity of glutamate decarboxylase. Enzyme Microb. Technology 2011, 49, 272–276. [Google Scholar] [CrossRef]
  82. Eprintsev, A.T.; Anokhina, G.B.; Selivanova, P.S.; Moskvina, P.P.; Igamberdiev, A.U. Biochemical and Epigenetic Regulation of Glutamate Metabolism in Maize (Zea mays L.) Leaves under Salt Stress. Plants 2024, 13, 2651. [Google Scholar] [CrossRef]
  83. Award, R.; Levac, D.; Cybulska, P.; Merali, Z.; Trudeau, V.L.; Arnason, J.T. Effects of traditionally used anxiolytic botanicals on enzymes of the γ-aminobutyric acid (GABA) system. Can. J. Physiol. Pharmacol. 2007, 85, 933–942. [Google Scholar]
  84. Chomczynski, P.; Sacchi, N. Single-step method of RNA isolation by acid guanidinium thiocyanate-phenol-chloroform extraction. Anal. Biochem. 1987, 162, 156–159. [Google Scholar] [CrossRef] [PubMed]
  85. Matz, M.V. Amplification of representative cDNA samples from microscopic amounts of invertebrate tissue to search for new genes. Methods Mol. Biol. 2002, 183, 3–18. [Google Scholar] [CrossRef] [PubMed]
  86. Livak, K.J.; Schmittgen, T.D. Analysis of relative gene expression data using real-time quantitative PCR and the 2−ΔΔCt method. Methods 2001, 25, 402–408. [Google Scholar] [CrossRef]
  87. Zar, J.H. Biostatistical Analysis; Pearson: Upper Saddle River, NJ, USA, 1999; ISBN 978-0130815422. [Google Scholar]
Figure 1. Glutamate dehydrogenase activity in maize leaves under different light conditions. (A)—the activity measured in crude extract; (B)—the activity measured in the mitochondrial fraction; (C)—the activity in the mitochondrial fraction of the plants treated with EGTA. L—light; D—dark; R—red light (660 nm); FR—far-red light (730 nm); R + FR—red light followed by far-red light. The results are presented as the average ± standard error of the mean (SEM). Differences were analyzed for statistical significance using Student’s t-test with Bonferroni correction for multiple comparisons. The letters indicate statistically significant differences at p < 0.05 (n = 5).
Ijms 25 12711 g001
Figure 2. Expression of the glutamate dehydrogenase gene Gdh1 in maize leaves under different light conditions. (A)—expression without EGTA; (B)—expression after the treatment with EGTA. Abbreviations are the same as in Figure 1. The results are presented as the average ± standard error of the mean (SEM). Differences were analyzed for statistical significance using Student’s t-test with Bonferroni correction for multiple comparisons. The letters indicate statistically significant differences at p < 0.05 (n = 5).
Ijms 25 12711 g002
Figure 3. Expression of the glutamate dehydrogenase gene Gdh2 in maize leaves under different light conditions. (A)—expression without EGTA; (B)—expression after the treatment with EGTA. Abbreviations are the same as in Figure 1. The results are presented as the average ± standard error of the mean (SEM). Differences were analyzed for statistical significance using Student’s t-test with Bonferroni correction for multiple comparisons. The letters indicate statistically significant differences at p < 0.05 (n = 5).
Ijms 25 12711 g003
Figure 4. Glutamate decarboxylase activity (A) and expression of Gad1 gene (B) in maize leaves under different light conditions. Abbreviations are the same as in Figure 1. The results are presented as the average ± standard error of the mean (SEM). Differences were analyzed for statistical significance using Student’s t-test with Bonferroni correction for multiple comparisons. The letters indicate statistically significant differences at p < 0.05 (n = 5).
Ijms 25 12711 g004
Figure 5. GABA transaminase activity (A) and expression of Gta2 gene (B) in maize leaves under different light conditions. Abbreviations are the same as in Figure 1. The results are presented as the average ± standard error of the mean (SEM). Differences were analyzed for statistical significance using Student’s t-test with Bonferroni correction for multiple comparisons. The letters indicate statistically significant differences at p < 0.05 (n = 5).
Ijms 25 12711 g005
Figure 6. Expression of the succinic semialdehyde dehydrogenase genes Ssadh1 (A) and Ssadh2 (B) in maize leaves under different light conditions. Abbreviations are the same as in Figure 1. The results are presented as the average ± standard error of the mean (SEM). Differences were analyzed for statistical significance using Student’s t-test with Bonferroni correction for multiple comparisons. The letters indicate statistically significant differences at p < 0.05 (n = 5).
Ijms 25 12711 g006
Figure 7. Changes in glutamate metabolism in darkness and light. Abbreviations: Ca, calcium ions; GABA, γ-aminobutyric acid; GLU, glutamate; GS/GOGAT, glutamine synthetase–glutamate synthase; 2-OG, 2-oxoglutarate; SSA, succinic semialdehyde; SUC, succinate. Enzymes: GAD, glutamate decarboxylase; GDH, glutamate dehydrogenase; GTA, GABA transaminase; SSADH, SSA dehydrogenase. Corresponding genes are given in italics. The red-colored X indicates the suppression of the reaction in the light.
Ijms 25 12711 g007
Disclaimer/Publisher’s Note: The statements, opinions and data contained in all publications are solely those of the individual author(s) and contributor(s) and not of MDPI and/or the editor(s). MDPI and/or the editor(s) disclaim responsibility for any injury to people or property resulting from any ideas, methods, instructions or products referred to in the content.

