Communication

Identification of Diagnostic and Prognostic Subnetwork Biomarkers for Women with Breast Cancer Using Integrative Genomic and Network-Based Analysis

by
Olfat Al-Harazi
1,
Achraf El Allali
2,
Namik Kaya
3 and
Dilek Colak
1,*
1
Molecular Oncology Department, King Faisal Specialist Hospital and Research Centre, Riyadh 11211, Saudi Arabia
2
Bioinformatics Laboratory, College of Computing, Mohammed VI Polytechnic University, Benguerir 43150, Morocco
3
Translational Genomics Department, Center for Genomic Medicine, King Faisal Specialist Hospital and Research Centre, Riyadh 11211, Saudi Arabia
*
Author to whom correspondence should be addressed.
Int. J. Mol. Sci. 2024, 25(23), 12779; https://doi.org/10.3390/ijms252312779
Submission received: 17 October 2024 / Revised: 11 November 2024 / Accepted: 14 November 2024 / Published: 28 November 2024

Abstract

:
Breast cancer remains a major global health concern and a leading cause of cancer-related deaths among women. Early detection and effective treatment are essential in improving patient survival. Advances in omics technologies have provided deeper insights into the molecular mechanisms underlying breast cancer. This study aimed to identify subnetwork markers with diagnostic and prognostic potential by integrating genome-wide gene expression data with protein–protein interaction networks. We identified four significant subnetworks revealing potentially important hub genes, including VEGFA, KIF4A, ZWINT, PTPRU, IKBKE, STYK1, CENPO, and UBE2C. The diagnostic and prognostic potentials of these subnetworks were validated using independent datasets. Unsupervised principal component analysis demonstrated a clear separation of breast cancer patients from healthy controls across multiple datasets. A KNN classification model, based on these subnetworks, achieved an accuracy of 97%, sensitivity of 98%, specificity of 94%, and area under the curve (AUC) of 96%. Moreover, the prognostic significance of these subnetwork markers was validated using independent transcriptomic datasets comprising over 4000 patients. These findings suggest that subnetwork markers derived from integrated genomic network analyses can enhance our understanding of the molecular landscape of breast cancer, potentially leading to improved diagnostic, prognostic, and therapeutic strategies.

1. Introduction

Breast cancer is the most frequently diagnosed cancer and remains the leading cause of cancer-related mortality among women worldwide [1]. There is a growing need for precise diagnostic and prognostic tools that can capture the molecular complexity of breast cancer and guide personalized treatment strategies [2,3]. High-throughput genomic technologies have revolutionized breast cancer research by enabling the identification of gene signatures associated with distinct subtypes and clinical outcomes, thus providing valuable insights into underlying molecular mechanisms [4,5,6]. Recent studies suggest that integrating biological context and network interactions between genes can lead to more robust biomarkers and improve our understanding of complex cancer biology [7,8,9,10].
Network-based approaches provide a systems biology perspective by integrating gene expression data with protein–protein interaction (PPI) networks to identify subnetworks functionally linked to specific disease states [7,11]. These subnetworks, also known as disease modules, represent groups of interconnected genes or proteins involved in shared biological processes and pathways associated with a disease state [7,8,12]. Subnetwork markers derived from integrative analyses have been shown to be more robust and reliable for disease diagnosis and prognosis than individual gene markers, as they capture the complex gene interactions and regulatory networks driving tumorigenesis [8,9,10,13,14,15,16].
This study aimed to identify subnetwork biomarkers for breast cancer through the integration of genome-wide gene expression data with PPI networks. Clustering algorithms were applied to partition the gene network into distinct subnetworks and activity scores for each subnetwork were computed. These scores were then used to develop a KNN-based classification model. The performance of this model was validated using an independent dataset from The Cancer Genome Atlas (TCGA). Moreover, we assessed the prognostic significance of the identified subnetworks through survival analyses using independent transcriptomic datasets from diverse ethnic and racial populations. The results suggest that subnetwork markers derived from integrated network analyses may provide a comprehensive understanding of breast cancer’s molecular architecture, potentially leading to improved diagnostics and prognostics across populations.

2. Results

2.1. Identification of Subnetwork Biomarkers

We integrated gene expression data with protein–protein interaction (PPI) networks to identify disease-specific molecular modules or subnetworks. The PPIs were extracted from the STRING database [17]. The Context-Specific Subnetwork Discovery (COSSY) algorithm was employed to cluster the gene network into subnetworks, as detailed in the methods section [18,19] (Figure 1). To assess the significance of these subnetworks, Welch’s t-tests were performed to compare subnetwork activity scores between invasive ductal carcinoma (IDC) samples and normal controls. The analysis identified four subnetworks exhibiting statistically significant differences in activity between IDC and control samples (adjusted p-value < 0.00001, corrected using the Benjamini–Hochberg method), suggesting distinct patterns of dysregulation in cancerous tissues. The identified subnetwork biomarkers revealed potentially important hub genes, including VEGFA, KIF4A, ZWINT, PTPRU, IKBKE, STYK1, CENPO, and UBE2C (Figure 2).
Functional enrichment analyses of genes within each subnetwork using the Database for Annotation, Visualization, and Integrated Discovery (DAVID) bioinformatics tool (DAVID version 6.8) [20] revealed significant enrichment of biological processes related to angiogenesis, cell migration, the regulation of cell proliferation, chromatin organization, cell division, and cell cycles (Table 1).

2.2. Diagnostic Significance of the Identified Subnetwork Biomarkers

To evaluate the diagnostic value of the identified subnetwork biomarkers, we performed unsupervised principle component analysis (PCA) on two datasets: GSE36295 and TCGA (Figure 3A and Figure 3B, respectively). In the PCA scatter plots, each sphere denotes a sample in the datasets. The PCA analysis clearly separated samples as BC patients (pink spheres) and normal controls (blue spheres) in both datasets (Figure 3).
Subsequently, a KNN classifier was constructed using the four subnetwork markers, with the GSE36295 dataset used for training. Subnetwork activity scores were computed for each sample and the classifier was trained using the city block distance measure with k = five neighbors. A two-level nested cross-validation approach was utilized to ensure robust model validation, as detailed in the methods section. The classification performance was then evaluated, which showed perfect discrimination between tumor samples and normal controls on the training dataset and an accuracy of 97%, sensitivity of 98%, specificity of 94%, and AUC of 96% on the TCGA dataset.

2.3. Prognostic Significance of the Identified Subnetwork Biomarkers

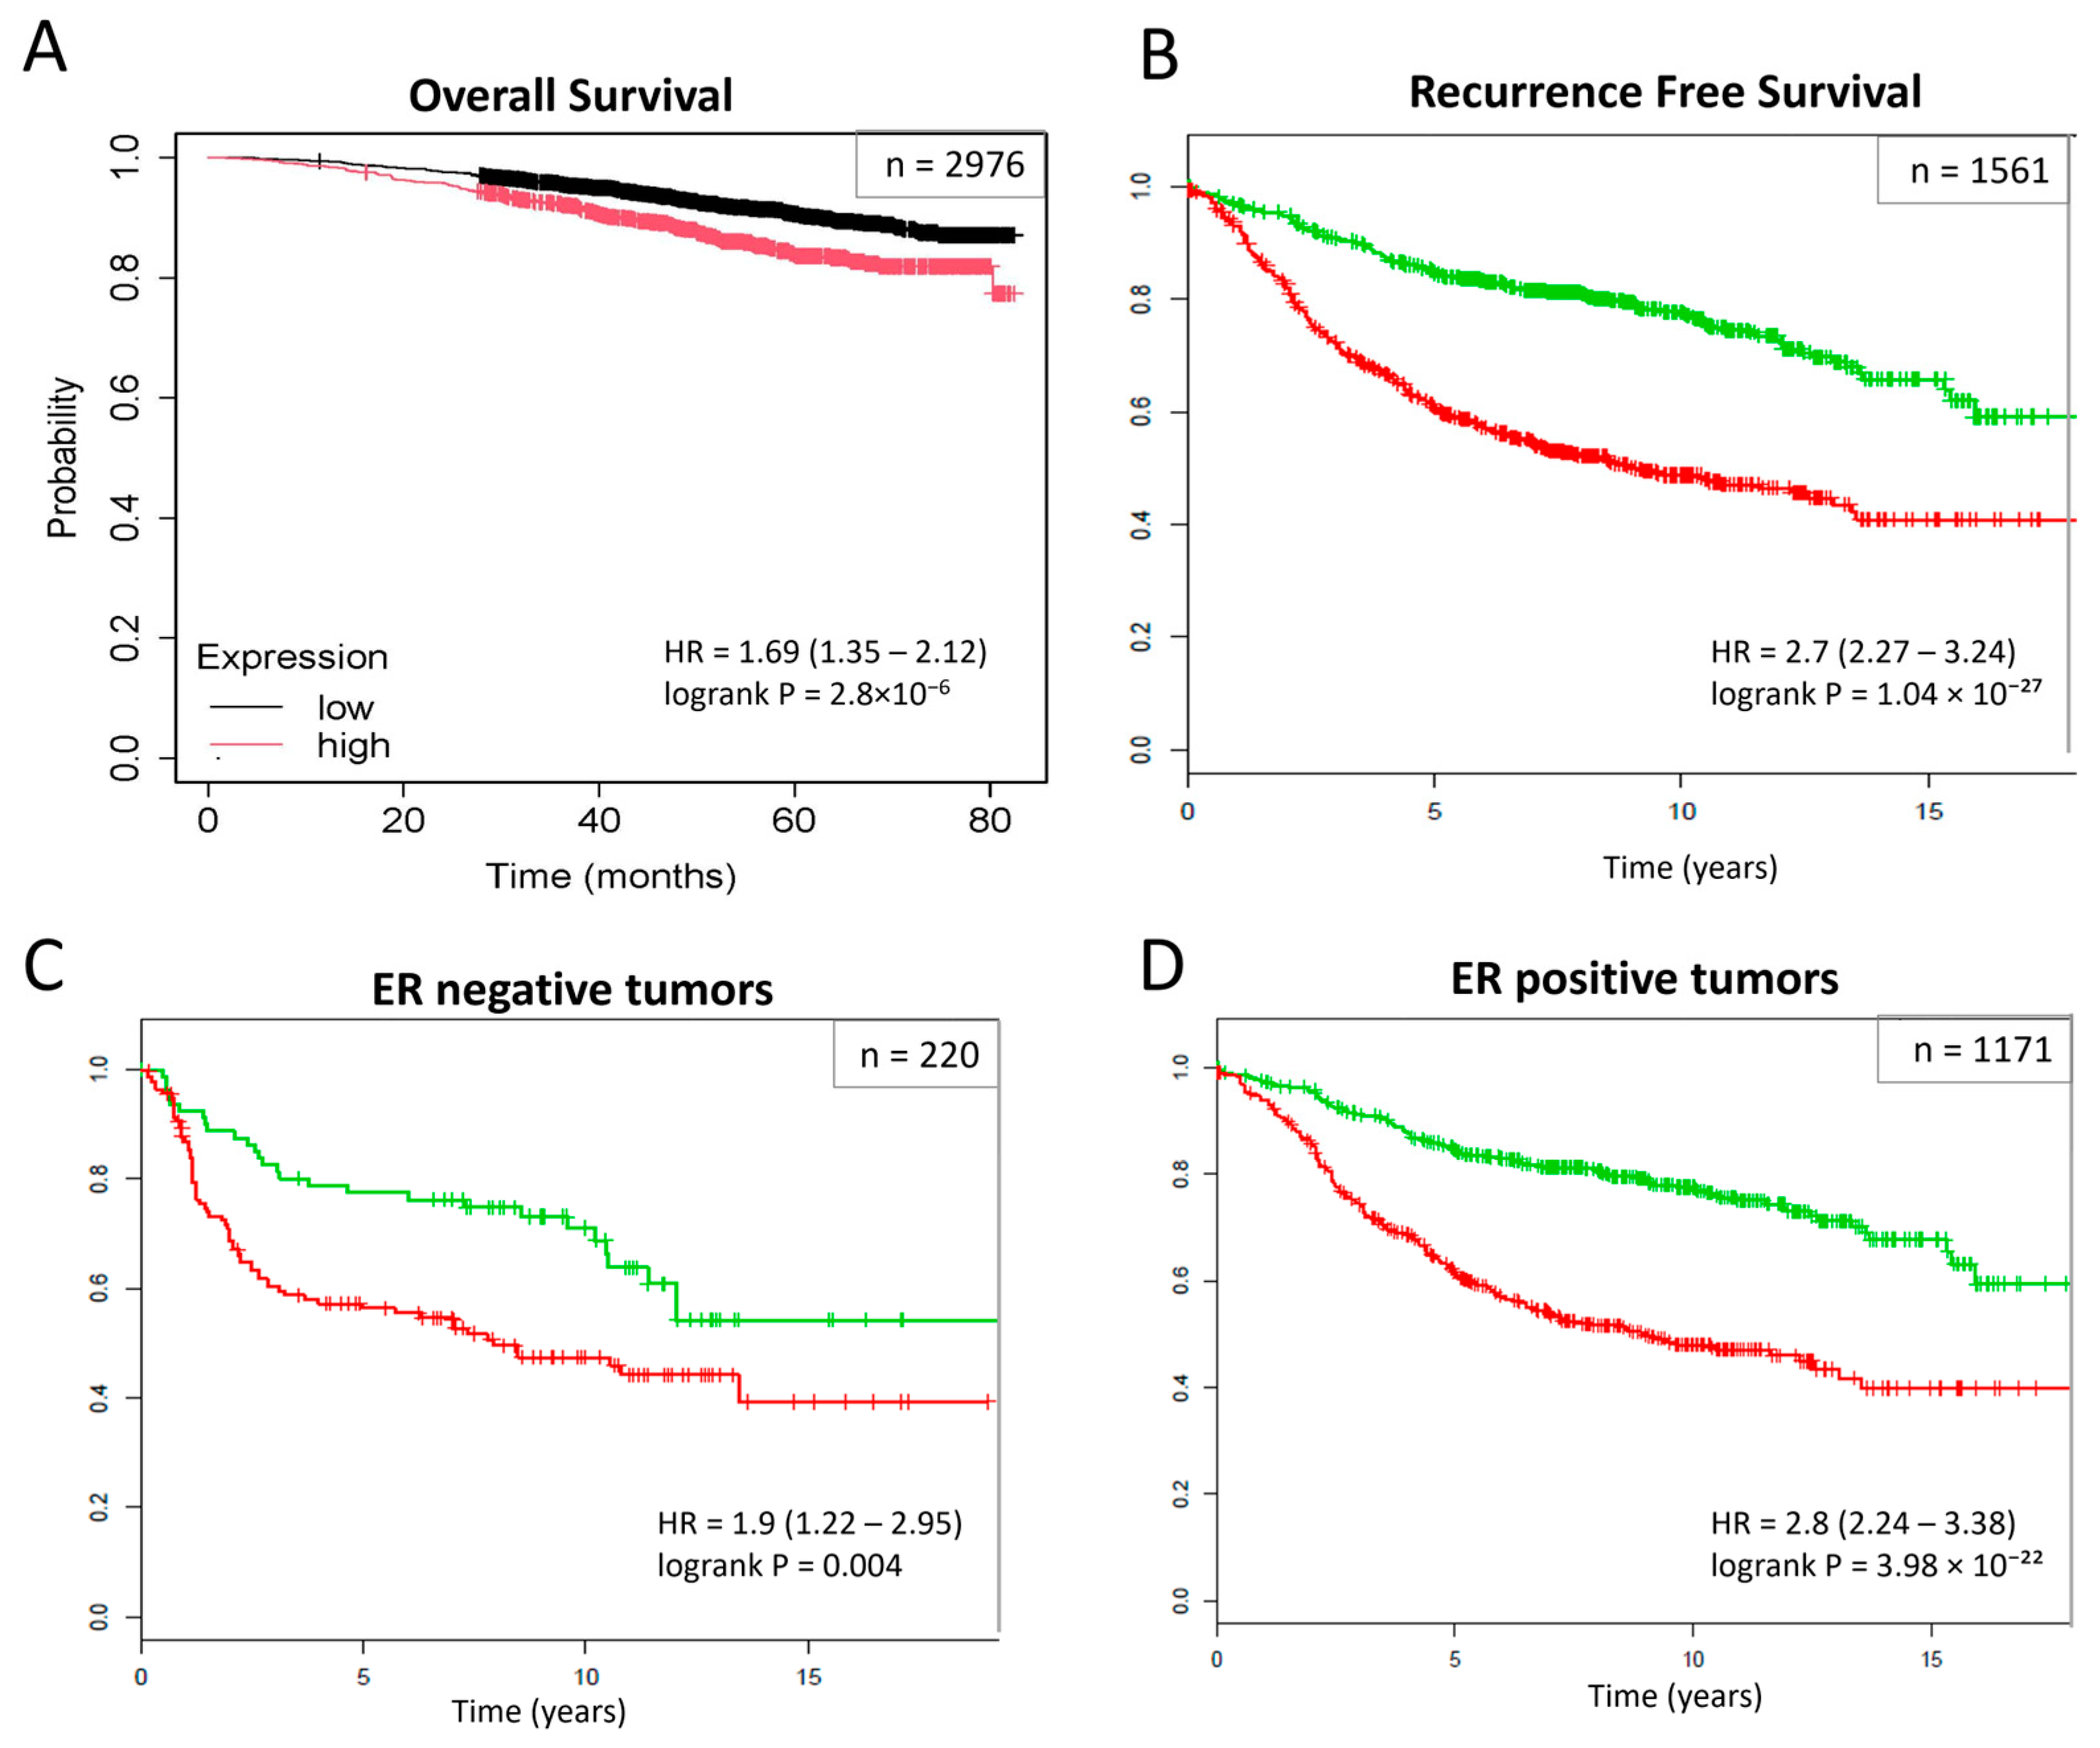
The prognostic significance of the subnetwork biomarkers was assessed for overall survival (OS) and recurrence-free survival (RFS) using two large transcriptomic datasets. High subnetwork activity scores were found to be significantly associated with poor clinical outcomes (p-value < 0.0001) (Figure 4A and Figure 4B, respectively). Further stratification of patients based on estrogen receptor (ER) status revealed that these subnetwork markers could effectively distinguish between high-risk and low-risk groups within both ER-negative and ER-positive cohorts (p-value < 0.01) (Figure 4C and Figure 4D, respectively).

3. Discussion

In this study, we identified four significant subnetwork biomarkers with diagnostic and prognostic potential in breast cancer through the integration of gene expression data with PPI networks. These subnetworks demonstrated robust diagnostic and prognostic capabilities, consistent with previous findings that emphasize the reliability of network-based methodologies in identifying functionally relevant biomarkers and potential therapeutic targets across various cancers [8,9,10,16].
The integration of gene expression data with PPI networks enabled a more comprehensive understanding of breast cancer’s molecular landscape. The identified subnetworks revealed key significantly dysregulated hub genes, including VEGFA, KIF4A, ZWINT, PTPRU, IKBKE, STYK1, CENPO, and UBE2C, which play crucial roles in various biological processes associated with cancer progression, such as angiogenesis, cell cycle regulation, and mitotic nuclear division. For example, VEGFA (Vascular Endothelial Growth Factor A) is a well-known mediator of angiogenesis, critical for tumor growth and metastasis. The overexpression of VEGFA has been associated with poor prognosis in multiple cancers, including breast cancer, due to its role in promoting angiogenesis and enhancing the metastatic potential of tumor cells [21]. Similarly, KIF4A, ZWINT, and UBE2C are involved in cell cycle regulation, cell proliferation, and mitosis, with frequent dysregulation observed in cancers and a clear association with tumor progression and poor clinical outcomes [6,20,22,23,24,25]. PTPRU, IKBKE, STYK1, and CENPO are implicated in key biological pathways relevant to cancer biology, including cell signaling, cell migration, and inflammation, further supporting their relevance in tumorigenesis [26,27]. These findings suggest that the identification of markers through a network-based approach may lead to key driver genes that are involved in tumorigenesis and highlight associated pathways that could represent a promising therapeutic strategy.
The high accuracy, sensitivity, specificity, and AUC of the KNN classification model based on these subnetworks confirm their potential as reliable diagnostic markers. Moreover, the significant prognostic utility of these subnetworks for overall survival (OS) and recurrence-free survival (RFS) in large patient cohorts emphasizes their clinical relevance. Furthermore, the ability to distinguish between high-risk and low-risk groups within both ER-negative and ER-positive cohorts further supports the potential of these subnetwork markers in guiding personalized treatment strategies.
Despite the promising results, several limitations of this study must be acknowledged. First, the analysis predominantly relied on data from Saudi patients (GSE36295), and the sample size was relatively small, which may have potentially introduced bias and limited the generalizability of the findings across different ethnic and socioeconomic groups. Nevertheless, validation results on larger cohorts, including TCGA and Swedish datasets, illustrated the diagnostic and prognostic potential of the identified subnetwork markers, suggesting their robustness across populations. These findings support the hypothesis that subnetwork markers derived from network-based approaches are more stable across diverse populations than traditional single-gene markers due to their reliance on systems biology approaches. This stability can be particularly advantageous in global health contexts, where biomarkers need to perform consistently across various genetic and environmental backgrounds.
Future research should focus on validating subnetwork biomarkers in diverse populations and exploring their potential in predicting responses to various treatments, including targeted therapies and immunotherapies. Moreover, integrating additional omics data, such as proteomics, metabolomics, and single-cell sequencing data, could further enhance our understanding of the molecular landscape of breast cancer and better capture tumor heterogeneity. Such comprehensive approaches may lead to the discovery of additional biomarkers and therapeutic targets, ultimately advancing precision medicine in breast cancer diagnosis, prognosis, and treatment.

4. Materials and Methods

4.1. Gene Expression Datasets

Whole-genome gene expression data for Saudi patients with breast cancer (Invasive Ductal Carcinoma, IDC) were obtained from the NCBI Gene Expression Omnibus (GEO) www.ncbi.nlm.nih.gov/geo (accessed on 23 July 2018) under accession number GSE36295, which includes 39 samples (34 tumors and 5 normal controls), processed on the Affymetrix Human Gene 1.0 ST Array platform. Additionally, the gene expression dataset for IDC patients from The Cancer Genome Atlas (TCGA) was downloaded, consisting of 460 tumor samples and 62 normal controls.

4.2. Subnetwork Identification

Gene expression data were integrated with protein–protein interaction (PPI) networks to identify significant subnetwork biomarkers using the Context-Specific Subnetwork Discovery (COSSY) algorithm [18,19]. Molecular interaction networks were retrieved from the Search Tool for the Retrieval of Interacting Genes/Proteins (STRING) database (Version 10.5) [17] and partitioned into subnetworks using the iCOSSY online platform http://icossy.korea.ac.kr/ (accessed on 26 July 2018) [18]. Each subnetwork represented a cluster of closely interacting molecular nodes. Subnetworks were visualized using Cytoscape version 3.4.0 [28].
The COSSY algorithm partitions an interaction network into smaller, closely connected subnetworks using a non-greedy approach. It ranks these subnetworks based on the expression patterns of their respective genes, assigning an entropy score to indicate their importance. Lower scores correspond to higher significance. The algorithm selects the five most differentially expressed genes for each subnetwork using a modified Welch’s t-statistic based on the interquartile range (IQR). If multiple subnetworks significantly overlap, they are merged to create a new subnetwork. The COSSY algorithm then clusters samples using the expression values of the representative genes and calculates an entropy score based on the distribution of different sample classes in each cluster [18,19].

4.3. Classification

Activity scores for each subnetwork were calculated by subtracting the average expression of down-regulated genes from the average expression of up-regulated genes for each sample. These scores were then used as feature values to construct classification models, using the GSE36295 dataset as the training set. A K-nearest neighbor (KNN) algorithm was employed for classifier construction, with a 2-level nested cross-validation approach (10 outer and 10 inner partitions) ensuring robust model validation. The KNN classifier was trained using the city block distance measure with k = 5 neighbors. Classification performance was evaluated on the TCGA dataset (460 tumors and 62 normal controls) by assessing accuracy, sensitivity, specificity, and AUC [9].

4.4. Survival Analysis

Kaplan–Meier survival analyses were performed using the identified subnetwork biomarkers on two transcriptomic datasets: GSE96058 (Dataset 1; n = 2976 breast cancer samples) [29,30] and an additional dataset (Dataset 2; n = 1561) [29,30,31]. The significance between survival curves was calculated using the log-rank test, with the statistical significance threshold set at p-value < 0.05.

5. Conclusions

In conclusion, this study identified novel subnetwork biomarkers for breast cancer with diagnostic and prognostic potential. The integration of gene expression data with PPI networks offers a systems biology approach that captures the complexity of molecular interactions underlying breast cancer. These findings lay the foundation for developing more precise diagnostic, prognostic, and therapeutic strategies for various cancers, thereby contributing to improved patient outcomes. Future research should focus on validating these subnetwork biomarkers across diverse populations, integrating additional omics data and exploring their utility in predicting responses to various treatments, including targeted therapies and immunotherapies.

Author Contributions

Conceptualization, D.C.; methodology, D.C. and O.A.-H.; validation, D.C. and O.A.-H.; formal analysis, D.C. and O.A.-H.; investigation, D.C. and O.A.-H.; writing—original draft preparation, D.C. and O.A.-H.; writing—review and editing, D.C., O.A.-H., A.E.A. and N.K.; visualization, O.A.-H.; supervision, D.C.; project administration, D.C.; funding acquisition, D.C. and N.K. All authors have read and agreed to the published version of the manuscript.

Funding

This study was funded by a research grant (RAC#2110006 to DC) and the King Salman Center for Disability Research (RAC: 2180 004, NK). The funder had no role in the study design or the collection, analysis, and interpretation of the results.

Institutional Review Board Statement

Not applicable.

Informed Consent Statement

Not applicable.

Data Availability Statement

We used publicly available datasets in this study from The Cancer Genome Atlas (TCGA) and Gene Expression Omnibus (GEO).

Acknowledgments

We would like to thank the King Faisal Specialist Hospital and Research Centre (KFSH&RC in Riyadh) Research and Innovation Administration team for their support. This work was part of an institutionally approved King Faisal Specialist Hospital and Research Centre project (RAC# 2110006). We also thank the King Salman Center for Disability Research for its generous support of Namik Kaya (grant no., RAC: 2180 004). This article is a revised and expanded version of the abstract, which was presented at the European Society of Human Genetics (ESHG) Virtual Conference (10–13 June 2023), Glasgow, Scotland, UK [32].

Conflicts of Interest

The authors declare no conflicts of interest. The funders had no role in the design of the study; in the collection, analyses, or interpretation of data; in the writing of the manuscript; or in the decision to publish the results.

References

  1. Sung, H.; Ferlay, J.; Siegel, R.L.; Laversanne, M.; Soerjomataram, I.; Jemal, A.; Bray, F. Global cancer statistics 2020: GLOBOCAN estimates of incidence and mortality worldwide for 36 cancers in 185 countries. CA Cancer J. Clin. 2021, 71, 209–249. [Google Scholar] [CrossRef]
  2. Denkert, C.; Liedtke, C.; Tutt, A.; von Minckwitz, G. Molecular alterations in triple-negative breast cancer-the road to new treatment strategies. Lancet 2017, 389, 2430–2442. [Google Scholar] [CrossRef] [PubMed]
  3. Harbeck, N.; Penault-Llorca, F.; Cortes, J.; Gnant, M.; Houssami, N.; Poortmans, P.; Ruddy, K.; Tsang, J.; Cardoso, F. Breast cancer. Nat. Rev. Dis. Primers 2019, 5, 66. [Google Scholar] [CrossRef] [PubMed]
  4. Perou, C.M.; Sorlie, T.; Eisen, M.B.; van de Rijn, M.; Jeffrey, S.S.; Rees, C.A.; Pollack, J.R.; Ross, D.T.; Johnsen, H.; Akslen, L.A.; et al. Molecular portraits of human breast tumours. Nature 2000, 406, 747–752. [Google Scholar] [CrossRef] [PubMed]
  5. Curtis, C.; Shah, S.P.; Chin, S.F.; Turashvili, G.; Rueda, O.M.; Dunning, M.J.; Speed, D.; Lynch, A.G.; Samarajiwa, S.; Yuan, Y.Y.; et al. The genomic and transcriptomic architecture of 2000 breast tumours reveals novel subgroups. Nature 2012, 486, 346–352. [Google Scholar] [CrossRef]
  6. Colak, D.; Nofal, A.; AlBakheet, A.; Nirmal, M.; Jeprel, H.; Eldali, A.; AL-Tweigeri, T.; Tulbah, A.; Ajarim, D.; Al Malik, O.; et al. Age-Specific Gene Expression Signatures for Breast Tumors and Cross-Species Conserved Potential Cancer Progression Markers in Young Women. PLoS ONE 2013, 8, e63204. [Google Scholar] [CrossRef]
  7. Barabási, A.L.; Gulbahce, N.; Loscalzo, J. Network medicine: A network-based approach to human disease. Nat. Rev. Genet. 2011, 12, 56–68. [Google Scholar] [CrossRef]
  8. Al-Harazi, O.; El Allali, A.; Colak, D. Biomolecular Databases and Subnetwork Identification Approaches of Interest to Big Data Community: An Expert Review. Omics 2019, 23, 138–151. [Google Scholar] [CrossRef]
  9. Al-Harazi, O.; Kaya, I.H.; El Allali, A.; Colak, D. A Network-Based Methodology to Identify Subnetwork Markers for Diagnosis and Prognosis of Colorectal Cancer. Front. Genet. 2021, 12, 721949. [Google Scholar] [CrossRef]
  10. Kim, M.; Lee, S.; Lim, S.; Lee, D.Y.; Kim, S. Subnetwork representation learning for discovering network biomarkers in predicting lymph node metastasis in early oral cancer. Sci. Rep. 2022, 12, 488. [Google Scholar] [CrossRef]
  11. Al-Harazi, O.; Al Insaif, S.; Al-Ajlan, M.A.; Kaya, N.; Dzimiri, N.; Colak, D. Integrated Genomic and Network-Based Analyses of Complex Diseases and Human Disease Network. J. Genet. Genom. 2016, 43, 349–367. [Google Scholar] [CrossRef] [PubMed]
  12. Caldera, M.; Buphamalai, P.; Müller, F.; Menche, J. Interactome-based approaches to human disease. Curr. Opin. Syst. Biol. 2017, 3, 88–94. [Google Scholar] [CrossRef]
  13. Doungpan, N.; Engchuan, W.; Chan, J.H.; Meechai, A. GSNFS: Gene subnetwork biomarker identification of lung cancer expression data. BMC Med. Genom. 2016, 9, 70. [Google Scholar] [CrossRef] [PubMed]
  14. Gyorffy, B.; Lanczky, A.; Eklund, A.C.; Denkert, C.; Budczies, J.; Li, Q.; Szallasi, Z. An online survival analysis tool to rapidly assess the effect of 22,277 genes on breast cancer prognosis using microarray data of 1809 patients. Breast Cancer Res. Treat. 2010, 123, 725–731. [Google Scholar] [CrossRef] [PubMed]
  15. Wu, G.M.; Stein, L. A network module-based method for identifying cancer prognostic signatures. Genome Biol. 2012, 13, R112. [Google Scholar] [CrossRef]
  16. Cao, B.W.; Patel, K.B.; Li, T.Y.; Yao, S.J.; Chung, C.H.; Wang, X.F. A subnetwork-based framework for prioritizing and evaluating prognostic gene modules from cancer transcriptome data. Iscience 2023, 26, 105915. [Google Scholar] [CrossRef]
  17. Szklarczyk, D.; Franceschini, A.; Wyder, S.; Forslund, K.; Heller, D.; Huerta-Cepas, J.; Simonovic, M.; Roth, A.; Santos, A.; Tsafou, K.P.; et al. STRING v10: Protein-protein interaction networks, integrated over the tree of life. Nucleic Acids Res. 2015, 43, D447–D452. [Google Scholar] [CrossRef]
  18. Saha, A.; Jeon, M.; Tan, A.C.; Kang, J. iCOSSY: An Online Tool for Context-Specific Subnetwork Discovery from Gene Expression Data. PLoS ONE 2015, 10, e0131656. [Google Scholar] [CrossRef]
  19. Saha, A.; Tan, A.C.; Kang, J. Automatic Context-Specific Subnetwork Discovery from Large Interaction Networks. PLoS ONE 2014, 9, e84227. [Google Scholar] [CrossRef]
  20. Kahm, Y.J.; Kim, I.G.; Jung, U.; Lee, J.H.; Kim, R.K. Impact of KIF4A on Cancer Stem Cells and EMT in Lung Cancer and Glioma. Cancers 2023, 15, 5523. [Google Scholar] [CrossRef]
  21. Carmeliet, P.; Jain, R.K. Molecular mechanisms and clinical applications of angiogenesis. Nature 2011, 473, 298–307. [Google Scholar] [CrossRef] [PubMed]
  22. Taniwaki, M.; Takano, A.; Ishikawa, N.; Yasui, W.; Inai, K.; Nishimura, H.; Tsuchiya, E.; Kohno, N.; Nakamura, Y.; Daigo, Y. Activation of KIF4A as a prognostic biomarker and therapeutic target for lung cancer. Clin. Cancer Res. 2007, 13, 6624–6631. [Google Scholar] [CrossRef] [PubMed]
  23. Shao, M.T.; Hu, Y.Z.; Ding, H.; Wu, Q.; Pan, J.H.; Zhao, X.X.; Pan, Y.L. The overexpression of ZWINT in integrated bioinformatics analysis forecasts poor prognosis in breast cancer. Transl. Cancer Res. 2020, 9, 187–193. [Google Scholar] [CrossRef] [PubMed]
  24. Zhou, G.R.; Shen, M.Y.; Zhang, Z.Y. ZW10 Binding Factor (ZWINT), a Direct Target of Mir-204, Predicts Poor Survival and Promotes Proliferation in Breast Cancer. Med. Sci. Monit. 2020, 26, e921659. [Google Scholar] [CrossRef]
  25. Xiong, Y.; Lu, J.; Fang, Q.L.; Lu, Y.Y.; Xie, C.R.; Wu, H.T.; Yin, Z.Y. UBE2C functions as a potential oncogene by enhancing cell proliferation, migration, invasion, and drug resistance in hepatocellular carcinoma cells. Biosci. Rep. 2019, 39, Bsr20182384. [Google Scholar] [CrossRef]
  26. Liu, Y.J.; Zhu, Z.C.; Xiong, Z.Q.; Zheng, J.; Hui, Z.L.; Qiu, J.F. Knockdown of protein tyrosine phosphatase receptor U inhibits growth and motility of gastric cancer cells. Int. J. Clin. Exp. Pathol. 2014, 7, 5750–5761. [Google Scholar]
  27. Gao, B.; Wu, X.J.; Bu, L.; Jiang, Q.W.; Wang, L.; Liu, H.N.; Zhang, X.M.; Wu, Y.Z.; Li, X.X.; Li, J.T.; et al. Atypical inflammatory kinase IKBKE phosphorylates and inactivates FoxA1 to promote liver tumorigenesis. Sci. Adv. 2024, 10, eadk2285. [Google Scholar] [CrossRef]
  28. Shannon, P.; Markiel, A.; Ozier, O.; Baliga, N.S.; Wang, J.T.; Ramage, D.; Amin, N.; Schwikowski, B.; Ideker, T. Cytoscape: A software environment for integrated models of biomolecular interaction networks. Genome Res. 2003, 13, 2498–2504. [Google Scholar] [CrossRef]
  29. Brueffer, C.; Vallon-Christersson, J.; Grabau, D.; Ehinger, A.; Hakkinen, J.; Hegardt, C.; Malina, J.; Chen, Y.L.; Bendahl, P.O.; Manjer, J.; et al. Clinical Value of RNA Sequencing-Based Classifiers for Prediction of the Five Conventional Breast Cancer Biomarkers: A Report From the Population-Based Multicenter Sweden Cancerome Analysis Network-Breast Initiative. JCO Precis. Oncol. 2018, 2, 1–18. [Google Scholar] [CrossRef]
  30. Gyorffy, B. Survival analysis across the entire transcriptome identifies biomarkers with the highest prognostic power in breast cancer. Comput. Struct. Biotechnol. J. 2021, 19, 4101–4109. [Google Scholar] [CrossRef]
  31. Aguirre-Gamboa, R.; Gomez-Rueda, H.; Martinez-Ledesma, E.; Martinez-Torteya, A.; Chacolla-Huaringa, R.; Rodriguez-Barrientos, A.; Tamez-Pena, J.G.; Trevino, V. SurvExpress: An online biomarker validation tool and database for cancer gene expression data using survival analysis. PLoS ONE 2013, 8, e74250. [Google Scholar] [CrossRef]
  32. Colak, D.; Elallali, A.; Kaya, I.; Alharazi, O. Identification of subnetwork markers with diagnostic and prognostic potential for women with breast cancer. Eur. J. Hum. Genet. 2024, 32, 267. [Google Scholar]
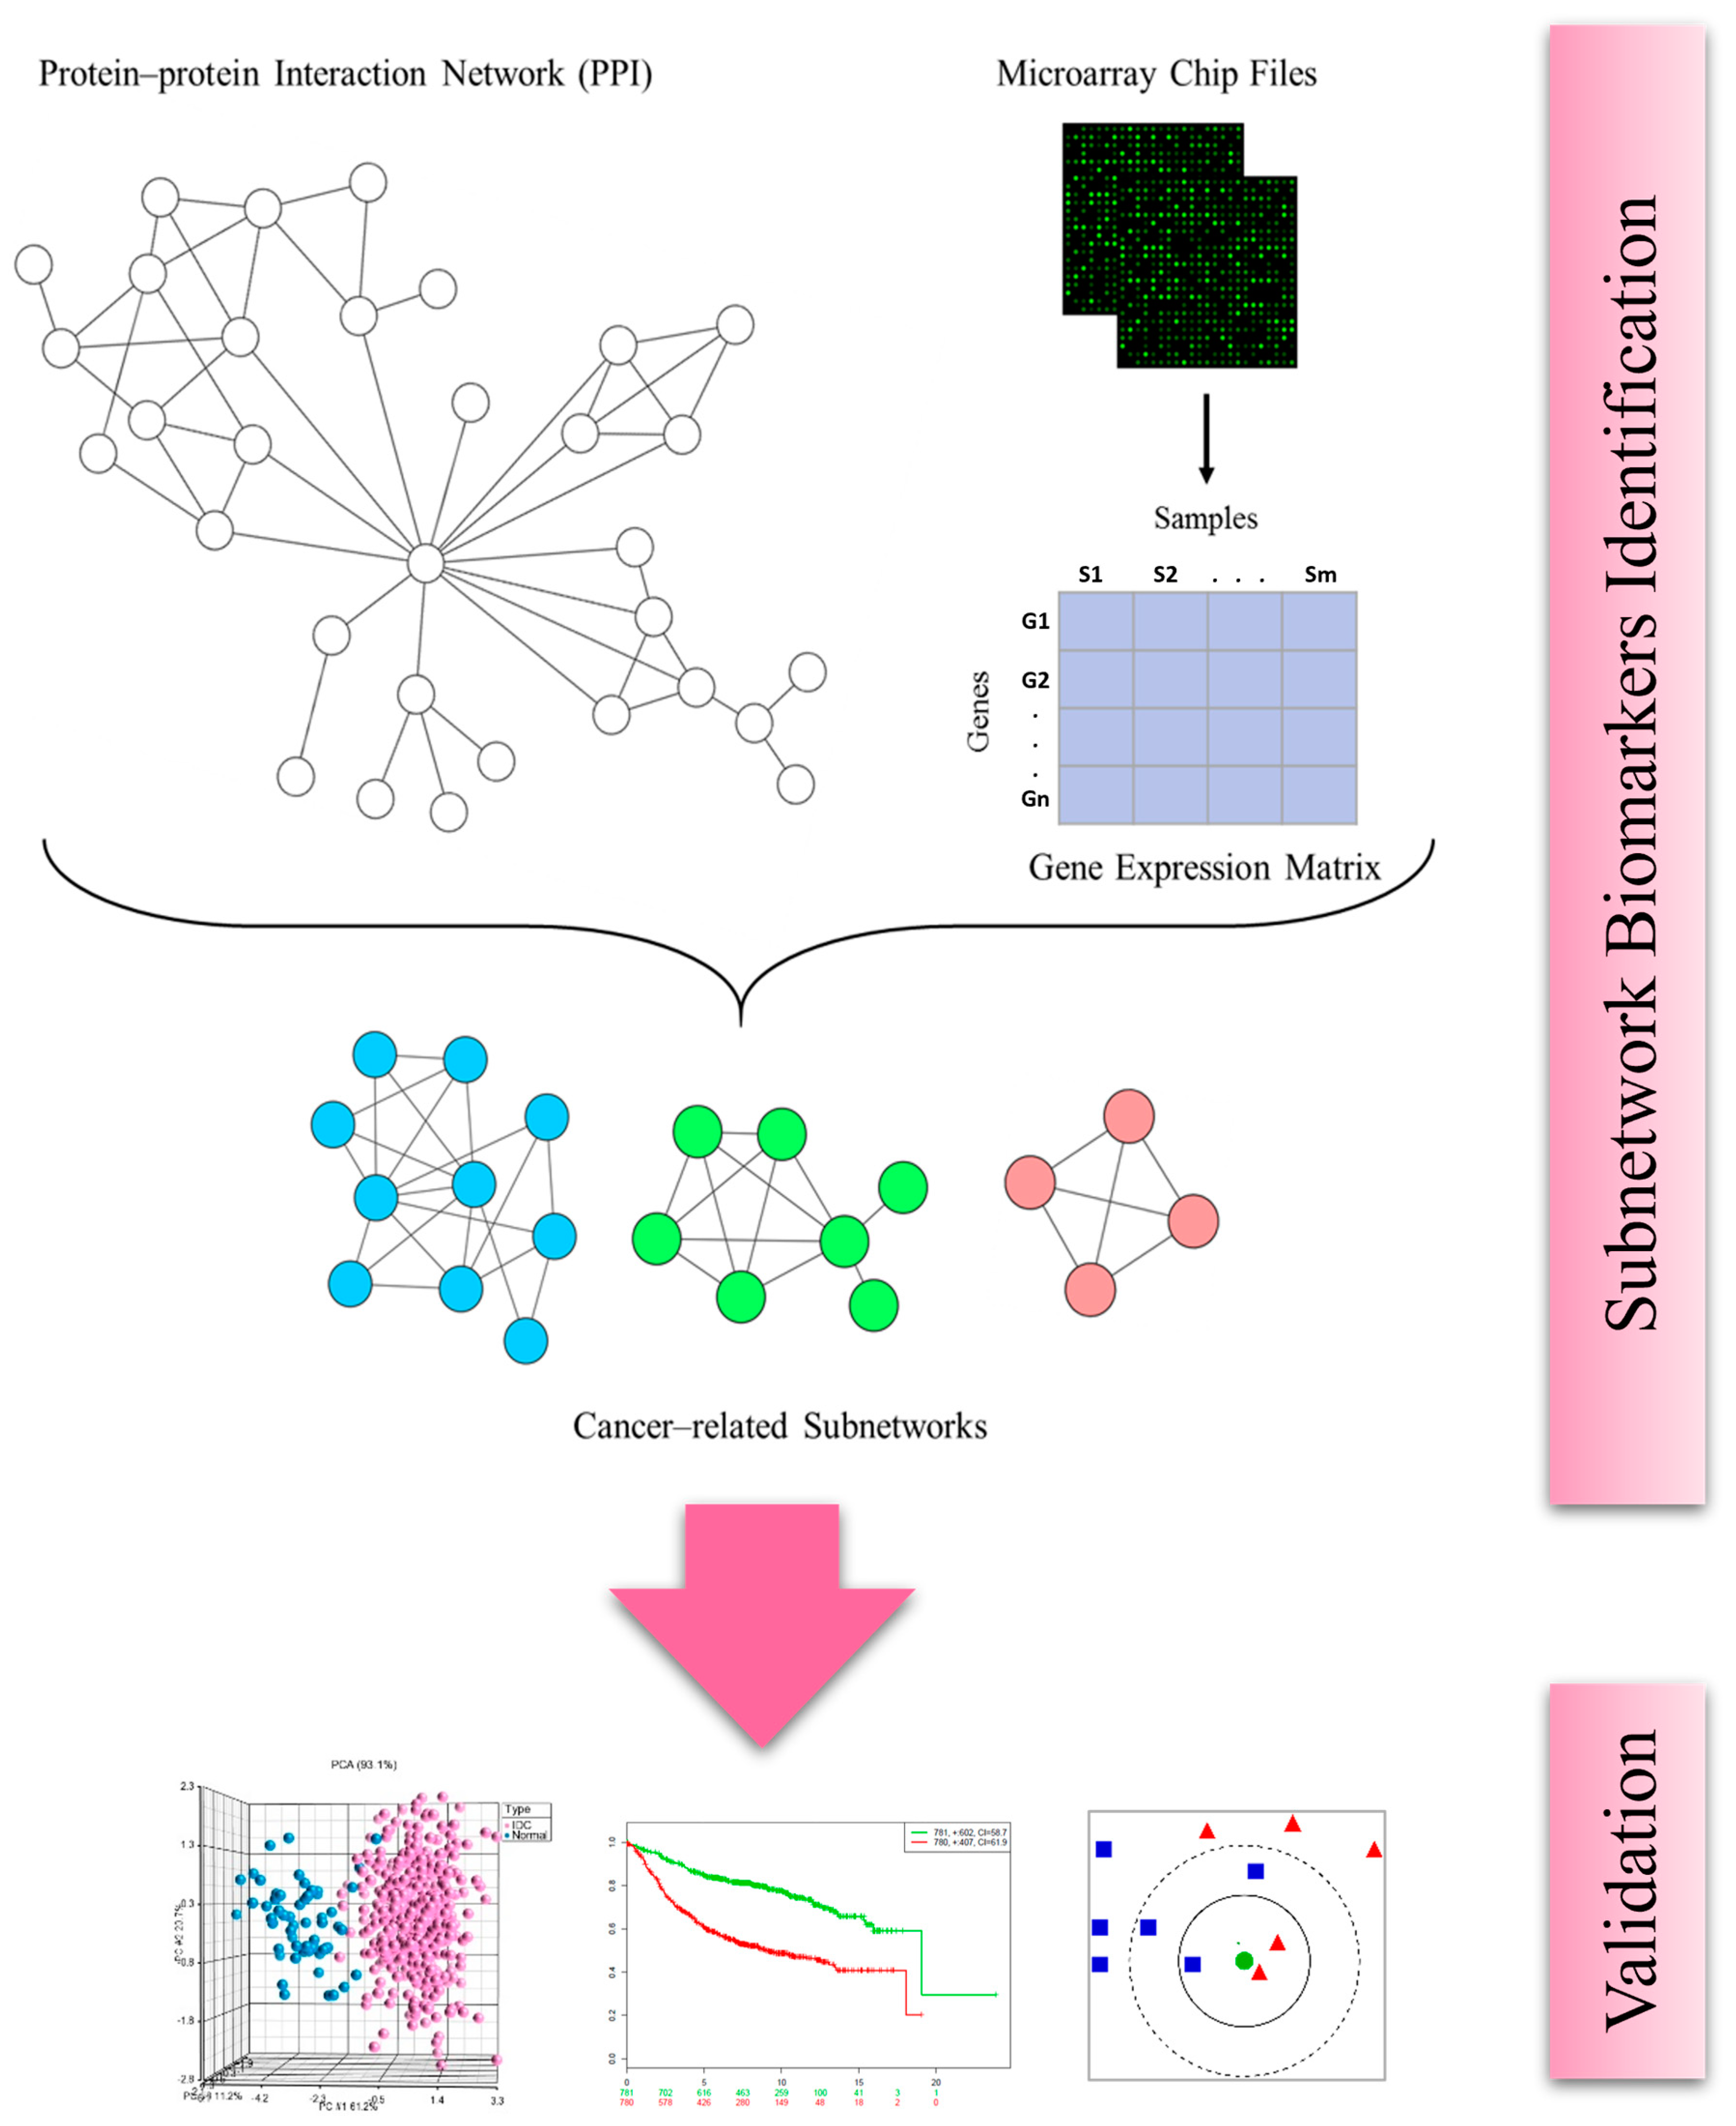
Figure 1. Schematic flowchart illustrating the methodology.
Ijms 25 12779 g001
Figure 2. Four significant subnetworks associated with breast cancer: (A) Subnetwork 1, (B) Subnetwork 2, (C) Subnetwork 3, and (D) Subnetwork 4. Red nodes indicate over-expressed genes in breast cancer and green nodes indicate under-expressed ones.
Ijms 25 12779 g002
Figure 3. Unsupervised principal component analysis (PCA) of samples from GSE36295 (n = 39 samples) (A) and TCGA (n = 522 samples) (B) using the identified subnetwork biomarkers. Pink spheres indicate tumor; blue spheres indicate normal. The PCA analysis clearly distinguished breast cancer patients from normal controls.
Ijms 25 12779 g003
Figure 4. Prognostic significance of subnetwork markers. Overall survival (OS) analysis of breast tumor samples in Dataset 1 (n = 2976 samples in GSE96058) (A), recurrence-free survival (RFS) analysis of breast tumor samples in Dataset 2 (n = 1561) (B), and patients stratified into ER (−) and ER (+), respectively (C,D). Kaplan–Meier curves for risk groups; patients with high scores (“high-risk group”) had significantly lower recurrence-free survival compared to the low-risk group.
Ijms 25 12779 g004
Table 1. Gene Ontology (GO) enrichment analysis of four subnetworks.
GO Biological Process Termp-ValueGenes
Subnetwork 1
blood vessel development1.8 × 10−7NRP2, SLC12A6, SERPINF1, ID1, GATA6, NOTCH4, VEGFA, ZC3H12A, SEMA3C, ESM1
angiogenesis2.0 × 10−7NRP2, SLC12A6, SERPINF1, ID1, GATA6, NOTCH4, VEGFA, ZC3H12A, ESM1
gland development3.6 × 10−6TNFRSF11A, SERPINF1, GATA6, HOXD3, NOTCH4, VEGFA, SEMA3C, NKX2-3
regulation of cell proliferation1.4 × 10−5NRP2, TNFRSF11A, SERPINF1, ID1, SPEG, GATA6, VEGFA, TXK, ESM1, NR4A3, NKX2-3, THPO
cell surface receptor signaling pathway1.8 × 10−5NRP2, ERH, NR4A3, ESM1, HOMER1, TNFRSF11A, ID1, GATA6, HOXD3, NOTCH4, VEGFA, SEMA3C, TXK, CRIM1, THPO
Subnetwork 2
cell surface receptor signaling pathway5.2 × 10−4GPR83, STYK1, STAP1, SHARPIN, VIL1, SPRED1, PTPRU, KIT, PTPRO
enzyme-linked receptor protein signaling pathway7.9 × 10−4STYK1, STAP1, VIL1, SPRED1, PTPRU, KIT
cell migration2.1 × 10−3STYK1, STAP1, VIL1, PTPRU, KIT, PTPRO
movement of cell or subcellular component2.2 × 10−3STYK1, LYVE1, STAP1, VIL1, PTPRU, KIT, PTPRO
cell motility3.5 × 10−3STYK1, STAP1, VIL1, PTPRU, KIT, PTPRO
Subnetwork 3
sister chromatid cohesion8.7 × 10−10CENPO, CENPQ, ZWINT, CENPP, KNTC1, RANGAP1, CENPI
CENP-A-containing chromatin organization7.1 × 10−6CENPO, CENPQ, CENPP, CENPI
DNA replication-independent nucleosome assembly1.4 × 10−5CENPO, CENPQ, CENPP, CENPI
histone exchange1.9 × 10−5CENPO, CENPQ, CENPP, CENPI
single-organism organelle organization2.5 × 10−4CENPO, TTBK2, CENPQ, ZWINT, CENPP, KNTC1, RANGAP1, CENPI
Subnetwork 4
cell division3.4 × 10−12KIF14, KIF2C, FAM64A, KIF4A, CDCA8, PRC1, EVI5, ESPL1, UBE2C, KIF20A
mitotic nuclear division2.2 × 10−9KIF14, KIF2C, FAM64A, KIF4A, CDCA8, PRC1, ESPL1, UBE2C
chromosome segregation2.6 × 10−8KIF14, KIF2C, KIF4A, CDCA8, PRC1, ESPL1, UBE2C
organelle fission2.8 × 10−8KIF14, KIF2C, FAM64A, KIF4A, CDCA8, PRC1, ESPL1, UBE2C
cell cycle4.6 × 10−8KIF14, KIF2C, FAM64A, KIF4A, CDCA8, PRC1, EVI5, ESPL1, UBE2C, KIF20A
Disclaimer/Publisher’s Note: The statements, opinions and data contained in all publications are solely those of the individual author(s) and contributor(s) and not of MDPI and/or the editor(s). MDPI and/or the editor(s) disclaim responsibility for any injury to people or property resulting from any ideas, methods, instructions or products referred to in the content.