Article

Alterations in Striatal Architecture and Biochemical Markers’ Levels During Postnatal Development in the Rat Model of an Attention Deficit/Hyperactivity Disorder (ADHD)

by
Ewelina Bogdańska-Chomczyk
1,*,
Paweł Wojtacha
2,
Meng-Li Tsai
3,
Andrew Chih Wei Huang
4 and
Anna Kozłowska
1
1
Department of Human Physiology and Pathophysiology, School of Medicine, Collegium Medicum, University of Warmia and Mazury, Warszawska 30, 10-082 Olsztyn, Poland
2
Department of Psychology and Sociology of Health and Public Health, University of Warmia and Mazury, Warszawska 30, 10-082 Olsztyn, Poland
3
Department of Biomechatronic Engineering, National Ilan University, Ylan 26047, Taiwan
4
Department of Psychology, Fo Guang University, Ylan 26247, Taiwan
*
Author to whom correspondence should be addressed.
Int. J. Mol. Sci. 2024, 25(24), 13652; https://doi.org/10.3390/ijms252413652
Submission received: 6 November 2024 / Revised: 4 December 2024 / Accepted: 11 December 2024 / Published: 20 December 2024
(This article belongs to the Section Molecular Pathology, Diagnostics, and Therapeutics)

Abstract

:
Attention deficit/hyperactivity disorder (ADHD) is defined as a neurodevelopmental condition. The precise underlying mechanisms remain incompletely elucidated. A body of research suggests disruptions in both the cellular architecture and neuronal function within the brain regions of individuals with ADHD, coupled with disturbances in the biochemical parameters. This study seeks to evaluate the morphological characteristics with a volume measurement of the striatal regions and a neuron density assessment within the studied areas across different developmental stages in Spontaneously Hypertensive Rats (SHRs) and Wistar Kyoto Rats (WKYs). Furthermore, the investigation aims to scrutinize the levels and activities of specific markers related to immune function, oxidative stress, and metabolism within the striatum of juvenile and maturing SHRs compared to WKYs. The findings reveal that the most pronounced reductions in striatal volume occur during the juvenile stage in SHRs, alongside alterations in neuronal density within these brain regions compared to WKYs. Additionally, SHRs exhibit heightened levels and activities of various markers, including RAC-alpha serine/threonine-protein kinase (AKT-1), glucocorticoid receptor (GCsRβ), malondialdehyde (MDA), sulfhydryl groups (-SH), glucose (G), iron (Fe), lactate dehydrogenase (LDH). alanine transaminase (ALT), and aspartate transaminase (AST). In summary, notable changes in striatal morphology and elevated levels of inflammatory, oxidative, and metabolic markers within the striatum may be linked to the disrupted brain development and maturation observed in ADHD.

1. Introduction

Attention deficit hyperactivity disorder (ADHD) is one of the most prevalent neurodevelopmental disorders that predominantly emerges in childhood, although it often persists into adolescence and adulthood [1]. It is characterized by developmentally inappropriate enduring inattention, impulsivity, and hyperactivity patterns. These symptoms significantly disrupt daily functioning, academic achievement, occupational performance, and social interactions [2]. It has been found that ADHD is prevalent in about 11.4% of children and 6.76% of adults [3,4]. Moreover, the condition is twice as common in males as in females [5]. It is one of the most heritable mental disorders. Furthermore, smoking during pregnancy, nutritional deficiencies, fetal alcohol exposure, and viral infections have also been recognized as causes of ADHD [6].
Ultimately, the exact pathogenesis of disorder has not been sufficiently understood. Neuroimaging studies have revealed structural and functional abnormalities in specific brain regions of individuals with ADHD. For example, Almeida et al. [7] have shown a reduced right frontal cortical thickness in children, adolescents, and adults with this disorder. In addition, the cohort lifetime study has demonstrated reduced fronto-striatal volumes in ADHD children patients [8]. Several studies using volumetric brain imaging techniques have highlighted the significant involvement of the basal ganglia (BG) in the underlying mechanisms of ADHD [9,10,11,12,13,14,15,16]. The BG is a group of subcortical nuclei (clusters of neurons), including the two output nuclei: the globus pallidus internal segment, substantia nigra pars reticulata, and the main input nucleus—the striatum (CPu; caudate putamen) [17]. The BG receives input from the neocortex via the striatum, where the sensory and cognitive information is processed and integrated. Next, the BG relay those signals to the prefrontal cortex (PFC), which is responsible for motor planning, coordination, cognitive control, and the ability to adapt and learn new movements [18]. It should be noted that abnormalities in the striatum are closely associated with ADHD symptoms, affecting key areas of behavior and cognitive functions. Specifically, concentration problems in ADHD may stem from deficits in the role of the striatum in the reward system, leading to difficulties in maintaining attention, particularly during tasks that do not provide immediate satisfaction [19,20]. Furthermore, hyperactivity and impulsivity in ADHD are also linked to striatal dysfunction, which is crucial for motor control, planning, and inhibiting inappropriate behaviors. Individuals with ADHD may struggle with executive functions, such as cognitive flexibility and planning, due to disrupted connections between the striatum and the PFC [21]. The literature indicates that, neurobiologically, ADHD is associated with dopaminergic dysfunction in the striatum, which plays a key role in motivation and attention. Notably, the study by Castellanos et al. [22], employing a magnetic resonance imaging (MRI) investigation on monozygotic twins discordant for ADHD, unveiled a substantial reduction in the volume of the CPu. Additionally, a separate neuroimaging study involving school-aged girls with ADHD demonstrated a correlation between diminished volumes of the pallidum and CPu and the severity of ADHD symptoms and cognitive performance [23]. In addition, it have been shown that the ventral striatum exhibits a smaller volume [24,25] and lower activation during reward anticipation in ADHD individuals [19]. Moreover, several studies have reported altered functional connectivity, particularly in the caudate nucleus and putamen, further linking striatal abnormalities to the core symptoms of ADHD [26,27,28]. Interestingly, researchers suggested that the volume changes in the CPu seen in children with ADHD might not be permanent but temporary [10]. Notably, these differences were more pronounced in younger children, gradually diminishing as the individuals approached adolescence [10]. Intriguingly, our team’s prior investigations, conducted on the validated Spontaneously Hypertensive Rat (SHR) model of ADHD, yielded insights into volume alterations in movement-related regions among juvenile SHRs. These alterations encompassed reductions in the PFC [29], primary motor cortex (M1), and secondary motor cortex (M2) [30], and a decrease in the total striatal volume [31].
Moreover, the current literature underscores that ADHD is recognized as a multifaceted disorder, attributed to the intricate interplay of various interconnected factors and dimensions [32]. Consequently, an increasing number of researchers are emphasizing the significance of the immune system, oxidative stress balance, and metabolic alterations in the pathophysiological underpinnings of this disorder [29,33,34,35,36]. For instance, previous research conducted by our team has revealed elevated levels of specific cytokines, including interleukin (IL)-1β, IL-6, tumor necrosis factor α (TNF-α), and transforming growth factor β (TGF-β), in both the splenic and serum samples [29]. This elevation in cytokine levels was found to be associated with reductions in the PFC volume and abnormalities in the dopaminergic system in juvenile SHRs. Ongoing research has yielded varied findings regarding the potential association between ADHD and inflammatory cytokines in pediatric populations [37,38,39]. However, several investigations have documented elevated levels of pro-inflammatory cytokines, notably interleukin (IL)-10, IL-6, IL-1β, and TNF-α, in children diagnosed with ADHD in comparison to their typically developing counterparts [38,39,40,41,42]. Some studies have indicated that cytokines may modulate the activity of neural circuits within the basal ganglia and dopamine (DA) synthesis [43,44]. Furthermore, it is well-established that elevated levels of pro-inflammatory cytokines can significantly influence oxidative stress [45]. Specifically, IL-1β, IL-6, and TNF-α, are recognized for their involvement in promoting oxidative stress through various pathways: inducing Reactive Oxygen Species (ROS) production, disrupting antioxidant defense systems, activating inflammatory signaling pathways, impairing mitochondrial function, and impeding cellular repair mechanisms, contributing to redox imbalance [46,47]. While evidence suggests that ROS may play a role in certain neuropsychiatric and neurodevelopmental disorders, including ADHD, the relationship is complex and not yet fully understood [36,48,49,50,51]. Research has yielded some evidence of redox imbalance in individuals with ADHD, but the findings are inconsistent across all studies. Some studies have reported elevated markers of oxidative stress, such as increased levels of lipid peroxidation and a reduced antioxidant capacity, in individuals with ADHD compared to control groups [36,50]. This state can damage cellular components, including DNA, proteins, and lipids, which may have implications for brain function and structure [52,53]. To date, it is not currently clear whether oxidative stress directly causes ADHD or is a consequence of the disorder.
It is noteworthy to mention some evidence suggests that certain brain regions in individuals with ADHD may exhibit altered metabolism compared to typically developing controls. More precisely, single-photon emission computed tomography (SPECT) or positron emission tomography (PET) has documented decreased metabolic activity in the fronto-striatal regions among individuals diagnosed with ADHD [54,55,56,57]. Moreover, Lou et al. [58,59,60,61] have consistently identified reduced blood flow (hypoperfusion) in the striatal areas using SPECT, especially within the caudate nuclei region in ADHD children. Additionally, the study using fluorodeoxyglucose PET revealed that individuals with ADHD exhibited a decrease in cerebral glucose (G) metabolism in the frontal cortex while they performed an auditory attention task [57]. Similarly, our published findings have revealed elevated G levels and other metabolic markers within the PFC of juvenile SHRs [30]. These findings are in alignment with the research previously mentioned. However, the relationship between these neuroimaging findings and clinical symptoms of ADHD is complex and not fully understood. Neuroimaging studies contribute to the understanding of the neurobiology of this disorder, but the condition remains multifaceted, and its exact mechanisms still needed to be explored.
The aforementioned studies involving individuals with ADHD have enabled the observation of significant anatomical alterations within various brain regions. Nevertheless, exploring ADHD remains challenging for several reasons: heterogeneity due to treatment effects or sample size, especially when investigating age-dependent brain structure abnormalities. Thus, animal models offer a valuable opportunity to see developmental changes in the brain due to the availability of brain tissue, which provides a study of ADHD-related changes across the lifespan in a shorter time frame than humans. Moreover, laboratory settings allow for precise control over environmental variables, such as diet, stress levels, and exposure to toxins, which can help isolate specific factors contributing to ADHD and also eliminate other interfering factors: comorbidities (such as anxiety, depression, and learning disorders), as well as environmental influences (parenting, socioeconomic status, diet, and exposure to toxins). Thus, integrating human and rodent research approaches allows for a more comprehensive understanding of ADHD, its causes, and potential treatments.
To date, the SHR animal model has been extensively validated in terms of descriptive, construct, and predictive validity. The predictive validity of the SHR model in ADHD is supported by evidence that SHRs exhibit hyperactivity, impulsivity, and attention deficits, as well as learning and memory impairments—symptoms of ADHD that are also present in humans [62,63,64]. Additionally, SHRs show age-specific patterns of hyperactivity, impulsivity, and attention deficits, which closely mimic the developmental trajectory of ADHD in humans. For example, symptoms in SHRs tend to emerge during periods corresponding to childhood and adolescence in humans, making them particularly relevant for studying the early onset and progression of this disorder symptoms over time. Additionally, SHRs demonstrate neurobiological correlations with ADHD patients [65]. Specifically, these animals exhibit alterations in dopaminergic signaling, particularly in brain regions such as the motor and prefrontal cortex, which are also involved in the neurobiology of ADHD in humans [66]. SHRs have been found to have reduced dopamine transporter (DAT) density and altered dopamine receptor (DR) function, leading to imbalances in DA levels that are believed to underlie many of the symptoms of ADHD [67,68]. Another piece of key evidence supporting the predictive validity of the studied model, and justifying the use of SHRs in ADHD research, is their ability to respond to drugs used to treat this condition. Specifically, methylphenidate, atomoxetine, and amphetamines have been shown to reduce hyperactivity and improve attention in SHRs, similar to their effects in people with ADHD [68,69].
It is also important to note that this experiment focuses on SHRs aged between 4 to 10 weeks to investigate changes in the striatal regions associated with ADHD. This age range covers key developmental stages in the pathology of this neurodevelopmental disorder. However, it is worth considering whether hypertension (a characteristic feature of SHRs) might influence the results of this study. According to the literature, the early development of hypertension in SHRs begins after 7 weeks of age [70]. In this study, most of the neuroanatomical and biochemical changes were observed between 4 and 7 weeks of age, which allowed us to minimize the impact of hypertension on the results. It is worth noting that adult SHRs also exhibit behavioral and neurotransmitter abnormalities in key brain areas involved in ADHD [71]. However, these alterations differ significantly from those observed in juvenile animals. More specifically, adult SHRs show cognitive dysfunction, increased anxiety, and impaired learning and memory abilities [71]—symptoms that parallel those seen in adults with ADHD [72]. Additionally, adult SHRs display neurotransmitter irregularities that hinder synaptic communication [71], which is consistent with the neurotransmitter imbalances found in adults with ADHD [72]. These abnormalities are particularly evident in brain regions involved in attention regulation, such as the PFC and striatum. Similar to human ADHD, these neurotransmitter disruptions in adult SHRs contribute to persistent difficulties in executive function, emotional regulation, and impulse control. Thus, the adult SHR model mirrors key aspects of ADHD in humans, further strengthening the rationale for using this animal model in ADHD research.
In light of the preceding considerations, the objectives of the current study were to (a) delineate age-related (from 4 until 10 weeks) alterations in the volume of distinct striatal regions (the caudate putamen (CPu), external globus pallidus (EGP), lateral accumbens shell (LaCBsH), and nucleus accumbens core (AcbC)) and the neuronal density within these regions in the SHRs (rat model of ADHD) and WKY rats (control animals) aged 4–10 weeks, which encompass the developmental stages from weaning to the onset of puberty; (b) assess the concentrations of specific immune (interleukin (IL)-1α, IL-1β, IL-6, serine/threonine-protein mammalian target of rapamycin (mTOR), glucocorticoid receptor (GCsRβ), transforming growth factor beta (TGF-β), and RAC-alpha serine/threonine-protein kinase (AKT-1)), oxidative stress (malondialdehyde (MDA), sulfhydryl group (-SH), superoxide dismutase (SOD), peroxidase (POD), glutathione reductase (GSR), and glutathione S transferases (GST)), and metabolic (glucose (G), fructosamine (FrAm), iron (Fe), lactic acid (LA), lactate dehydrogenase (LDH), alanine transaminase (ALT) and aspartate transaminase (AST)) markers in the striatum of juvenile (5 weeks) and maturing (10 weeks) SHRs.

2. Results

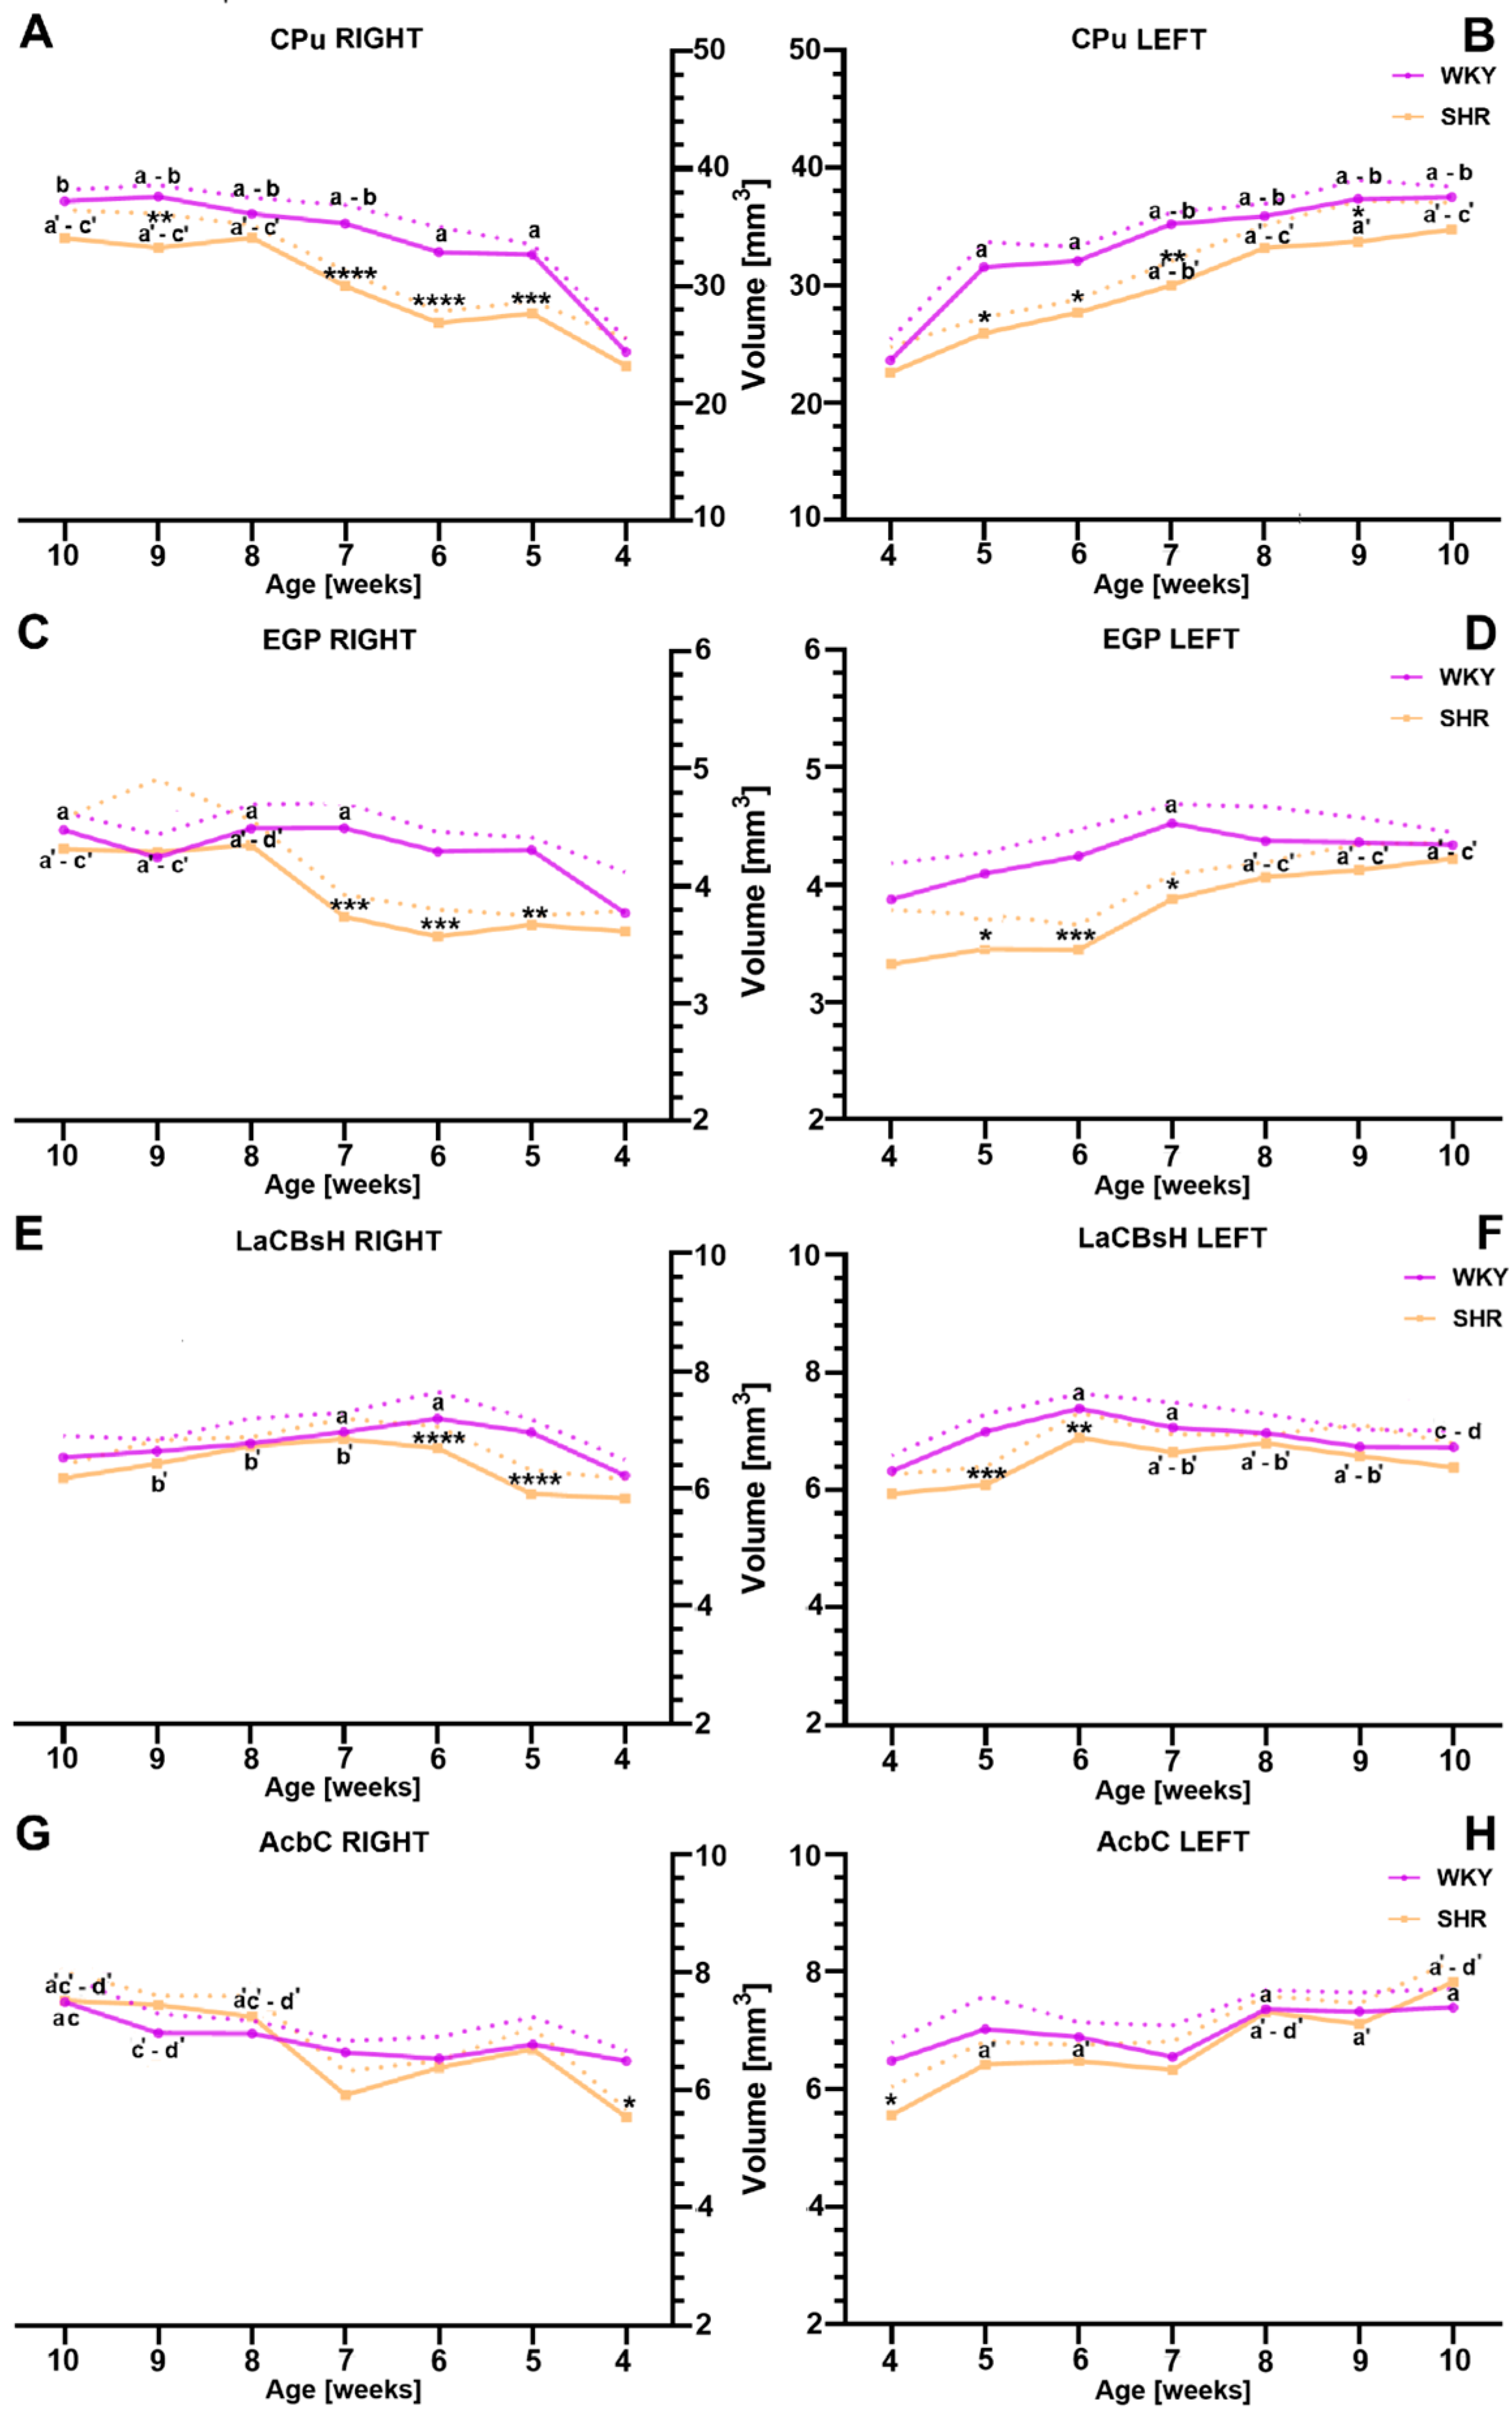
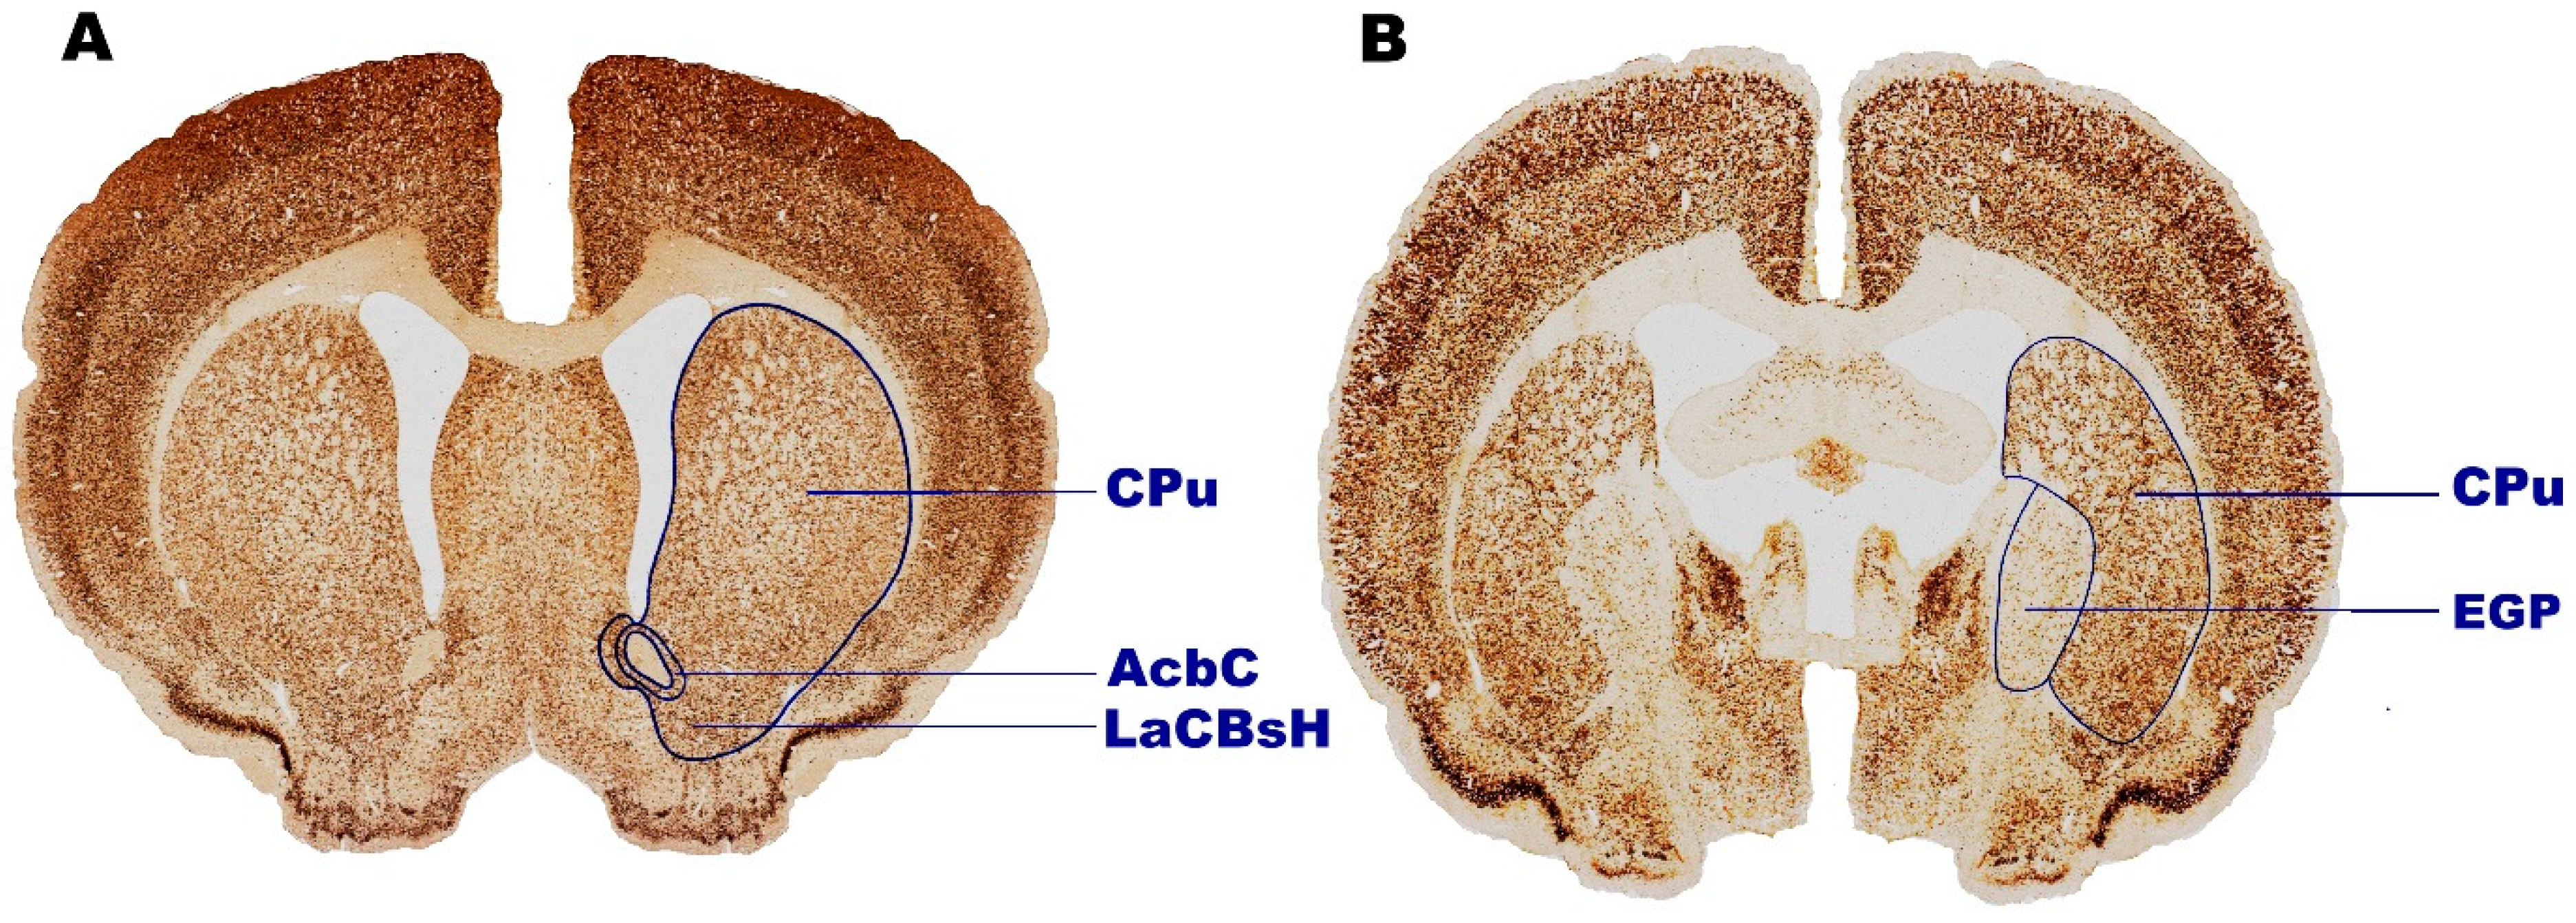
2.1. Volumetric Alternations

2.1.1. Caudate Putamen (CPu)

The comparative analysis conducted in this study revealed a significantly reduced total volume of the CPu in SHRs at 5, 6, 7, and 9 weeks of age (in both the right and left hemispheres; Figure 1A,B; p < 0.05–p < 0.0001) compared to age-matched WKYs. However, in both the ADHD animal models and the control group, no statistically significant differences (p > 0.05) were observed in the total CPu volume between the right and left hemispheres at the studied age stages (Figure 1A,B). In the SHR group, a significant increase in CPu volume was noted starting from weeks 7/8 (p < 0.0001–p < 0.01), whereas, in the control group, this increase occurred between weeks 4 and 5 (p < 0.05–p < 0.0001). Interestingly, in WKYs, the stabilization of CPu volume changes occurred between weeks 6 and 10 (p > 0.05).

2.1.2. External Globus Pallidus (EGP)

In parallel with the observations of the CPu, the total volume of the EGP showed a marked reduction in SHRs at 5, 6, and 7 weeks of age, in both the right (Figure 1C; p < 0.01–p < 0.001) and left (Figure 1D; p < 0.05 or p < 0.001) hemispheres, compared to age-matched controls. Similarly to the findings in the CPu, no statistically significant volumetric differences (p > 0.05) in the EGP were observed between the hemispheres in both SHRs and WKYs (p > 0.05). In the SHR group, a more pronounced increase in total EGP volume was noted between 7–8 weeks (right hemisphere) and 6–9 weeks (left hemisphere). Subsequent developmental stages in SHRs did not show significant volumetric changes, with the volume remaining stable. Conversely, in the control group, the most significant increase in total EGP volume occurred between 4 and 5 weeks, after which it remained relatively stable through the 10th week.

2.1.3. Lateral Accumbens Shell (LaCBsH)

Turning to the LaCBsH, a reduced total volume was observed in SHRs at 5 and 6 weeks of age (in both the right and left hemispheres) (Figure 1E,F; p < 0.01–p < 0.0001) compared to age-matched controls. Consistent with the previously mentioned regions, no significant differences (p > 0.05) in LaCBsH volume were observed between the right and left hemispheres in either SHRs or WKYs. In both the SHR and WKY groups, the most significant volume increase occurred by 6 weeks of age, with volumes remaining stable in subsequent stages of life.

2.1.4. Nucleus Accumbens Core (AcbC)

For the AcbC, a reduction in total volume was noticeable only at the 4th week of age in both the right and left hemispheres (Figure 1G,H; p < 0.05) in SHRs compared to their control counterparts. Consistent with observations in the CPu, EGP, and LaCBsH, there were no significant volume differences between the hemispheres (Figure 1G,H; p > 0.05) in either SHRs or WKYs. Furthermore, throughout the entire lifespan examined (4–10 weeks), the AcbC volumes in both SHRs and WKYs showed no significant differences and remained at similar levels.

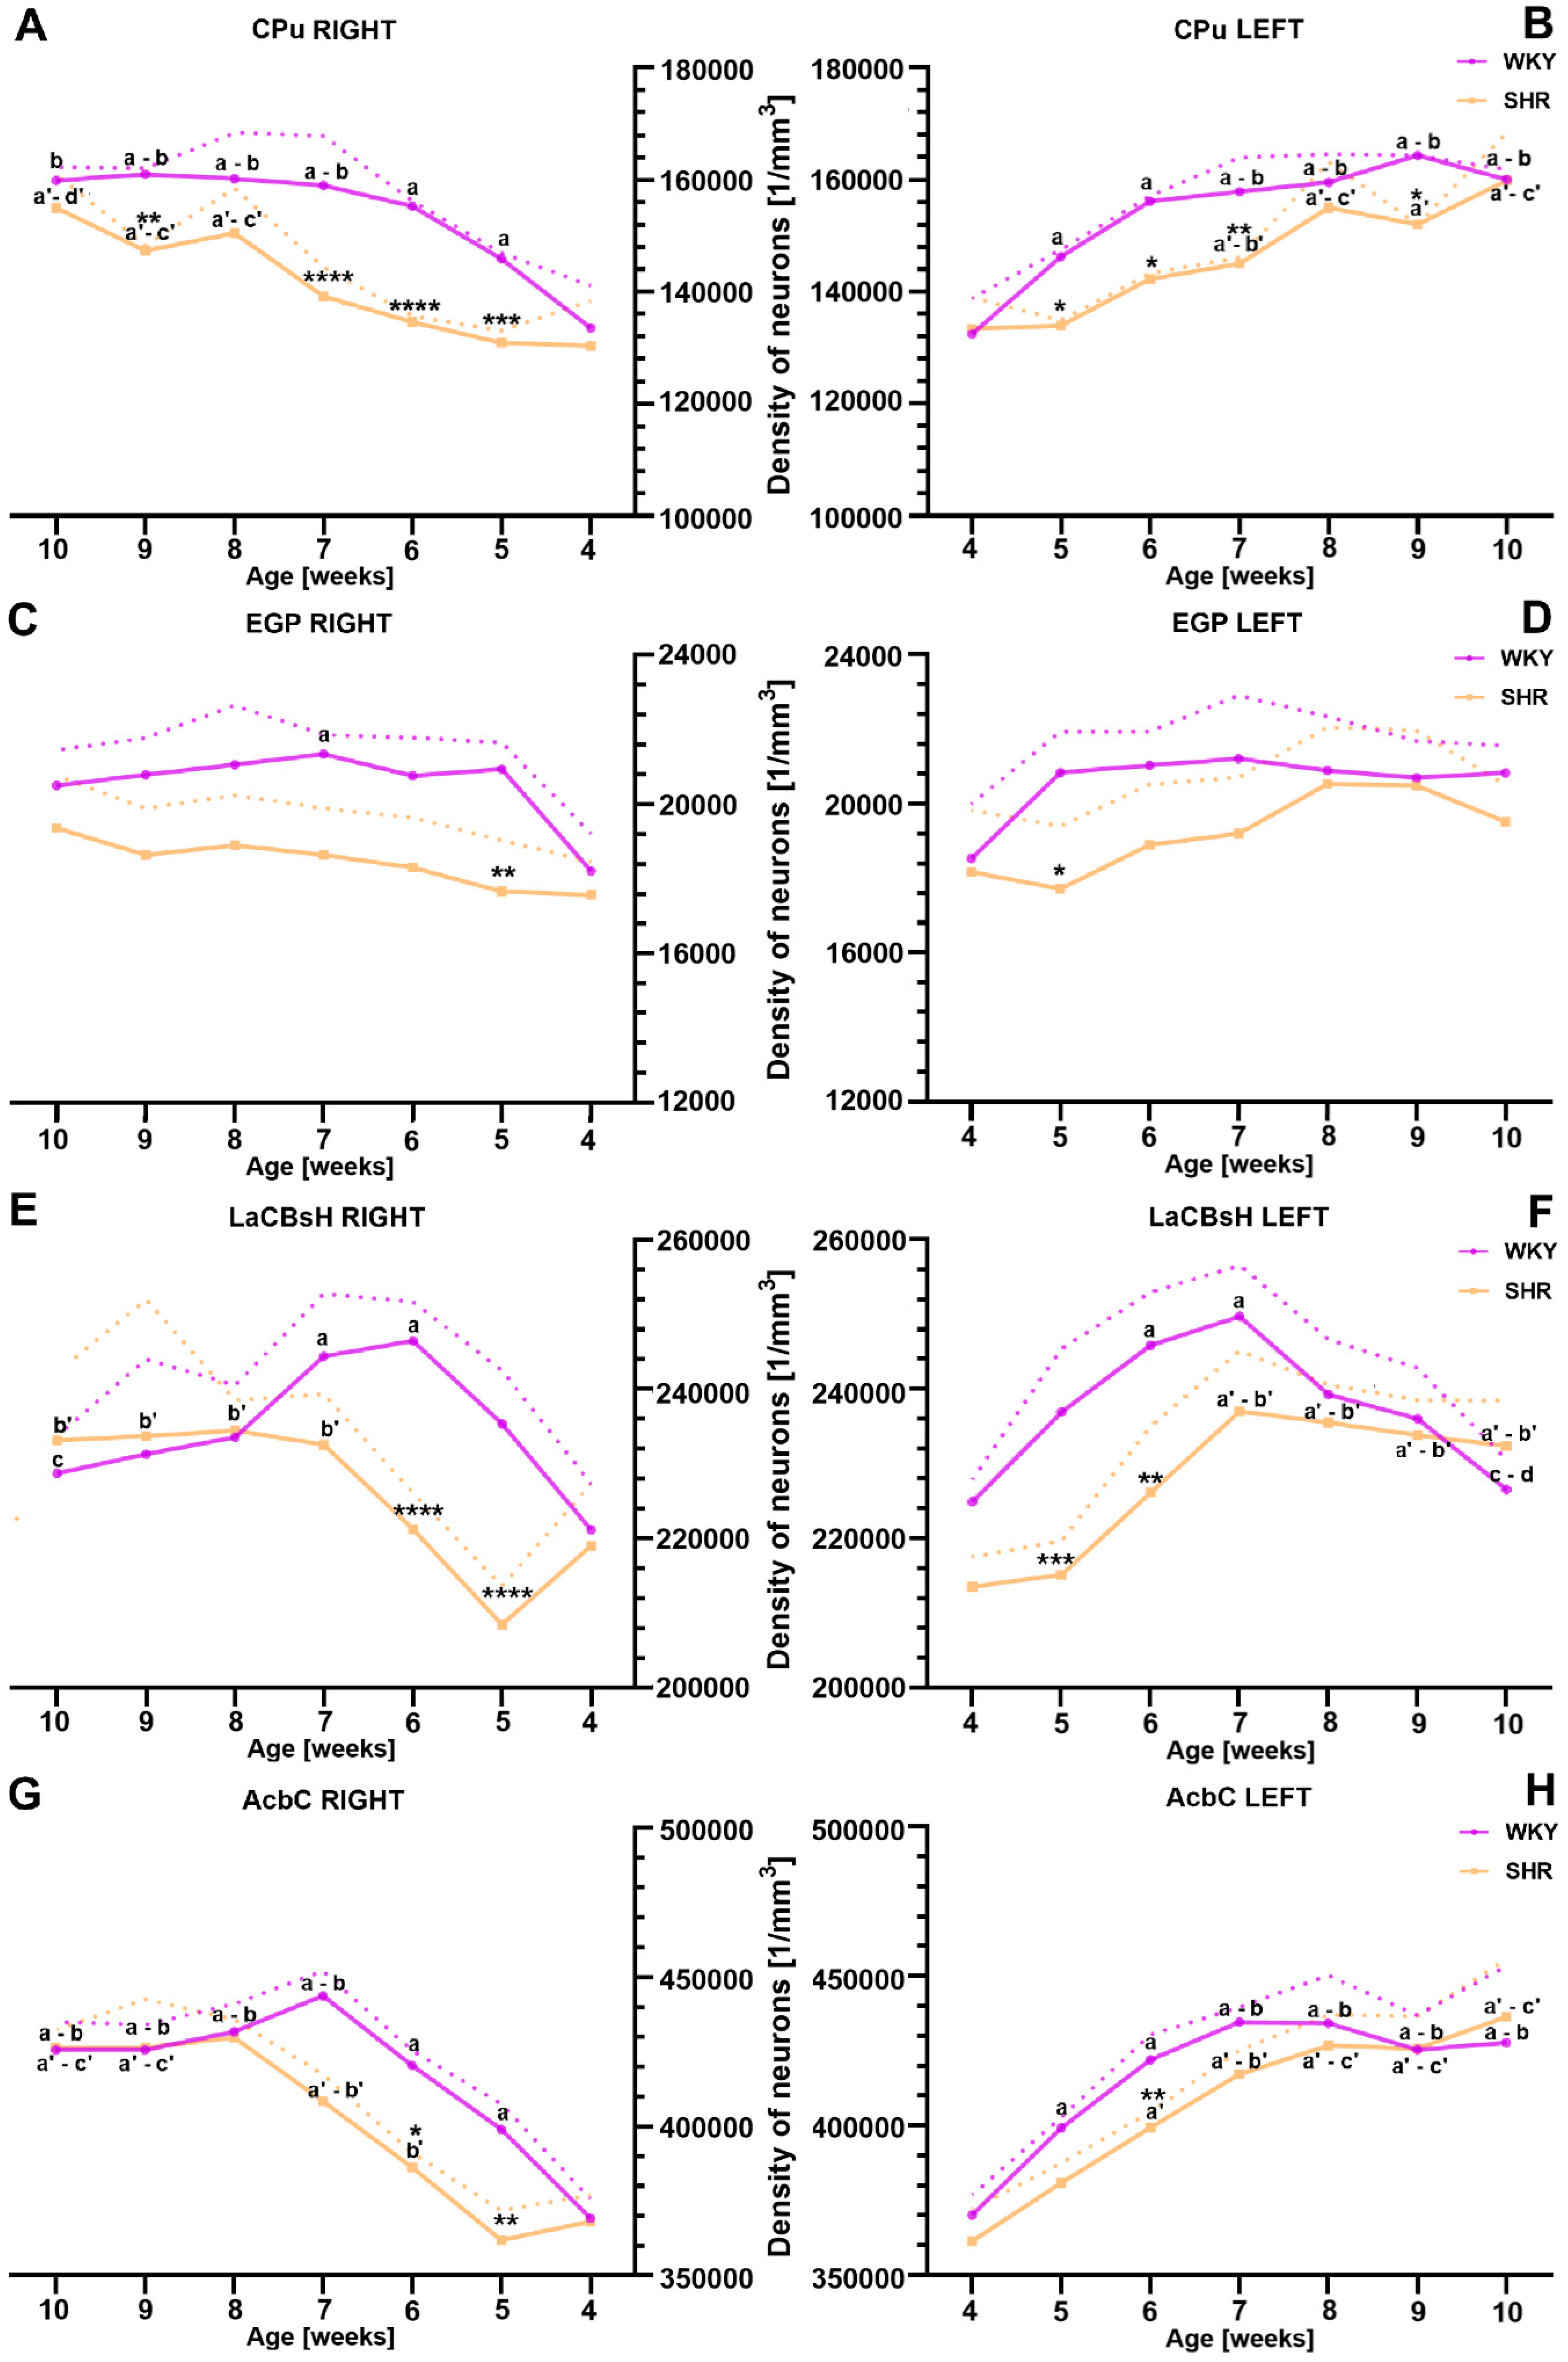
2.2. Alternations in Neuronal Density Across Distinct Striatal Regions

2.2.1. Caudate Putamen (CPu)

The average neuron density in the CPu was significantly lower in SHRs at 5 weeks (right hemisphere p < 0.001; left hemisphere p < 0.05), 6 weeks (right hemisphere p < 0.0001; left hemisphere p < 0.05), 7 weeks (right hemisphere p < 0.0001; left hemisphere p < 0.01), and 9 weeks of age (right hemisphere p < 0.01; left hemisphere p < 0.05) compared to controls (Figure 2A,B). No significant differences in average neuron density between the hemispheres were observed in either group at any of the studied age stages. Interestingly, SHRs exhibited a characteristic pattern of neuron distribution, with the most significant increase in neuron density occurring between 4 and 8 weeks of age (p < 0.01). In later stages of development, the average neuron density stabilized and remained at a similar level (p > 0.05). Conversely, in WKYs, the greatest increase in average neuron density was observed between 4 and 6 weeks of age (p < 0.05–p < 0.01), after which it remained stable until 10 weeks.

2.2.2. External Globus Pallidus (EGP)

Moving to another area of the striatum, the average neuron density in the EGP was significantly reduced in SHRs only at 5 weeks of age, compared to age-matched WKYs (right hemisphere p < 0.01; left hemisphere p < 0.05; Figure 2C,D). No significant differences in neuron density between the hemispheres were observed in either SHRs or WKYs (p > 0.05). Among SHRs, the dynamics of neuron density changes did not differ significantly across the different age stages (p > 0.05). Similarly, in WKYs, no significant changes in neuron density dynamics were observed throughout the animals’ lifespan, with densities remaining at similar levels (p > 0.05), except in the right hemisphere, where a more pronounced increase in neuron density was noted at 7 weeks of age (p < 0.05).

2.2.3. Lateral Accumbens Shell (LaCBsH)

Regarding the LaCBsH, the most significant decrease in neuron density was observed at 5 weeks of age (right hemisphere p < 0.0001; left hemisphere p < 0.001; Figure 2E,F) and 6 weeks of age (right hemisphere p < 0.0001; left hemisphere p < 0.01) in SHRs compared to age-matched controls. In SHRs, the most intense increase in neuron density occurred between 5 and 7 weeks of age (p < 0.05), with relatively stable densities in the subsequent weeks. In contrast, WKYs exhibited a different pattern of neuron distribution, with the most significant increase in neuron density observed between 4 and 6/7 weeks of age, followed by a noticeable and significant (p < 0.05) decrease in density at 9 and 10 weeks of age.

2.2.4. Nucleus Accumbens Core (AcbC)

In the case of the AcbC, a significant reduction in neuronal density was observed in SHRs at weeks 5 (right hemisphere, p < 0.01; Figure 2G) and 6 (both right p < 0.05 and left hemisphere p < 0.01; Figure 2G,H) compared to the age-matched control group. Among the SHRs, the most pronounced increase in neuronal density occurred between weeks 5 and 8 of life. In the subsequent stages of life, the neuronal density in SHRs remained relatively stable. As for the WKYs, the most significant increase in neuronal density was observed between weeks 5 and 7, followed by a similar density thereafter.

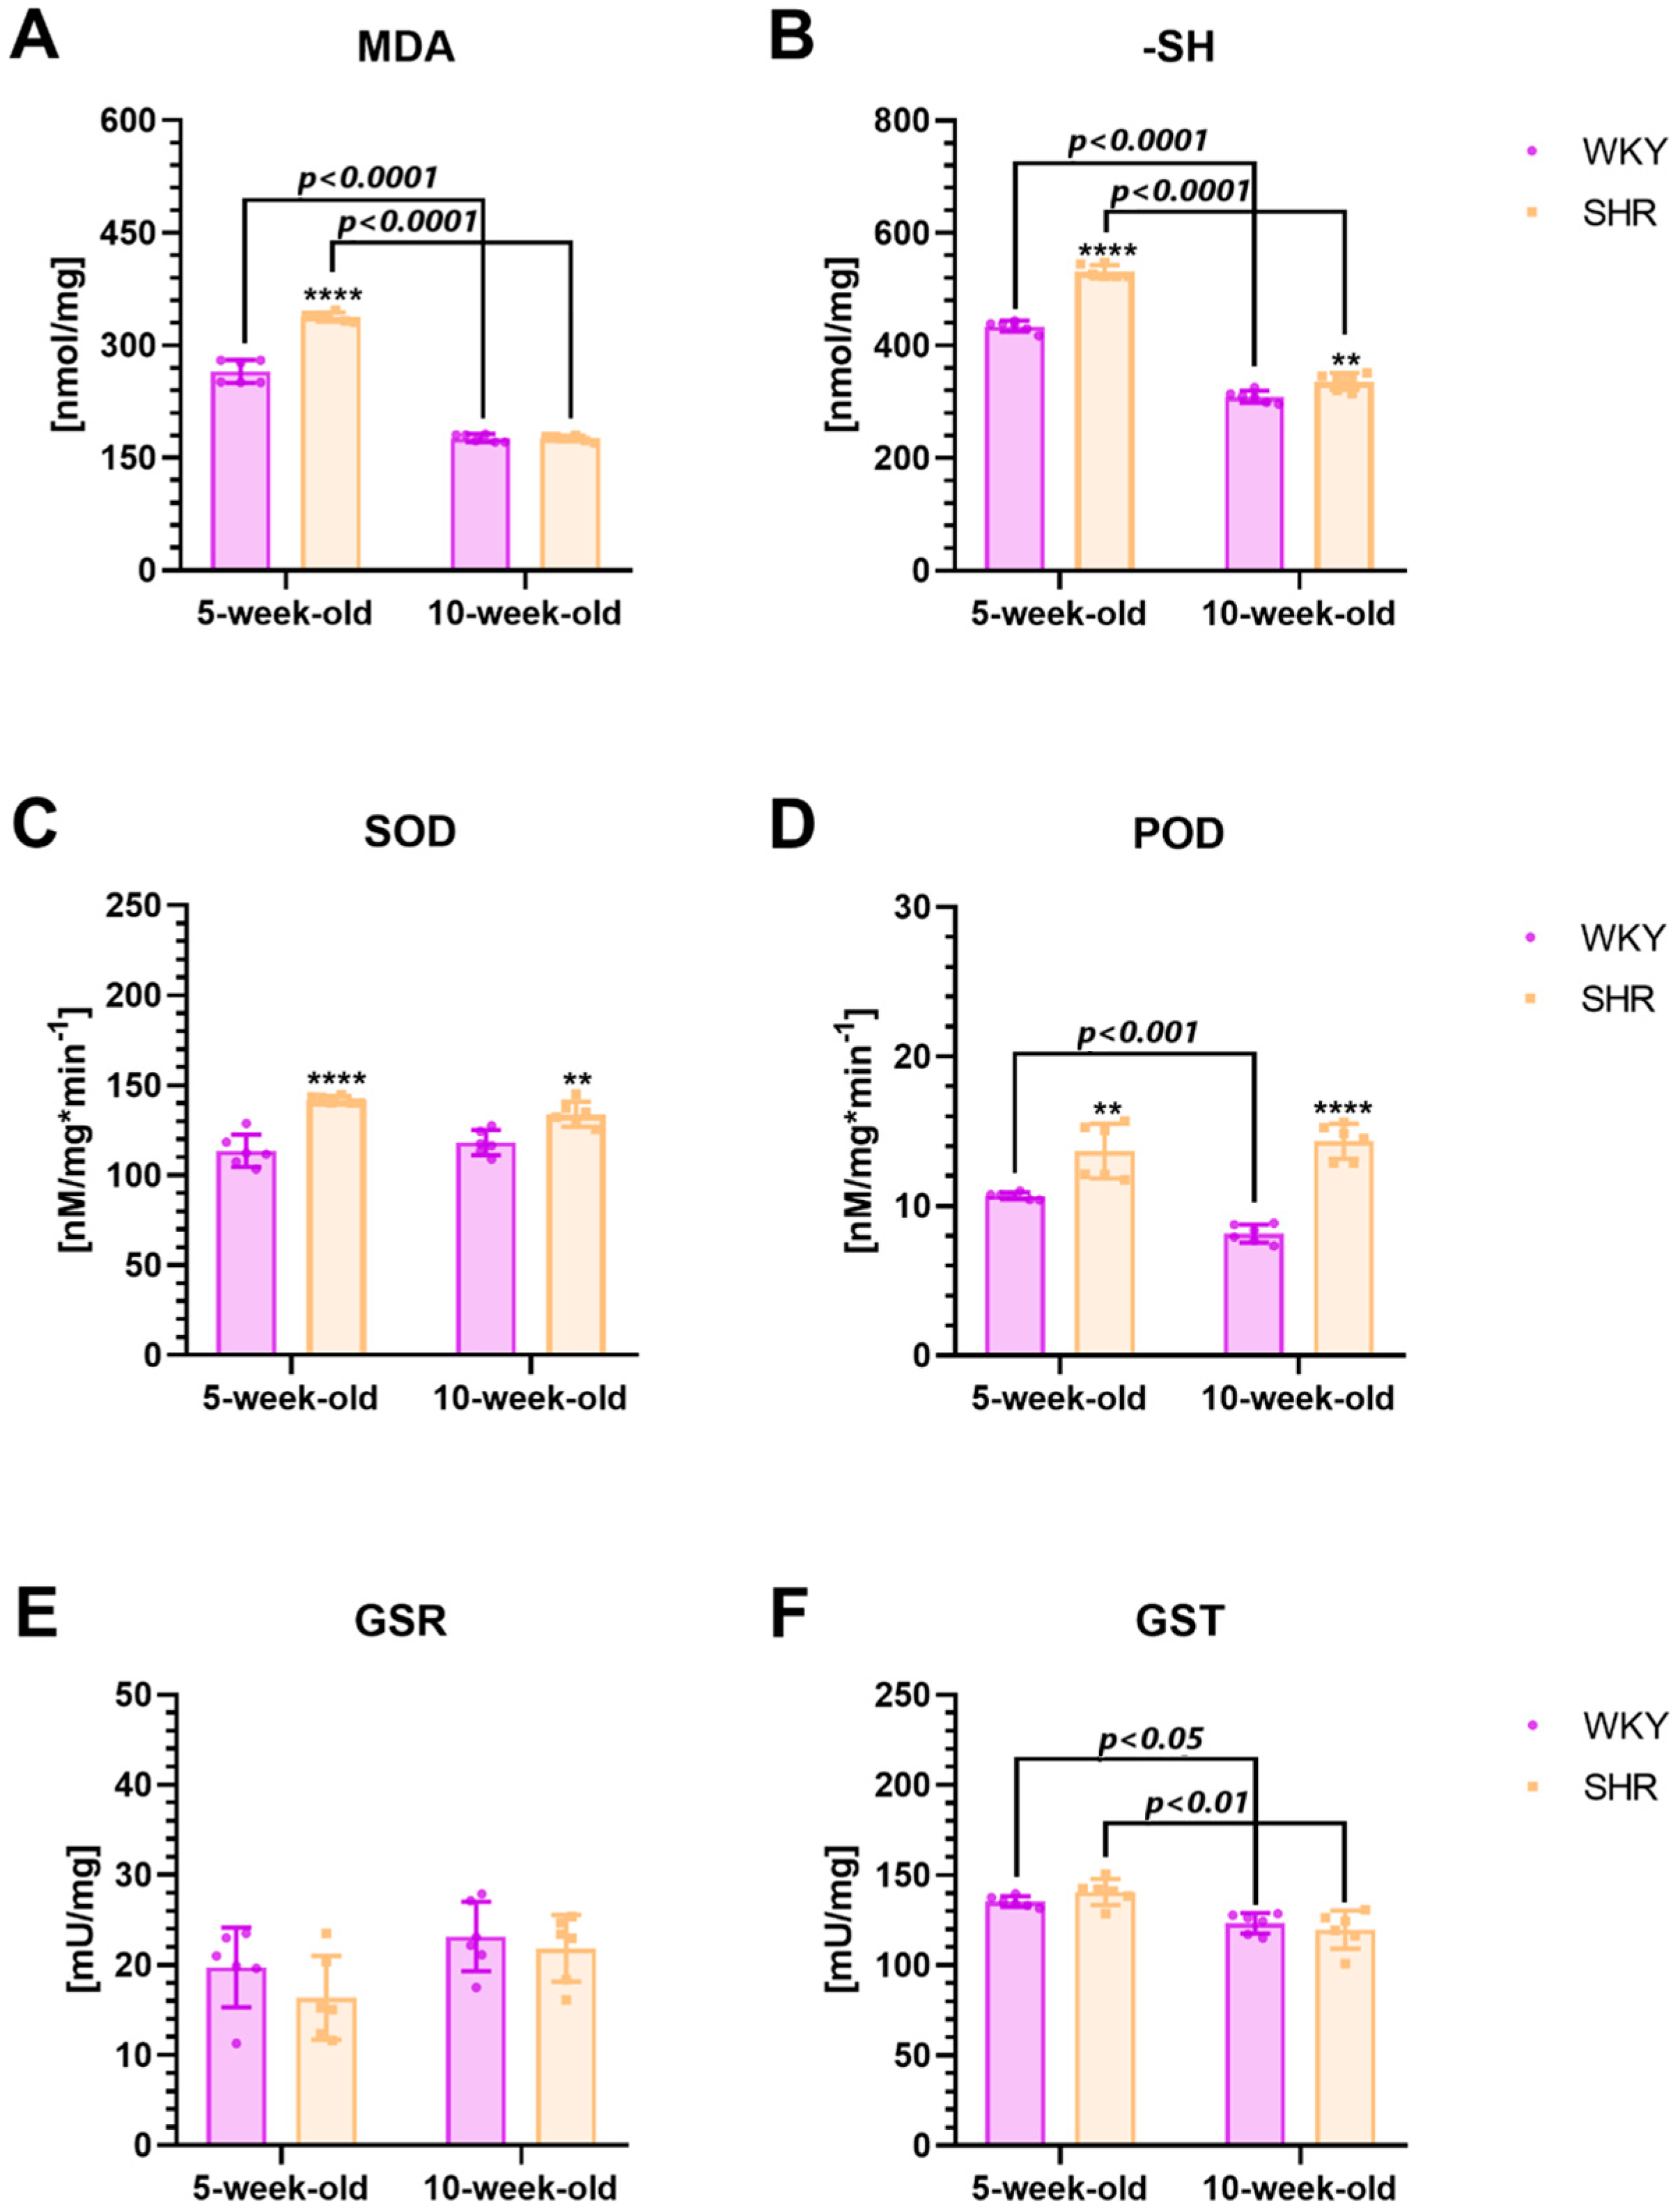
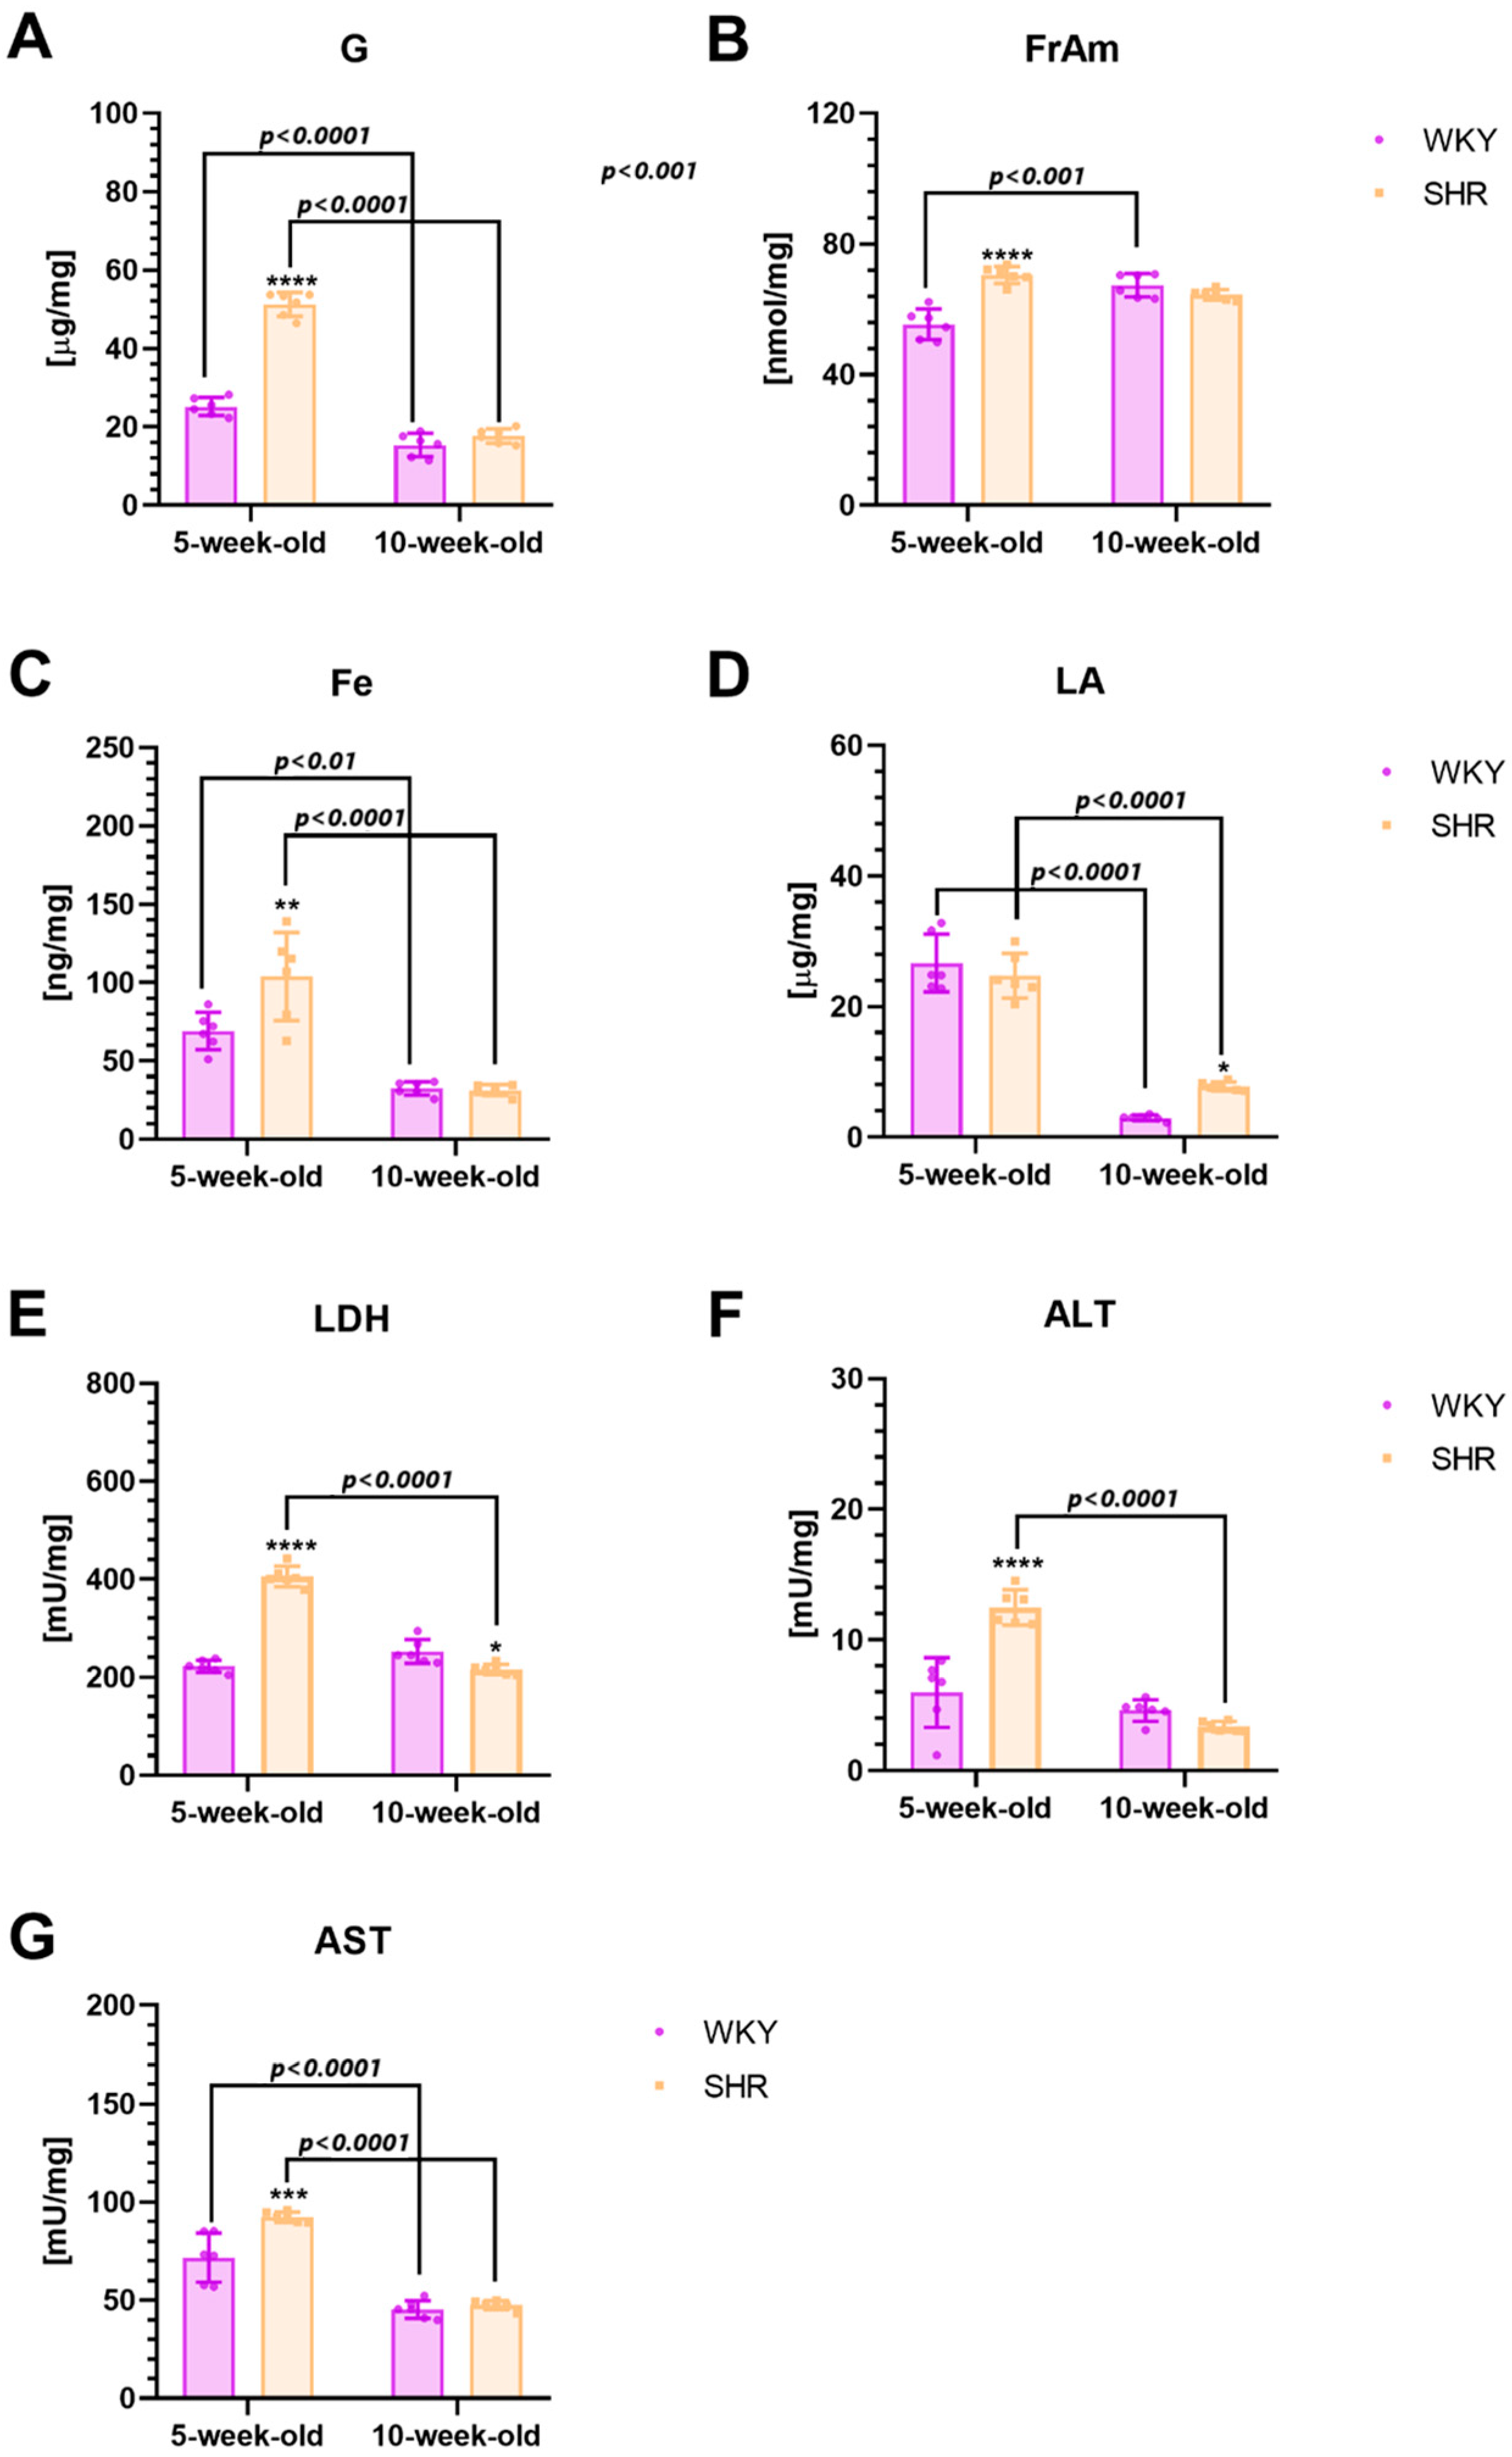
2.3. Biochemical Alternationss in the Striatum

2.3.1. Inflammatory Markers

In the current study, significantly elevated levels of IL-1α, m-TOR, and TGF-β were observed in 5-week-old SHRs compared to age-matched controls (Figure 3A,D,F; p < 0.05). Notably, GCsRβ and AKT-1 levels were found to be significantly higher in 10-week-old SHRs compared to their age-matched WKYs (Figure 3E,G; p < 0.001, p < 0.01, respectively). Additionally, IL-1α and AKT-1 levels were significantly higher in 5-week-old SHRs compared to their 10-week-old counterparts (Figure 3A,G; p < 0.05, p < 0.01, respectively). Conversely, in WKYs, IL-1β, GCsRβ, and AKT-1 concentrations were significantly higher in the 5-week-old animals compared to the 10-week-old ones (Figure 3B,E,G; p < 0.05, p < 0.001, and p < 0.01, respectively).

2.3.2. Oxidative Stress Markers

The concentrations of MDA, -SH, SOD, and POD were significantly elevated in 5-week-old SHRs compared to the age-matched control group, with statistical significance observed (Figure 4A–D; p < 0.0001, p < 0.0001, p < 0.0001, and p < 0.001, respectively). Additionally, higher levels of -SH, SOD, and POD were also noted in 10-week-old SHRs compared to their age-matched controls (Figure 4B–D; p < 0.01, p < 0.01, and p < 0.0001, respectively). No significant differences in GST and GSR levels were observed between SHRs and WKYs, regardless of the age studied (Figure 4E,F; p > 0.05). Moreover, SHRs exhibited elevated levels of MDA, -SH, and GST at 5 weeks of age compared to the 10-week-old animals (Figure 4A,B,F; p < 0.0001, p < 0.0001, and p < 0.01, respectively). Conversely, WKYs showed significantly higher levels of MDA, -SH, POD, and GST at 5 weeks of age compared to their 10-week-old counterparts (Figure 4A,B,D,F; p < 0.0001, p < 0.0001, p < 0.001, and p < 0.05, respectively).

2.3.3. Metabolic Markers

Our study revealed significantly elevated levels/activities of G, FrAm, Fe, LDH, ALT, and AST in 5-week-old SHRs compared to age-matched WKYs (Figure 5A–C, E–G; p < 0.0001, p < 0.0001, p < 0.01, p < 0.0001, p < 0.0001, and p < 0.001, respectively). Additionally, the LDH level was significantly lower in 10-week-old SHRs compared to age-matched controls (Figure 5E; p < 0.05). In turn, the LA level was higher in mature SHRs in comparison to age-matched WKYs (Figure 5D; p < 0.05). Notable developmental differences were also observed. Specifically, SHRs exhibited significantly higher levels/activities of G, FrAm, Fe, LA, LDH, ALT, and AST at 5 weeks of age compared to 10 weeks (Figure 5A, C–G; p < 0.0001, respectively). Conversely, WKYs showed higher levels/activities of G, Fe, LA, and AST at 5 weeks compared to 10 weeks (Figure 5A,C,D,G; p < 0.0001, p < 0.01, p < 0.0001, and p < 0.0001, respectively). It is worth noting that in 5-week-old WKYs FrAm levels were significantly lower than in 10-week-old individuals of the same strain (Figure 5B; p < 0.001).

3. Discussion

3.1. Striatal Volume and Neuron Density Alternations

The presented results provide, for the first time, detailed evidence of a significant volume reduction in the striatum areas—caudate putamen (CPu), external globus pallidus (EGP), accumbens shell (LaCBsH), and nucleus accumbens core (AcbC)—in juvenile and maturing spontaneously hypertensive rats (SHRs), an animal model of ADHD. While comprehensive volumetric measurements of specific striatal areas in SHRs have not been conducted so far, the finding by Hsu et al. [31] showed corresponding results, where a notable decrease in the total striatal volume was observed in young SHRs [31]. Additionally, similar patterns have been identified in neuroimaging studies of ADHD patients, indicating a reduction in the volume of the caudate, putamen, and globus pallidus during childhood and early adolescence [24,73,74,75]. Furthermore, the observed developmental trajectory of volume alterations of the striatal areas in SHRs appears to be very similar to those observed in magnetic resonance imaging (MRI) studies among ADHD patients [10,75,76,77]. The observed developmental changes may provide a potential explanation for previous findings, suggesting that alterations in striatal areas’ volume in ADHD normalize with age. Similarly, we observed no significant differences in the volumes of the striatal areas in maturing SHRs, which is supported by previous findings considering the same animal model [30,31]. Additionally, it remains consistent with previous studies among adult ADHD patients, which presented no differences in basal ganglia volumes [78,79,80]. However, there is also divergent evidence suggesting both larger [75] and smaller [80,81] volumes of striatal areas in adult ADHD patients compared to healthy controls. This variability may arise from differences in sample characteristics, such as age, sex, and ADHD subtype, as well as methodological differences in imaging techniques and analysis approaches [82]. Notably, the reduction in neuronal density observed in 9-week-old SHRs might indicate an enlargement of the brain ventricles, as reported in other studies involving SHRs of the same age [30,83]. Moreover, we did not observe significant differences in the volumes of the striatal areas between the hemispheres, which is consistent with previous studies [84]. Nevertheless, there is evidence to support right-side reductions in the putamen, globus pallidus, and caudate [85,86], and also left-side caudate [12,87,88] reductions in ADHD. The variations in findings regarding volume alternations in adults and hemispheric differences in ADHD could stem from several factors, including the diversity of research methodologies, the sample characteristics, and the complexity of this disorder as a neurodevelopmental disorder.
In addition to the volumetric alternations noted in the striatal areas in the ADHD rat model, our developmental study revealed a distinct shift in neurons’ distributions within the striatal areas of SHRs when compared to the control group throughout the studied animals’ lifespan. Specifically, we observed a reduction in neuronal density in most striatal areas, namely, CPu, EGP, LaCBsH, and AcbC, among juvenile SHRs, when compared to their control counterparts. Comparing our results with the existing literature is particularly challenging, considering that our study is the first to analyze neuron densities in the striatum regions using an animal model of ADHD. Nonetheless, we will strive to contextualize our results within the existing body of literature. Firstly, our results align with the current evidence and our previous study, indicating a reduction in grey matter density in other brain regions associated with motor control, i.e., the PFC and motor cortex in juvenile SHRs [29,30]. Furthermore, an important support for our findings are studies using Proton Magnetic Resonance Spectroscopy, which enables the reliable non-invasive detection of intracerebral neurochemical concentrations in vivo [89]. N-acetylaspartate (NAA) stands as a pivotal metabolite, reflecting the quantity and functional status of neurons in the targeted brain region [90,91]. A low level of NAA is considered an indicator of neuronal loss or significant neuronal dysfunction [92]. Namely, the finding by Jin et al. [93] provides data that the mean NAA peak in children with ADHD was significantly lower than in healthy controls in the bilateral striatum [93,94] and PFC [95]. In contrast, in adult ADHD patients, NAA peaks did not differ between ADHD patients and controls [96], which supports our observations. Additional support for our results is provided by reports using the Diffusion Tensor Imaging (DTI) method which is a valuable tool for characterizing the microstructural tissue integrity and fiber pathways based on the water diffusion properties; it primarily provides insights into the structural aspects of white matter, such as axonal integrity and myelination [97]. A reduction in fractional anisotropy (FA) is often interpreted as a disruption or alteration in the microstructural integrity of white matter tracts. This could be due to various factors, including demyelination, axonal damage, or changes in tissue density. In neurological and psychiatric conditions, reduced FA is frequently observed and may signify abnormalities in the underlying neural architecture, which can contribute to functional and cognitive changes [98]. Namely, a study provided by Ashtari et al. [99] showed that children with ADHD had decreased FA in, among others, the premotor, striatal areas [99]. Similarly, de Zeeuw et al. presented reduced microstructural organization in the fronto-striatal regions in ADHD children [100].
Finally, it is worth noting that the presented alterations in the volume and microstructure of the striatum may be the cause of the impaired structural connectivity in the fronto-striatal network modulating performance in tasks involving cognitive control [101,102], an ability typically impaired in ADHD [103], and also the hypoactivity of this structure observed in functional magnetic resonance imaging (fMRI) studies in ADHD children when compared to healthy controls [104,105,106]. The structural and functional changes observed in the striatal areas of juvenile ADHD individuals may significantly impact the symptoms of the disorder, as also demonstrated in SHRs. Specifically, previous studies of locomotor activity in SHRs and WKYs showed that parameters such as the horizontal activity, total distance, and movement time were significantly the highest in SHRs compared to WKYs at 5–7 weeks of age [107,108]. Similarly, this period also aligns with the peak intensity of ADHD symptoms observed in children with ADHD [28,109]. Moreover, dysregulated DA signaling in the striatum is linked to impaired reward processing and heightened impulsivity, contributing to difficulties in delaying gratification and making choices considering long-term consequences in individuals with ADHD [110,111].
Interestingly, the peak period of significant structural abnormalities in the striatum of SHR rats is observed during the prepubescent phase, particularly between the fourth and seventh weeks of life. This coincides with the process of synaptic pruning, suggesting that plasticity mechanisms may be responsible for observed developmental changes associated with ADHD [112,113]. This timeframe (equivalent to 6–10 years of age in humans [114]) correlates with the most noticeable changes in the striatum and caudate nucleus, which are smaller and show reduced activity in children with ADHD compared to healthy peers [10,77,115,116]. These changes may underlie difficulties with attention and self-control—key symptoms of this disorder observed in both SHR rats [108,117] and ADHD children [118].
It is worth adding that the decrease in neuronal density in juvenile SHRs (4–7 weeks), followed by an increase in density in maturing individuals (8–10 weeks) of this strain, may suggest the presence of compensatory mechanisms in the striatum of SHRs. This could be the result of increased antioxidant levels and metabolic alterations occurring in the striatum.

3.2. Inflammatory Markers

The results presented in this study highlight a significant increase in the levels of IL-1α, m-TOR, and TGF-β in the striatum of juvenile SHRs compared to age-matched WKYs. Additionally, the levels of GCsRβ and AKT-1 were significantly higher in maturing SHRs than in their WKY counterparts. Understanding the immune environment of the striatum in ADHD is particularly important due to the role cytokines play in various neurological disorders. While comprehensive data on immune markers in the SHRs’ striatum are lacking, some studies support our observations. Elevated levels of pro-inflammatory cytokines such as IL-1α, IL-1β, IL-6, TNF-α, m-TOR, and MCP-1 have been previously reported in juvenile SHRs in other brain regions involved in ADHD, including the prefrontal cortex (PFC) and hippocampus [30,119]. Moreover, Donfrancesco et al. reported increased levels of IL-6 and IL-10 in the serum of children with ADHD [38].
Interestingly, we did not observe significant differences in IL-1β levels in the striatum between the tested strains, regardless of age. Similarly, a study by Leffa et al. found no differences in IL-1β levels between SHRs and WKYs of the same age, and also our previous research showed no significant alterations in IL-1β levels in the PFC of both young and maturing SHRs [30,120]. Nevertheless, presented findings suggest ongoing inflammation in the striatum, which could contribute to the observed morphometric changes, and functional abnormalities in this region contributing to ADHD-specific symptoms.
Specifically, pro-inflammatory cytokines such as IL-1α activate signaling pathways like Nuclear Factor kappa B (NF-κB) and Mitogen-Activated Protein Kinase (MAPK) [121]. Chronic NF-κB activation in neurons or neighboring glial cells promotes neurotoxic effects by increasing the production of pro-inflammatory cytokines [122]. IL-6 overproduction amplifies the inflammatory environment, leading to prolonged microglial and astrocytic activation, which damages neurons by inducing oxidative stress, promoting the production of reactive oxygen species (ROS), and damaging neuronal structures such as membranes, proteins, and DNA. The inflammatory cytokines can also impact neuronal survival [122]. Additionally, NF-κB activation may exacerbate excitotoxicity, a process where the excessive stimulation of neurons by excitatory neurotransmitters (mainly glutamate) leads to neuronal death. Pro-inflammatory cytokines such as IL-1α and IL-6 also sensitize glutamate receptors, especially NMDA receptors, resulting in an excessive calcium influx into neurons [122,123]. Elevated intracellular calcium activates enzymes that degrade cellular components, leading to apoptosis or necrosis. Moreover, an excessive calcium influx and excitotoxicity impair mitochondrial function, resulting in metabolic disturbances, reduced ATP production, increased ROS generation, and the activation of cell death pathways [123]. Similarly, the chronic activation of MAPK signaling pathways, such as p38 MAPK, JNK, and ERK, can contribute to neuronal damage by promoting pro-apoptotic pathways and inducing the expression of inflammatory genes [124]. Notably, JNK and p38 MAPK are highly sensitive to oxidative stress, a major byproduct of brain inflammation. These kinases induce mitochondrial dysfunction by promoting ROS production and activating mitochondrial pro-apoptotic pathways, leading to the release of apoptosis-inducing factors [124].
Furthermore, elevated levels of cytokines such as TNF-α, IL-1α, IL-1β, and IL-6 have been shown to reduce the synthesis, secretion, and availability of DA and alter the DA receptor expression or function in the brain [125,126]. Reduced DA levels in the striatum have been reported in both juvenile SHRs [63,127,128], and children with ADHD [110,129], and are associated with impaired attention regulation and motor control. Interestingly, the administration of anti-inflammatory agents has been shown to reduce ADHD symptoms in both juvenile SHRs and ADHD patients [130].
The elevated levels of m-TOR and TGF-β observed in the striatum of juvenile ADHD subjects in this study may have significant implications for neuronal function, survival, and neurotransmission. Both molecules are involved in key cellular processes, and their dysregulation could contribute to neurological dysfunction in ADHD. The m-TOR pathway, a critical regulator of cell growth, metabolism, protein synthesis, and synaptic plasticity, is particularly notable [131,132]. Elevated m-TOR activity in the striatum may disrupt neuronal function and signal transmission, leading to excessive or aberrant synaptic remodeling that disturbs the balance of excitatory and inhibitory neurotransmission, particularly impacting DA signaling [131,132,133]. Chronic m-TOR hyperactivation is also associated with neuronal stress and impaired cell health, potentially compromising long-term neuron viability and contributing to cognitive and behavioral deficits characteristic of ADHD [134].
Similarly, TGF-β, a cytokine involved in cell growth regulation, immune response, and brain function, plays a critical role in synaptic plasticity, neuroinflammation, and neuronal survival [135]. Elevated this cytokine levels in the striatum may indicate neuroinflammatory processes that could harm neuronal health and DA signaling [136]. Dysregulated TGF-β signaling can interfere with synapse development and plasticity, altering neurotransmitter release and reuptake, thus exacerbating ADHD symptoms [135,136,137]. Furthermore, TGF-β has dual roles in neuronal survival, where its elevated levels might promote neuroprotection or, when overexpressed, contribute to neurodegeneration [135,137]. TGF-β is also involved in activating astrocytes and microglia, and their overactivation could impair synaptic transmission and neuronal health, further complicating the functional dynamics of the striatum in ADHD [137].
Interestingly, we also observed elevated levels of GCsRβ and AKT-1 in maturing SHRs compared to age-matched WKYs. Supporting our data, a study by van der Meer et al. showed the overexpression of the NR3C1 9β gene encoding GCsRβ in adolescents and young adults with ADHD [138]. Notably, the elevated level of AKT-1 and GCsRβ in maturing SHRs was accompanied by an increase in striatal volume and neuronal density in these areas. A detailed literature review reveals that the AKT-1 signaling pathway is crucial for promoting neuronal survival by inhibiting apoptosis and activating survival pathways [139]. This is achieved through the phosphorylation and inactivation of pro-apoptotic proteins and the activation of anti-apoptotic factors. Under conditions of stress or damage, AKT-1 activation helps neurons resist injury and supports their survival, playing a key role in both neuronal survival and synaptic plasticity [139]. The elevated levels of AKT-1 and GCsRβ in maturing SHRs also suggest increased metabolic activity in the striatum [140,141]. These molecules are involved in various metabolic processes, including insulin signaling, glycolysis, and oxidative phosphorylation [140,141,142]. AKT-1, in particular, plays a key role in regulating glucose uptake and metabolism in cells [142]. Similarly, GCsRβ affects energy metabolism by mediating the actions of glucocorticoids [141]. Interestingly, our results indicate that increased levels of AKT-1 and GCsRβ in maturing SHRs are associated with reduced glucose levels.
It is worth emphasizing that no significant differences were observed in other inflammatory markers, such as IL-1α, IL-1β, IL-6, mTOR, and TGF-β, in adult SHRs, which is consistent with previous studies [120]. This may be due to the elevated levels of cortisol and corticosterone observed in the serum and adrenal glands of adult SHRs [29,35]. As is well known, glucocorticoids are adaptive hormones that exhibit immunosuppressive effects by lowering the levels of pro-inflammatory cytokines [143].

3.3. Oxidative Stress Markers

Oxidative stress is a condition that arises when the body’s natural defense mechanisms against harmful molecules called free radicals are overwhelmed by an excessive production of these radicals. ROS constitute the primary type of free radicals, with a significant portion generated within the mitochondria during the process of oxygen metabolism [144]. The current body of research suggests a connection between the pathophysiology of ADHD and an imbalance in oxidative stress. Nonetheless, the precise mechanisms underlying this association remain elusive. It should be noted that our present results reveal significantly increased levels of MDA, a biomarker of oxidative stress, a product of lipid peroxidation [145], in the striatum of juvenile SHRs compared with control peers. In some studies, elevated levels of this dialdehyde have been observed in individuals with ADHD. However, the results regarding the relationship between MDA levels and ADHD are still inconclusive. For example, elevated levels of MDA as well as reactive oxygen species have previously been reported in both the PFC and serum of juvenile SHRs [30,69], and this remains consistent with our findings. At the same time, there is evidence of elevated MDA levels in the serum of ADHD children [146,147]. The opposite data have been presented by Oztop et al. [50] where lower levels of MDA have been reported in children with this disorder [50]. The discrepancies in the literature data on MDA levels in children with ADHD could be attributed to variations in sample demographics, methodologies employed for MDA measurement, and the presence of confounding factors such as diet, comorbidities, or medication usage. Additionally, differences in study designs, including sample size, control group selection, and statistical analyses, may contribute to the observed inconsistencies in the reported MDA levels. Nevertheless, we suggest that elevated MDA levels in juvenile SHRs may contribute to the severity of ADHD-like symptoms in this strain [107], which is supported by the existing literature [145]. Namely, oxidative stress can disrupt the balance of neurotransmitters, especially DA, which is most sensitive to oxidative stress [148]. DA plays a crucial role in regulating attention, impulsivity, and hyperactivity—core symptoms of ADHD. Heightened oxidative stress may impair DA synthesis, release, reuptake, and metabolism, leading to the dysregulation of this catecholamine levels in key brain regions implicated in ADHD, such as the PFC and striatum. This contributes to the severity of ADHD symptoms, which has been shown in prior studies [149].
In response to elevated oxidative stress levels, the organism typically upregulates the synthesis and expression of endogenous antioxidants. Antioxidants are biochemical compounds that act to mitigate the deleterious effects of ROS, which are generated as byproducts of oxidative stress [150]. Similarly, in our study, the increase in MDA levels in juvenile SHRs was accompanied by a significant increase in the -SH group, as well as SOD and POD activity in these animals. These -SH groups are capable of donating electrons to ROS, neutralizing them, and preventing oxidative damage to cells and tissues. The literature data on the level of -SH groups in individuals with ADHD are inconclusive. Specifically, our previous studies have shown elevated levels of -SH groups in juvenile SHRs in the PFC and spleen [29,30]. Similarly, there is evidence indicating higher levels of these groups in the saliva and serum of children with ADHD [50,151]. On the other hand, Öğütlü et al. [152] presented contrasting findings, indicating decreased serum -SH levels in children with ADHD compared to non-ADHD individuals, thus introducing conflicting data into the current body of evidence [152]. The existing literature underscores the crucial role of dynamic thiol/disulfide homeostasis in antioxidant mechanisms, apoptosis, detoxification, cellular signal transduction, and the regulation of enzyme and transcription factor activity [153,154,155]. When it comes to SOD and POD, they are widely recognized as key antioxidant enzymes that play a crucial role in maintaining oxidative balance [156], which is disrupted in individuals with ADHD [36]. Unfortunately, elucidating the implications of elevated SOD and POD activity in juvenile SHRs in the striatum proves challenging due to a lack of available data in existing studies on this matter. Nonetheless, our previous study presented elevated levels of these enzymes in the PFC of juvenile SHRs compared to the WKY counterparts. Moreover, the existing literature supports a significant increase in the total antioxidant status (TAS) in children and adolescents with ADHD [157]. TAS is a measure of the overall antioxidant capacity of a biological sample, such as blood serum, which confirms our findings [157].
Moving on to the other oxidative stress markers investigated in our study, we did not observe any significant differences in the activity of GSR and GST, in the striatum between SHRs and WKYs, regardless of the age group studied. Similarly, the finding by Leff et al. showed no differences in glutathione peroxidase (GPx) levels in the striatum of adult SHRs [120]. These enzymes, i.e., GSR, GST, and GPx, are components of the cellular antioxidant defense system. They work together to maintain a redox balance and protect cells from oxidative damage.
Interestingly, there are also conflicting literature data. For example, studies conducted among ADHD children show no significant differences in the antioxidant levels in the blood of children with ADHD [50,158,159]. Similarly, a meta-analysis indicated that the association between ADHD and elevated antioxidant status was not significant [34]. These discrepancies may be attributed to the different types of tissue analyzed and the species-specific differences in the studied populations [160].
It is important to highlight that our results suggest a decline in the levels of MDA as SHRs age, eventually reaching values statistically comparable to those of WKYs at 10 weeks old, aligning with earlier findings [29,30,120]. Moreover, we observed a sustained significant increase in the levels of antioxidants such as -SH groups, SOD, and POD in adult SHRs compared to age-matched controls. This phenomenon might be a result of compensatory adaptations [161].
Oxidative stress in the striatum, most likely resulting from inflammatory processes, can affect neuron morphology, migration, and plasticity, further influencing the manifestation of ADHD symptoms [36,162]. This is in line with our data, which indicate that heightened oxidative stress coincide with a decrease in the volume of striatal structures, along with a reduction in neuronal density within this region. It is important to emphasize that elevated oxidative stress can affect neuronal metabolism and exacerbate ADHD symptoms [163]. Confirming our thesis, existing reports indicate that treatment with anti-inflammatory and antioxidant agents reduces inflammatory parameters and oxidative stress in both SHRs [119], and ADHD patients [164,165,166], and also leads to a significant reduction in ADHD symptoms [119,164,165,166].

3.4. Metabolism Markers

Oxidative stress has the potential to harm cellular structures, encompassing cell membranes and mitochondria, while also diminishing insulin sensitivity. This can impede the cells’ ability to uptake glucose (G) from the bloodstream, ultimately contributing to heightened G levels in tissues [167,168]. Similarly, in the presented study, significantly elevated oxidative stress markers were associated with increased G levels in juvenile SHRs compared to age-matched controls. Our results are consistent with those reported by Ernst et al. [169], who observed a decrease in global metabolism G within the brains of children with ADHD using PET analysis [169]. The reduction in G metabolism during brain development may stem from mitochondrial dysfunction, which is commonly reported in children with ADHD and autism spectrum disorder [170,171]. In the current study, we also observed elevated levels of fructosamine (FrAm) in juvenile SHRs, which is consistent with a previous report showing elevated FrAm levels in the PFC of SHRs at the same age [30]. FrAm is a compound formed as a result of the non-enzymatic glycation of proteins by G. Elevated FrAm levels indicate persistent hyperglycemia over the past 2–3 weeks [172]. However, elevated G levels in the brain may influence the dysregulation of neurotransmitter systems such as dopaminergic pathways [173] and also lead to alterations in brain structure and function, which may contribute to the exacerbation of ADHD symptoms [174]. Moreover, observed in the current study, elevated G levels in the striatum can lead to an increased activity of lactate dehydrogenase (LDH). The primary process of G metabolism in the brain is glycolysis, during which G is converted to pyruvate [175]. In the case of excess pyruvate, which can occur with elevated G levels, cells, through the activity of LDH, can convert excess pyruvate to lactate (LA). This process, known as lactate fermentation, can occur under conditions of hypoxia or when the electron flow in the respiratory chain is limited [175]. Similarly, in the current study, we observed significantly increased striatal LDH activity observed in juvenile SHRs compared to controls. Increased LDH activity leads to elevated LA production, resulting in an increased demand for monocarboxylate transporter 1 (MCT1) to remove excess lactate from cells and maintain homeostasis. This is consistent with previous studies by Medin et al. [176], demonstrating the increased expression of the LA transporter MCT1 in brain microvessels in juvenile SHRs [176]. Interestingly, in our study, a significant increase in LA levels was observed only in maturing SHRs. This phenomenon may be attributed to observed elevated levels of AKT-1, which is associated with LA synthesis in astrocytes [177]. It is worth mentioning that LA plays a diverse role in brain energetics. Firstly, it supports energy production in nerve cells, leading to synaptic remodeling, increased axonal excitability, and the facilitation of memory formation [178]. These actions may explain the presence of compensatory mechanisms that counteract anatomical and physiological abnormalities observed in the ADHD brain. In some conditions, elevated levels of LA may contribute to the formation of lactic acid–calcium complexes, which can downregulate synaptic transmission in the GABAergic system and neuronal function, what have been found in children [179] and also in adult ADHD patients [180,181,182]. The exact role of LDH and LA in the brain function of people with ADHD is still under active debate and requires further research. Nevertheless, increased LA production and increased LDH activity may correlate with impaired homeostasis and the escalation of oxidative stress in the brain [183,184]. Elevated concentrations of these substances may cause excessive ROS production, which may result in cell and mitochondria damage [184].
Moreover, we observed heightened activities of alanine transaminase (ALT) and aspartate transaminase (AST) in juvenile SHRs when compared to age-matched controls. Similarly, elevated levels of these enzymes were previously observed in the serum and PFC of juvenile SHRs [30,185]. These factors serve as common indicators of necrosis, cell damage, and mitochondrial dysfunction. The elevation in ALT and AST activity could be attributed to oxidative stress, known to inflict damage on both cells and mitochondria [186,187]. Reactive oxygen species generated during oxidative stress can disrupt mitochondrial membranes and enzymes, potentially leading to the release of these enzymes into the bloodstream. Furthermore, Skalny et al. [188]. reported increased levels of the amino acids alanine and asparagine in the serum of children with ADHD [188], a phenomenon possibly linked to heightened ALT and AST activity.
Additionally, our study revealed elevated levels of iron (Fe) in the striatum of juvenile SHRs compared to age-matched controls. Fe plays a pivotal role in cellular function and maintaining metabolic balance [189]. Primarily, it is essential for the optimal functioning of the mitochondrial respiratory chain, the primary source of cellular energy. Furthermore, it facilitates electron transfer within this chain, leading to energy production, and plays a crucial role in protecting cells from oxidative stress by participating in the activity of antioxidant enzymes such as catalase and glutathione peroxidase [189,190]. It is significant to note that prolonged iron overload in the striatum of young SHRs could potentially instigate neurodegenerative changes within this brain region. These alterations may include oxidative stress, lipid peroxidation, blood–brain barrier disruption, and neuronal death, as has been previously observed in Alzheimer’s disease patients [191,192,193,194]. Therefore, the increased Fe levels in the striatum of maturing SHRs may result from the heightened oxidative stress and structural damage observed in the striatal areas in our study [195]. This finding is consistent with previous research indicating elevated Fe and ferritin levels following hypertensive or ischemic brain injury in SHRs [196,197]. It should be mentioned that the available literature data on Fe levels in patients with ADHD present conflicting findings. For instance, Chen et al. [198] observed significantly elevated Fe levels in children with ADHD, while other studies indicate no differences in Fe levels in children and adults with this disorder [199,200]. Discrepancies in Fe levels in human studies on ADHD may arise from the fact that Fe levels in pathologically altered tissues could be higher than in peripheral tissues such as blood, plasma, and serum. Additionally, variations in methodological approaches to Fe measurement and the presence of comorbidities or medication use could also contribute to the observed differences. Furthermore, dietary factors, exposure to environmental toxins, and genetic influences on Fe metabolism may play a role in these differences [201,202]. Therefore, careful consideration and control of these factors are crucial for interpreting and comparing results across studies.
Additionally, it should be emphasized that the observed elevation of most metabolic markers in juvenile SHRs compared to age-matched control animals may result from the fact that the SHR strain exhibits increased sympathetic activity compared to WKYs, which could influence metabolic differences.
Interestingly, we observed elevated levels of LA combined with reduced LDH activity in 10-week-old SHRs, which may suggest a disruption in glycolytic metabolism and energy homeostasis. Reduced LDH activity could impair the conversion of LA into pyruvate, leading to LA accumulation and potential mitochondrial dysfunction, which is associated with oxidative stress and neuroinflammation [203].

4. Materials and Methods

4.1. Animals

The selection of animal strains was conducted with meticulous care to ensure the highest reliability in the results. Additionally, it is worth noting that the identical rat strains were systematically evaluated in our previous research [29,30,31,35,66,107,204]. Importantly, no statistically significant distinctions in mean body weight were detected between the test group (SHRs) and the control group Wistar Kyoto rats (WKYs) at corresponding age stages (Table 1). Importantly, an identical number of sections per animal was consistently analyzed, contingent upon the striatal region under study and the developmental stage. The starting and ending points for each assessed brain remained constant throughout.

4.1.1. Animals with Transcardial Perfusion

Two cohorts of male rats (WKYs as a control group and SHRs as an animal model for ADHD) aged 4–10 weeks (seven distinct age stages; n = 5–6, for each strain at each age) were used to trace age-series alterations in brain morphometry. All rats involved in this study (aged 3 weeks) were acquired from Charles River Laboratory Germany GmbH (Sulzfeld, Germany). Subsequently, the animals were conveyed to the animal house at the Institute of Animal Reproduction and Food Research of the Polish Academy of Sciences in Olsztyn (Olsztyn, Poland), where they were accommodated in threes (to avoid potential isolation-related stress) in accordance with standard laboratory conditions: light/dark cycle (12/12 h), ventilation (12–20 exchanges/h), and temperature (21 ± 1 °C). All rats were provided ad libitum access to drinking water and the same grain mixture (VRF1 diet, Charles River Laboratories, Germany). All animal procedures were approved by the Local Ethics Committee for Animal Experimentation at the University of Warmia and Mazury in Olsztyn, Poland (permission number: no. 43/2014). Animal care and handling strictly adhered to the European Union Directive for animal experiments (2010/63/EU). Every effort was made to minimize animal suffering and limit the use of animals to the minimum necessary to obtain accurate scientific data.

4.1.2. Animals Without Transcardial Perfusion

Twenty-four rats, aged 3 weeks, were procured from Charles River Laboratory Germany GmbH (Sulzfeld, Germany), and subsequently transferred to the animal house at the Institute of Animal Reproduction and Food Research of the Polish Academy of Sciences in Olsztyn, Poland. All animals were consistently provided the same housing, nutrition, and hydration conditions as detailed earlier. Within each group (WKYs and SHRs), animals were analyzed at two distinct developmental stages (n = 6 at each age stage), 5 weeks (juvenile) and 10 weeks (maturing), to investigate differences in immunological, oxidative stress, and metabolic marker content within the striatum. Animal care and handling were conducted in strict conformity with the regulations stipulated by the European Union Directive pertaining to animal experimentation and the 3Rs principles, which stand for Replacement, Reduction, and Refinement. The experiments were meticulously reported in adherence to the ARRIVE guidelines, underscoring our commitment to minimizing any potential suffering or distress experienced by the animals.

4.2. Preparation of Brains

4.2.1. Preparation of Brains for Neuron-Specific Nuclear Protein (NeuN) Staining

After undergoing a standard habituation phase (7 days), both SHRs and WKYs were subjected to identical experimental protocols. The rats were deeply anesthetized via intraperitoneal administration of pentobarbital (Morbital, Biowet, Puławy, Poland; 50 mg/kg body weight) in accordance with the guidelines provided by the Humane Society Veterinary Medical Association. After the cessation of respiration, they underwent transcardial perfusion with 0.9% saline, followed by a solution of 4% paraformaldehyde (PFA; pH 7.4; 1040051000, Merck, Darmstadt, Germany) in phosphate-buffered saline (PBS; P5493, Sigma-Aldrich, Darmstadt, Germany) to maintain the natural state of the tissue. After all, the brains were dissected from the skulls and subjected to post-fixation in 4% PFA for 24 h. Following this, the brains were thoroughly rinsed three times with 0.1 M PBS (pH = 7.4, 4 °C), and then cryoprotected (4 days) in a series of graded sucrose (363-117720907, ALCHEM, Toruń, Poland) solutions (10%, 20%, and 30%) at 4 °C. After all, the coronal sections (10 μm thickness each), were precision-cut using a cryostat. These brain sections were then kept attached to the object slides and safely stored at −80 °C for subsequent tissue processing.

4.2.2. Neuron-Specific Nuclear Protein (NeuN) Staining

Following the fixation process, the brains were sliced into 10 µm-thick sections. Specifically, every 25th brain section, with intervals of 250 µm between them, was designated for subsequent immunoenzymatic staining. The protocols for immunostaining were executed in accordance with the methodology documented in prior report [35]. “For the experiment, anti-NeuN antibody was selected because it is an exceptional marker for neurons in the central and peripheral nervous systems at embryonic, juvenile, and adult stages” [205]. Every 25th frozen section was allocated for standard immunoperoxidase labeling utilizing DAB (Dako Liquid DAB + Substrate Chromogen System, K3468, Denmark) as the chromogen, following the methodology outlined in the earlier publication [35]. In summary, selected sections were subjected to an overnight incubation with primary antibodies targeting NeuN (a pan-neuronal marker; Anti-NeuN Antibody, clone A60, MAB377; Merck Millipore, Poland; working dilution 1/1000). Subsequently, these sections underwent a 1 h incubation with secondary antibodies (working dilution 1/1000, ImmPRESS™ Universal Reagent (Vector Laboratories, Newark, United States)). After this procedure, the sections were washed with PBS and incubated for 1 min in a DAB substrate-chromogen solution prepared in accordance with the manufacturer’s instructions. All stained tissues were further rinsed with tap water, rehydrated through a graded alcohol series, cleaned in xylene, and finally mounted using DPX (DPX Mountain for histology; 44581, Sigma Aldrich, Darmstadt, Germany). All staining procedures were conducted at room temperature within humid chambers. The processed sections were subsequently digitized and archived using a PathScan Enabler IV Histology Slide Scanner (Praha, Czech Republic).

4.2.3. Preparation of Brains for Measuring the Content of Inflammatory, Oxidative Stress, and Metabolic Markers

After a 7-day habituation phase, the 24 animals were categorized into the following groups (n = 6 at each group): (1) Control 5-week-old WKYs (juvenile); (2) Control 10-week-old WKYs (maturing); (3) ADHD 5-week-old SHRs (juvenile); and (4) ADHD 10-week-old SHRs (maturing). The animals were anesthetized via an intraperitoneal injection of ketamine (100 mg/kg) and xylazine (10 mg/kg), in adherence to established guidelines for the humane euthanasia of experimental animals. To minimize the influence of ketamine on our data, tissue collection was standardized and performed no later than 10 min after ketamine administration (after cessation of breathing and disappearance of reflexes), based on prior research indicating this window reduces its acute effects on brain biochemistry [206,207]. The same anesthetic protocol was used across all experimental groups to ensure consistency. All brains were collected and cryopreserved in liquid nitrogen (−196 °C) and subsequently stored at −80 °C pending further processing.

4.3. Morphometric Analysis of Motor Cortex

4.3.1. Volumetric Analyses

The boundaries of the distinct striatal areas (Figure 6A,B), including the caudate putamen (CPu), external globus pallidus (EGP), accumbens shell (LaCBsH), and nucleus accumbens core (AcbC), were precisely defined based on coordinates aligning with bregma 2.52 mm to −3.72 mm, referencing the Paxinos and Watson atlas [208]. Additionally, the delineation of the striatal area boundaries followed the criteria proposed by Oorschot [209]. Briefly, volumetric measurements were performed on digitally archived coronal brain sections at a 5.0x magnification using the Fiji image analysis software (FIJI 1.46p, Madison, USA) [210]. Next, the calculation of the total volume of distinct striatal areas was accomplished using the method established by DeVito et al. [211]. According to this mathematical formulation, the total volume of a given structure (Vo) is the sum of the subvolumes within the said structure (Vn). It is noteworthy to mention that the Vn was computed by the multiplication of the 2-D contour area (representing the boundaries of the individual striatal regions) by the inter-section spacing of 250 μm.

4.3.2. The Density Quantification

The quantification of neuronal density within the studied striatal regions (CPu, EGP, LaCBsH, and AcbC) was conducted on stained brain sections. This analysis was carried out using an Olympus BX51 microscope (Olympus GmbH, Hamburg, Germany) equipped with a digital camera (CC-12, Soft Imaging System, Münster, Germany) and the Cell-F software (Cell-F 5.1.0.2108, Olympus, Hamburg, Germany). The count of labeled neurons nuclei was performed in accordance with the method outlined by West and Gundersen [212] at a magnification of 40×, using the 152.86 µm × 114.81 µm fields as the testing frames, considering a section thickness (10 µm). The neuron count obtained for a particular structure was first averaged across all the studied brain sections, and, subsequently, the averages for each developmental stage were calculated and expressed as the number of neurons per cubic millimeter (N/mm3).

4.4. Assessment of Immune, Oxidative Stress, and Metabolic Markers

A comprehensive explanation for selecting the immune, oxidative stress, and metabolic markers in this study is provided in our previous report [30].

Preparation of Test Material and Determination of Immune, Oxidative Stress, and Metabolic Markers/Enzymes

To determine the levels of inflammatory, oxidative stress, and metabolic markers/enzymes in the rats striatum, distinct brain regions were isolated based on the Rat Brain Atlas [208]. Subsequently, the isolated brain parts were homogenized in RIPA buffer at 4 °C. The homogenates were then subjected to centrifugation at 30,000× g for 1 h. Following procedure, the resulting tissue supernatants were divided into aliquots and stored at −80 °C. These supernatants were utilized for subsequent measurements. The detailed procedures for quantifying the levels/activity of selected markers are presented in table below (Table 2).

4.5. Statistics

The statistical analysis began with preliminary assessments, including normality testing using the Shapiro–Wilk test and homogeneity of variance testing using Levene’s test, which were necessary to confirm the assumptions required for subsequent statistical evaluations. A two-way ANOVA was then conducted with strain and age as independent factors. To obtain reliable, accurate, and properly interpreted statistical results, the Bonferroni post hoc test was subsequently applied. Comparisons between hemispheres were based on ANOVA analysis, which encompassed the entire dataset (for both hemispheres). All statistical procedures were performed using GraphPad Prism 8 (GraphPad Software, La Jolla, CA, USA), with a significance level set at p < 0.05. Detailed data for each two-way ANOVA analysis are included in Supplementary Materials.

5. Limitations of a Study

Although SHRs are widely used and accepted as a research model for studying changes in striatal regions, such as alterations in structural volume, neuron density, inflammation, and oxidative stress, this animal model has several limitations that may hinder the translation of the findings to human ADHD pathology.
Both rodents and humans exhibit a similar structural organization of the striatum, which is divided into functional subregions. In both species, the striatum is composed of the caudate nucleus and putamen, which are involved in motor control and cognitive functions. The dorsal striatum is primarily associated with motor functions, while the ventral striatum (including the nucleus accumbens) is implicated in reward processing and reinforcement learning [218]. Nevertheless, one of the most notable differences is the anatomical separation of the caudate and putamen in humans, which is marked by the internal capsule. In rodents, these structures are not anatomically distinct and are referred to collectively as the CPu [219].
Moreover, WKYs are genetically related to SHRs, as both strains originate from the same ancestor. This genetic relationship makes WKYs an appropriate control for identifying the behavioral and neurobiological aspects of ADHD in SHRs [220]. WKYs are frequently used as a reference point to evaluate the effects of hypertension and hyperactivity phenotypes observed in SHRs. However, WKYs (aged 7 to 20 weeks) have been identified as a model for depressive behaviors, exhibiting increased immobility in forced swim tests and other indicators of depression [221]. This characteristic can confound results when using WKYs as controls, as any observed behavioral differences may not solely reflect ADHD-related symptoms but could also be influenced by underlying depressive states.

6. Conclusions

The results presented in this article regarding striatal changes significantly expand our understanding of ADHD pathophysiology in the SHR animal model. The prepubertal period, corresponding to weeks 5–7 in SHRs (equivalent to 7–10 years of age in humans), appears to be critical for the development of ADHD-related pathologies. During this time, the most substantial morphometric and biochemical changes occur, particularly in the striatum. These changes likely contribute to difficulties in attention and self-regulation, which are hallmark symptoms of ADHD in both SHRs and humans.
Inflammation and oxidative stress, closely interconnected processes, may lead to neuronal damage and neurotransmitter disruptions. Both the existing literature and our findings suggest that inflammation and oxidative stress interfere with normal neurobiological development, causing neuronal damage and morphological changes in brain structures, including the striatum. These areas play a crucial role in attention regulation and behavioral control [222,223]. Additionally, these conditions disrupt the dopaminergic pathways, which are essential for managing attention and impulsivity [34,224]. Studies have demonstrated abnormalities in dopaminergic signaling in individuals with ADHD [225,226] and in SHRs [29]. Such disruptions may impair cortico-striatal circuits, essential for regulating attention and behavior, thus contributing to the core symptoms of ADHD.
Based on the findings presented in this study, several promising research directions can be proposed to advance our understanding and treatment of ADHD. These directions could focus on specific biochemical markers and signaling pathways involved in ADHD pathophysiology, particularly inflammation, oxidative stress, and dopaminergic dysfunction. One potential hypothesis is that targeting inflammation through anti-inflammatory agents or cytokine inhibitors could mitigate ADHD symptoms by reducing neuroinflammation during critical developmental periods. Another avenue involves developing antioxidants or compounds to modulate oxidative stress pathways, potentially restoring dopaminergic signaling and alleviating the behavioral symptoms of ADHD. Investigating how inflammation and oxidative stress impact dopaminergic signaling could lead to targeted interventions that restore normal DA function in ADHD. Lastly, exploring the role of neuroplasticity, precision medicine approaches, and metabolic pathway modulation could offer new therapeutic strategies to address the molecular mechanisms driving ADHD and provide more personalized treatments. In summary, the insights derived from these studies can help bridge the gap between fundamental neurobiological research and clinical applications, offering a pathway toward more precise and effective interventions. This could pave the way for personalized therapeutic approaches addressing the molecular mechanisms underlying ADHD.

Supplementary Materials

The following supporting information can be downloaded at: www.mdpi.com/article/10.3390/ijms252413652/s1.

Author Contributions

Conceptualization: E.B.-C. and A.K.; methodology: E.B.-C., A.K. and P.W.; investigation: E.B.-C.; writing—original draft preparation: E.B.-C.; writing—review and editing: E.B.-C. and A.K.; visualization: E.B.-C.; supervision: A.K., A.C.W.H. and M.-L.T.; project administration: E.B.-C. and A.K.; funding acquisition: A.K. and M.-L.T. All authors have read and agreed to the published version of the manuscript.

Funding

This research was supported by funding from the National Centre for Research and Development of Poland (PL-TW II/4/2015), as well as from the Statutory Fund of the School of Medicine, Collegium Medicum (61.610.008-110), University of Warmia and Mazury in Olsztyn, Ministry of Science and Technology of Taiwan (104-2923-B-197-001-MY3).

Institutional Review Board Statement

The study was conducted according to the guidelines of the Declaration of Helsinki, and approved by the Local Ethics Committee for Animal Experimentation at the University of Warmia and Mazury in Olsztyn, Poland (approval no. 43/2014). All procedures complied strictly with the European Union Directive on the protection of animals used for scientific purposes (2010/63/EU). The research was carried out in full accordance with applicable local regulations and institutional guidelines.

Informed Consent Statement

Not applicable.

Data Availability Statement

The data presented in this study are available on request from the corresponding author.

Acknowledgments

We express our gratitude to Maciej Równiak for his significant role in the conceptualization, investigation, and development of the methodology, and to Małgorzata Kolenkiewicz for her valuable support during the immunohistochemical procedures.

Conflicts of Interest

The authors declare that the research was conducted in the absence of any commercial or financial relationships that could be construed as a potential conflict of interest.

References

  1. Wilens, T.E.; Spencer, T.J. Understanding Attention-Deficit/Hyperactivity Disorder from Childhood to Adulthood. Postgrad. Med. 2010, 122, 97–109. [Google Scholar] [CrossRef] [PubMed]
  2. Nijmeijer, J.S.; Minderaa, R.B.; Buitelaar, J.K.; Mulligan, A.; Hartman, C.A.; Hoekstra, P.J. Attention-deficit/hyperactivity disorder and social dysfunctioning. Clin. Psychol. Rev. 2008, 28, 692–708. [Google Scholar] [CrossRef] [PubMed]
  3. Danielson, M.L.; Claussen, A.H.; Bitsko, R.H.; Katz, S.M.; Newsome, K.; Blumberg, S.J.; Kogan, M.D.; Ghandour, R. ADHD Prevalence Among U.S. Children and Adolescents in 2022: Diagnosis, Severity, Co-Occurring Disorders, and Treatment. J. Clin. Child Adolesc. Psychol. 2024, 53, 343–360. [Google Scholar] [CrossRef] [PubMed]
  4. Song, P.; Zha, M.; Yang, Q.; Zhang, Y.; Li, X.; Rudan, I. The prevalence of adult attention-deficit hyperactivity disorder: A global systematic review and meta-analysis. J. Glob. Health 2021, 11, 04009. [Google Scholar] [CrossRef]
  5. Kates, N. Attention deficit disorder in adults. Management in primary care. Can. Fam. Physician 2005, 51, 53–59. [Google Scholar]
  6. Magnus, W.; Nazir, S.; Anilkumar, A.C.; Shaban, K. Attention Deficit Hyperactivity Disorder. In StatPearls; StatPearls Publishing: Treasure Island, FL, USA, 2024; Available online: http://www.ncbi.nlm.nih.gov/books/NBK441838/ (accessed on 23 August 2024).
  7. Almeida, L.G.; Ricardo-Garcell, J.; Prado, H.; Barajas, L.; Fernández-Bouzas, A.; Avila, D.; Martínez, R.B. Reduced right frontal cortical thickness in children, adolescents and adults with ADHD and its correlation to clinical variables: A cross-sectional study. J. Psychiatr. Res. 2010, 44, 1214–1223. [Google Scholar] [CrossRef]
  8. Cupertino, R.B.; Soheili-Nezhad, S.; Grevet, E.H.; Bandeira, C.E.; Picon, F.A.; Tavares, M.E.d.A.; Naaijen, J.; van Rooij, D.; Akkermans, S.; Vitola, E.S.; et al. Reduced fronto-striatal volume in attention-deficit/hyperactivity disorder in two cohorts across the lifespan. NeuroImage Clin. 2020, 28, 102403. [Google Scholar] [CrossRef]
  9. Castellanos, F.X. Quantitative Brain Magnetic Resonance Imaging in Attention-Deficit Hyperactivity Disorder. Arch. Gen. Psychiatry 1996, 53, 607. [Google Scholar] [CrossRef]
  10. Castellanos, F.X.; Lee, P.P.; Sharp, W.; Jeffries, N.O.; Greenstein, D.K.; Clasen, L.S.; Blumenthal, J.D.; James, R.S.; Ebens, C.L.; Walter, J.M.; et al. Developmental trajectories of brain volume abnormalities in children and adolescents with attention-deficit/hyperactivity disorder. JAMA 2002, 288, 1740–1748. [Google Scholar] [CrossRef]
  11. Castellanos, F.X.; Giedd, J.N.; Eckburg, P.; Marsh, W.L.; Vaituzis, A.C.; Kaysen, D.; Hamburger, S.D.; Rapoport, J.L. Quantitative morphology of the caudate nucleus in attention deficit hyperactivity disorder. Am. J. Psychiatry 1994, 151, 1791–1796. [Google Scholar] [CrossRef]
  12. Filipek, P.A.; Semrud-Clikeman, M.; Steingard, R.J.; Renshaw, P.F.; Kennedy, D.N.; Biederman, J. Volumetric MRI analysis comparing subjects having attention-deficit hyperactivity disorder with normal controls. Neurology 1997, 48, 589–601. [Google Scholar] [CrossRef] [PubMed]
  13. Hynd, G.W.; Hern, K.L.; Novey, E.S.; Eliopulos, D.; Marshall, R.; Gonzalez, J.J.; Voeller, K.K. Attention deficit-hyperactivity disorder and asymmetry of the caudate nucleus. J. Child Neurol. 1993, 8, 339–347. [Google Scholar] [CrossRef] [PubMed]
  14. Mataró, M.; Garcia-Sánchez, C.; Junqué, C.; Estévez-González, A.; Pujol, J. Magnetic resonance imaging measurement of the caudate nucleus in adolescents with attention-deficit hyperactivity disorder and its relationship with neuropsychological and behavioral measures. Arch. Neurol. 1997, 54, 963–968. [Google Scholar] [CrossRef] [PubMed]
  15. Pineda, D.A.; Restrepo, M.A.; Sarmiento, R.J.; Gutierrez, J.E.; Vargas, S.A.; Quiroz, Y.T.; Hynd, G.W. Statistical analyses of structural magnetic resonance imaging of the head of the caudate nucleus in Colombian children with attention-deficit hyperactivity disorder. J. Child Neurol. 2002, 17, 97–105. [Google Scholar] [CrossRef]
  16. Semrud-Clikeman, M.; Steingard, R.J.; Filipek, P.; Biederman, J.; Bekken, K.; Renshaw, P.F. Using MRI to examine brain-behavior relationships in males with attention deficit disorder with hyperactivity. J. Am. Acad. Child Adolesc. Psychiatry 2000, 39, 477–484. [Google Scholar] [CrossRef]
  17. Utter, A.A.; Basso, M.A. The basal ganglia: An overview of circuits and function. Neurosci. Biobehav. Rev. 2008, 32, 333–342. [Google Scholar] [CrossRef]
  18. Haber, S.N. The primate basal ganglia: Parallel and integrative networks. J. Chem. Neuroanat. 2003, 26, 317–330. [Google Scholar] [CrossRef]
  19. Plichta, M.M.; Scheres, A. Ventral-striatal responsiveness during reward anticipation in ADHD and its relation to trait impulsivity in the healthy population: A meta-analytic review of the fMRI literature. Neurosci. Biobehav. Rev. 2014, 38, 125–134. [Google Scholar] [CrossRef]
  20. Long, Y.; Pan, N.; Ji, S.; Qin, K.; Chen, Y.; Zhang, X.; He, M.; Suo, X.; Yu, Y.; Wang, S.; et al. Distinct brain structural abnormalities in attention-deficit/hyperactivity disorder and substance use disorders: A comparative meta-analysis. Transl. Psychiatry 2022, 12, 368. [Google Scholar] [CrossRef]
  21. Brennan, A.R.; Arnsten, A.F.T. Neuronal Mechanisms Underlying Attention Deficit Hyperactivity Disorder. Ann. N. Y. Acad. Sci. 2008, 1129, 236–245. [Google Scholar] [CrossRef]
  22. Castellanos, F.X.; Sharp, W.S.; Gottesman, R.F.; Greenstein, D.K.; Giedd, J.N.; Rapoport, J.L. Anatomic brain abnormalities in monozygotic twins discordant for attention deficit hyperactivity disorder. Am. J. Psychiatry 2003, 160, 1693–1696. [Google Scholar] [CrossRef] [PubMed]
  23. Castellanos, F.X.; Giedd, J.N.; Berquin, P.C.; Walter, J.M.; Sharp, W.; Tran, T.; Vaituzis, A.C.; Blumenthal, J.D.; Nelson, J.; Bastain, T.M.; et al. Quantitative brain magnetic resonance imaging in girls with attention-deficit/hyperactivity disorder. Arch. Gen. Psychiatry 2001, 58, 289–295. [Google Scholar] [CrossRef] [PubMed]
  24. Hoogman, M.; Bralten, J.; Hibar, D.P.; Mennes, M.; Zwiers, M.P.; Schweren, L.S.J.; van Hulzen, K.J.E.; Medland, S.E.; Shumskaya, E.; Jahanshad, N.; et al. Subcortical brain volume differences in participants with attention deficit hyperactivity disorder in children and adults: A cross-sectional mega-analysis. Lancet Psychiatry 2017, 4, 310–319. [Google Scholar] [CrossRef] [PubMed]
  25. Cha, J.; Fekete, T.; Siciliano, F.; Biezonski, D.; Greenhill, L.; Pliszka, S.R.; Blader, J.C.; Roy, A.K.; Leibenluft, E.; Posner, J. Neural Correlates of Aggression in Medication-Naive Children with ADHD: Multivariate Analysis of Morphometry and Tractography. Neuropsychopharmacology 2015, 40, 1717–1725. [Google Scholar] [CrossRef]
  26. Mills, K.L.; Bathula, D.; Dias, T.G.C.; Iyer, S.P.; Fenesy, M.C.; Musser, E.D.; Stevens, C.A.; Thurlow, B.L.; Carpenter, S.D.; Nagel, B.J.; et al. Altered Cortico-Striatal–Thalamic Connectivity in Relation to Spatial Working Memory Capacity in Children with ADHD. Front. Psychiatry 2012, 3, 2. [Google Scholar] [CrossRef]
  27. Kumar, U.; Arya, A.; Agarwal, V. Altered functional connectivity in children with ADHD while performing cognitive control task. Psychiatry Res. Neuroimaging 2022, 326, 111531. [Google Scholar] [CrossRef]
  28. Oldehinkel, M.; Beckmann, C.F.; Pruim, R.H.R.; van Oort, E.S.B.; Franke, B.; Hartman, C.A.; Hoekstra, P.J.; Oosterlaan, J.; Heslenfeld, D.; Buitelaar, J.K.; et al. Attention-Deficit/Hyperactivity Disorder symptoms coincide with altered striatal connectivity. Biol. Psychiatry Cogn. Neurosci. Neuroimaging 2016, 1, 353. [Google Scholar] [CrossRef]
  29. Kozłowska, A.; Wojtacha, P.; Równiak, M.; Kolenkiewicz, M.; Huang, A.C.W. ADHD pathogenesis in the immune, endocrine and nervous systems of juvenile and maturating SHR and WKY rats. Psychopharmacology 2019, 236, 2937–2958. [Google Scholar] [CrossRef]
  30. Bogdańska-Chomczyk, E.; Równiak, M.; Wojtacha, P.; Tsai, M.-L.; Kozłowska, A. Age-related changes in the architecture and biochemical markers levels in motor-related cortical areas of SHR Ratsan ADHD animal model. Front. Mol. Neurosci. 2024, 17, 1414457. [Google Scholar] [CrossRef]
  31. Hsu, J.-W.; Lee, L.-C.; Chen, R.-F.; Yen, C.-T.; Chen, Y.-S.; Tsai, M.-L. Striatal volume changes in a rat model of childhood attention-deficit/hyperactivity disorder. Psychiatry Res. 2010, 179, 338–341. [Google Scholar] [CrossRef]
  32. Tarver, J.; Daley, D.; Sayal, K. Attention-deficit hyperactivity disorder (ADHD): An updated review of the essential facts. Child Care Health Dev. 2014, 40, 762–774. [Google Scholar] [CrossRef] [PubMed]
  33. Altabella, L.; Zoratto, F.; Adriani, W.; Canese, R. MR imaging-detectable metabolic alterations in attention deficit/hyperactivity disorder: From preclinical to clinical studies. AJNR Am. J. Neuroradiol. 2014, 35, S55–S63. [Google Scholar] [CrossRef]
  34. Joseph, N.; Zhang-James, Y.; Perl, A.; Faraone, S.V. Oxidative Stress and ADHD: A Meta-Analysis. J. Atten. Disord. 2015, 19, 915–924. [Google Scholar] [CrossRef] [PubMed]
  35. Kozłowska, A.; Wojtacha, P.; Równiak, M.; Kolenkiewicz, M.; Tsai, M.-L. Differences in serum steroid hormones concentrations in Spontaneously Hypertensive Rats (SHR)—An animal model of Attention-Deficit/Hyperactivity Disorder (ADHD). Physiol. Res. 2019, 68, 25–36. [Google Scholar] [CrossRef] [PubMed]
  36. Corona, J.C. Role of Oxidative Stress and Neuroinflammation in Attention-Deficit/Hyperactivity Disorder. Antioxidants 2020, 9, 1039. [Google Scholar] [CrossRef] [PubMed]
  37. Cortese, S.; Angriman, M.; Comencini, E.; Vincenzi, B.; Maffeis, C. Association between inflammatory cytokines and ADHD symptoms in children and adolescents with obesity: A pilot study. Psychiatry Res. 2019, 278, 7–11. [Google Scholar] [CrossRef]
  38. Donfrancesco, R.; Nativio, P.; Di Benedetto, A.; Villa, M.P.; Andriola, E.; Melegari, M.G.; Cipriano, E.; Di Trani, M. Anti-Yo Antibodies in Children With ADHD: First Results About Serum Cytokines. J. Atten. Disord. 2020, 24, 1497–1502. [Google Scholar] [CrossRef]
  39. Oades, R.D.; Myint, A.-M.; Dauvermann, M.R.; Schimmelmann, B.G.; Schwarz, M.J. Attention-deficit hyperactivity disorder (ADHD) and glial integrity: An exploration of associations of cytokines and kynurenine metabolites with symptoms and attention. Behav. Brain Funct. 2010, 6, 32. [Google Scholar] [CrossRef]
  40. Chang, S.-J.; Kuo, H.-C.; Chou, W.-J.; Tsai, C.-S.; Lee, S.-Y.; Wang, L.-J. Cytokine Levels and Neuropsychological Function among Patients with Attention-Deficit/Hyperactivity Disorder and Atopic Diseases. J. Pers. Med. 2022, 12, 1155. [Google Scholar] [CrossRef]
  41. Darwish, A.H. Posterior Reversible Encephalopathy Syndrome in Children: A Prospective Follow-up Study. J. Child Neurol. 2020, 35, 55–62. [Google Scholar] [CrossRef]
  42. O’Shea, T.M.; Joseph, R.M.; Kuban, K.C.K.; Allred, E.N.; Ware, J.; Coster, T.; Fichorova, R.N.; Dammann, O.; Leviton, A. ELGAN Study Investigators Elevated blood levels of inflammation-related proteins are associated with an attention problem at age 24 mo in extremely preterm infants. Pediatr. Res. 2014, 75, 781–787. [Google Scholar] [CrossRef] [PubMed]
  43. Felger, J.C.; Miller, A.H. Cytokine Effects on the Basal Ganglia and Dopamine Function: The Subcortical Source of Inflammatory Malaise. Front. Neuroendocrinol. 2012, 33, 315–327. [Google Scholar] [CrossRef] [PubMed]
  44. Oades, R.D.; Dauvermann, M.R.; Schimmelmann, B.G.; Schwarz, M.J.; Myint, A.-M. Attention-deficit hyperactivity disorder (ADHD) and glial integrity: S100B, cytokines and kynurenine metabolism--effects of medication. Behav. Brain Funct. 2010, 6, 29. [Google Scholar] [CrossRef] [PubMed]
  45. di Penta, A.; Moreno, B.; Reix, S.; Fernandez-Diez, B.; Villanueva, M.; Errea, O.; Escala, N.; Vandenbroeck, K.; Comella, J.X.; Villoslada, P. Oxidative Stress and Proinflammatory Cytokines Contribute to Demyelination and Axonal Damage in a Cerebellar Culture Model of Neuroinflammation. PLoS ONE 2013, 8, e54722. [Google Scholar] [CrossRef] [PubMed]
  46. Taherkhani, S.; Suzuki, K.; Castell, L. A Short Overview of Changes in Inflammatory Cytokines and Oxidative Stress in Response to Physical Activity and Antioxidant Supplementation. Antioxidants 2020, 9, 886. [Google Scholar] [CrossRef]
  47. Yang, D.; Elner, S.G.; Bian, Z.-M.; Till, G.O.; Petty, H.R.; Elner, V.M. Pro-inflammatory Cytokines Increase Reactive Oxygen Species through Mitochondria and NADPH Oxidase in Cultured RPE Cells. Exp. Eye Res. 2007, 85, 462–472. [Google Scholar] [CrossRef]
  48. Liu, X.; Lin, J.; Zhang, H.; Khan, N.U.; Zhang, J.; Tang, X.; Cao, X.; Shen, L. Oxidative Stress in Autism Spectrum Disorder—Current Progress of Mechanisms and Biomarkers. Front. Psychiatry 2022, 13, 813304. Available online: https://www.frontiersin.org/articles/10.3389/fpsyt.2022.813304 (accessed on 25 October 2023). [CrossRef]
  49. Nishimura, Y.; Kanda, Y.; Sone, H.; Aoyama, H. Oxidative Stress as a Common Key Event in Developmental Neurotoxicity. Oxid. Med. Cell. Longev. 2021, 2021, 6685204. [Google Scholar] [CrossRef]
  50. Oztop, D.; Altun, H.; Baskol, G.; Ozsoy, S. Oxidative stress in children with attention deficit hyperactivity disorder. Clin. Biochem. 2012, 45, 745–748. [Google Scholar] [CrossRef]
  51. Usui, N.; Kobayashi, H.; Shimada, S. Neuroinflammation and Oxidative Stress in the Pathogenesis of Autism Spectrum Disorder. Int. J. Mol. Sci. 2023, 24, 5487. [Google Scholar] [CrossRef]
  52. Chen, X.; Guo, C.; Kong, J. Oxidative stress in neurodegenerative diseases. Neural Regen. Res. 2012, 7, 376–385. [Google Scholar] [CrossRef] [PubMed]
  53. Guo, C.; Sun, L.; Chen, X.; Zhang, D. Oxidative stress, mitochondrial damage and neurodegenerative diseases. Neural Regen. Res. 2013, 8, 2003–2014. [Google Scholar] [CrossRef] [PubMed]
  54. Amen, D.G.; Carmichael, B.D. High-resolution brain SPECT imaging in ADHD. Ann. Clin. Psychiatry 1997, 9, 81–86. [Google Scholar] [CrossRef]
  55. Sieg, K.G.; Gaffney, G.R.; Preston, D.F.; Hellings, J.A. SPECT brain imaging abnormalities in attention deficit hyperactivity disorder. Clin. Nucl. Med. 1995, 20, 55–60. [Google Scholar] [CrossRef]
  56. Zametkin, A.J.; Liebenauer, L.L.; Fitzgerald, G.A.; King, A.C.; Minkunas, D.V.; Herscovitch, P.; Yamada, E.M.; Cohen, R.M. Brain metabolism in teenagers with attention-deficit hyperactivity disorder. Arch. Gen. Psychiatry 1993, 50, 333–340. [Google Scholar] [CrossRef]
  57. Zametkin, A.J.; Nordahl, T.E.; Gross, M.; King, A.C.; Semple, W.E.; Rumsey, J.; Hamburger, S.; Cohen, R.M. Cerebral glucose metabolism in adults with hyperactivity of childhood onset. N. Engl. J. Med. 1990, 323, 1361–1366. [Google Scholar] [CrossRef]
  58. Lou, H.C. Etiology and pathogenesis of attention-deficit hyperactivity disorder (ADHD): Significance of prematurity and perinatal hypoxic-haemodynamic encephalopathy. Acta Paediatr. 1996, 85, 1266–1271. [Google Scholar] [CrossRef]
  59. Lou, H.C.; Henriksen, L.; Bruhn, P. Focal cerebral dysfunction in developmental learning disabilities. Lancet Lond. Engl. 1990, 335, 8–11. [Google Scholar] [CrossRef]
  60. Lou, H.C.; Henriksen, L.; Bruhn, P.; Børner, H.; Nielsen, J.B. Striatal dysfunction in attention deficit and hyperkinetic disorder. Arch. Neurol. 1989, 46, 48–52. [Google Scholar] [CrossRef]
  61. Lou, H.C.; Henriksen, L.; Bruhn, P. Focal cerebral hypoperfusion in children with dysphasia and/or attention deficit disorder. Arch. Neurol. 1984, 41, 825–829. [Google Scholar] [CrossRef]
  62. Kim, D.; Yadav, D.; Song, M. An updated review on animal models to study attention-deficit hyperactivity disorder. Transl. Psychiatry 2024, 14, 187. [Google Scholar] [CrossRef] [PubMed]
  63. Johansen, E.B.; Sagvolden, T.; Kvande, G. Effects of delayed reinforcers on the behavior of an animal model of attention-deficit/hyperactivity disorder (ADHD). Behav. Brain Res. 2005, 162, 47–61. [Google Scholar] [CrossRef] [PubMed]
  64. Johansen, E.B.; Killeen, P.R.; Sagvolden, T. Behavioral variability, elimination of responses, and delay-of-reinforcement gradients in SHR and WKY rats. Behav. Brain Funct. 2007, 3, 60. [Google Scholar] [CrossRef] [PubMed]
  65. Sontag, T.A.; Tucha, O.; Walitza, S.; Lange, K.W. Animal models of attention deficit/hyperactivity disorder (ADHD): A critical review. Atten. Deficit Hyperact. Disord. 2010, 2, 1–20. [Google Scholar] [CrossRef]
  66. Bogdańska-Chomczyk, E.; Równiak, M.; Huang, A.C.-W.; Kozłowska, A. Parvalbumin interneuron deficiency in the prefrontal and motor cortices of spontaneously hypertensive rats: An attention-deficit hyperactivity disorder animal model insight. Front. Psychiatry 2024, 15, 1359237. [Google Scholar] [CrossRef]
  67. Watanabe, Y.; Fujita, M.; Ito, Y.; Okada, T.; Kusuoka, H.; Nishimura, T. Brain dopamine transporter in spontaneously hypertensive rats. J. Nucl. Med. 1997, 38, 470–474. [Google Scholar]
  68. Simchon, Y.; Weizman, A.; Rehavi, M. The effect of chronic methylphenidate administration on presynaptic dopaminergic parameters in a rat model for ADHD. Eur. Neuropsychopharmacol. 2010, 20, 714–720. [Google Scholar] [CrossRef]
  69. Coelho-Santos, V.; Cardoso, F.L.; Leitão, R.A.; Fontes-Ribeiro, C.A.; Silva, A.P. Impact of developmental exposure to methylphenidate on rat brain’s immune privilege and behavior: Control versus ADHD model. Brain. Behav. Immun. 2018, 68, 169–182. [Google Scholar] [CrossRef]
  70. Park, S.; Shin, J.; Hong, Y.; Kim, S.; Lee, S.; Park, K.; Lkhagvasuren, T.; Lee, S.-R.; Chang, K.-T.; Hong, Y. Forced Exercise Enhances Functional Recovery after Focal Cerebral Ischemia in Spontaneously Hypertensive Rats. Brain Sci. 2012, 2, 483. [Google Scholar] [CrossRef]
  71. França, A.P.; Schamne, M.G.; De Souza, B.S.; Da Luz Scheffer, D.; Bernardelli, A.K.; Corrêa, T.; De Souza Izídio, G.; Latini, A.; Da Silva-Santos, J.E.; Canas, P.M.; et al. Caffeine Consumption plus Physical Exercise Improves Behavioral Impairments and Stimulates Neuroplasticity in Spontaneously Hypertensive Rats (SHR): An Animal Model of Attention Deficit Hyperactivity Disorder. Mol. Neurobiol. 2020, 57, 3902–3919. [Google Scholar] [CrossRef]
  72. Wender, P.H.; Wolf, L.E.; Wasserstein, J. Adults with ADHD: An Overview. Ann. N. Y. Acad. Sci. 2001, 931, 1–16. [Google Scholar] [CrossRef] [PubMed]
  73. Sobel, L.J.; Bansal, R.; Maia, T.V.; Sanchez, J.; Mazzone, L.; Durkin, K.; Liu, J.; Hao, X.; Ivanov, I.; Miller, A.; et al. Basal Ganglia Surface Morphology and the Effects of Stimulant Medications in Youth With Attention Deficit Hyperactivity Disorder. Am. J. Psychiatry 2010, 167, 977–986. [Google Scholar] [CrossRef] [PubMed]
  74. Brain Development Cooperative Group. Total and regional brain volumes in a population-based normative sample from 4 to 18 years: The NIH MRI Study of Normal Brain Development. Cereb. Cortex 2012, 22, 1–12. [Google Scholar] [CrossRef] [PubMed]
  75. Greven, C.U.; Bralten, J.; Mennes, M.; O’Dwyer, L.; van Hulzen, K.J.E.; Rommelse, N.; Schweren, L.J.S.; Hoekstra, P.J.; Hartman, C.A.; Heslenfeld, D.; et al. Developmentally Stable Whole-Brain Volume Reductions and Developmentally Sensitive Caudate and Putamen Volume Alterations in Those With Attention-Deficit/Hyperactivity Disorder and Their Unaffected Siblings. JAMA Psychiatry 2015, 72, 490–499. [Google Scholar] [CrossRef] [PubMed]
  76. Nakao, T.; Radua, J.; Rubia, K.; Mataix-Cols, D. Gray matter volume abnormalities in ADHD: Voxel-based meta-analysis exploring the effects of age and stimulant medication. Am. J. Psychiatry 2011, 168, 1154–1163. [Google Scholar] [CrossRef]
  77. Frodl, T.; Skokauskas, N. Meta-analysis of structural MRI studies in children and adults with attention deficit hyperactivity disorder indicates treatment effects. Acta Psychiatr. Scand. 2012, 125, 114–126. [Google Scholar] [CrossRef]
  78. Ahrendts, J.; Rüsch, N.; Wilke, M.; Philipsen, A.; Eickhoff, S.B.; Glauche, V.; Perlov, E.; Ebert, D.; Hennig, J.; van Elst, L.T. Visual cortex abnormalities in adults with ADHD: A structural MRI study. World J. Biol. Psychiatry 2011, 12, 260–270. [Google Scholar] [CrossRef]
  79. Depue, B.E.; Burgess, G.C.; Bidwell, L.C.; Willcutt, E.G.; Banich, M.T. Behavioral performance predicts grey matter reductions in the right inferior frontal gyrus in young adults with combined type ADHD. Psychiatry Res. 2010, 182, 231–237. [Google Scholar] [CrossRef]
  80. Seidman, L.J.; Valera, E.M.; Makris, N.; Monuteaux, M.C.; Boriel, D.L.; Kelkar, K.; Kennedy, D.N.; Caviness, V.S.; Bush, G.; Aleardi, M.; et al. Dorsolateral prefrontal and anterior cingulate cortex volumetric abnormalities in adults with attention-deficit/hyperactivity disorder identified by magnetic resonance imaging. Biol. Psychiatry 2006, 60, 1071–1080. [Google Scholar] [CrossRef]
  81. Onnink, A.M.H.; Zwiers, M.P.; Hoogman, M.; Mostert, J.C.; Kan, C.C.; Buitelaar, J.; Franke, B. Brain alterations in adult ADHD: Effects of gender, treatment and comorbid depression. Eur. Neuropsychopharmacol. 2014, 24, 397–409. [Google Scholar] [CrossRef]
  82. Biezonski, D.; Shah, R.; Krivko, A.; Cha, J.; Guilfoyle, D.N.; Hrabe, J.; Gerum, S.; Xie, S.; Duan, Y.; Bansal, R.; et al. Longitudinal magnetic resonance imaging reveals striatal hypertrophy in a rat model of long-term stimulant treatment. Transl. Psychiatry 2016, 6, e884. [Google Scholar] [CrossRef] [PubMed]
  83. Lolansen, S.D.; Barbuskaite, D.; Ye, F.; Xiang, J.; Keep, R.F.; MacAulay, N. Spontaneously hypertensive rats can become hydrocephalic despite undisturbed secretion and drainage of cerebrospinal fluid. Fluids Barriers CNS 2023, 20, 53. [Google Scholar] [CrossRef] [PubMed]
  84. Douglas, P.K.; Gutman, B.; Anderson, A.; Larios, C.; Lawrence, K.E.; Narr, K.; Sengupta, B.; Cooray, G.; Douglas, D.B.; Thompson, P.M.; et al. Hemispheric Brain Asymmetry Differences in Youths with Attention-Deficit/Hyperactivity Disorder. Neuroimage Clin. 2018, 18, 744–752. Available online: https://www.ncbi.nlm.nih.gov/pmc/articles/PMC5988460/ (accessed on 10 March 2024). [CrossRef] [PubMed]
  85. Ellison-Wright, I.; Ellison-Wright, Z.; Bullmore, E. Structural brain change in Attention Deficit Hyperactivity Disorder identified by meta-analysis. BMC Psychiatry 2008, 8, 51. [Google Scholar] [CrossRef]
  86. Valera, E.M.; Faraone, S.V.; Murray, K.E.; Seidman, L.J. Meta-analysis of structural imaging findings in attention-deficit/hyperactivity disorder. Biol. Psychiatry 2007, 61, 1361–1369. [Google Scholar] [CrossRef]
  87. Schrimsher, G.W.; Billingsley, R.L.; Jackson, E.F.; Moore, B.D. Caudate nucleus volume asymmetry predicts attention-deficit hyperactivity disorder (ADHD) symptomatology in children. J. Child Neurol. 2002, 17, 877–884. [Google Scholar] [CrossRef]
  88. Dang, L.C.; Samanez-Larkin, G.R.; Young, J.S.; Cowan, R.L.; Kessler, R.M.; Zald, D.H. Caudate asymmetry is related to attentional impulsivity and an objective measure of ADHD-like attentional problems in healthy adults. Brain Struct. Funct. 2016, 221, 277–286. [Google Scholar] [CrossRef]
  89. Sun, L.; Jin, Z.; Zang, Y.; Zeng, Y.-W.; Liu, G.; Li, Y.; Seidman, L.J.; Faraone, S.V.; Wang, Y. Differences between attention-deficit disorder with and without hyperactivity: A 1H-magnetic resonance spectroscopy study. Brain Dev. 2005, 27, 340–344. [Google Scholar] [CrossRef]
  90. Ross Brian, E.R.D. (Ed.) Magnetic Resonance Spectroscopy Diagnosis of Neurological Diseases; CRC Press: Boca Raton, FL, USA, 2014; ISBN 978-0-429-17720-0. [Google Scholar]
  91. Vermathen, P.; Laxer, K.D.; Matson, G.B.; Weiner, M.W. Hippocampal structures: Anteroposterior N-acetylaspartate differences in patients with epilepsy and control subjects as shown with proton MR spectroscopic imaging. Radiology 2000, 214, 403–410. [Google Scholar] [CrossRef]
  92. Dautry, C.; Vaufrey, F.; Brouillet, E.; Bizat, N.; Henry, P.G.; Condé, F.; Bloch, G.; Hantraye, P. Early N-acetylaspartate depletion is a marker of neuronal dysfunction in rats and primates chronically treated with the mitochondrial toxin 3-nitropropionic acid. J. Cereb. Blood Flow Metab. 2000, 20, 789–799. [Google Scholar] [CrossRef]
  93. Jin, Z.; Zang, Y.F.; Zeng, Y.W.; Zhang, L.; Wang, Y.F. Striatal neuronal loss or dysfunction and choline rise in children with attention-deficit hyperactivity disorder: A 1H-magnetic resonance spectroscopy study. Neurosci. Lett. 2001, 315, 45–48. [Google Scholar] [CrossRef] [PubMed]
  94. Ben Amor, L. 1H-Magnetic resonance spectroscopy study of stimulant medication effect on brain metabolites in French Canadian children with attention deficit hyperactivity disorder. Neuropsychiatr. Dis. Treat. 2014, 2014, 47–54. [Google Scholar] [CrossRef] [PubMed]
  95. Fayed, N.; Modrego, P.J.; Castillo, J.; Dávila, J. Evidence of Brain Dysfunction in Attention Deficit-Hyperactivity Disorder: A Controlled Study with Proton Magnetic Resonance Spectroscopy. Acad. Radiol. 2007, 14, 1029–1035. [Google Scholar] [CrossRef] [PubMed]
  96. Ferreira, P.E.M.S.; Palmini, A.; Bau, C.H.D.; Grevet, E.H.; Hoefel, J.R.; Rohde, L.A.; Anés, M.; Ferreira, E.E.; Belmonte-de-Abreu, P. Differentiating attention-deficit/hyperactivity disorder inattentive and combined types: A 1H-magnetic resonance spectroscopy study of fronto-striato-thalamic regions. J. Neural Transm. 2009, 116, 623–629. [Google Scholar] [CrossRef]
  97. Alexander, A.L.; Lee, J.E.; Lazar, M.; Field, A.S. Diffusion tensor imaging of the brain. Neurotherapeutics 2007, 4, 316–329. [Google Scholar] [CrossRef]
  98. Peters, J.M.; Sahin, M.; Vogel-Farley, V.K.; Jeste, S.S.; Nelson, C.A.; Gregas, M.C.; Prabhu, S.P.; Scherrer, B.; Warfield, S.K. Loss of white matter microstructural integrity is associated with adverse neurological outcome in Tuberous Sclerosis Complex. Acad. Radiol. 2012, 19, 17–25. [Google Scholar] [CrossRef]
  99. Ashtari, M.; Kumra, S.; Bhaskar, S.L.; Clarke, T.; Thaden, E.; Cervellione, K.L.; Rhinewine, J.; Kane, J.M.; Adesman, A.; Milanaik, R.; et al. Attention-deficit/hyperactivity disorder: A preliminary diffusion tensor imaging study. Biol. Psychiatry 2005, 57, 448–455. [Google Scholar] [CrossRef]
  100. de Zeeuw, P.; Mandl, R.C.W.; Hulshoff Pol, H.E.; van Engeland, H.; Durston, S. Decreased frontostriatal microstructural organization in attention deficit/hyperactivity disorder. Hum. Brain Mapp. 2011, 33, 1941–1951. [Google Scholar] [CrossRef]
  101. Liston, C.; Watts, R.; Tottenham, N.; Davidson, M.C.; Niogi, S.; Ulug, A.M.; Casey, B.J. Frontostriatal microstructure modulates efficient recruitment of cognitive control. Cereb. Cortex 2006, 16, 553–560. [Google Scholar] [CrossRef]
  102. Casey, B.J.; Epstein, J.N.; Buhle, J.; Liston, C.; Davidson, M.C.; Tonev, S.T.; Spicer, J.; Niogi, S.; Millner, A.J.; Reiss, A.; et al. Frontostriatal connectivity and its role in cognitive control in parent-child dyads with ADHD. Am. J. Psychiatry 2007, 164, 1729–1736. [Google Scholar] [CrossRef]
  103. Durston, S.; de Zeeuw, P.; Staal, W.G. Imaging genetics in ADHD: A focus on cognitive control. Neurosci. Biobehav. Rev. 2009, 33, 674–689. [Google Scholar] [CrossRef] [PubMed]
  104. Booth, J.R.; Burman, D.D.; Meyer, J.R.; Lei, Z.; Trommer, B.L.; Davenport, N.D.; Li, W.; Parrish, T.B.; Gitelman, D.R.; Mesulam, M.M. Larger deficits in brain networks for response inhibition than for visual selective attention in attention deficit hyperactivity disorder (ADHD). J. Child Psychol. Psychiatry 2005, 46, 94–111. [Google Scholar] [CrossRef] [PubMed]
  105. Konrad, K.; Neufang, S.; Hanisch, C.; Fink, G.R.; Herpertz-Dahlmann, B. Dysfunctional attentional networks in children with attention deficit/hyperactivity disorder: Evidence from an event-related functional magnetic resonance imaging study. Biol. Psychiatry 2006, 59, 643–651. [Google Scholar] [CrossRef] [PubMed]
  106. Paloyelis, Y.; Mehta, M.A.; Kuntsi, J.; Asherson, P. Functional magnetic resonance imaging in attention deficit hyperactivity disorder (ADHD): A systematic literature review. Expert Rev. Neurother. 2007, 7, 1337–1356. [Google Scholar] [CrossRef]
  107. Tsai, M.-L.; Kozłowska, A.; Li, Y.-S.; Shen, W.-L.; Huang, A.C.W. Social factors affect motor and anxiety behaviors in the animal model of attention-deficit hyperactivity disorders: A housing-style factor. Psychiatry Res. 2017, 254, 290–300. [Google Scholar] [CrossRef]
  108. Hsieh, Y.-L.; Yang, C.-C. Age-series characteristics of locomotor activities in spontaneously hypertensive rats: A comparison with the Wistar-Kyoto strain. Physiol. Behav. 2008, 93, 777–782. [Google Scholar] [CrossRef]
  109. Schreiber, J.E.; Possin, K.L.; Girard, J.M.; Rey-Casserly, C. Executive Function in Children with Attention Deficit/Hyperactivity Disorder: The NIH EXAMINER battery. J. Int. Neuropsychol. Soc. 2014, 20, 41–51. [Google Scholar] [CrossRef]
  110. Kollins, S.H.; Adcock, R.A. ADHD, altered dopamine neurotransmission, and disrupted reinforcement processes: Implications for smoking and nicotine dependence. Prog. Neuropsychopharmacol. Biol. Psychiatry 2014, 52, 70–78. [Google Scholar] [CrossRef]
  111. Yoo, H.K.; Huh, H.; Lee, S.; Jung, K.; Kim, B. Development of the Attention-Deficit Hyperactivity Disorder-After School Checklist. J. Korean Acad. Child Adolesc. Psychiatry 2018, 29, 47–53. [Google Scholar] [CrossRef]
  112. Forero, D.A.; Arboleda, G.H.; Vasquez, R.; Arboleda, H. Candidate genes involved in neural plasticity and the risk for attention-deficit hyperactivity disorder: A meta-analysis of 8 common variants. J. Psychiatry Neurosci. 2009, 34, 361–366. [Google Scholar]
  113. Semple, B.D.; Blomgren, K.; Gimlin, K.; Ferriero, D.M.; Noble-Haeusslein, L.J. Brain development in rodents and humans: Identifying benchmarks of maturation and vulnerability to injury across species. Prog. Neurobiol. 2013, 106–107, 1–16. [Google Scholar] [CrossRef] [PubMed]
  114. Quinn, R. Comparing rat’s to human’s age: How old is my rat in people years? Nutrition 2005, 21, 775–777. [Google Scholar] [CrossRef] [PubMed]
  115. Shaw, P.; Eckstrand, K.; Sharp, W.; Blumenthal, J.; Lerch, J.P.; Greenstein, D.; Clasen, L.; Evans, A.; Giedd, J.; Rapoport, J.L. Attention-deficit/hyperactivity disorder is characterized by a delay in cortical maturation. Proc. Natl. Acad. Sci. USA 2007, 104, 19649–19654. [Google Scholar] [CrossRef] [PubMed]
  116. Qiu, A.; Crocetti, D.; Adler, M.; Mahone, E.M.; Denckla, M.B.; Miller, M.I.; Mostofsky, S.H. Basal ganglia volume and shape in children with attention deficit hyperactivity disorder. Am. J. Psychiatry 2009, 166, 74–82. [Google Scholar] [CrossRef]
  117. Sagvolden, T.; Russell, V.A.; Aase, H.; Johansen, E.B.; Farshbaf, M. Rodent Models of Attention-Deficit/Hyperactivity Disorder. Biol. Psychiatry 2005, 57, 1239–1247. [Google Scholar] [CrossRef]
  118. Abikoff, H.B.; Jensen, P.S.; Arnold, L.L.E.; Hoza, B.; Hechtman, L.; Pollack, S.; Martin, D.; Alvir, J.; March, J.S.; Hinshaw, S.; et al. Observed classroom behavior of children with ADHD: Relationship to gender and comorbidity. J. Abnorm. Child Psychol. 2002, 30, 349–359. [Google Scholar] [CrossRef]
  119. Song, Y.; Yuan, H.; Chen, T.; Lu, M.; Lei, S.; Han, X. An Shen Ding Zhi Ling Alleviates Symptoms of Attention Deficit Hyperactivity Disorder via Anti-Inflammatory Effects in Spontaneous Hypertensive Rats. Front. Pharmacol. 2021, 11, 617581. Available online: https://www.frontiersin.org/articles/10.3389/fphar.2020.617581 (accessed on 22 March 2023). [CrossRef]
  120. Leffa, D.T.; Bellaver, B.; de Oliveira, C.; de Macedo, I.C.; de Freitas, J.S.; Grevet, E.H.; Caumo, W.; Rohde, L.A.; Quincozes-Santos, A.; Torres, I.L.S. Increased Oxidative Parameters and Decreased Cytokine Levels in an Animal Model of Attention-Deficit/Hyperactivity Disorder. Neurochem. Res. 2017, 42, 3084–3092. [Google Scholar] [CrossRef]
  121. Barchowsky, A.; Frleta, D.; Vincenti, M.P. Integration of the NF-κB and mitogen-activated protein kinase/AP-1 pathways at the Collagenase-1 promoter: Divergence of IL-1 and TNF-dependent signal transduction in rabbit primary synovial fibroblasts. Cytokine 2000, 12, 1469–1479. [Google Scholar] [CrossRef]
  122. Mattson, M.P.; Camandola, S. NF-κB in neuronal plasticity and neurodegenerative disorders. J. Clin. Investig. 2001, 107, 247–254. [Google Scholar] [CrossRef]
  123. Armada-Moreira, A.; Gomes, J.I.; Pina, C.C.; Savchak, O.K.; Gonçalves-Ribeiro, J.; Rei, N.; Pinto, S.; Morais, T.P.; Martins, R.S.; Ribeiro, F.F.; et al. Going the Extra (Synaptic) Mile: Excitotoxicity as the Road Toward Neurodegenerative Diseases. Front. Cell. Neurosci. 2020, 14, 90. [Google Scholar] [CrossRef] [PubMed]
  124. Pua, L.J.W.; Mai, C.-W.; Chung, F.F.-L.; Khoo, A.S.-B.; Leong, C.-O.; Lim, W.-M.; Hii, L.-W. Functional Roles of JNK and p38 MAPK Signaling in Nasopharyngeal Carcinoma. Int. J. Mol. Sci. 2022, 23, 1108. [Google Scholar] [CrossRef] [PubMed]
  125. Mancini, M.; Natoli, S.; Gardoni, F.; Di Luca, M.; Pisani, A. Dopamine Transmission Imbalance in Neuroinflammation: Perspectives on Long-Term COVID-19. Int. J. Mol. Sci. 2023, 24, 5618. [Google Scholar] [CrossRef] [PubMed]
  126. Channer, B.; Matt, S.M.; Nickoloff-Bybel, E.A.; Pappa, V.; Agarwal, Y.; Wickman, J.; Gaskill, P.J. Dopamine, Immunity, and Disease. Pharmacol. Rev. 2023, 75, 62–158. [Google Scholar] [CrossRef]
  127. Russell, V.A.; de Villiers, A.S.; Sagvolden, T.; Lamm, M.C.; Taljaard, J.J. Methylphenidate affects striatal dopamine differently in an animal model for attention-deficit/hyperactivity disorder--the spontaneously hypertensive rat. Brain Res. Bull. 2000, 53, 187–192. [Google Scholar] [CrossRef]
  128. Miller, E.M.; Pomerleau, F.; Huettl, P.; Russell, V.A.; Gerhardt, G.A.; Glaser, P.E.A. The spontaneously hypertensive and Wistar Kyoto rat models of ADHD exhibit sub-regional differences in dopamine release and uptake in the striatum and nucleus accumbens. Neuropharmacology 2012, 63, 1327–1334. [Google Scholar] [CrossRef]
  129. Aster, H.-C.; Romanos, M.; Walitza, S.; Gerlach, M.; Mühlberger, A.; Rizzo, A.; Andreatta, M.; Hasenauer, N.; Hartrampf, P.E.; Nerlich, K.; et al. Responsivity of the Striatal Dopamine System to Methylphenidate—A Within-Subject I-123-β-CIT-SPECT Study in Male Children and Adolescents With Attention-Deficit/Hyperactivity Disorder. Front. Psychiatry 2022, 13, 804730. [Google Scholar] [CrossRef]
  130. Sagvolden, T.; Johansen, E.B.; Aase, H.; Russell, V.A. A dynamic developmental theory of attention-deficit/hyperactivity disorder (ADHD) predominantly hyperactive/impulsive and combined subtypes. Behav. Brain Sci. 2005, 28, 397–419; discussion 419–468. [Google Scholar] [CrossRef]
  131. Lyu, D.; Yu, W.; Tang, N.; Wang, R.; Zhao, Z.; Xie, F.; He, Y.; Du, H.; Chen, J. The mTOR Signaling Pathway Regulates Pain-Related Synaptic Plasticity in Rat Entorhinal-Hippocampal Pathways. Mol. Pain 2013, 9, 1744-8069-9-64. [Google Scholar] [CrossRef]
  132. Lee, D.Y. Roles of mTOR Signaling in Brain Development. Exp. Neurobiol. 2015, 24, 177–185. [Google Scholar] [CrossRef]
  133. Liu, X.; Li, Y.; Yu, L.; Vickstrom, C.R.; Liu, Q. VTA mTOR Signaling Regulates Dopamine Dynamics, Cocaine-Induced Synaptic Alterations, and Reward. Neuropsychopharmacology 2018, 43, 1066–1077. [Google Scholar] [CrossRef] [PubMed]
  134. LaSarge, C.L.; Pun, R.Y.K.; Gu, Z.; Santos, V.R.; Danzer, S.C. Impact of mTOR hyperactive neurons on the morphology and physiology of adjacent neurons: Do PTEN KO cells make bad neighbors? Exp. Neurol. 2019, 321, 113029. [Google Scholar] [CrossRef] [PubMed]
  135. Zhang, W.; Xiao, D.; Mao, Q.; Xia, H. Role of neuroinflammation in neurodegeneration development. Signal Transduct. Target. Ther. 2023, 8, 267. [Google Scholar] [CrossRef] [PubMed]
  136. Luo, S.X.; Timbang, L.; Kim, J.-I.; Shang, Y.; Sandoval, K.; Tang, A.A.; Whistler, J.L.; Ding, J.B.; Huang, E.J. TGF-β Signaling in Dopaminergic Neurons Regulates Dendritic Growth, Excitatory-Inhibitory Synaptic Balance, and Reversal Learning. Cell Rep. 2016, 17, 3233–3245. [Google Scholar] [CrossRef]
  137. Meyers, E.A.; Kessler, J.A. TGF-β Family Signaling in Neural and Neuronal Differentiation, Development, and Function. Cold Spring Harb. Perspect. Biol. 2017, 9, a022244. [Google Scholar] [CrossRef]
  138. van der Meer, D.; Hoekstra, P.J.; Bralten, J.; van Donkelaar, M.; Heslenfeld, D.J.; Oosterlaan, J.; Faraone, S.V.; Franke, B.; Buitelaar, J.K.; Hartman, C.A. Interplay between stress response genes associated with attention-deficit hyperactivity disorder and brain volume. Genes Brain Behav. 2016, 15, 627–636. [Google Scholar] [CrossRef]
  139. Chong, Z.Z.; Li, F.; Maiese, K. Activating Akt and the brain’s resources to drive cellular survival and prevent inflammatory injury. Histol. Histopathol. 2005, 20, 299–315. [Google Scholar]
  140. Zhao, Y.; Hu, X.; Liu, Y.; Dong, S.; Wen, Z.; He, W.; Zhang, S.; Huang, Q.; Shi, M. ROS signaling under metabolic stress: Cross-talk between AMPK and AKT pathway. Mol. Cancer 2017, 16, 79. [Google Scholar] [CrossRef]
  141. Garabedian, M.J.; Harris, C.A.; Jeanneteau, F. Glucocorticoid receptor action in metabolic and neuronal function. F1000Research 2017, 6, 1208. [Google Scholar] [CrossRef]
  142. Li, X.; Hu, S.; Cai, Y.; Liu, X.; Luo, J.; Wu, T. Revving the engine: PKB/AKT as a key regulator of cellular glucose metabolism. Front. Physiol. 2024, 14, 1320964. [Google Scholar] [CrossRef]
  143. Coutinho, A.E.; Chapman, K.E. The anti-inflammatory and immunosuppressive effects of glucocorticoids, recent developments and mechanistic insights. Mol. Cell. Endocrinol. 2011, 335, 2–13. [Google Scholar] [CrossRef] [PubMed]
  144. Pieczenik, S.R.; Neustadt, J. Mitochondrial dysfunction and molecular pathways of disease. Exp. Mol. Pathol. 2007, 83, 84–92. [Google Scholar] [CrossRef] [PubMed]
  145. Bulut, M.; Selek, S.; Gergerlioglu, H.S.; Savas, H.A.; Yilmaz, H.R.; Yuce, M.; Ekici, G. Malondialdehyde levels in adult attention-deficit hyperactivity disorder. J. Psychiatry Neurosci. 2007, 32, 435–438. [Google Scholar] [PubMed]
  146. Verlaet, A.A.J.; Breynaert, A.; Ceulemans, B.; De Bruyne, T.; Fransen, E.; Pieters, L.; Savelkoul, H.F.J.; Hermans, N. Oxidative stress and immune aberrancies in attention-deficit/hyperactivity disorder (ADHD): A case-control comparison. Eur. Child Adolesc. Psychiatry 2019, 28, 719–729. [Google Scholar] [CrossRef] [PubMed]
  147. Ashour, F.A.; Elshafie, M.K.; Ameen, O.; Abdelnabi, S.A.; Naguib, Y.M. Early detection of attention deficit hyperactivity disorder and/or epilepsy by oxidative stress biomarkers. Menoufia Med. J. 2016, 29, 954–960. [Google Scholar]
  148. Cobley, J.N.; Fiorello, M.L.; Bailey, D.M. 13 reasons why the brain is susceptible to oxidative stress. Redox Biol. 2018, 15, 490–503. [Google Scholar] [CrossRef]
  149. Avila-Costa, M.R.; Colín-Barenque, L.; Fortoul, T.I.; Machado-Salas, J.P.; Espinosa-Villanueva, J.; Rugerio-Vargas, C.; Borgonio, G.; Dorado, C.; Rivas-Arancibia, S. Motor impairments in an oxidative stress model and its correlation with cytological changes on rat striatum and prefrontal cortex. Int. J. Neurosci. 2001, 108, 193–200. [Google Scholar] [CrossRef]
  150. Pizzino, G.; Irrera, N.; Cucinotta, M.; Pallio, G.; Mannino, F.; Arcoraci, V.; Squadrito, F.; Altavilla, D.; Bitto, A. Oxidative Stress: Harms and Benefits for Human Health. Oxid. Med. Cell. Longev. 2017, 2017, 8416763. [Google Scholar] [CrossRef]
  151. Archana, E.; Pai, P.; Prabhu, B.K.; Shenoy, R.P.; Prabhu, K.; Rao, A. Altered biochemical parameters in saliva of pediatric attention deficit hyperactivity disorder. Neurochem. Res. 2012, 37, 330–334. [Google Scholar] [CrossRef]
  152. Öğütlü, H.; Mertoğlu, C.; Gök, G.; Neşelioğlu, S. Thiols and ceruloplasmin levels in serum of children with attention deficit hyperactivity disorder: A cross-sectional study. Psychiatry Res. 2020, 294, 113546. [Google Scholar] [CrossRef]
  153. Baba, S.P.; Bhatnagar, A. Role of Thiols in Oxidative Stress. Curr. Opin. Toxicol. 2018, 7, 133–139. [Google Scholar] [CrossRef] [PubMed]
  154. Otal, Y.; Kahraman, F.A.; Haydar, F.G.; Erel, Ö. Dynamic thiol/disulfide homeostasis as oxidative stress marker in diabetic ketoacidosis. Turk. J. Med. Sci. 2021, 51, 743–748. [Google Scholar] [CrossRef] [PubMed]
  155. Ertürk, C.; Altay, M.A.; Büyükdoğan, H.; Çalışkan, G.; Erel, Ö. Thiol/disulfide homeostasis as a novel indicator of oxidative stress during the treatment process of patients with septic arthritis. Jt. Dis. Relat. Surg. 2020, 31, 502–508. [Google Scholar] [CrossRef]
  156. Zinellu, E.; Zinellu, A.; Pau, M.C.; Piras, B.; Fois, A.G.; Mellino, S.; Carru, C.; Mangoni, A.A.; Pirina, P. Glutathione Peroxidase in Stable Chronic Obstructive Pulmonary Disease: A Systematic Review and Meta-analysis. Antioxidants 2021, 10, 1745. [Google Scholar] [CrossRef]
  157. Selek, S.; Bulut, M.; Ocak, A.R.; Kalenderoğlu, A.; Savaş, H.A. Evaluation of total oxidative status in adult attention deficit hyperactivity disorder and its diagnostic implications. J. Psychiatr. Res. 2012, 46, 451–455. [Google Scholar] [CrossRef]
  158. Ceylan, M.; Sener, S.; Bayraktar, A.C.; Kavutcu, M. Oxidative imbalance in child and adolescent patients with attention-deficit/hyperactivity disorder. Prog. Neuropsychopharmacol. Biol. Psychiatry 2010, 34, 1491–1494. [Google Scholar] [CrossRef]
  159. Simsek, S.; Gencoglan, S.; Ozaner, S.; Kaplan, I.; Kaya, M.C. Antioxidant Status and DNA Damage in Children with Attention Deficit Hyperactivity Disorder with or without Comorbid Disruptive Behavioral Disorders. Klin. Psikofarmakol. Bül.-Bull. Clin. Psychopharmacol. 2016, 26, 119–125. [Google Scholar] [CrossRef]
  160. Boriskin, P.; Gulenko, O.; Deviatkin, A.; Pavlova, O.; Toropovskiy, A. Correlation of superoxide dismutase activity distribution in serum and tissues of small experimental animals. IOP Conf. Ser. Earth Environ. Sci. 2019, 403, 012112. [Google Scholar] [CrossRef]
  161. Karababa, İ.F.; Savas, S.N.; Selek, S.; Cicek, E.; Cicek, E.I.; Asoglu, M.; Bayazit, H.; Kandemir, H.; Kati, M.; Ulas, T. Homocysteine Levels and Oxidative Stress Parameters in Patients With Adult ADHD. J. Atten. Disord. 2017, 21, 487–493. [Google Scholar] [CrossRef]
  162. Cannon Homaei, S.; Barone, H.; Kleppe, R.; Betari, N.; Reif, A.; Haavik, J. ADHD symptoms in neurometabolic diseases: Underlying mechanisms and clinical implications. Neurosci. Biobehav. Rev. 2022, 132, 838–856. [Google Scholar] [CrossRef]
  163. Guney, E.; Cetin, F.H.; Alisik, M.; Tunca, H.; Tas Torun, Y.; Iseri, E.; Isik Taner, Y.; Cayci, B.; Erel, O. Attention Deficit Hyperactivity Disorder and oxidative stress: A short term follow up study. Psychiatry Res. 2015, 229, 310–317. [Google Scholar] [CrossRef] [PubMed]
  164. Richardson, A.J.; Puri, B.K. A randomized double-blind, placebo-controlled study of the effects of supplementation with highly unsaturated fatty acids on ADHD-related symptoms in children with specific learning difficulties. Prog. Neuropsychopharmacol. Biol. Psychiatry 2002, 26, 233–239. [Google Scholar] [CrossRef] [PubMed]
  165. Manor, I.; Magen, A.; Keidar, D.; Rosen, S.; Tasker, H.; Cohen, T.; Richter, Y.; Zaaroor-Regev, D.; Manor, Y.; Weizman, A. The effect of phosphatidylserine containing Omega3 fatty-acids on attention-deficit hyperactivity disorder symptoms in children: A double-blind placebo-controlled trial, followed by an open-label extension. Eur. Psychiatry 2012, 27, 335–342. [Google Scholar] [CrossRef] [PubMed]
  166. Perera, H.; Jeewandara, K.C.; Seneviratne, S.; Guruge, C. Combined ω3 and ω6 supplementation in children with attention-deficit hyperactivity disorder (ADHD) refractory to methylphenidate treatment: A double-blind, placebo-controlled study. J. Child Neurol. 2012, 27, 747–753. [Google Scholar] [CrossRef]
  167. Veluthakal, R.; Esparza, D.; Hoolachan, J.M.; Balakrishnan, R.; Ahn, M.; Oh, E.; Jayasena, C.S.; Thurmond, D.C. Mitochondrial Dysfunction, Oxidative Stress, and Inter-Organ Miscommunications in T2D Progression. Int. J. Mol. Sci. 2024, 25, 1504. [Google Scholar] [CrossRef]
  168. Tangvarasittichai, S. Oxidative stress, insulin resistance, dyslipidemia and type 2 diabetes mellitus. World J. Diabetes 2015, 6, 456–480. [Google Scholar] [CrossRef]
  169. Ernst, M.; Liebenauer, L.L.; King, A.C.; Fitzgerald, G.A.; Cohen, R.M.; Zametkin, A.J. Reduced brain metabolism in hyperactive girls. J. Am. Acad. Child Adolesc. Psychiatry 1994, 33, 858–868. [Google Scholar] [CrossRef]
  170. Verma, P.; Singh, A.; Nthenge-Ngumbau, D.N.; Rajamma, U.; Sinha, S.; Mukhopadhyay, K.; Mohanakumar, K.P. Attention deficit-hyperactivity disorder suffers from mitochondrial dysfunction. BBA Clin. 2016, 6, 153–158. [Google Scholar] [CrossRef]
  171. Siddiqui, M.F.; Elwell, C.; Johnson, M.H. Mitochondrial Dysfunction in Autism Spectrum Disorders. Autism-Open Access 2016, 6, 1000190. [Google Scholar] [CrossRef]
  172. Welsh, K.J.; Kirkman, M.S.; Sacks, D.B. Role of Glycated Proteins in the Diagnosis and Management of Diabetes: Research Gaps and Future Directions. Diabetes Care 2016, 39, 1299–1306. [Google Scholar] [CrossRef]
  173. Sauerzopf, U.; Weidenauer, A.; Dajic, I.; Bauer, M.; Bartova, L.; Meyer, B.; Nics, L.; Philippe, C.; Pfaff, S.; Pichler, V.; et al. Disrupted relationship between blood glucose and brain dopamine D2/3 receptor binding in patients with first-episode schizophrenia. NeuroImage Clin. 2021, 32, 102813. [Google Scholar] [CrossRef] [PubMed]
  174. Weinstein, G.; Maillard, P.; Himali, J.J.; Beiser, A.S.; Au, R.; Wolf, P.A.; Seshadri, S.; DeCarli, C. Glucose indices are associated with cognitive and structural brain measures in young adults. Neurology 2015, 84, 2329–2337. [Google Scholar] [CrossRef] [PubMed]
  175. Rao, Y.; Gammon, S.T.; Sutton, M.N.; Zacharias, N.M.; Bhattacharya, P.; Piwnica-Worms, D. Excess exogenous pyruvate inhibits lactate dehydrogenase activity in live cells in an MCT1-dependent manner. J. Biol. Chem. 2021, 297, 100775. [Google Scholar] [CrossRef] [PubMed]
  176. Medin, T.; Medin, H.; Hefte, M.B.; Storm-Mathisen, J.; Bergersen, L.H. Upregulation of the lactate transporter monocarboxylate transporter 1 at the blood-brain barrier in a rat model of attention-deficit/hyperactivity disorder suggests hyperactivity could be a form of self-treatment. Behav. Brain Res. 2019, 360, 279–285. [Google Scholar] [CrossRef]
  177. Li, C.; Liu, F.-Y.; Shen, Y.; Tian, Y.; Han, F.-J. Research progress on the mechanism of glycolysis in ovarian cancer. Front. Immunol. 2023, 14, 1284853. [Google Scholar] [CrossRef]
  178. Chen, X.; Zhang, Y.; Wang, H.; Liu, L.; Li, W.; Xie, P. The regulatory effects of lactic acid on neuropsychiatric disorders. Discov. Ment. Health 2022, 2, 8. [Google Scholar] [CrossRef]
  179. Edden, R.A.E.; Crocetti, D.; Zhu, H.; Gilbert, D.L.; Mostofsky, S.H. Reduced GABA Concentration in Attention-Deficit/Hyperactivity Disorder. Arch. Gen. Psychiatry 2012, 69, 750–753. [Google Scholar] [CrossRef]
  180. Bollmann, S.; Ghisleni, C.; Poil, S.-S.; Martin, E.; Ball, J.; Eich-Höchli, D.; Edden, R.A.E.; Klaver, P.; Michels, L.; Brandeis, D.; et al. Developmental changes in gamma-aminobutyric acid levels in attention-deficit/hyperactivity disorder. Transl. Psychiatry 2015, 5, e589. [Google Scholar] [CrossRef]
  181. Ende, G.; Cackowski, S.; Van Eijk, J.; Sack, M.; Demirakca, T.; Kleindienst, N.; Bohus, M.; Sobanski, E.; Krause-Utz, A.; Schmahl, C. Impulsivity and Aggression in Female BPD and ADHD Patients: Association with ACC Glutamate and GABA Concentrations. Neuropsychopharmacology 2016, 41, 410–418. [Google Scholar] [CrossRef]
  182. Schür, R.R.; Draisma, L.W.R.; Wijnen, J.P.; Boks, M.P.; Koevoets, M.G.J.C.; Joëls, M.; Klomp, D.W.; Kahn, R.S.; Vinkers, C.H. Brain GABA levels across psychiatric disorders: A systematic literature review and meta-analysis of (1) H-MRS studies. Hum. Brain Mapp. 2016, 37, 3337–3352. [Google Scholar] [CrossRef]
  183. Ross, J.M.; Öberg, J.; Brené, S.; Coppotelli, G.; Terzioglu, M.; Pernold, K.; Goiny, M.; Sitnikov, R.; Kehr, J.; Trifunovic, A.; et al. High brain lactate is a hallmark of aging and caused by a shift in the lactate dehydrogenase A/B ratio. Proc. Natl. Acad. Sci. USA 2010, 107, 20087–20092. [Google Scholar] [CrossRef] [PubMed]
  184. Jovanović, P.; Žorić, L.; Stefanović, I.; Džunić, B.; Djordjević-Jocić, J.; Radenković, M.; Jovanović, M. Lactate dehydrogenase and oxidative stress activity in primary open-angle glaucoma aqueous humour. Bosn. J. Basic Med. Sci. 2010, 10, 83–88. [Google Scholar] [CrossRef] [PubMed]
  185. Gao, J.; Wang, T.; Wang, C.; Wang, S.; Wang, W.; Ma, D.; Li, Y.; Zhao, H.; Chen, J. Effects of Tianshu Capsule on Spontaneously Hypertensive Rats as Revealed by 1H-NMR-Based Metabolic Profiling. Front. Pharmacol. 2019, 10, 989. [Google Scholar] [CrossRef] [PubMed]
  186. Rossignol, D.A.; Frye, R.E. Mitochondrial dysfunction in autism spectrum disorders: A systematic review and meta-analysis. Mol. Psychiatry 2012, 17, 290–314. [Google Scholar] [CrossRef]
  187. McGill, M.R. The past and present of serum aminotransferases and the future of liver injury biomarkers. EXCLI J. 2016, 15, 817–828. [Google Scholar] [CrossRef]
  188. Skalny, A.V.; Mazaletskaya, A.L.; Zaitseva, I.P.; Skalny, A.A.; Spandidos, D.A.; Tsatsakis, A.; Lobanova, Y.N.; Skalnaya, M.G.; Aschner, M.; Tinkov, A.A. Alterations in serum amino acid profiles in children with attention deficit/hyperactivity disorder. Biomed. Rep. 2021, 14, 47. [Google Scholar] [CrossRef]
  189. Kim, S.L.; Shin, S.; Yang, S.J. Iron Homeostasis and Energy Metabolism in Obesity. Clin. Nutr. Res. 2022, 11, 316–330. [Google Scholar] [CrossRef]
  190. Galaris, D.; Barbouti, A.; Pantopoulos, K. Iron homeostasis and oxidative stress: An intimate relationship. Biochim. Biophys. Acta BBA-Mol. Cell Res. 2019, 1866, 118535. [Google Scholar] [CrossRef]
  191. Long, H.; Zhu, W.; Wei, L.; Zhao, J. Iron homeostasis imbalance and ferroptosis in brain diseases. MedComm 2023, 4, e298. [Google Scholar] [CrossRef]
  192. McBean, G.J.; López, M.G.; Wallner, F.K. Redox-based therapeutics in neurodegenerative disease. Br. J. Pharmacol. 2017, 174, 1750–1770. [Google Scholar] [CrossRef]
  193. Everett, J.; Céspedes, E.; Shelford, L.R.; Exley, C.; Collingwood, J.F.; Dobson, J.; van der Laan, G.; Jenkins, C.A.; Arenholz, E.; Telling, N.D. Ferrous iron formation following the co-aggregation of ferric iron and the Alzheimer’s disease peptide β-amyloid (1-42). J. R. Soc. Interface 2014, 11, 20140165. [Google Scholar] [CrossRef] [PubMed]
  194. Yan, N.; Zhang, J. Iron Metabolism, Ferroptosis, and the Links With Alzheimer’s Disease. Front. Neurosci. 2019, 13, 1443. [Google Scholar] [CrossRef] [PubMed]
  195. Chen, Y.; Guo, X.; Zeng, Y.; Mo, X.; Hong, S.; He, H.; Li, J.; Fatima, S.; Liu, Q. Oxidative stress induces mitochondrial iron overload and ferroptotic cell death. Sci. Rep. 2023, 13, 15515. [Google Scholar] [CrossRef]
  196. García-Yébenes, I.; Sobrado, M.; Moraga, A.; Zarruk, J.G.; Romera, V.G.; Pradillo, J.M.; Perez de la Ossa, N.; Moro, M.A.; Dávalos, A.; Lizasoain, I. Iron overload, measured as serum ferritin, increases brain damage induced by focal ischemia and early reperfusion. Neurochem. Int. 2012, 61, 1364–1369. [Google Scholar] [CrossRef]
  197. Yang, J.; Wang, M.; Wang, S.; Li, G.; Gao, Y. Study on ferroptosis pathway that operates in hypertensive brain damage. Clin. Exp. Hypertens. 2020, 42, 748–752. [Google Scholar] [CrossRef]
  198. Chen, J.-R.; Hsu, S.-F.; Hsu, C.-D.; Hwang, L.-H.; Yang, S.-C. Dietary patterns and blood fatty acid composition in children with attention-deficit hyperactivity disorder in Taiwan. J. Nutr. Biochem. 2004, 15, 467–472. [Google Scholar] [CrossRef]
  199. Wang, Y.; Huang, L.; Zhang, L.; Qu, Y.; Mu, D. Iron Status in Attention-Deficit/Hyperactivity Disorder: A Systematic Review and Meta-Analysis. PLoS ONE 2017, 12, e0169145. [Google Scholar] [CrossRef]
  200. Tseng, P.-T.; Cheng, Y.-S.; Yen, C.-F.; Chen, Y.-W.; Stubbs, B.; Whiteley, P.; Carvalho, A.F.; Li, D.-J.; Chen, T.-Y.; Yang, W.-C.; et al. Peripheral iron levels in children with attention-deficit hyperactivity disorder: A systematic review and meta-analysis. Sci. Rep. 2018, 8, 788. [Google Scholar] [CrossRef]
  201. Collings, R.; Harvey, L.J.; Hooper, L.; Hurst, R.; Brown, T.J.; Ansett, J.; King, M.; Fairweather-Tait, S.J. The absorption of iron from whole diets: A systematic review. Am. J. Clin. Nutr. 2013, 98, 65–81. [Google Scholar] [CrossRef]
  202. Navas, F.J.; Córdova, A. Iron distribution in different tissues in rats following exercise. Biol. Trace Elem. Res. 2000, 73, 259–268. [Google Scholar] [CrossRef]
  203. Glancy, B.; Kane, D.A.; Kavazis, A.N.; Goodwin, M.L.; Willis, W.T.; Gladden, L.B. Mitochondrial lactate metabolism: History and implications for exercise and disease. J. Physiol. 2022, 599, 863–888. Available online: https://pmc.ncbi.nlm.nih.gov/articles/PMC8439166/ (accessed on 27 November 2024). [CrossRef] [PubMed]
  204. Kozłowska, A.; Wojtacha, P.; Majewski, M.; Równiak, M. The cytokine alterations/abnormalities and oxidative damage in the pancreas during hypertension development. Pflugers Arch. 2019, 471, 1331–1340. [Google Scholar] [CrossRef] [PubMed]
  205. Mullen, R.J.; Buck, C.R.; Smith, A.M. NeuN, a neuronal specific nuclear protein in vertebrates. Dev. Camb. Engl. 1992, 116, 201–211. [Google Scholar] [CrossRef]
  206. Páleníček, T.; Fujáková, M.; Brunovský, M.; Balíková, M.; Horáček, J.; Gorman, I.; Tylš, F.; Tišlerová, B.; Soš, P.; Bubeníková-Valešová, V.; et al. Electroencephalographic spectral and coherence analysis of ketamine in rats: Correlation with behavioral effects and pharmacokinetics. Neuropsychobiology 2011, 63, 202–218. [Google Scholar] [CrossRef]
  207. Yang, C.; Hu, Y.-M.; Zhou, Z.-Q.; Zhang, G.-F.; Yang, J.-J. Acute administration of ketamine in rats increases hippocampal BDNF and mTOR levels during forced swimming test. Ups. J. Med. Sci. 2013, 118, 3–8. [Google Scholar] [CrossRef]
  208. Paxinos, G.; Watson, C. The Rat Brain in Stereotaxic Coordinates, 5th ed.; Elsevier Academic Press: Amsterdam, The Netherlands, 2005; ISBN 978-0-12-088472-8. Available online: http://catdir.loc.gov/catdir/description/els051/2004303983.html (accessed on 25 October 2023).
  209. Oorschot, D.E. Total number of neurons in the neostriatal, pallidal, subthalamic, and substantia nigral nuclei of the rat basal ganglia: A stereological study using the cavalieri and optical disector methods. J. Comp. Neurol. 1996, 366, 580–599. [Google Scholar] [CrossRef]
  210. Schindelin, J.; Arganda-Carreras, I.; Frise, E.; Kaynig, V.; Longair, M.; Pietzsch, T.; Preibisch, S.; Rueden, C.; Saalfeld, S.; Schmid, B.; et al. Fiji: An Open Source platform for biological image analysis. Nat. Methods 2012, 9, 676–682. [Google Scholar] [CrossRef]
  211. DeVito, J.L.; Graham, J.; Sackett, G.P. Volumetric growth of the major brain divisions in fetal Macaca nemestrina. J. Hirnforsch. 1989, 30, 479–487. [Google Scholar]
  212. West, M.J.; Gundersen, H.J. Unbiased stereological estimation of the number of neurons in the human hippocampus. J. Comp. Neurol. 1990, 296, 1–22. [Google Scholar] [CrossRef]
  213. Weitner, T.; Inić, S.; Jablan, J.; Gabričević, M.; Domijan, A.-M. Spectrophotometric Determination of Malondialdehyde in Urine Suitable for Epidemiological Studies. Croat. Chem. Acta 2016, 89, 133–139. [Google Scholar] [CrossRef]
  214. Chan, K.-Y.; Wasserman, B.P. Direct Colorimetric Assay of Free Thiol Groups and Disulfide Bonds in Suspensions of Solubilized and Particulate Cereal Proteins’. Cereal Chem. 1993, 70, 22. [Google Scholar]
  215. Tkachenko, H.; Kurhaluk, N.; Grudniewska, J. Oxidative stress biomarkers in different tissues of rainbow trout (Oncorhynchus mykiss) exposed to Disinfectant-CIP formulated with peracetic acid and hydrogen peroxide. Fish. Aquat. Life 2014, 22, 207–219. [Google Scholar] [CrossRef]
  216. Bovaird, J.H.; Ngo, T.T.; Lenhoff, H.M. Optimizing the o-phenylenediamine assay for horseradish peroxidase: Effects of phosphate and pH, substrate and enzyme concentrations, and stopping reagents. Clin. Chem. 1982, 28, 2423–2426. [Google Scholar] [CrossRef] [PubMed]
  217. Habig, W.H.; Pabst, M.J.; Jakoby, W.B. Glutathione S-transferases. The first enzymatic step in mercapturic acid formation. J. Biol. Chem. 1974, 249, 7130–7139. [Google Scholar] [CrossRef]
  218. Calipari, E.S.; Huggins, K.N.; Mathews, T.A.; Jones, S.R. Conserved dorsal–ventral gradient of dopamine release and uptake rate in mice, rats and rhesus macaques. Neurochem. Int. 2012, 61, 986–991. [Google Scholar] [CrossRef]
  219. Bocarsly, M.E.; Silva, D.d.S.e.; Kolb, V.; Luderman, K.D.; Shashikiran, S.; Rubinstein, M.; Sibley, D.R.; Dobbs, L.K.; Alvarez, V.A. A Mechanism Linking Two Known Vulnerability Factors for Alcohol Abuse: Heightened Alcohol Stimulation and Low Striatal Dopamine D2 Receptors. Cell Rep. 2019, 29, 1147–1163.e5. [Google Scholar] [CrossRef]
  220. Zhang-James, Y.; Middleton, F.A.; Faraone, S.V. Genetic architecture of Wistar-Kyoto rat and spontaneously hypertensive rat substrains from different sources. Physiol. Genomics 2013, 45, 528–538. [Google Scholar] [CrossRef]
  221. Nam, H.; Clinton, S.M.; Jackson, N.L.; Kerman, I.A. Learned helplessness and social avoidance in the Wistar-Kyoto rat. Front. Behav. Neurosci. 2014, 8, 109. [Google Scholar] [CrossRef]
  222. Dunn, G.A.; Nigg, J.T.; Sullivan, E.L. Neuroinflammation as a risk factor for attention deficit hyperactivity disorder. Pharmacol. Biochem. Behav. 2019, 182, 22–34. [Google Scholar] [CrossRef]
  223. Leffa, D.T.; Torres, I.L.S.; Rohde, L.A. A Review on the Role of Inflammation in Attention-Deficit/Hyperactivity Disorder. Neuroimmunomodulation 2018, 25, 328–333. [Google Scholar] [CrossRef]
  224. Koç, S.; Güler, E.M.; Derin, S.; Gültekin, F.; Aktaş, S. Oxidative and Inflammatory Parameters in Children and Adolescents with ADHD. J. Atten. Disord. 2023, 27, 880–886. [Google Scholar] [CrossRef] [PubMed]
  225. Biehl, S.C.; Gschwendtner, K.M.; Guhn, A.; Müller, L.D.; Reichert, S.; Heupel, J.; Reif, A.; Deckert, J.; Herrmann, M.J.; Jacob, C.P. Does adult ADHD interact with COMTval158met genotype to influence working memory performance? ADHD Atten. Deficit Hyperact. Disord. 2015, 7, 19–25. [Google Scholar] [CrossRef] [PubMed]
  226. Volkow, N.D.; Wang, G.-J.; Tomasi, D.; Kollins, S.H.; Wigal, T.L.; Newcorn, J.H.; Telang, F.W.; Fowler, J.S.; Logan, J.; Wong, C.T.; et al. Methylphenidate-Elicited Dopamine Increases in Ventral Striatum Are Associated with Long-Term Symptom Improvement in Adults with Attention Deficit Hyperactivity Disorder. J. Neurosci. 2012, 32, 841–849. [Google Scholar] [CrossRef] [PubMed]
Figure 1. The figure shows the dynamics of changes in the volume of the striatal areas: caudate putamen (CPu; (A,B)), external globus pallidus (EGP; (C,D)), lateral accumbens shell (LaCBsH; (E,F)), and nucleus accumbens core (AcbC; (G,H)) in the postnatal (4–10 weeks of age) development of SHRs and WKYs (n = 5 or 6 for each strain in each developmental stage studied). Note that the most significant reduction in the volume of striatal regions in SHRs occurs between the 4th and 7th weeks of life. No significant differences in the volumes of this structure were observed between adult individuals of both strains. The differences between strains were indicated by the symbols: *—p < 0.05, **—p < 0.01, ***—p < 0.001, and ****—p < 0.0001. Age-dependent developmental differences between animals were denoted as follows: a–d (p < 0.05–p < 0.001) for the WKY strain, and a’–d’ for SHR strain; and 4 vs. other weeks (a,a’), 5 vs. other weeks (b,b’), and so forth. The dashed lines represent the standard error of the mean (SEM).
Ijms 25 13652 g001
Figure 2. The figure represents a comparison of the mean neuronal density [mm3 ] in different areas of the striatum—(A) CPu right hemisphere; (B) CPu left hemisphere; (C) EGP right hemisphere; (D) EGP left hemisphere; (E) LaCBsH right hemisphere; (F) LaCBsH left hemisphere; (G) AcbC right hemisphere; and (H) AcbC left hemisphere—in the postnatal (4–10 weeks of age) development of SHRs and WKYs (n = 5 or 6 for each strain in each developmental stage studied). It is worth noting that the most pronounced decrease in neuronal density within the striatal regions occurs in juvenile animals (between the 5th and 7th weeks of life). At later stages of development, significant differences were not detected, with the exception of the CPu in the 9th week. The differences between strains were indicated by the symbols: *—p < 0.05, **—p < 0.01, ***—p < 0.001, and ****—p < 0.0001. Age-dependent developmental differences between animals were denoted as follows: a–d (p < 0.05–p < 0.001) for the WKY strain, and a’–d’ for SHRs; and 4 vs. other weeks (a,a’), 5 vs. other weeks (b,b’), and so forth.
Ijms 25 13652 g002
Figure 3. Quantification of interleukin (IL)-1α (A), IL-1β (B), IL-6 (C), serine/threonine-protein mammalian target of rapamycin (mTOR; (D)), glucocorticoid receptor (GCsRβ; (E)), transforming growth factor beta (TGF-β; (F)), and RAC-alpha serine/threonine-protein kinase (AKT-1; (G)) levels in striatum supernatants. Notice the increase in immune markers in juvenile SHRs as well as in adult WKYs. Results are presented as the mean ± SEM (n = 6/per group). Significance levels are denoted by * and *** (indicating differences at p < 0.05 and p < 0.001) between SHRs and WKYs, and p < 0.05–p < 0.001 indicate distinctions between juvenile and maturing rats within the same strain.
Ijms 25 13652 g003
Figure 4. Quantification of malondialdehyde (MDA; (A)) and sulfhydryl group (-SH; (B)), superoxide dismutase (SOD; (C)), peroxidase (POD; (D)), glutathione reductase (GSR; (E)), and glutathione S transferases (GST; (F)) levels/activity in striatum supernatants. Observe the elevation of oxidative stress markers in both juvenile SHRs and adult WKYs. Results are presented as the mean ± SEM (n = 6/per group). Significance levels are denoted by ** and **** (indicating differences at p < 0.01, and p < 0.0001) between SHRs and WKYs, and p < 0.05–p < 0.0001 indicate distinctions between juvenile and maturing rats within the same strain.
Ijms 25 13652 g004
Figure 5. Quantification of glucose (G; (A)), fructosamine (FrAm; (B)), iron (Fe; (C)), lactic acid (LA; (D)), lactate dehydrogenase (LDH; (E)), alanine transaminase (ALT; (F)), and aspartate transaminase (ALT; (G)) levels/activity in striatum supernatants. Take a look at the increase in metabolic markers in both young SHRs and adult WKYs. Results are presented as the mean ± SEM (n = 6/per group). Significance levels are denoted by *, **, ***, and **** (indicating differences at p < 0.05, p < 0.01, p < 0.001, and p < 0.0001) between SHRs and WKYs, and p < 0.01, p < 0.001, and p < 0.0001 indicate distinctions between juvenile and maturing rats within the same strain.
Ijms 25 13652 g005
Figure 6. The figure presents stained and digitized (magnification ×5) coronal brain sections of 6-week-old WKYs with the outlined studied areas of the striatum (A: CPu, LaCBsH, and AcbC; and B: CPu and EGP) according to The Rat Brain Atlas [208] ((A) bregma 1.20 mm; and (B) bregma −0.84 mm).
Ijms 25 13652 g006
Table 1. Body weight of SHRs and WKYs at different age stages.
Age (Weeks)SHRs Body Weight (g)WKYs Body Weight (g)
489.80 ± 1.9084.30 ± 0.09
5115.08 ± 6.31120.08 ± 0.08
6154.86 ± 6.13159.28 ± 0.05
7200.78 ± 5.37191.13 ± 6.06
8220.35 ± 10.76226.95 ± 0.04
9249.79 ± 9.86242.67 ± 9.09
10269.58 ± 7.92264.95 ± 10.02
Table 2. The table outlines comprehensive procedures for quantifying and determining the activity of selected markers.
Marker/
Enzyme
Determination Method
ImmuneIL-1αThe ELISA test plate’s absorbance was quantified using a TECAN Infinite M200 PRO plate reader (Austria) at a wavelength of λ = 450 nm. The outcomes were expressed relative to the amount of protein, presented per milligram.ELISA Kit for Rat IL-1 alfa (E0071r; EIAab; Wuhan, China)
IL-1βELISA Kit for Rat IL-1 beta (E0563r; EIAab; Wuhan, China)
IL-6ELISA Kit for Rat IL-6 (E0079r; EIAab; Wuhan, China)
mTORELISA kit for Rat Serine/threonine-protein mTOR (ER1520; Wuhan Fine Biotech Co, Ltd.; Wuhan, China)
TGF-βTGF beta-1 Multispecies Matched An-tibody Pair, (CHC1683, ThermoFisher Scientific, Waltham, MA, USA)
AKT-1ELISA Kit FOR rat RAC-alpha serine/threonine-protein kinase (E0382r; EIAab; Wuhan, China)
GCsRβELISA kit for rat Glucocorticoid receptor β (E1608r; EIAab; Wuhan, China)
Oxidative StressMDAMarkers’ levels/activity were assessed following the following:Weitner et al. procedure [213]
-SHEllman method [214]
SODTkachenko and Grudniewska protocol [215]
PODKinetic method [216]
GSRTkachenko and Grudniewska method [215]
GSTSpectrophotometric assay procedure [217]
MetabolicGMarkers’ content/activity was measured employing specific commercial reagent setsGlucose oxidase reagent set (G7521; Pointe Scientific, Inc.; Poland)
FrAmFructosamine reagent set (F7546; Pointe Scientific, Inc.; Poland)
FeTotal iron reagent set (17505; Pointe Scientific, Inc.; Poland)
LALactate acid reagent set (L7596; Pointe Scientific, Inc.; Poland)
LDHLactate dehydrogenase reagent set (L7572; Pointe Scientific, Inc.; Poland)
ALTAlanine transaminase (SGPT) reagent set (A7526; Pointe Scientific, Inc.; Poland)
ASTAspartate aminotransferase (SGOT) reagent set; (A7561; Pointe Scientific, Inc.; Poland)
Disclaimer/Publisher’s Note: The statements, opinions and data contained in all publications are solely those of the individual author(s) and contributor(s) and not of MDPI and/or the editor(s). MDPI and/or the editor(s) disclaim responsibility for any injury to people or property resulting from any ideas, methods, instructions or products referred to in the content.

