Article

Evolution and Dynamic Transcriptome of Key Genes of Photoperiodic Flowering Pathway in Water Spinach (Ipomoea aquatica)

1
Key Laboratory for Quality Regulation of Tropical Horticultural Crops of Hainan Province, School of Breeding and Multiplication (Sanya Institute of Breeding and Multiplication), Hainan University, Sanya 572025, China
2
Key Laboratory for Quality Regulation of Tropical Horticultural Crops of Hainan Province, School of Tropical Agriculture and Forestry, Hainan University, Haikou 570228, China
3
Hainan Yazhou Bay Seed Laboratory, Sanya 572025, China
*
Authors to whom correspondence should be addressed.
Int. J. Mol. Sci. 2024, 25(3), 1420; https://doi.org/10.3390/ijms25031420
Submission received: 6 December 2023 / Revised: 9 January 2024 / Accepted: 16 January 2024 / Published: 24 January 2024

Abstract

:
The photoperiod is a major environmental factor in flowering control. Water spinach flowering under the inductive short-day condition decreases the yield of vegetative tissues and the eating quality. To obtain an insight into the molecular mechanism of the photoperiod-dependent regulation of the flowering time in water spinach, we performed transcriptome sequencing on water spinach under long- and short-day conditions with eight time points. Our results indicated that there were 6615 circadian-rhythm-related genes under the long-day condition and 8691 under the short-day condition. The three key circadian-rhythm genes, IaCCA1, IaLHY, and IaTOC1, still maintained single copies and similar IaCCA1, IaLHY, and IaTOC1 feedback expression patterns, indicating the conservation of reverse feedback. In the photoperiod pathway, highly conserved GI genes were amplified into two copies (IaGI1 and IaGI2) in water spinach. The significant difference in the expression of the two genes indicates functional diversity. Although the photoperiod core gene FT was duplicated to three copies in water spinach, only IaFT1 was highly expressed and strongly responsive to the photoperiod and circadian rhythms, and the almost complete inhibition of IaFT1 in water spinach may be the reason why water spinach does not bloom, no matter how long it lasts under the long-day condition. Differing from other species (I. nil, I. triloba, I. trifida) of the Ipomoea genus that have three CO members, water spinach lacks one of them, and the other two CO genes (IaCO1 and IaCO2) encode only one CCT domain. In addition, through weighted correlation network analysis (WGCNA), some transcription factors closely related to the photoperiod pathway were obtained. This work provides valuable data for further in-depth analyses of the molecular regulation of the flowering time in water spinach and the Ipomoea genus.

1. Introduction

Ipomoea aquatica Forsk is an annual or perennial herbaceous plant of the Ipomoea genus that is both aquatic and terrestrial. The stem is hollow and green or purple, and it has easy-to-grow adventitious roots at every node with high temperatures and moisture resistance [1]. Water spinach is widely cultivated in China and Southeast Asia, and it has high nutritional and medicinal value [2,3].
Flowering is an imperative process in the transformation from plant vegetative to reproductive growth, with complex regulatory mechanisms and pathways [4]. The flowering time is not only determined by genetic factors but is also initiated by environmental factors [5]. In recent years, with the continuous development of sequencing technology and genetic engineering, flowering-associated genes have been isolated and identified in a variety of plants, and the associated regulatory pathways of flowering have been clarified [6]. In the model plant A. thaliana, the flowering time is jointly controlled by the photoperiod pathway, vernalization pathway, autonomous pathway, and gibberellin pathway. The photoperiod pathway is the most thoroughly studied [7]. FT and SOC1, as key node genes, play a role in these pathways [8,9]. Water spinach naturally flowers in an inductive short day, which decreases the production of vegetative tissues and the food quality [2]. At present, the photoperiod-mediated regulation of water spinach flowering has not been clarified.
The molecular mechanism of the photoperiod regulation of plant flowering was discovered through the study of the model plant A. thaliana [5]. A photoperiod refers to the alternation of light and dark periods in the day–night cycle, which is an important environmental factor for plant flowering, and plants are separated into short-day plants, long-day plants, and day-neutral plants [10,11]. The photoreceptors in the plant leaves receive external light signals and convert the light signals into biological signals for the endogenous circadian clock [12]. The clock senses circadian changes to form a circadian rhythm and then initiates the expression of the CO gene, which controls downstream genes, such as FT and SOC1, to regulate plant flowering [13].
Photoreceptors can receive and recognize light signals of different wavelengths, and they are primarily distributed into three types: phytochromes, cryptochromes, and phototropins [14]. Phytochromes, including PHYA, PHYB, PHYC, PHYD, and PHYE, mainly absorb red light and far-red light in A. thaliana [12]. Cryptochromes (CRY1, CRY2, and CRY3) absorb blue and ultraviolet light [12,14]. The circadian clock plays a crucial role in the adjustment of the photoperiod [15]. Many circadian-clock components have transcriptional-regulation activity [16]. They are expressed sequentially over a period of about 24 hours, forming multiple feedback regulatory loops and regulating the expression of downstream genes to control plant growth, basal metabolism, and hormone metabolism [17,18,19].
In plants, the oscillatory mechanism involves a typical two-component response regulator named TOC1, or APRR1, and two related MYB transcription factors: LHY and CCA [20,21]. TOC1 (TIMING OF CAB EXPRESSION), LHY (LATE ELONGATED HYPOCOTYL), ELF4 (EARLY FLOWERING 4), CCA1 (CIRCADIAN CLOCK ASSOCIATED), and LUX (LUX ARRHYTHMO) are crucial clock-associated genes, and the transcription and translation levels of the different genes constantly change, forming regular oscillations [9,22,23]. LHY and CCA1 repress the expression of TOC1 by binding to the TOC1 promoter region. At the same time, TOC1 is a positive regulator of the expression of LHY and CCA1 [24]. The inhibition of TOC1 expression decreases the expression of LHY and CCA1. LHY and CCA1 repress the transcription of the TOC1 gene throughout the day. The expression of the TOC1 protein at night up-regulates the transcription of LHY and CCA1, resulting in peak expression in the morning [25,26,27]. There are both positive and negative feedback loops between TOC1 and LHY/CCA1, which may be the key to the circadian rhythm. These circadian-clock-related genes are located upstream of the photoperiod regulation pathway, and their continuous changes lead to changes in the expression of the downstream genes, which affect the flowering times of plants [19,24]. ELF3 and GI enable oscillators to synchronize endogenous cellular mechanisms with external environmental signals. The absence of the ELF3 and GI genes in plants affects clock-mediated photoperiod-responsive growth and development. This shows that the ELF3 and GI genes work together to transmit photoperiod sensing to the central oscillator [28].
The CO gene is a crucial part of the photoperiod pathway and the biological-rhythm pathway. It can convert light signals into flower signals and affect the flowering times of plants [29]. In A. thaliana, the CO protein is a nuclear zinc-finger protein containing B-box and CCT domains, which can bind to the promoter of FT and activate flowering [29,30], and multiple CO genes have been identified in plants [31,32,33,34]. The expression of CO is regulated by the circadian clock and light signal pathways. The transcription of the CO gene is primarily controlled by CDFs and the FKF1-GI complex [35]. CDF transcription factors, including CDF1, CDF3, CDF4, and CDF5, act in concert with the CO promoter and repress transcription. CDF1 has been demonstrated to directly bind to the CO regulatory regions and act as a repressor of CO transcription [36]. Further studies have found that CDF can up-regulate the expression of the transcription repressor TPL, thus repressing the expression of the CO gene [35,37]. FKF1 is a kind of E3 ubiquitination ligase. FKF1 forms a complex with GI and activates the transcription of CO by degrading CDF, a repressor of CO transcription [35,36,37,38,39,40]. The bHLH transcriptional activators FBH1, FBH2, FBH3, and FBH4 recognize and bind to the E-box cis-element in the CO promoter and then activate the transcription of CO. Overexpression of the FBH protein can up-regulate CO levels and cause early flowering [41].
CO is regulated not only at the transcription level but also at the level of its protein stability and accumulation. The E3 ubiquitin ligase COP1 (CONSTITUTIVELY PHPYOMORPOGENIC 1) inhibits flowering by promoting the hydrolysis of the CO protein at night [42,43]. In plants, the E3 ligase activity of COP1 depends on its interaction with SUPPRESSOR OF PHYA-105 (SPA) proteins. The four-member SPA protein family of A. thaliana acts in concert with COP1 to inhibit photomorphogenesis at night [10,44,45]. The CDF1 protein binds to the FT promoter to repress FT transcription, while FKF1 can remove CDF1 from the FT promoter region to initiate FT transcription [46]. CO stimulates FT expression by binding to CO-responsive elements (COREs) and CCAAT-box elements in its promoter [32,47].
FT is a member of the phosphatidylethanolamine-binding protein (PEBP) family, and the other two homologs, TSF and MOTHER OF FT (MFT), have a redundant function as flowering inducers [48,49]. The FT gene is a key factor in the photoperiod pathway, and its expression is closely associated with the flowering time. As FT activators, CIBs interact directly with the FT promoter, initiating its expression. CRY2 responds to blue light, forms a protein complex with CIB1 and CO, and promotes flowering [50,51]. GI can bind to three FT repressors (SHORT VEGETATIVE PHASE (SVP), TEMPRANILLO (TEM)1, and TEM2) to regulate FT expression in a CO-independent manner [52]. FLC and SHORT VEGETATIVE PHASE (SVP) directly suppress FT and SOC1 expression [53]. The FT protein is first produced in the companion cells in the phloem and then transmitted to the shoot apical meristem, where it forms a complex with the bZIP transcription factor FD (FLOWERING LOCUS D) [54], activating the expression of the floral meristem identity gene APETALA1 (AP1); meanwhile, LEAFY (LFY) is first up-regulated in leaf primordia and the SAM. FRUITFUL (FUL) is later activated and eventually initiates the flowering process [11,33,55].
In this study, we used an RNA-seq sequencing platform to find circadian-rhythm-related genes, determine the expression patterns of flowering-associated genes, and discover the regulatory network of flowering genes through weighted correlation network analysis (WGCNA). The objectives of this study were to (1) identify homologous genes associated with flowering in water spinach and (2) preliminarily identify the photoperiod-mediated molecular regulation mechanism of flowering time in water spinach.

2. Results

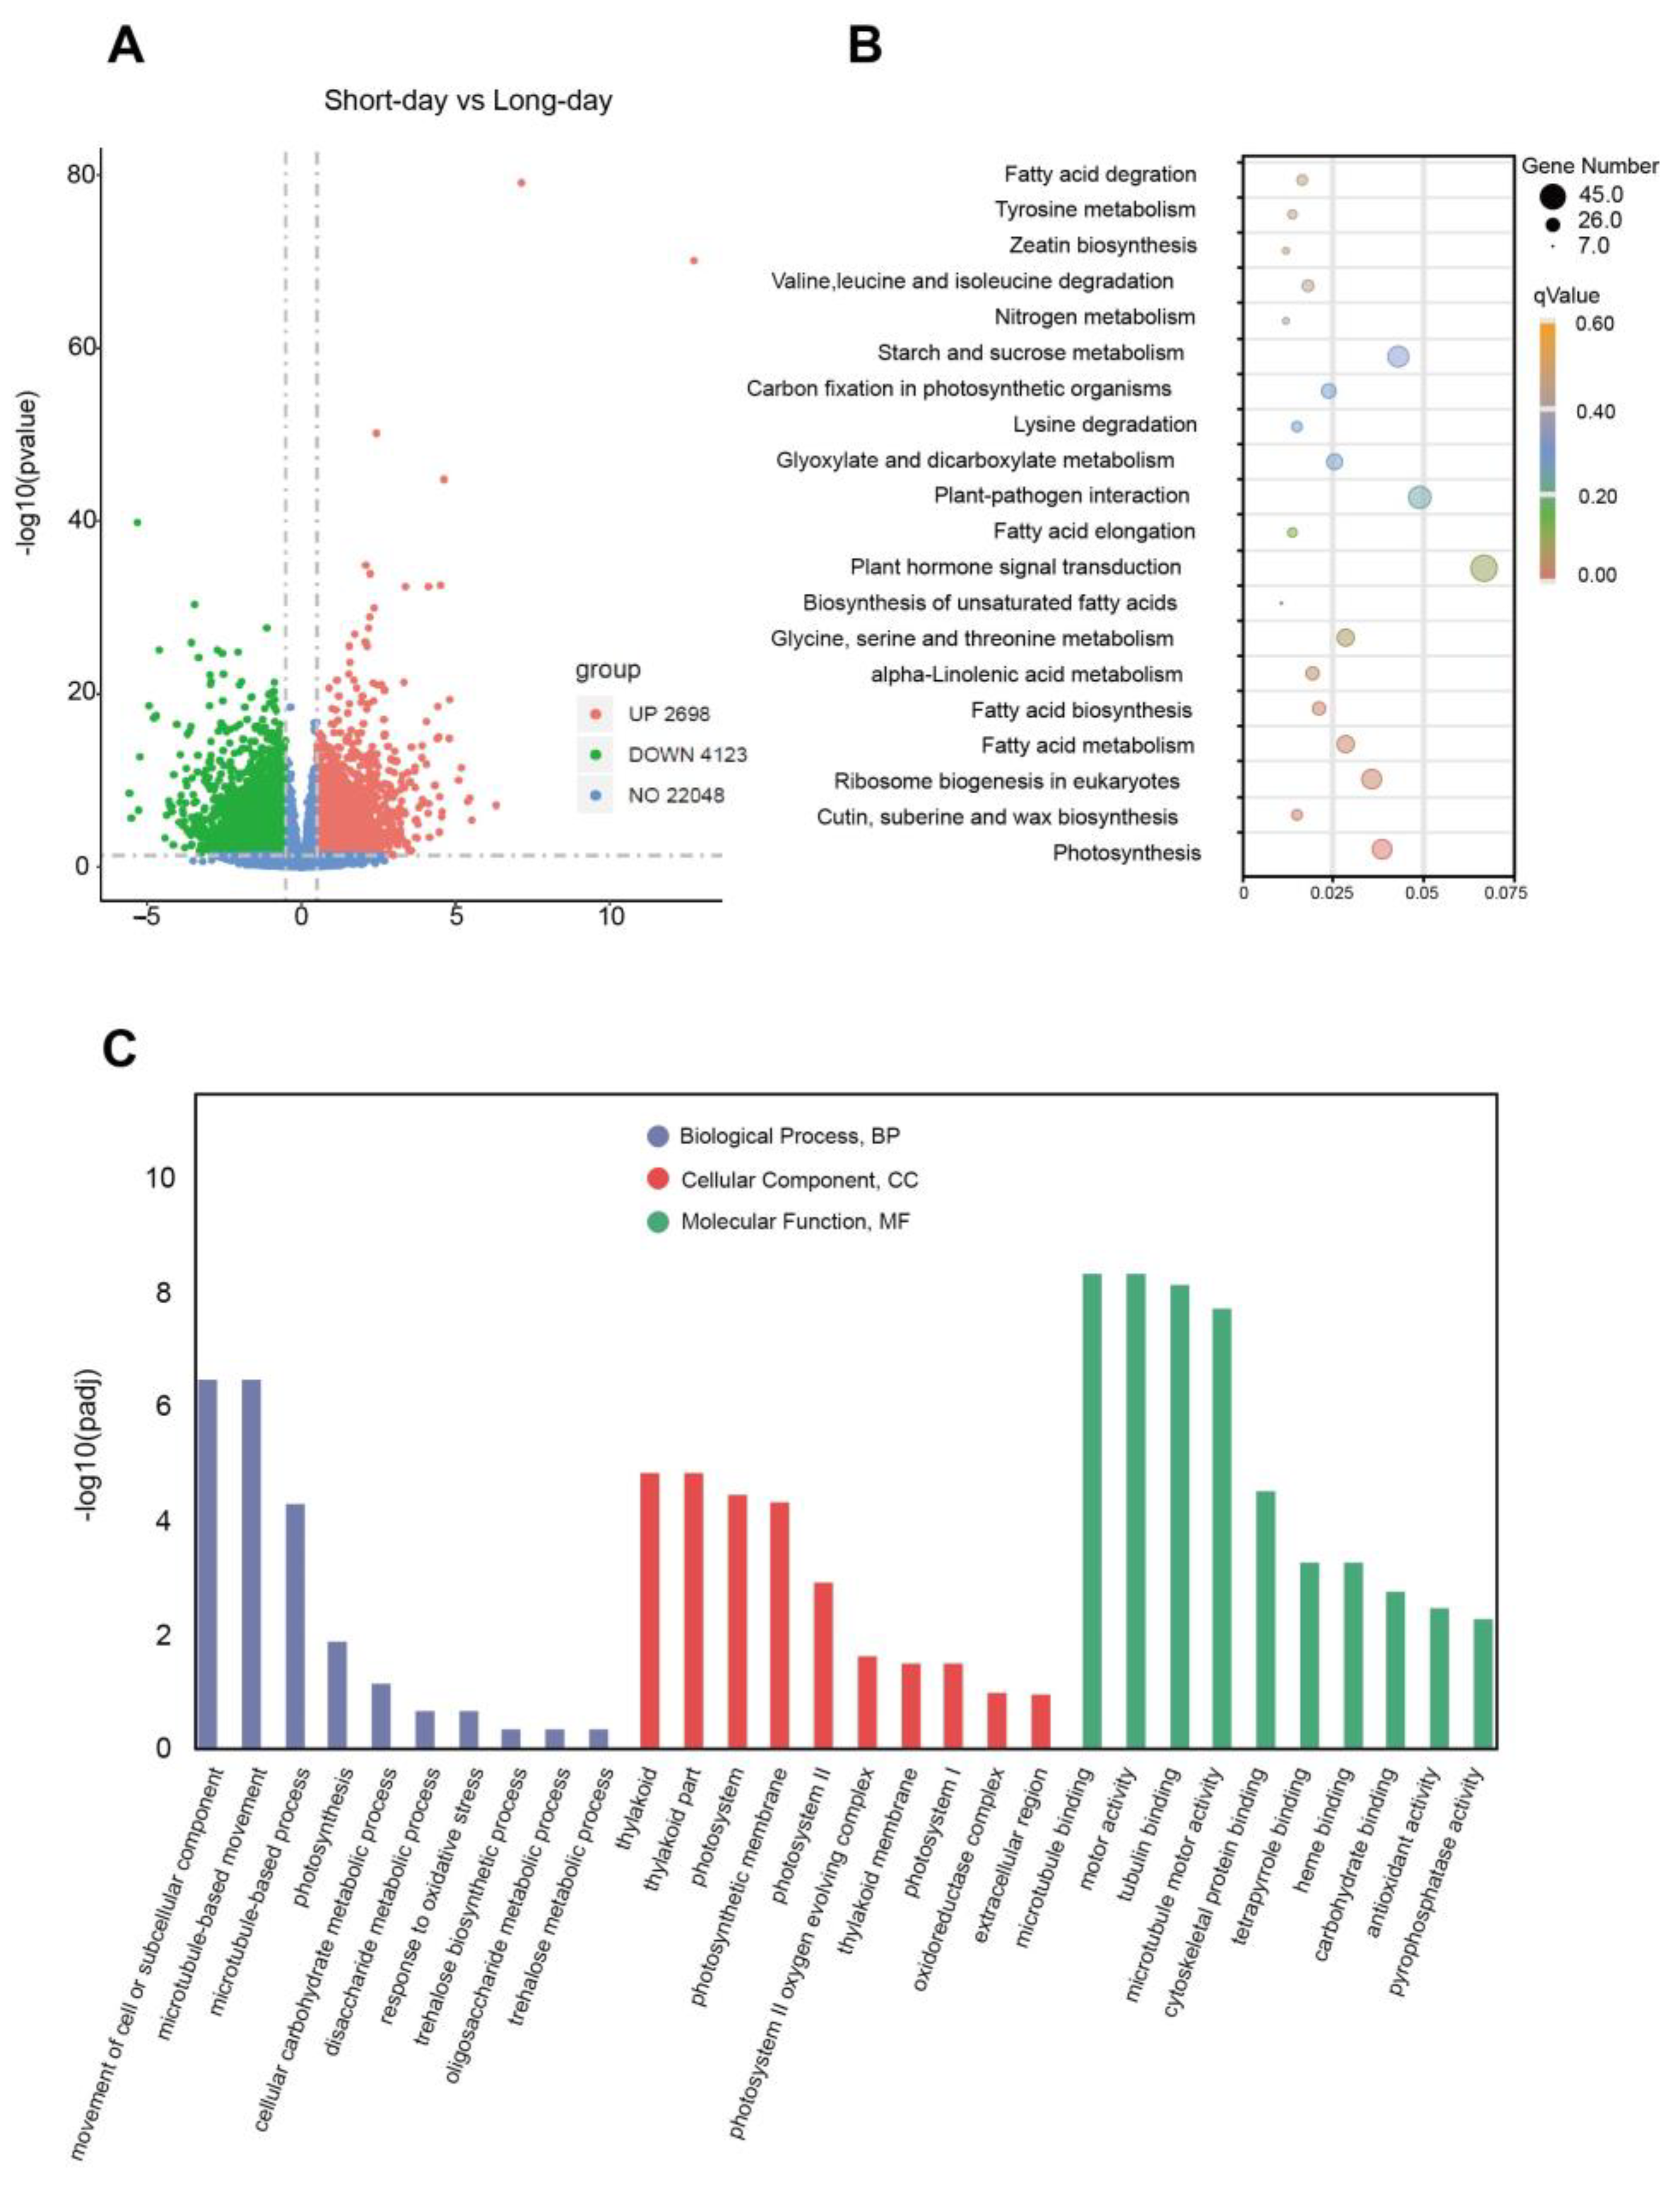
2.1. RNA-Seq Data Statistics

We performed RNA sequencing at different time points from different photoperiods and constructed 48 libraries. A total of 215.10 million raw reads were generated through RNA-seq. Paired-end sequences with low-quality reads were filtered out. Finally, 205.92 million clean reads were obtained. The error rate was less than 0.03%, on average; the GC content was 45.57%, and Q30 (the percentage of bases with Phred values greater than 30 bases in total) was 94.06%. Interestingly, 95.79% of reads were mapped to the Ipomoea aquatica reference genome, and about 91.64% were mapped to unique positions. Among these reads, more than 82.04% were distributed in exon regions, 6.85–10.29% were distributed in intronic regions, and 3.52–7.91% were distributed in intergenic areas.

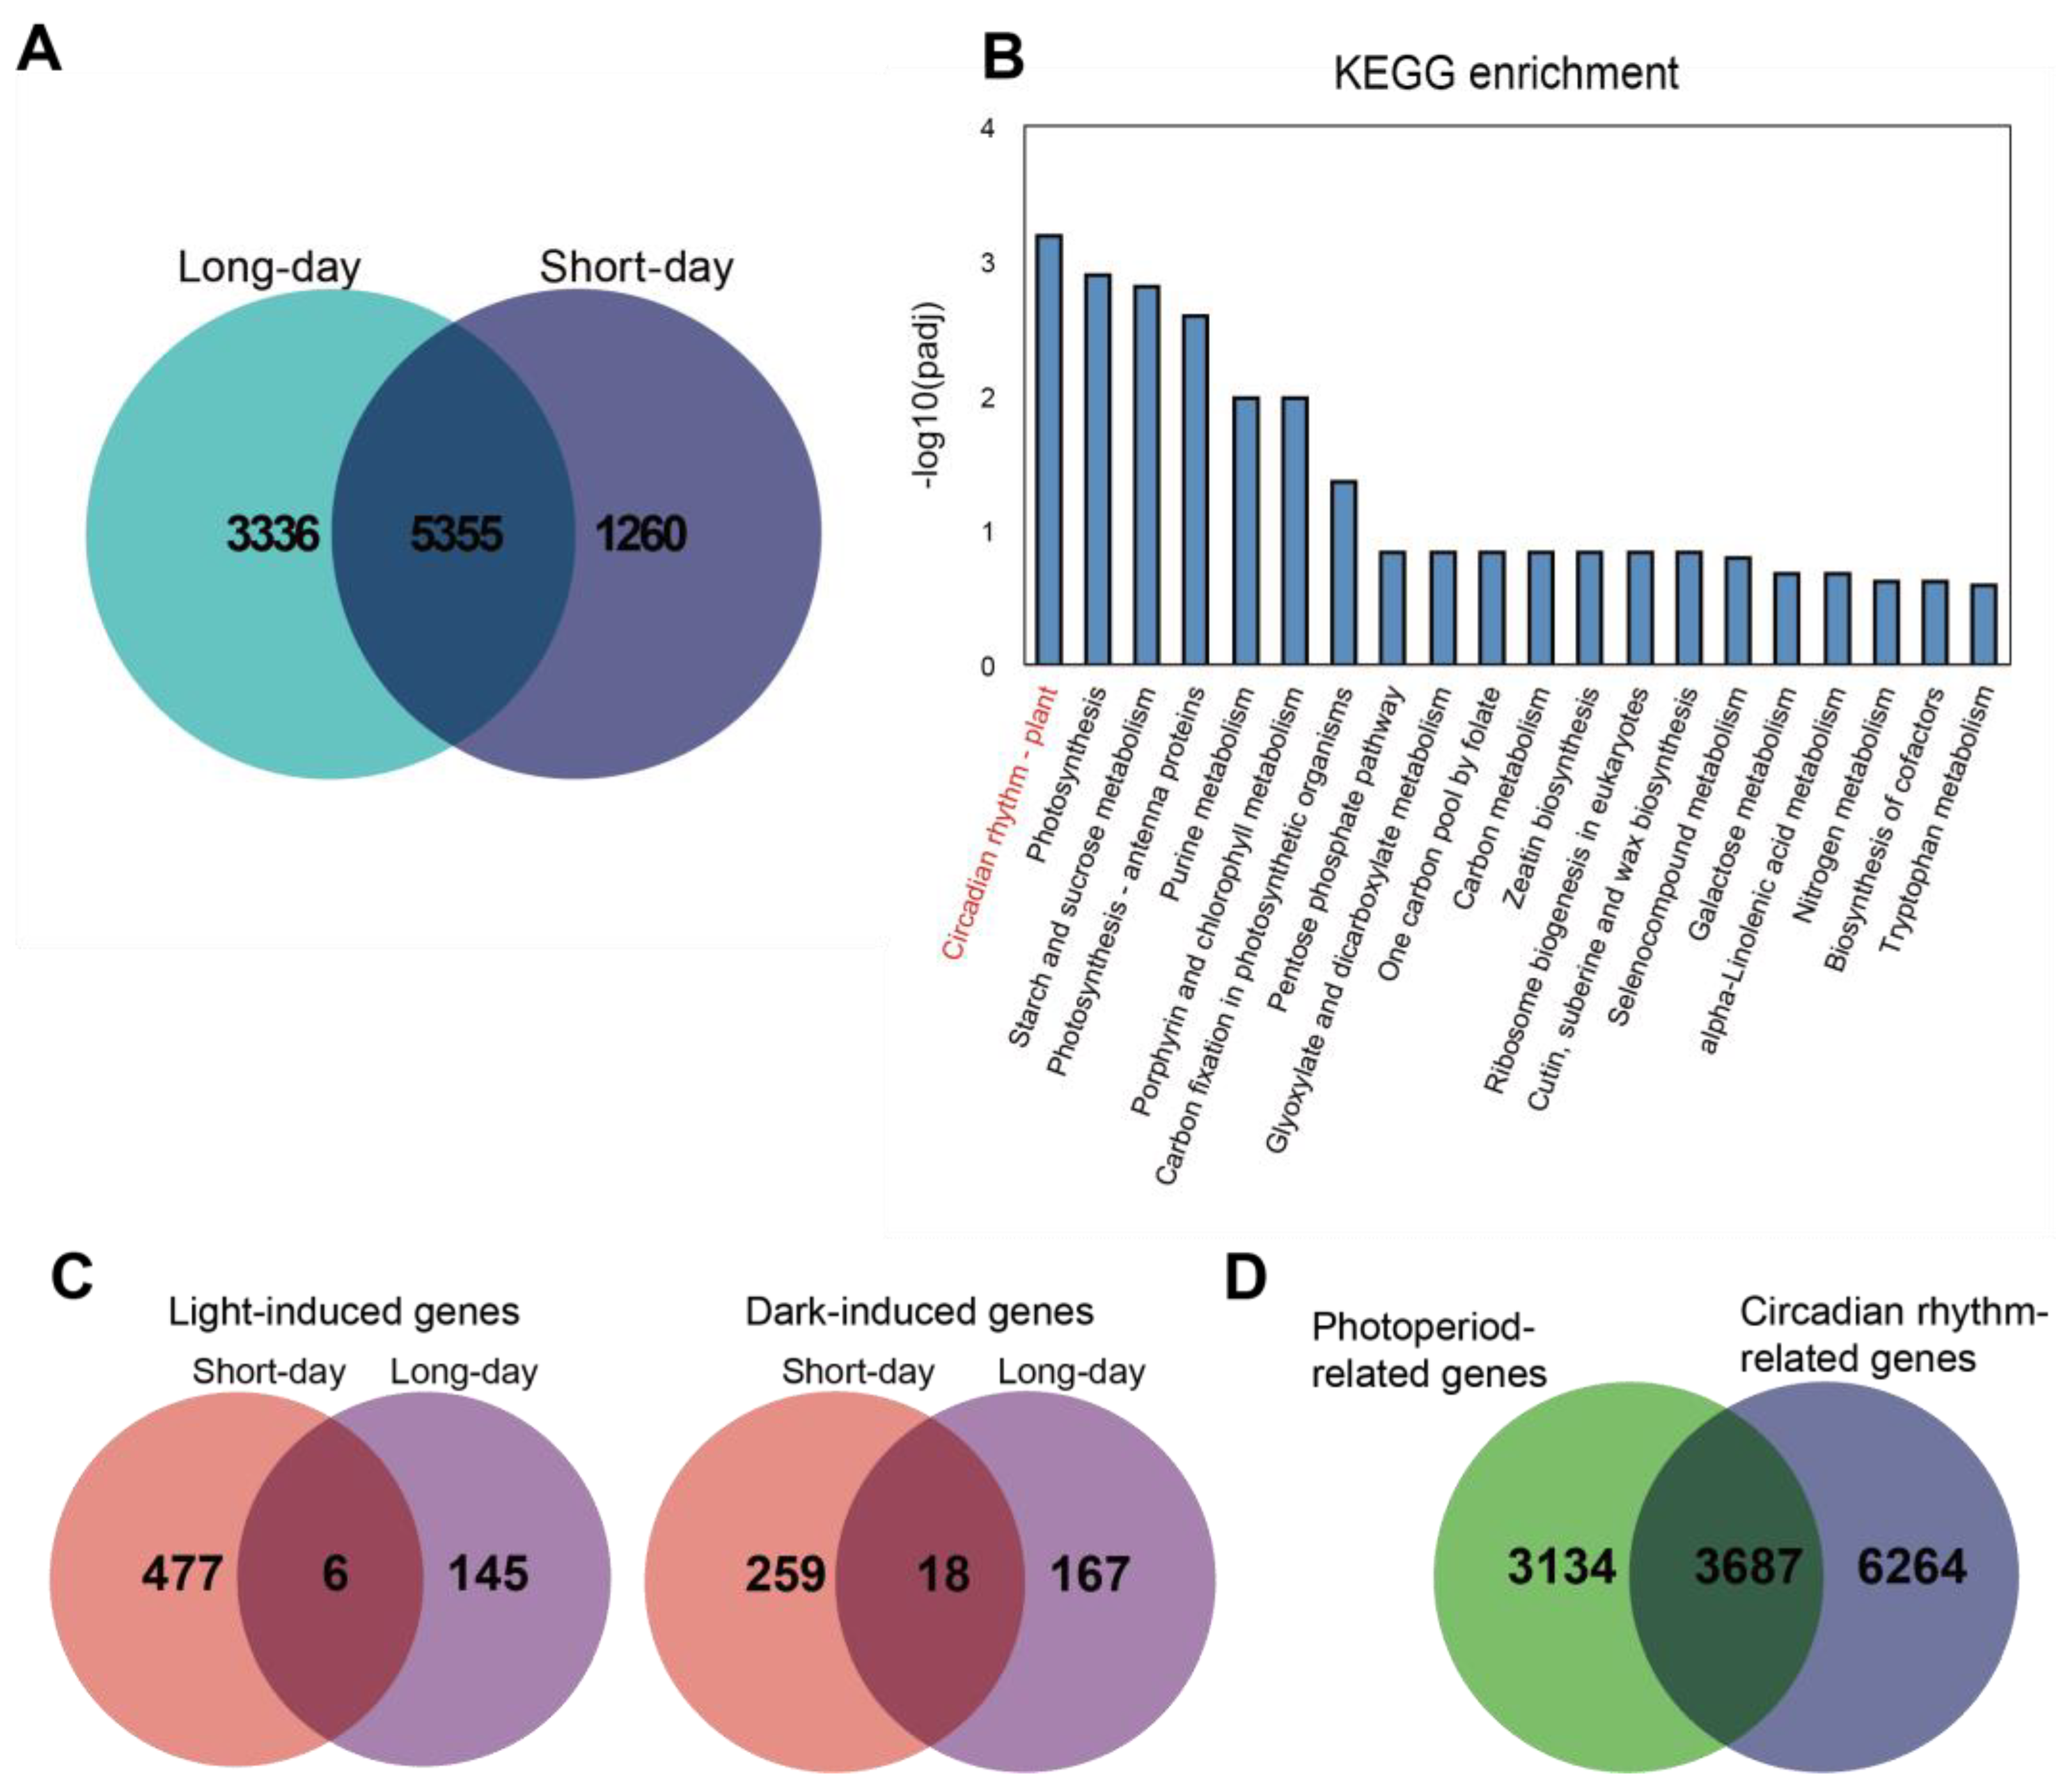
2.2. Analysis of Photoperiod-Related Genes and Circadian-Rhythm-Related Genes

In our experiment, the data thresholds were a p-value < 0.05 and |log2FoldChange| > 0.5. A total of 6821 differentially expressed genes were separated and named photoperiod-related genes, of which 2698 were up-regulated and 4123 were down-regulated. GO enrichment showed that in the CC fraction, the genes were mainly enriched in terms related to the photosystem. Through KEGG pathway annotation, photosynthesis, cutin, suberine, wax biosynthesis, and ribosome biogenesis in eukaryotes were significantly enriched (Figure 1).
We summarized the differentially expressed genes in all comparisons at different time points in the long day and short day and named them circadian-rhythm-related genes. The results indicated that there were 9951 circadian-rhythm-related genes in total: 6615 circadian-rhythm-related genes under the long-day condition and 8691 circadian-rhythm-related genes under the short-day condition, with 5355 rhythm-related genes in common between them (Figure 2A). The KEGG enrichment results indicated that the 5355 genes were primarily enriched in the circadian-rhythm–plant pathway (Figure 2B). For circadian-rhythm-related genes, we deleted genes with FPKM < 10 in all samples based on their expression levels; we called a gene whose expression level is higher in light than in the dark a light-induced gene and a gene whose expression level in the dark is higher than that in light a dark-induced gene. The results indicated that under long-day conditions, there were 151 light-induced genes and 185 dark-induced genes. Under short-day conditions, there were 483 light-induced genes and 277 dark-induced genes (Figure 2C). Further, we investigated the relationship between photoperiod-related genes and circadian-rhythm-related genes. The Venn diagram showed that 3687 genes were associated with both the photoperiod and circadian rhythm, 3134 genes were only related to the photoperiod, and 6264 genes were only associated with circadian rhythms (Figure 2D).

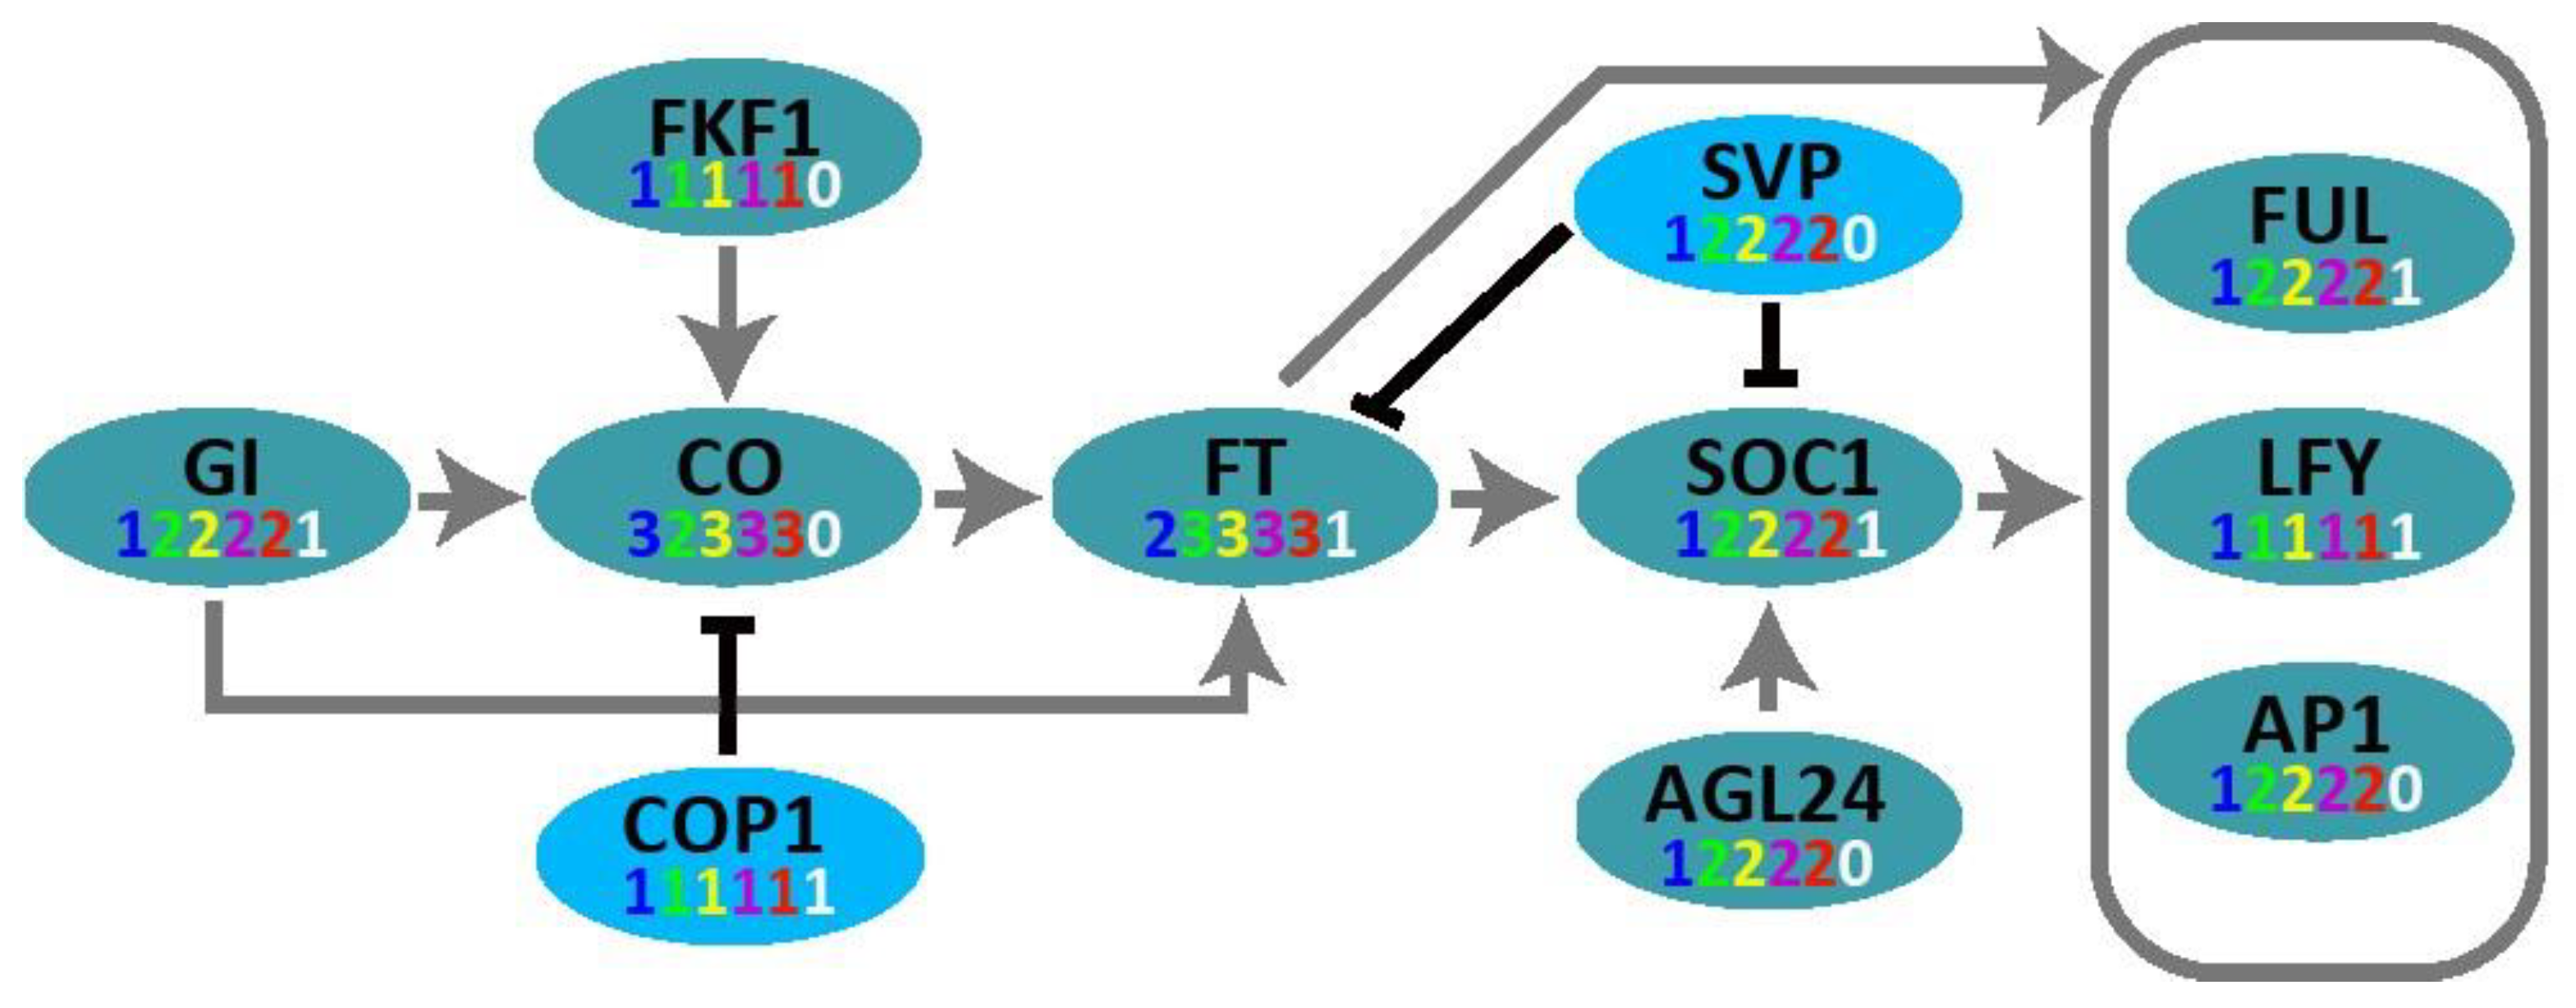
2.3. Molecular Network of Core-Clock Oscillator

The feedback regulation between LHY/CCA1 and TOC1 genes was the key to the circadian rhythm. Through phylogenetic analysis, there was only one copy of CCA1, LHY, and TOC1 in water spinach, namely, iaq.scaf_129.1643_iaq.scaf_129.1644 (IaCCA1), iaq.scaf_51.23 (IaLHY), and iaq.scaf_884.166 (IaTOC1). The transcriptome results specified that IaCCA1 and IaLHY gene expression patterns were similar and exhibited the same oscillation pattern under different photoperiods, with the strongest suppression in the dark for four hours under the short-day condition. The IaTOC1 transcription level was opposite to those of IaCCA1 and IaLHY, with the expression peak occurring after four hours of darkness under the short-day condition (Figure 3). These research results confirmed the negative regulatory mechanism of LHY/CCA1 and TOC1.

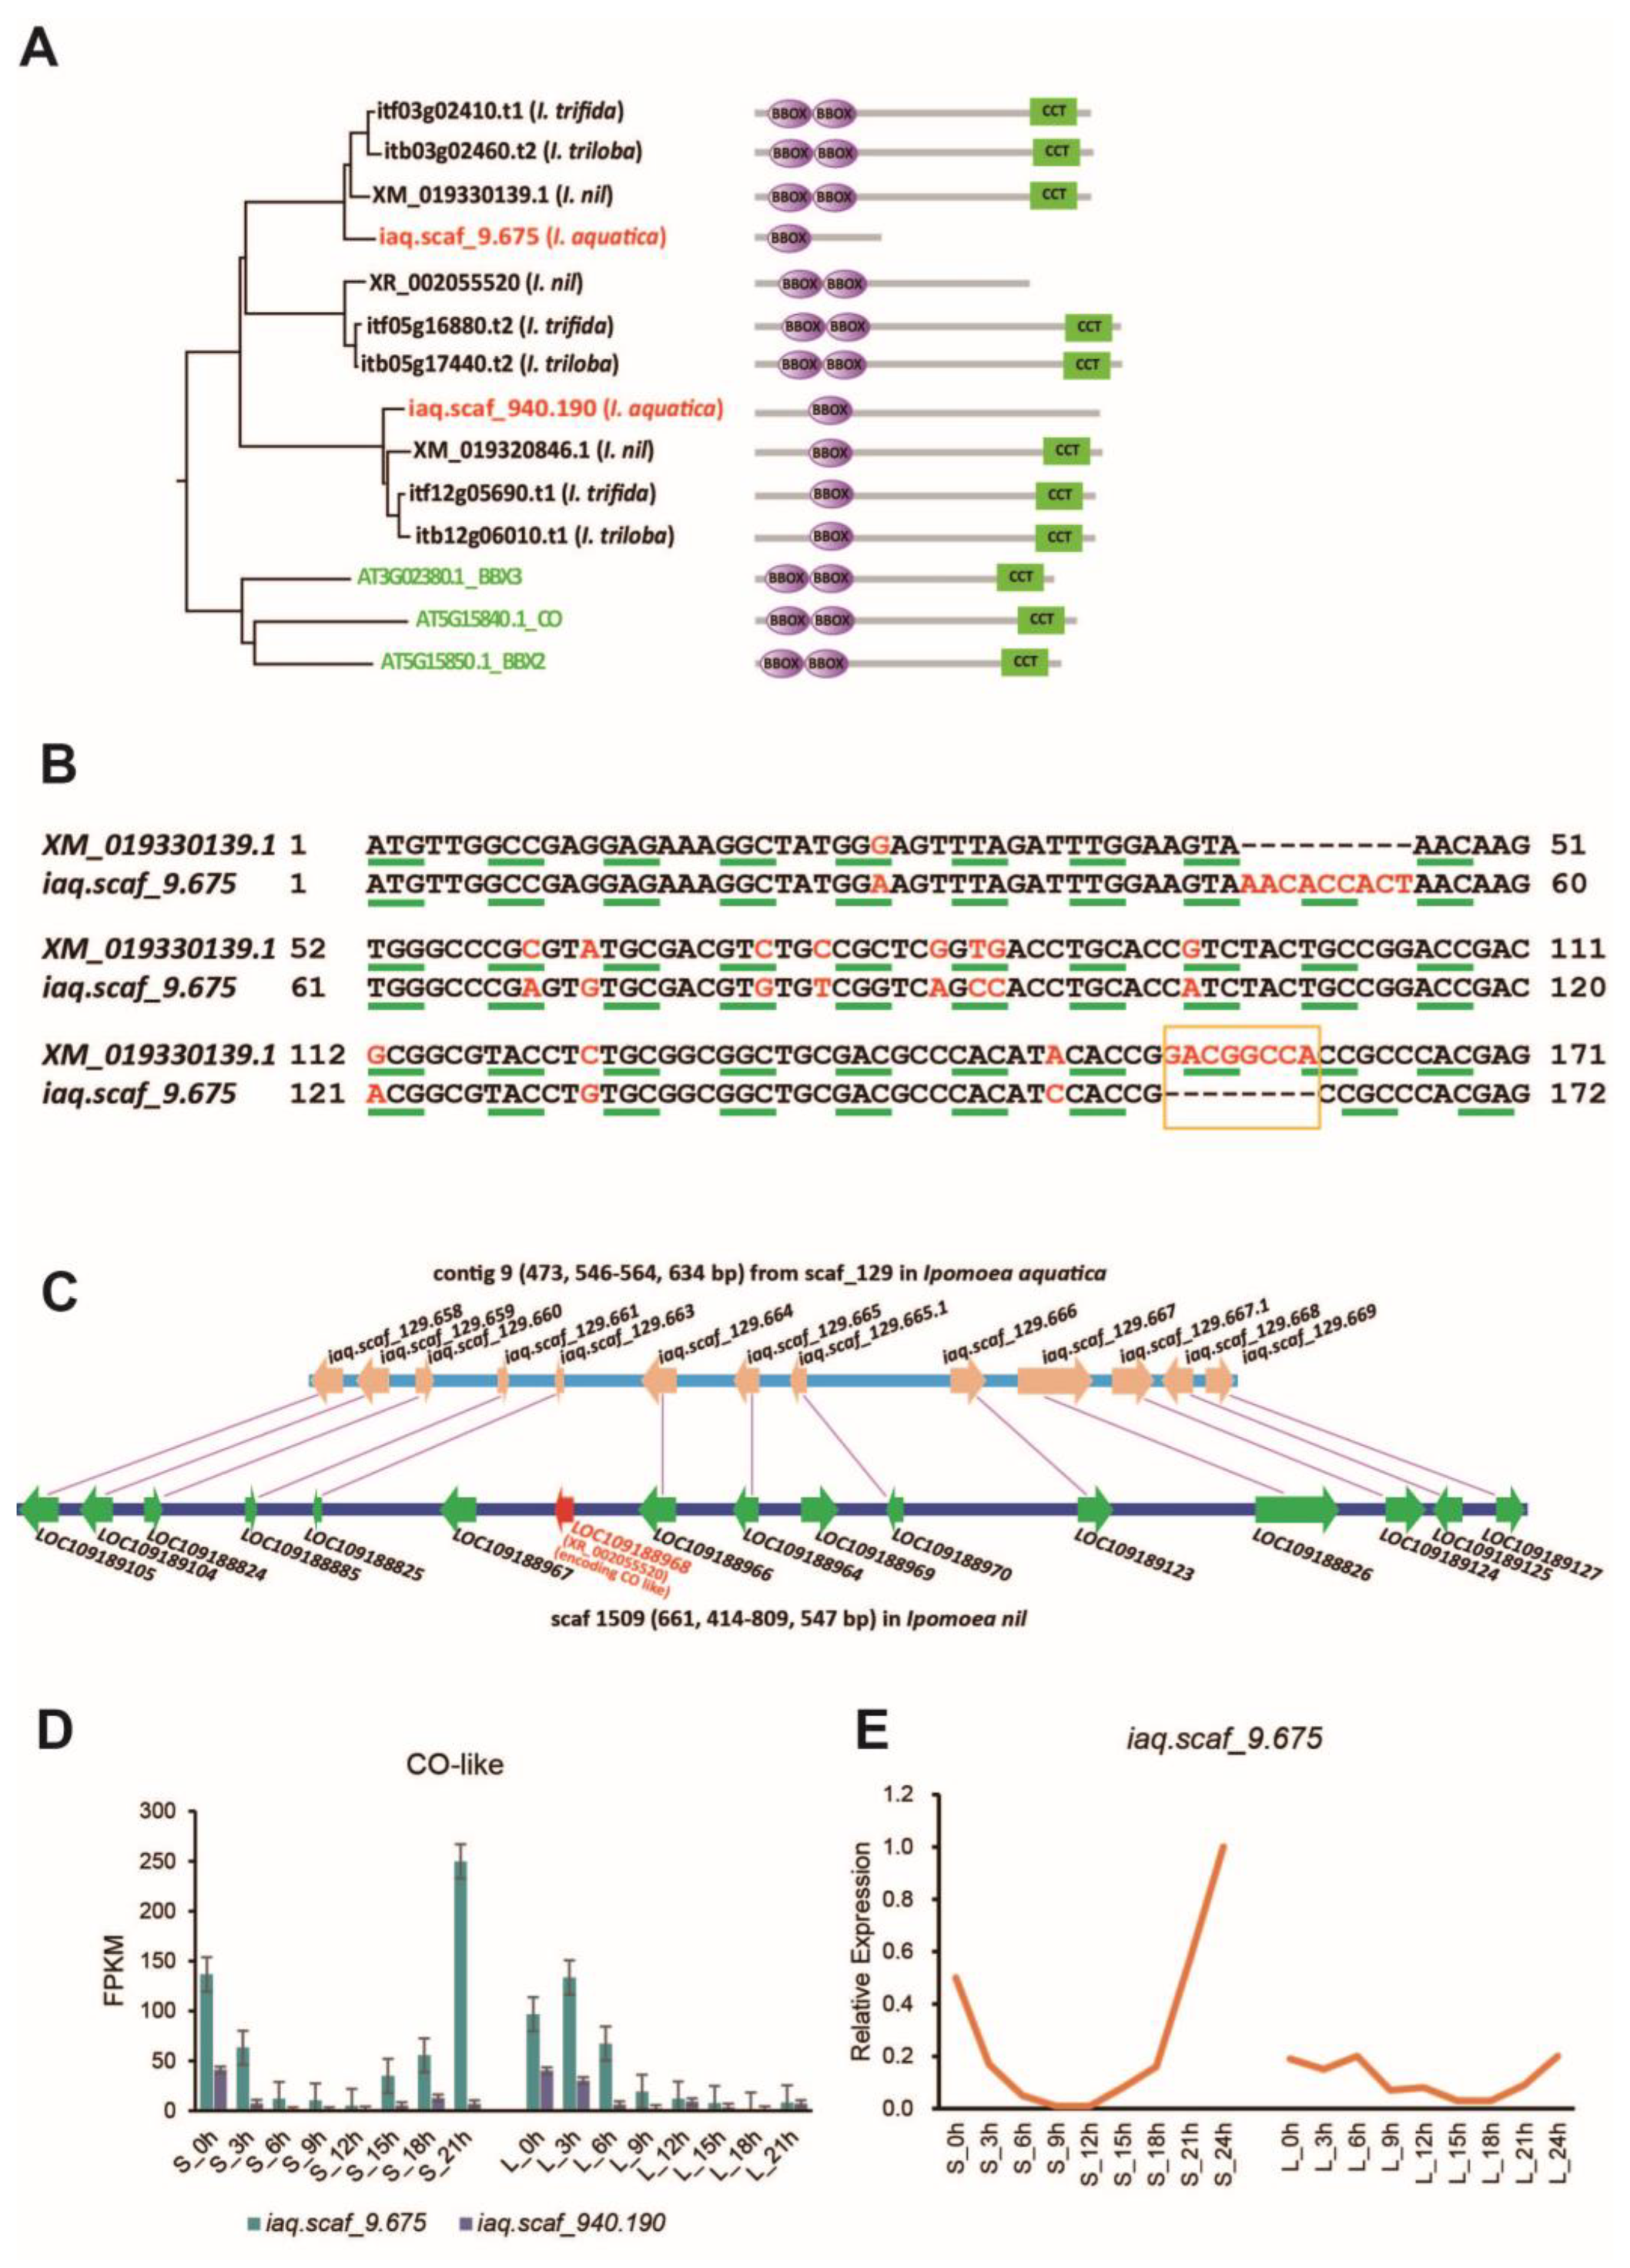
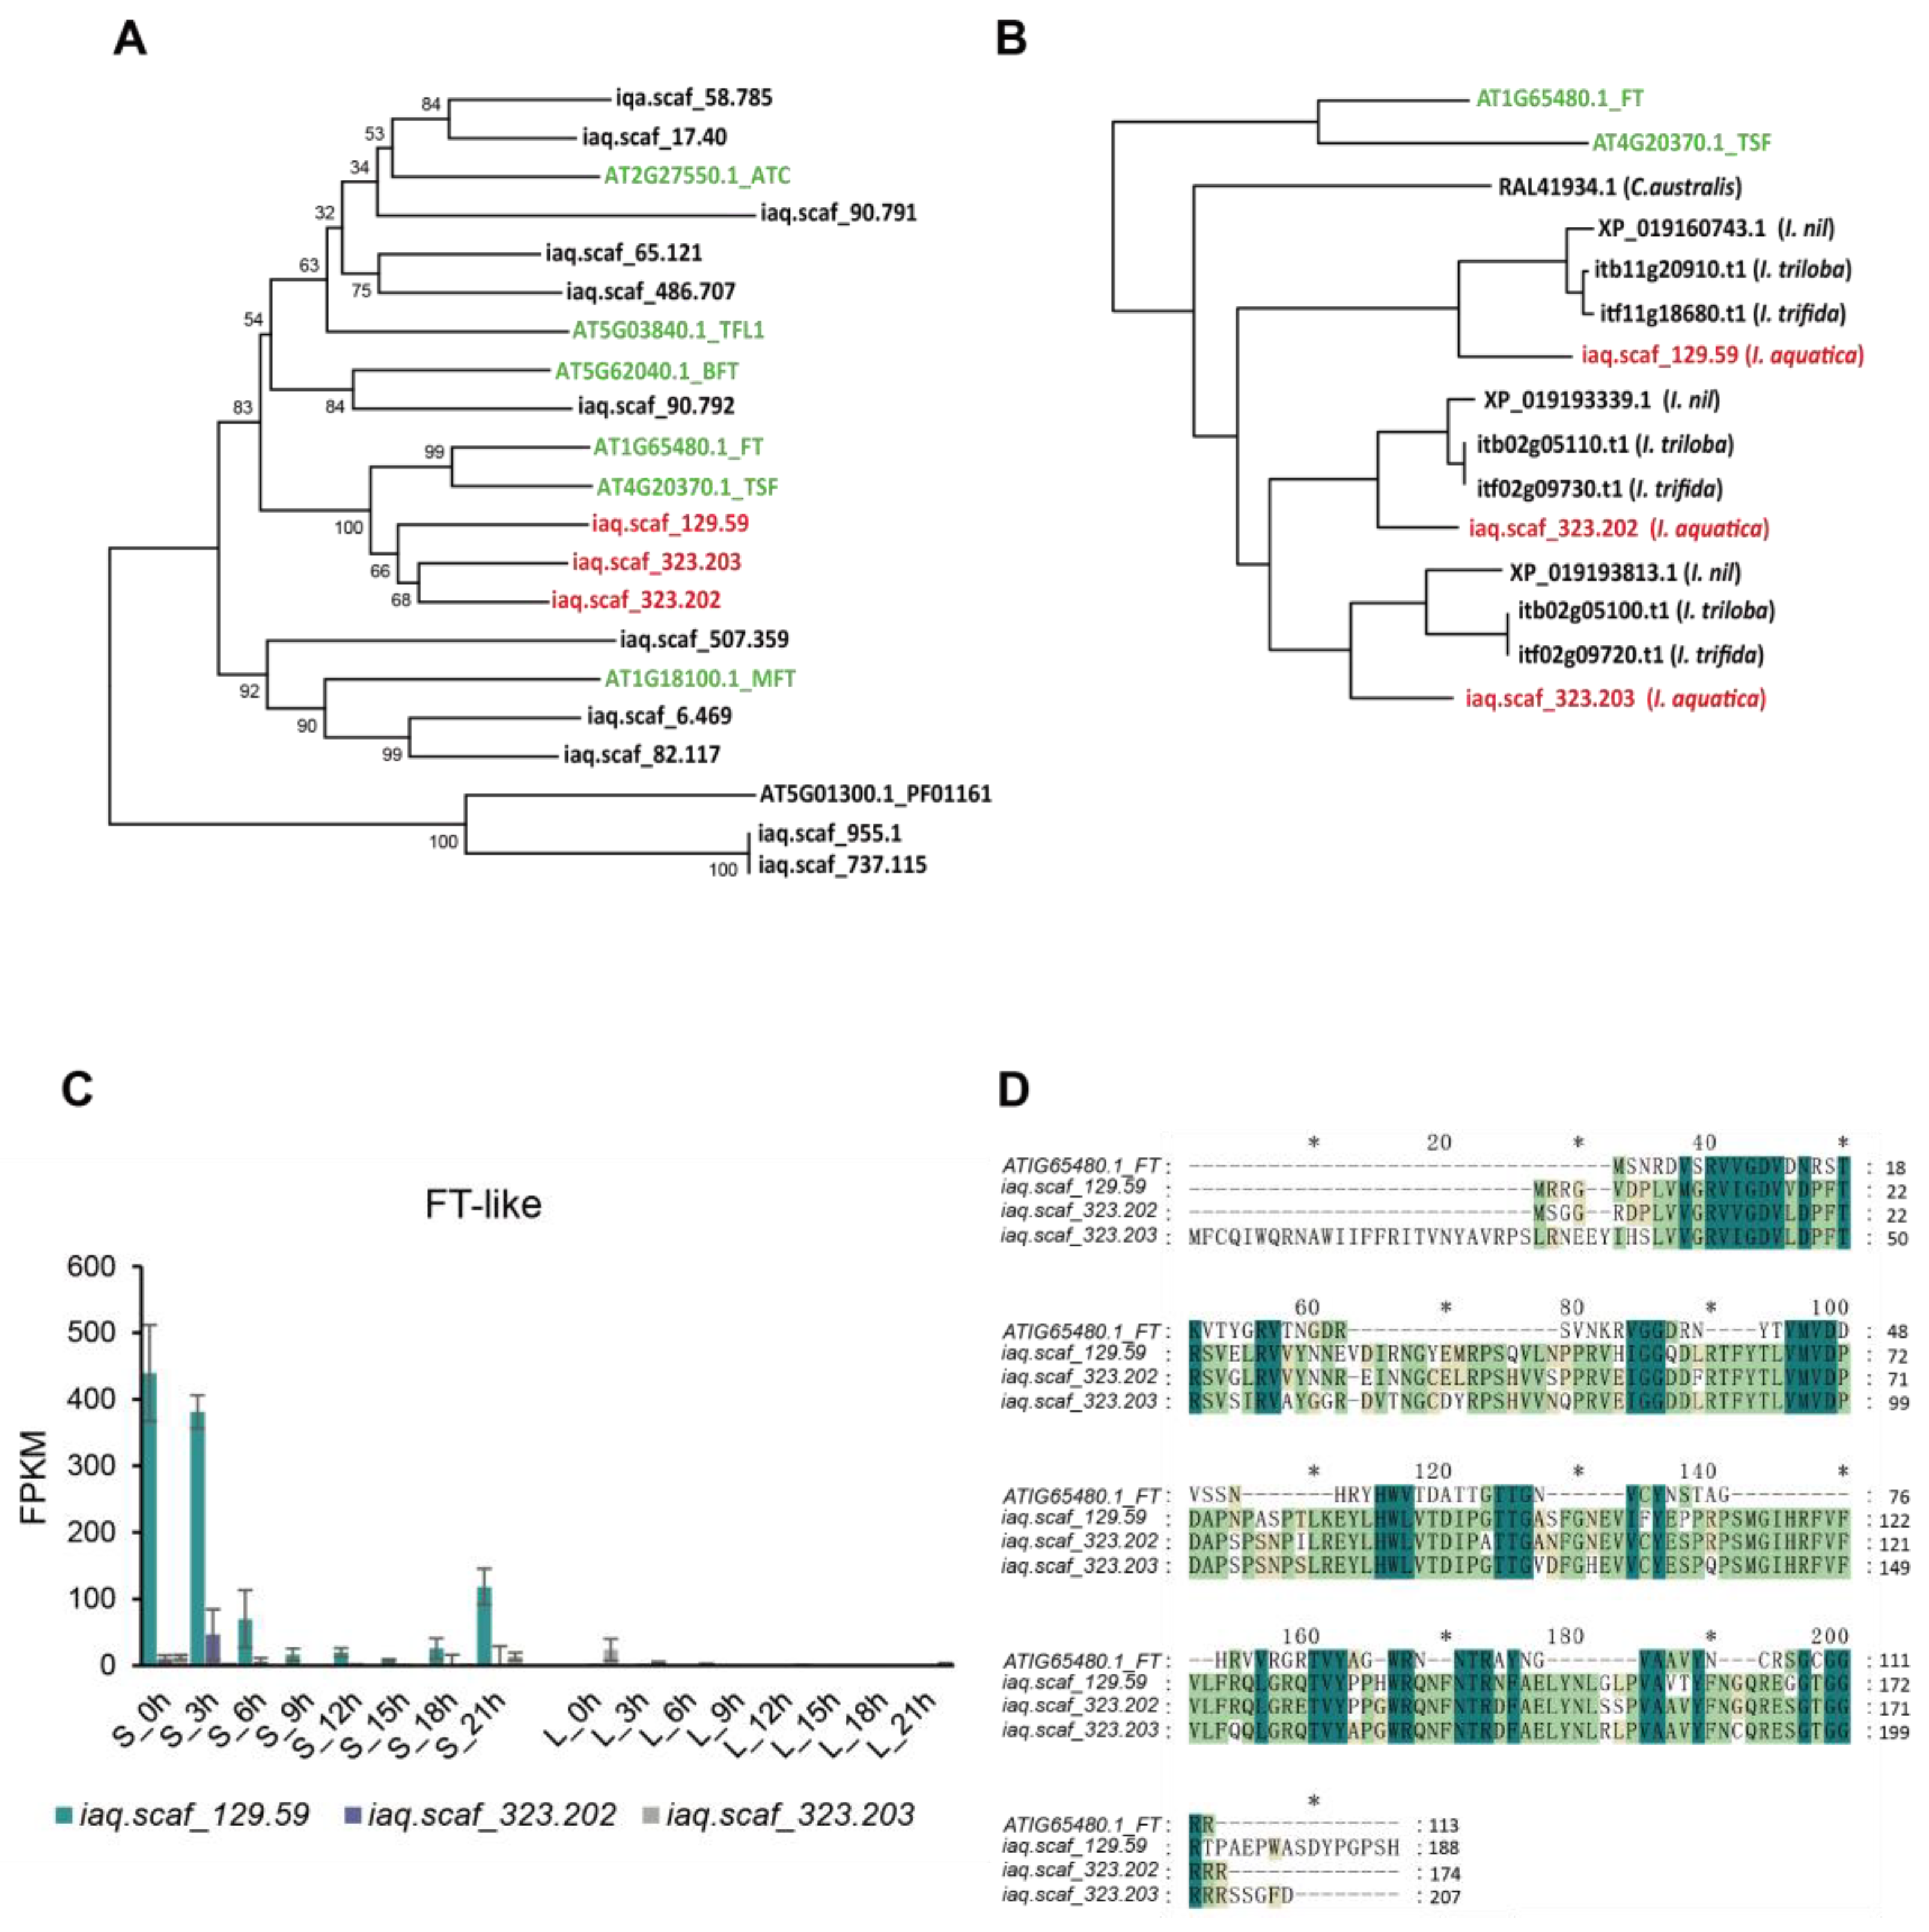
2.4. Analysis of Photoperiod-Mediated Flowering-Related Genes

The photoperiod-mediated plant flowering time regulation pathway has been mainly elucidated in A. thaliana (Figure 4). The photoreceptors regulate the expression of CO via GI, a gene involved in the circadian rhythm clock, and CO then activates the downstream gene FT. The GI-CO-FT model is the major photoperiod pathway in A. thaliana.
The transcription of GI is controlled by the circadian clock, and the phylogenetic tree reveals that GI has two copies in water spinach and that the transcript level of iaq.scaf_28.25 (IaGI1) was higher than that of iaq.scaf_115.70 (IaGI2), signifying the main role of iaq.scaf_28.25 as the ortholog of GI. The expression level of iaq.scaf_28.25 displayed a clear circadian rhythm oscillation, and the transcript level increased just after light and decreased after dark (Figure 5).
Phylogenetic analysis showed two CO subgroup members, iaq.scaf_9.675 (IaCO1) and iaq.scaf_940.190 (IaCO2), in water spinach and three in I. nil (XM_019330139.1, XM_019320846.1, and XR_002055520) (Figure 6A). The domain prediction revealed only one B-box in iaq.scaf_940.190 and iaq.scaf_9.675. In contrast to XM_019330139.1, encoding a protein with two B-boxes and one CCT domain, the iaq.scaf_9.675 gene encodes a truncated protein containing only one B-box due to an eight-base deletion of aq.scaf_9.675 (Figure 6B). The homozygous iaq.scaf_9.675 locus was confirmed by Illumina reads. Genome BLAST and orthologous region alignment showed that the XR_002055520 ortholog was deleted from the water spinach genome (Figure 6C).
In order to identify the gene that involves CO, we explored two CO subgroup numbers in water spinach. In the short-day condition, the transcript level of iaq.scaf_9.675 progressively decreased during the day, and when darkness came, the expression progressively increased, with the expression peak in the early morning. Additionally, we found that the iaq.scaf_940.190 gene exhibited low expression (Figure 6D). Hence, it can be speculated that the iaq.scaf_9.675 gene plays a role as a CO homolog in water spinach. To further investigate the expression pattern of the iaq.scaf_9.675 gene, we further added a sampling time point, 5 min before light (S_24h and L_24h); real-time quantitative PCR showed that the transcript level of iaq.scaf_9.675 accumulated continuously at night, and the transcript level decreased rapidly when exposed to light, signifying that the transcript level of CO was very sensitive to light (Figure 6E).
The A. thaliana FT/FTL1 gene family contains 6 genes, and the family is expanded to 12 members with 3 FT subgroup members in water spinach (iaq.scaf_129.59 (IaFT1), iaq.scaf_323.202, and iaq.scaf_323.203). During the long day, almost no transcripts were detected for any members in the leaves. During the short day, only the FT subgroup members were strongly up-regulated (Figure 7). The expression of the iaq.scaf_129.59 gene was significantly higher than the others, and its expression gradually decreased with the increase in daylight time and then gradually increased after darkness, reaching the peak in the early morning. These results suggest that iaq.scaf_129.59 is an ortholog of FT (Figure 7C). The loss of expression of iaq.scaf_129.59 could be the cause of the complete inhibition of the flowering ability of water spinach under the long day length.
Moreover, we investigated the genes associated with the flowering mechanism in water spinach through phylogenetic and comparative transcriptome analyses, and the outcomes indicate that there are two copies of AGL24, SVP, SOC1, FUL, and AP1 in Ipomoea species, suggesting that these genes are linked to a common ancestor. COP1, LFY, and FPK1 have only one copy in Ipomoea species (Figure S1).
iaq.scaf_1261.31 and iaq.scaf_913.48 are FKFI-homologous genes; iaq.scaf_19.19 accumulated under both long-day and short-day conditions, and the transcription level was consistent. The expression progressively increased with the daylight hours, reaching a peak in the evening, and then the transcript level continuously declined in the dark, signifying a similar expression pattern to that of iaq.scaf_28.25 (IaGI). As a negative regulator of flowering, the transcript level of iaq.scaf_56.407 (IaCOP1) was opposite to those of the IaGI and IaFPK1 genes: the transcript level decreased continuously during the day, and the expression level gradually accumulated after dark (Figure S1).
As homologous genes of AGL24 in water spinach, the expression patterns were similar, and they were both induced by short-day conditions. The gene transcript level under the short-day condition was significantly lower than that under the long-day condition. There are two SOC1 homologs (iaq.scaf_56.882 and iaq.scaf_130.151) in water spinach, and the transcript levels of the two genes exhibited regular oscillations. With the increase in light time, the transcript levels gradually decreased. After dark, the transcript levels gradually increased again, reaching a peak in the early morning, but only iaq.scaf_130.151.1 was induced by a short day. As SVP homologs, the transcript level of iaq.scaf_940.636.1 was higher than that of iaq.scaf_9.539. In addition, the expression of the iaq.scaf_940.636.1 gene was slightly higher under long-day conditions. Presumably, this gene had a repressive effect on the transcript levels of SOC1 and FT. As FUL homologs, iaq.scaf_107.214 and iaq.scaf_884.85 had high transcript levels and were strongly induced by short days. Among them, the transcript level of iaq.scaf_884.85 was higher than that of iaq.scaf_107.214, suggesting that iaq.scaf_884.85 plays a significant part in the flowering pathway. Together, the transcription levels indicated that LFY- and AP1-homologous genes in water spinach were not expressed under different light conditions (Figures S2 and S3).

2.5. Validation of RNA-Seq Data by qRT-PCR

We selected eight flowering-related genes for qRT-PCR analysis to confirm the accuracy of the RNA-seq results. The results indicated that the relative expression levels of the samples determined by qRT-PCR were generally consistent with the FPKM values of the samples analyzed by RNA-seq (Figure S2), thus representing the stability and consistency of the RNA-seq data.

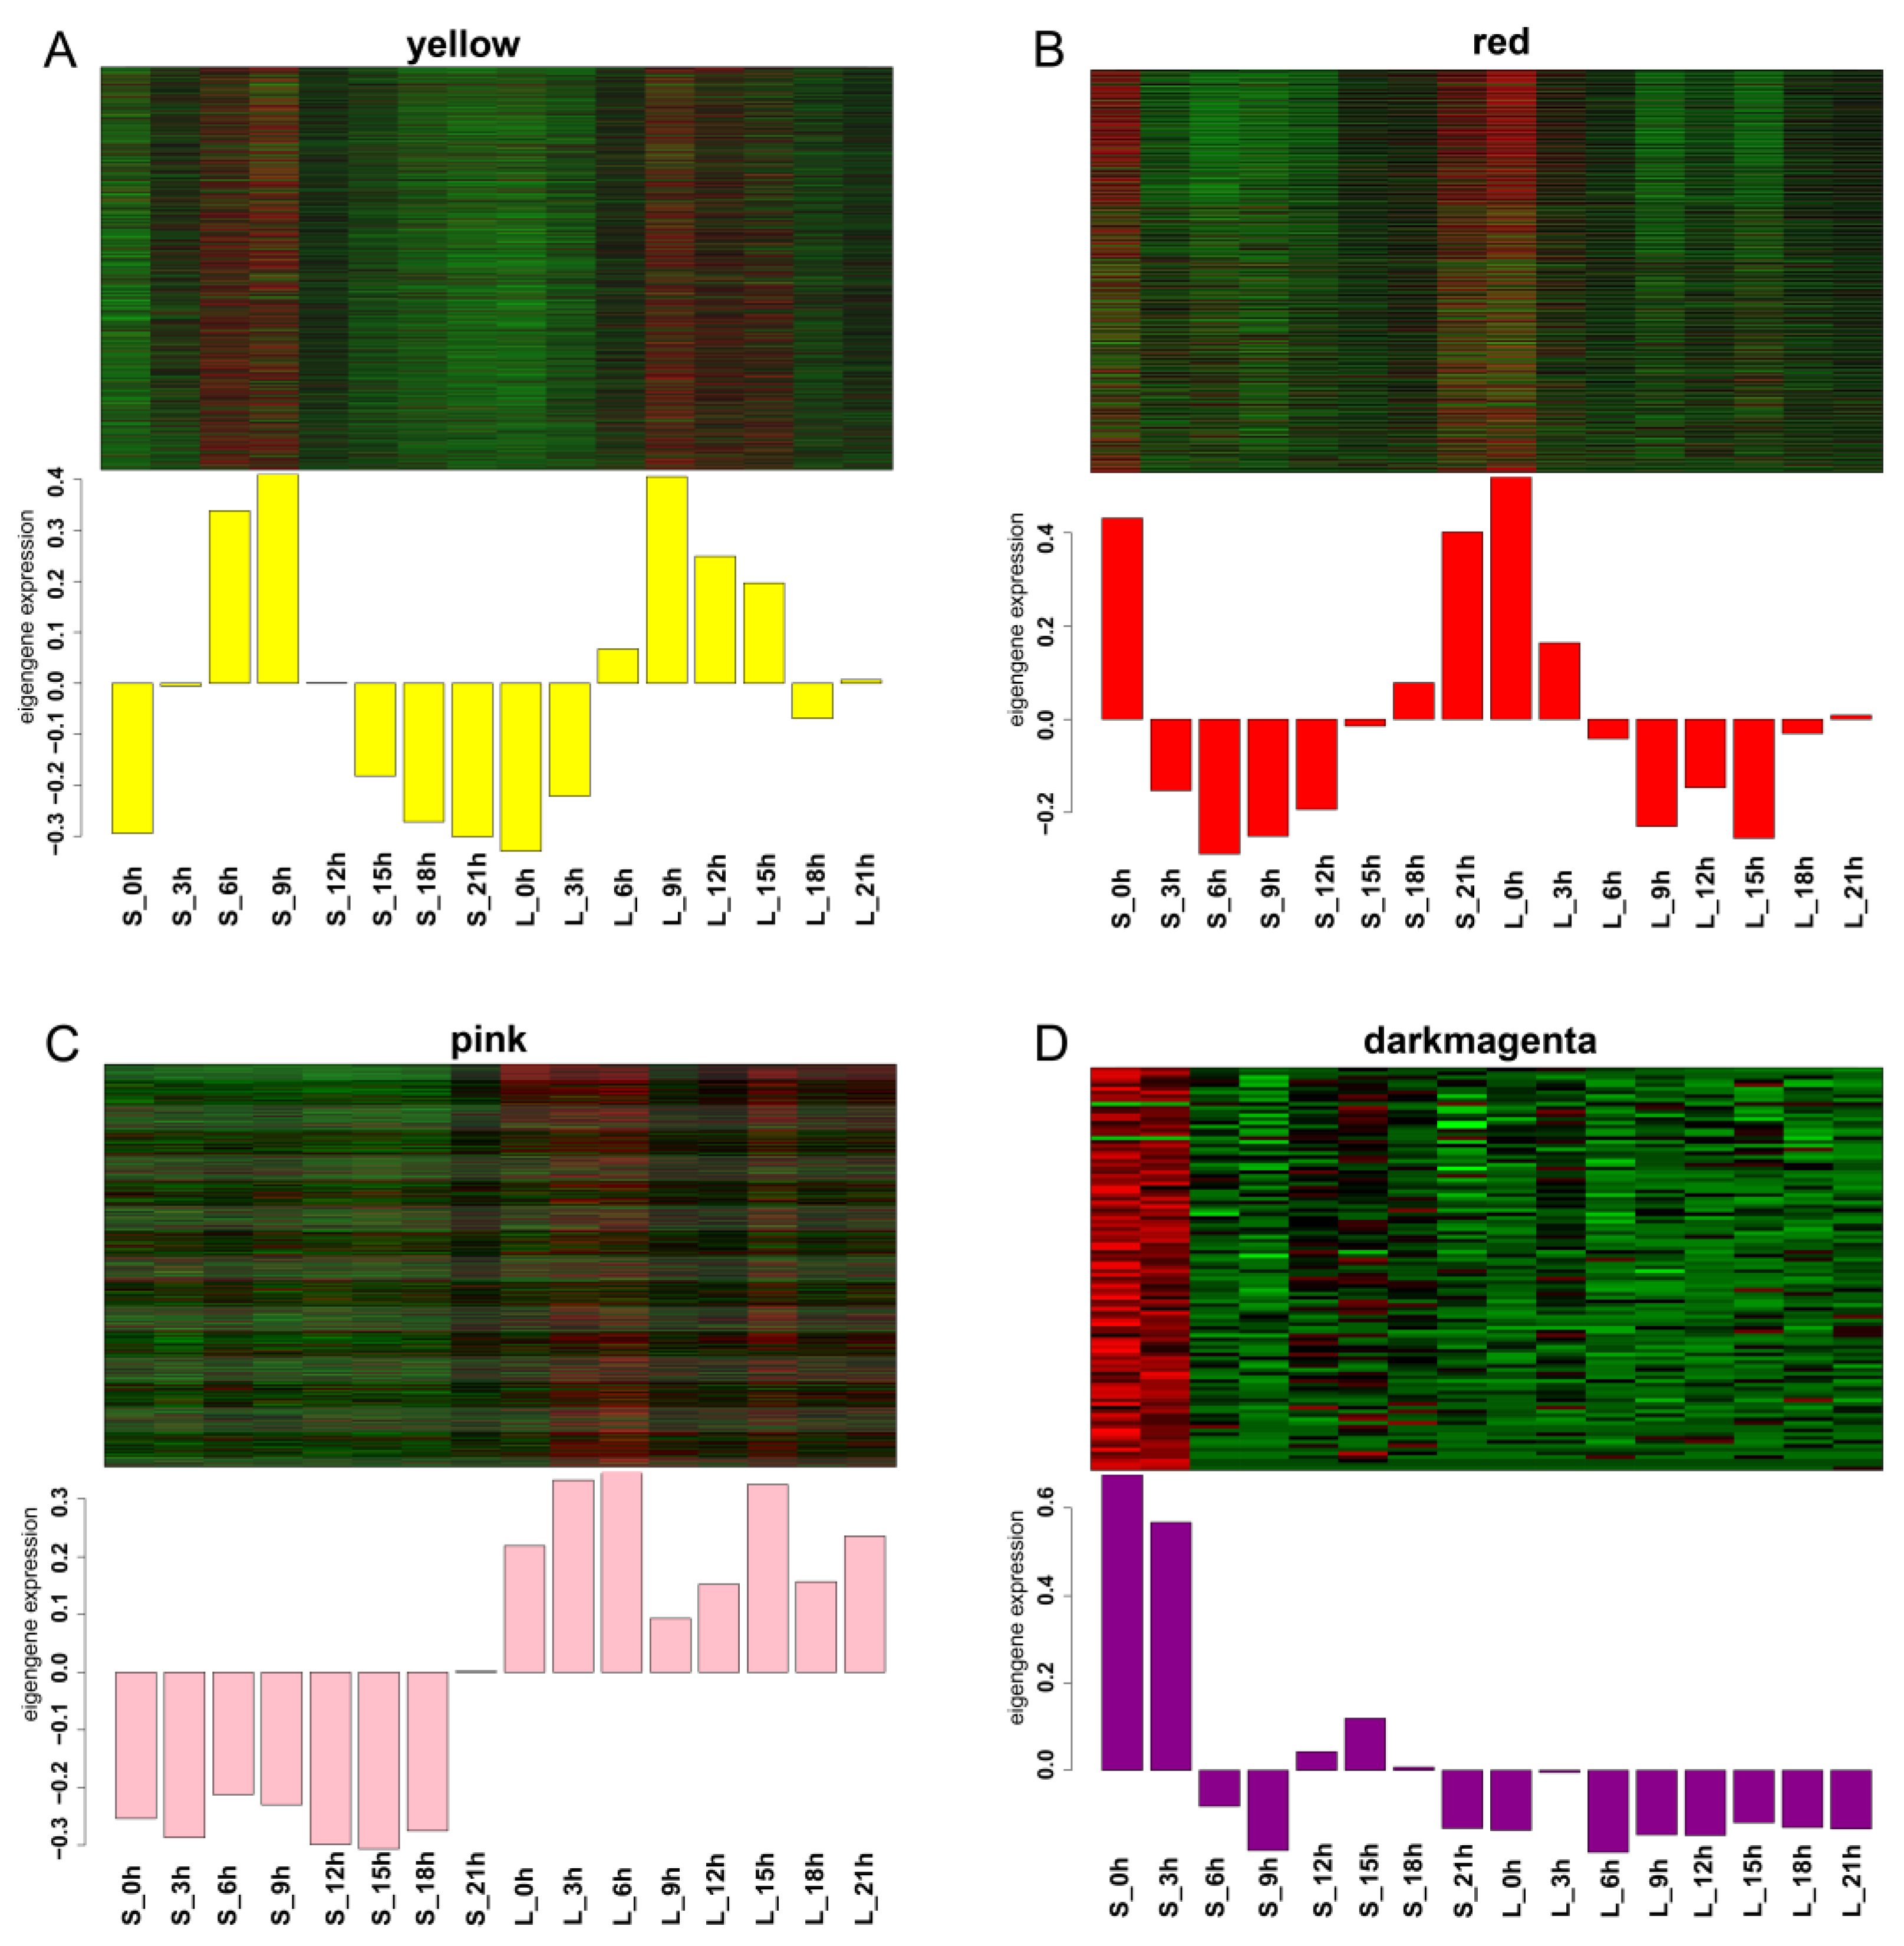
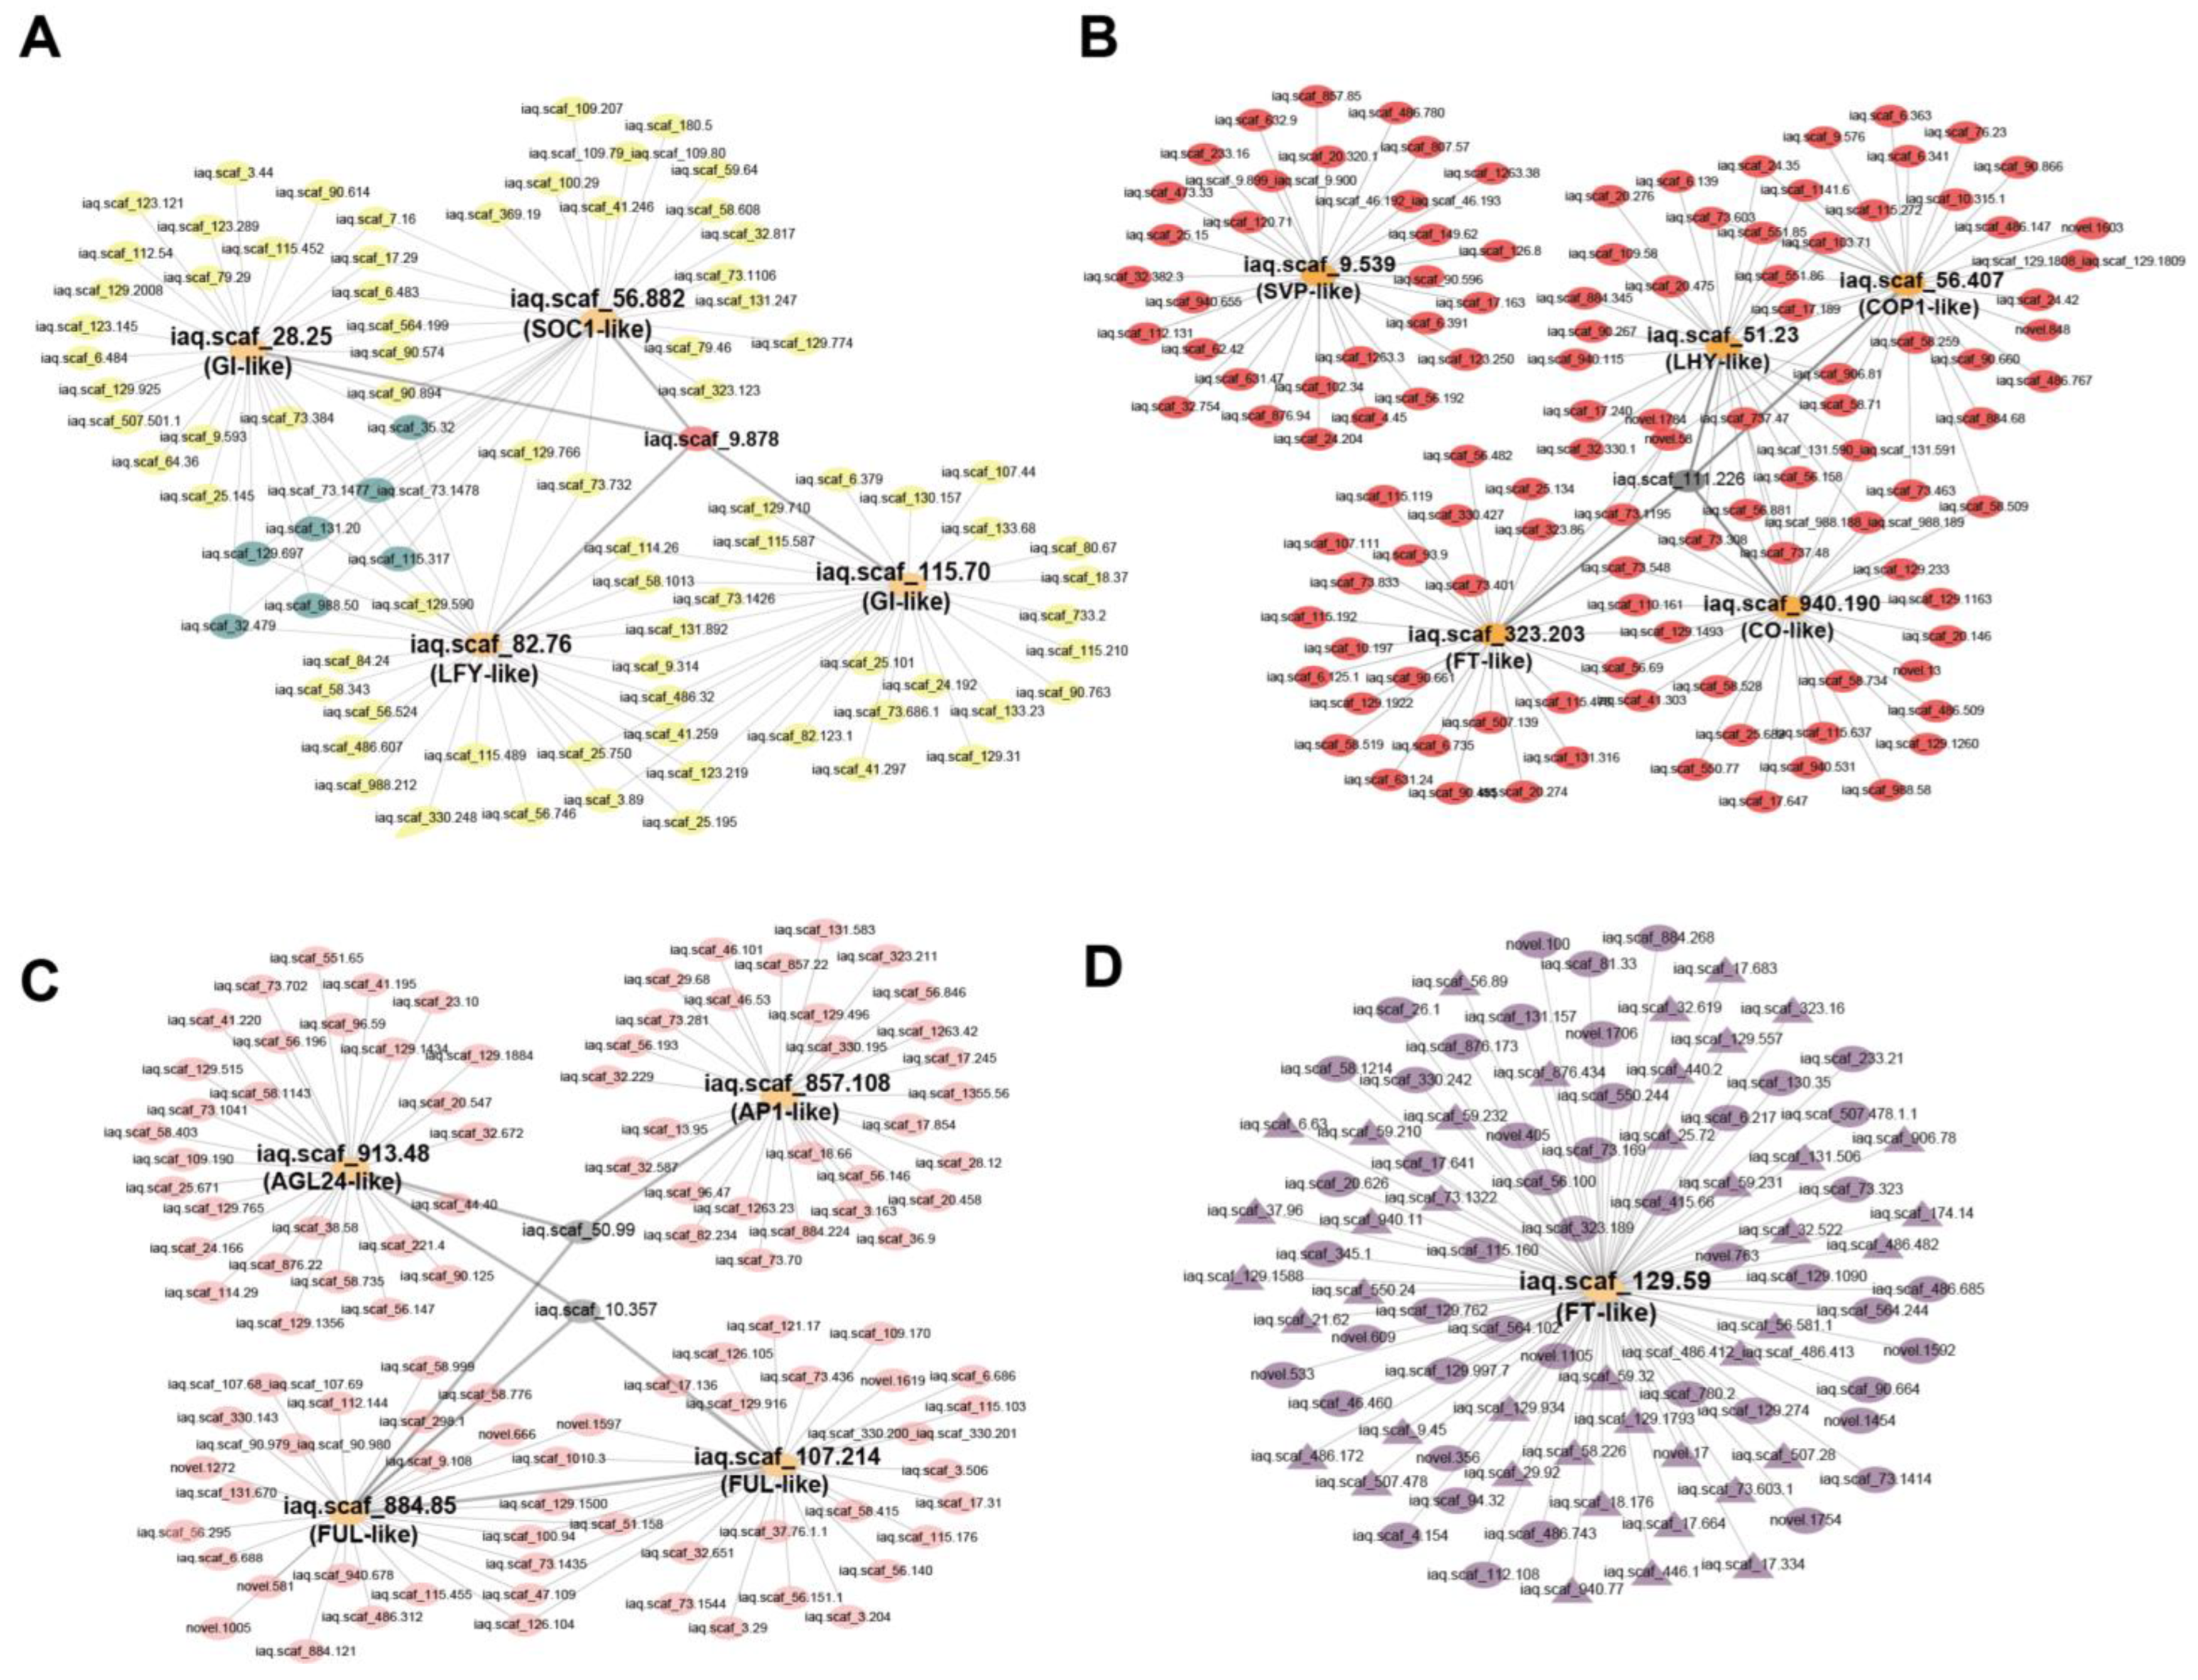
2.6. WGCNA Co-Expression Network Analysis

To analyze the correlations between the expression levels of genes, we divided the genes into different modules, where genes in the same module may have similar biological functions. We performed a weighted gene co-expression network analysis (WGCNA), and the co-expressed genes were clustered into 37 major tree branches, each of which represents a module (labeled with different colors) (Figure 8A).
The analysis of the module–trait relationship revealed that the yellow module was negatively associated with dark time (r = −0.81, p = 1 × 10⁻⁴), while the red module was positively associated with dark time (r = 0.95, p = 2 × 10⁻⁸). The pink module was positively correlated with the short-day treatment (r = 0.93, p = 2 × 10⁻⁷). The FT candidate gene iaq.scaf_129.59 was in the dark-magenta module, and the module had a high positive correlation with S_0h and S_3h (Figure 8B,C).
In addition, heatmaps were drawn to demonstrate the gene expression pattern within each module. The gene expression patterns were opposite between the yellow module and the red module. The genes in the yellow module were highly expressed in light, whereas the genes in the red module had lower expression levels during the day. The length of sunlight was associated with genes in the pink module, and most of the genes were highly expressed under the long-day condition. The dark-magenta-module genes only showed high expression at S_0h and S_3h, which shows that the module genes were stimulated by light, and the expression level increased sharply (Figure 9).
In a module, genes with high connectivity (K for the connectivity of genes within modules) were distinguished as hub genes. In the four modules, the top 20 genes with high K were selected as the hub genes. Additionally, we observed that some transcription factors were among these genes. Six genes belonged to the cytochrome P450 family in the dark-magenta module (Table 1).
To further explore the biological functions of the modules, we completed a KEGG analysis of the genes in the four modules. KEGG analysis revealed that the genes in the yellow module were enriched in lysine degradation, circadian-rhythm–plant, carbon metabolism, and RNA degradation pathways; the iaq.scaf_28.25 (GI-like), iaq.scaf_82.76 (LFY-like), and iaq.scaf_56.882 (SOC1-like) genes were present in this module. In the red module, the genes were significantly enriched in alanine, aspartate, and glutamate metabolism; tyrosine metabolism; and circadian-rhythm–plant pathways. Together, the yellow- and red-module genes were significantly enriched in the circadian-rhythm–plant pathway, which indicated that this pathway was significantly related to the length of light. In the pink module, the genes were greatly enriched in oxidative phosphorylation; ribosome; glycine, serine, and threonine metabolism; tyrosine metabolism; and isoquinoline alkaloid biosynthesis pathways. In the dark-magenta module, the genes were significantly enriched in sulfur metabolism, alpha-linolenic acid metabolism, base excision repair, and galactose metabolism pathways (Figure S4).
There are some flowering-associated genes in these four modules: iaq.scaf_28.25 (GI-like), iaq.scaf_115.70 (GI-like), iaq.scaf_82.76 (LFY-like), and iaq.scaf_56.882 (SOC1-like) in the yellow module; iaq.scaf_56.407 (COP1-like), iaq.scaf_9.539 (SVP-like), iaq.scaf_51.23 (LHY-like), iaq.scaf_323.203 (FT-like), and iaq.scaf_940.190 (CO-like) in the red module; iaq.scaf_913.48 (AGL24-like), iaq.scaf_857.108 (AP1-like), iaq.scaf_107.214 (FUL-like), and iaq.scaf_884.85 (FUL-like) in the pink module; and the iaq.scaf_129.59 (FT-like) gene in the dark-magenta module. To further determine the relationships between flowering-associated genes in the four modules, correlation networks were constructed.
In the yellow module, the co-expression network shows that iaq.scaf_28.25 (GI-like), iaq.scaf_115.70 (GI-like), and iaq.scaf_82.76 (LFY-like) had a strong interaction relationship, with seven genes interacting with these three genes at the same time. As the hub gene, iaq.scaf_9.878 interacted with the four flowering-related genes, and the annotation information showed that this gene belongs to the G6PD transcription factor family (Figure 10A).
In the red module, there were no correlations between iaq.scaf_9.539 (SVP-like) and other flowering-associated genes, suggesting that iaq.scaf_9.539 (SVP-like) plays an independent role in the flowering regulation pathway. iaq.scaf_51.23 (LHY-like), iaq.scaf_940.190 (CO-like), and iaq.scaf_56.407 (COP1-like) had a high correlation; it is speculated that the three genes play a synergistic role in the regulation of flowering. iaq.scaf_111.226 was interrelated with the four flowering-related genes (Figure 10B).
In the pink module, the analysis indicated that a strong interaction exists between iaq.scaf_107.214 (FUL-like) and iaq.scaf_884.85 (FUL-like). Furthermore, iaq.scaf_10.357 and iaq.scaf_50.99 each interact with three flowering-related genes, and it is speculated that they may be involved in flowering regulation (Figure 10C).
In the dark-magenta module, there were a total of 89 genes interacting with iaq.scaf_129.59 (IaFT1), including 41 transcription factors (symbolized by triangles), and 6 genes were correspondingly enriched in diverse KEGG pathways (Figure 10D).

3. Discussion

Flowering is involved in the transition from vegetative growth to reproductive growth and is similarly a crucial trait in agricultural production. The response of A. thaliana flowering to the photoperiod has been studied widely and in great depth, and many genes controlling photoperiodic flowering have been characterized [52,56,57]. In our work, we identified homologs of several critical genes in the photoperiod pathway regulating the flowering time in water spinach.
There is positive and negative feedback regulation between LHY/CCA1 and TOC1 [25,58]. CCA/LHY stimulates PPR7 and PPR9 transcription throughout the day, whereas PPR7 and PPR9 bind to the CC1 promoter region and constrain CCA1 expression [59]. CCA1 and LHY limit the transcription of clock-associated genes; CCA1 and LHY protein levels decline at the end of the day, and their inhibitory action no longer takes place on their target genes, leading to the accumulation of the evening-clock-gene transcripts [15,59]. The evening expression of TOC1 represses GI, which, in turn, triggers TOC1 and forms the evening loop [28,59].
The transcriptome data revealed that the transcript level of iaq.scaf_884.166 (TOC1-like) began to rise after light, whereas the expression levels of iaq.scaf_51.23 (LHY-like) and iaq.scaf_129.1643_iaq.scaf_129.1644 (CCA1-like) gradually decreased. The transcription levels of Ziaq.scaf_51.23 (LHY-like) and iaq.scaf_129.1643_iaq.scaf_129.1644 (CCA1-like) were accompanied by a decrease in the iaq.scaf_884.166 (TOC1-like) expression level in the dark. These outcomes validated the negative regulatory effect of LHY/CCA1 on TOC1 [28]. In addition, LHY and CCA1 also regulate the transcription of GI and FKF1 genes [60]. In our work, there was a negative correlation between iaq.scaf_51.23 (LHY-like), iaq.scaf_129.1643_iaq.scaf_129.1644 (CCA1-like), and iaq.scaf_28.25 (GI-like) based on the transcription levels, which established that LHY/CCA1 inhibited the transcription of GI [60]. LHY/CCA1 accelerated flowering by promoting FT expression and reducing the abundance of SVP [16]. The TOP1 gene was highly expressed at night and suppressed the transcriptional levels of LUX, ELF4, and GI [59], and the transcriptome data confirmed this result. It has been shown that there is a redundant function between the LHY and CCA1 genes [55]. In addition, the lack of CCA1 also affects the regulation of gene expression by phytochromes, suggesting that CCA1 has an independent function [61]. Recent research revealed that the expression of CCA1/LHY was regulated by Brassinosteroids (BRs) [62]. DET1, as an important core transcriptional repression factor, regulates the clock process by interacting with CCA1/LHY target genes [58]. CCA1 and LHY also have the function of coordinating Fe homeostasis in A. thaliana by directly regulating Fe metabolism and the transcription of transport genes [63].
The expression of GI is under the control of the circadian clock and peaks at the end of the day, leading to the optimal formation of the GI–FKF1 complex, which degrades CDF proteins and, in turn, leads to the induction of CO [4,39]. In our study, the expression of GI and FKF1 peaked at the end of the day, and CO accumulated at night, which is consistent with the previous results. The transcriptome data in our studies showed that CO expression was inhibited after light, probably due to CCA1 and LHY positively regulating the expression of CDF1 at dawn and the inhibition of CO by CDFs and FLOWERING BHLH (FBH) [41,64]. Phylogenetic analysis revealed that a member of the CO subgroup was lost in water spinach; whether the gene plays a role in regulating flowering remains to be determined. Day length must reach a threshold in order to promote the stabilization of the CO protein. The CO protein is not degraded and accumulates during the night in A. thaliana [4,64]. The transcriptome data showed that the expression level of iaq.scaf_9.675(IaCO1) was higher during short days and accumulated only on short-day nights, which had a positive effect on plant flowering. Moreover, the CCT domain was deleted in iaq.scaf_9.675 (CO-like). The CCT domain has significant functions in transcriptional regulation and nuclear protein transport. CO undergoes alternative splicing, producing the full-size COα, which is equivalent to the well-known CO protein, and the C-terminally truncated COβ lacking the CCT domain. COβ inhibits COα function by forming heterodimers in photoperiodic flowering [5], though it confirms that the function of CO-like genes lacking the CCT domain could play a role in water spinach. A. thaliana CO is a member of the BBX family with 17 proteins. BBX2 and BBX3 are highly similar to CO and produce only slight effects on photoperiodic flowering. CO contains two B-boxes and one CCT domain required for flowering regulation in A. thaliana [32].
Here, three members from the FT subgroup were identified in water spinach; according to the gene expression level, we infer that iaq.scaf_129.59 performs the role of the FT gene in water spinach. In the meantime, in our study, the abundance of AP1 and LFY was very low, and FUL was highly expressed in the short-day condition; these would be the critical genes for flowering in water spinach. SVP plays a crucial function in directly controlling SOC1 transcription, while FT expression in the leaf is slightly modulated by SVP [53]. In our work, the transcriptome data of water spinach treated at different times were examined by using WGCNA to construct the co-expression network of flowering-associated genes. The co-expressed genes were separated into 37 modules via hierarchical average linkage cluster analysis.
Here, we found that the red module and yellow module have positive and negative correlations with the darkness duration, respectively. These genes are mainly enriched in the circadian-rhythm–plant pathway, according to KEGG analysis; these genes are also enriched in the carbon metabolism and amino acid metabolism pathways, indicating that the circadian clocks are strongly associated with plant growth [13,65].
A previous study reported that GI mediates the circadian clock and the three floral integration genes FT, SOC1, and LFY to control photoperiodic flowering [66]. In our study, there was a strong correlation between the GI, SOC1, and LFY genes, which further elucidates that GI has a regulatory impact on SOC1 and LFY. We observed that the transcription level of GI reaches its peak at about 8 hours after dawn, which is in line with a previous study [67]. The gene co-expression network showed that the cytochrome P450 transcription factor family is closely associated with iaq.scaf_129.59 (FT-LIKE1). It is shown that the P450 gene family is involved in the regulation of FT-mediated flowering pathways, which needs to be analyzed in future studies.

4. Materials and Methods

4.1. Plant Materials and Sampling

In this study, the water spinach germplasm HNUWS004 (planted at Hainan University, Haikou, China) was used as material and propagated using the hydroponic method. The plants were treated with short-day and long-day conditions in separate growth chamber incubators. During the whole experiment, the long-day treatment condition was 16 h light/8 h dark (28 °C), and the short-day treatment condition was 8 h light/16 h dark (28 °C). We separated 24 h into 8 different time points and collected samples every 3 h. Under the long-day condition, the time points were as follows: light 0 h (L_0h), light 3 h (L_3h), light 6 h (L_6h), light 9 h (L_9h), light 12 h (L_12h), light 15 h (L_15h), darkness 2 h (L_18 h), darkness 5 h (L_21h). Under the short-day condition, the time points were the following: light 0 h (S_0h), light 3 h (S_3h), light 6 h (S_6h), darkness 1 h (S_9h), darkness 4 h (S_12h), darkness 7 h (S_15h), darkness 10 h (S_18h), darkness 13 h (S_21h). After 3 weeks, as the plants reached a length of about 30 cm, fresh leaf samples (from the top) were collected from three plant replicates at 8 time points during the day and then stored in the refrigerator at −80 °C for subsequent RNA extraction.

4.2. RNA Quantification and Qualification

Total RNA was extracted from the leaves of water spinach, and the RNA concentration and integrity were evaluated using Bioanalyzer 2100 equipment (Agilent Technologies, Santa Clara, CA, USA). Using an Illumina NovaSeq platform, the libraries were sequenced, generating 150 bp paired-end reads. Low-quality reads, reads containing poly-N, and reads containing adapters were eliminated from the raw data to produce high-quality reads. Clean reads were aligned to the reference genome using Hisat2 (USA, CCB at JHU, v2.0.5). FPKM (expected number of fragments per kilobase of transcript sequence per million base pairs sequenced of each gene) was determined based on the length of the gene and the read count mapped to this gene [68].

4.3. Differential Expression Gene Analysis

Differential expression analysis between samples was finalized using the DESeq2 R package (1.20.0). The subsequent p-values were adjusted using Benjamini and Hochberg’s method. Genes with an adjusted p-value < 0.05 initiated by DESeq2 were assigned as differentially expressed and subjected to enrichment analysis [69].

4.4. GO and KEGG Enrichment Analysis

GO (Gene Ontology) is a comprehensive database for unfolding gene functions, which can be divided into three categories: biological process (BP), cellular component (CC), and molecular function (MF). GO and KEGG pathway enrichment analyses were performed using the cluster Profiler R package [70,71].

4.5. Weighted Gene Co-Expression Network Analysis (WGCNA)

WGCNA is a technique that can be used to find genes that unveil similar patterns of expression and potentially have functions in specific biological processes [72]. A gene co-expression network was built using the WGCNA package in R, with R2 > 0.8 as the criterion. A topological overlap matrix was calculated by comparing the connectivity similarities of each pair of probes among all genes. Furthermore, an eigen-gene network was assembled to signify the relationships among the modules. The networks were visualized by using Cytoscape (v.3.8.1) [73].

4.6. Sequence Alignment and Phylogenetic Tree Construction

The amino acid sequence of the A. thaliana flowering gene was downloaded from NCBI, and Bioedit software (V7.2.5) was used for the homologous gene alignment of flowering-related genes in water spinach, I. triloba, I. trifida, I. nil, and C.australis. The phylogenetic tree was constructed using the MEGA 11 method with 1000 bootstrap replicates [4].

4.7. Real-Time Quantitative PCR Analysis

Real-time quantitative PCR was used to test the reliability of the RNA-seq data. We selected 10 flowering-related genes for RT-qPCR validation. RNA was isolated from leaf samples from water spinach and transcribed into cDNA. GAPDH was used as an internal reference gene, and primers were designed based on the NCBI database. Three technical replicates were performed for each sample. Supplementary Table S1 contains gene information for qRT-PCR analysis. The related quantitative data were calculated according to the 2−∆∆CT method [73].
ΔCT(test) = CT(target, test) − CT(ref, test)
ΔCT(calibrator) = CT(target, calibrator) − CT(ref, calibrator)
ΔΔCT = ΔCT(test) − ΔCT(calibrator)

5. Conclusions

In sum, we performed a comprehensive transcriptome analysis of water spinach at different time points under short-day and long-day conditions, explored some flowering-associated genes, and analyzed their expression levels. Furthermore, the co-expression networks of flowering-associated key genes were generated using WGCNA. Overall, our results reveal the complex flowering regulation network of water spinach and lay the biological foundation for the regulation of water spinach flowering, which could be utilized in other horticulture plants.

Supplementary Materials

The following supporting information can be downloaded at https://www.mdpi.com/article/10.3390/ijms25031420/s1.

Author Contributions

Conceptualization, X.W. and G.Z.; methodology, X.W. and Y.H.; software, X.W. and S.C.; validation, X.W. and H.S.; formal analysis, X.W.; investigation, X.W. and Y.H.; resources, Z.W. and G.Z.; data curation, X.W., H.S. and S.C.; writing—original draft, X.W.; writing—review and editing, X.W., Y.H., M.A.A. and Z.W.; visualization, X.W., Y.H. and S.C.; supervision, G.Z.; funding acquisition, Z.W. All authors have read and agreed to the published version of the manuscript.

Funding

This work was supported by the National Natural Science Foundation of China (31960084), the Natural Science Foundation of Hainan Province (320RC495), and the National Key Research and Development Program of China (2018YFD1000800).

Institutional Review Board Statement

Not applicable.

Informed Consent Statement

Not applicable.

Data Availability Statement

The original data presented in this study are publicly available. RNA-seq data were deposited at the NCBI under PRJNA1047901.

Conflicts of Interest

The authors declare no conflicts of interest.

References

  1. Malalavidhane, T.S.; Wickramasinghe, S.M.; Jansz, E.R. Oral hypoglycaemic activity of Ipomoea aquatica. J. Ethnopharmacol. 2000, 72, 293–298. [Google Scholar] [CrossRef] [PubMed]
  2. Umar, K.J.; Hassan, L.G.; Dangoggo, S.M. Nutritional Composition of Water Spinach (Ipomoea aquatica Forsk.) Leaves. J. Appl. Sci. 2007, 7, 803–809. [Google Scholar] [CrossRef]
  3. Furukawa, K.; Fujita, M. Advanced Treatment and Food Production by Hydroponic Type Wastewater Treatment Plant. Water Sci. Technol. 1993, 28, 219–228. [Google Scholar] [CrossRef]
  4. Shim, J.S.; Imaizumi, T. Circadian clock and photoperiodic response in Arabidopsis: From seasonal flowering to redox homeostasis. Biochemistry 2015, 54, 157–170. [Google Scholar] [CrossRef] [PubMed]
  5. Gil, K.E.; Park, M.J.; Lee, H.J. Alternative splicing provides a proactive mechanism for the diurnal CONSTANS dynamics in Arabidopsis photoperiodic flowering. Plant J. 2017, 89, 128–140. [Google Scholar] [CrossRef]
  6. Cho, L.H.; Yoon, J.; An, G. The control of flowering time by environmental factors. Plant J. 2017, 90, 708–719. [Google Scholar] [CrossRef]
  7. Srikanth, A.; Schmid, M. Regulation of flowering time:all roads lead to Rome. Cell Mol. Life Sci. 2011, 68, 2013–2037. [Google Scholar] [CrossRef]
  8. Quiroz, S.; Yustis, J.C.; Chávez-Hernández, E.C. Beyond the Genetic Pathways, Flowering Regulation Complexity in Arabidopsis thaliana. Int. J. Mol. Sci. 2021, 22, 5716. [Google Scholar] [CrossRef]
  9. Yusuke, N.; Shogo, I.; Norihito, N. Genetic Linkages of the Circadian Clock-Associated Genes, TOC1, CCA1 and LHY, in the Photoperiodic Control of Flowering Time in Arabidopsis thaliana. Plant Cell Physiol. 2007, 7, 925–937. [Google Scholar]
  10. Laubinger, S.; Marchal, V.; Le Gourrierec, J. Arabidopsis SPA proteins regulate photoperiodic flowering and interact with the floral inducer CONSTANS to regulate its stability. Development 2006, 133, 3213–3222. [Google Scholar] [CrossRef]
  11. D’Aloia, M.; Tamseddak, K.; Bonhomme, D. Gene activation cascade triggered by a single photoperiodic cycle inducing flowering in Sinapis alba. Plant J. 2009, 59, 962–973. [Google Scholar] [CrossRef]
  12. Lin, C. Photoreceptors and Regulation of Flowering Time. Plant Physiol. 2000, 123, 39–50. [Google Scholar] [CrossRef]
  13. Farré, E.M.; Weise, S.E. The interactions between the circadian clock and primary metabolism. Curr. Opin. Plant Biol. 2012, 15, 293–300. [Google Scholar] [CrossRef]
  14. Endo, M.; Araki, T.; Nagatani, A. Tissue-specific regulation of flowering by photoreceptors. Cell. Mol. Life Sci. 2016, 73, 829–839. [Google Scholar] [CrossRef]
  15. Nakamichi, N. The Transcriptional Network in the Arabidopsis Circadian Clock System. Genes 2020, 11, 1284. [Google Scholar] [CrossRef]
  16. Fujiwara, S.; Oda, A.; Yoshida, R. Circadian Clock Proteins LHY and CCA1 Regulate SVP Protein Accumulation to Control Flowering in Arabidopsis. Plant Cell. 2008, 20, 2960–2971. [Google Scholar] [CrossRef] [PubMed]
  17. Atamian, H.S.; Harmer, S.L. Circadian regulation of hormone signaling and plant physiology. Plant Mol. Biol. 2016, 91, 691–702. [Google Scholar] [CrossRef] [PubMed]
  18. Hernando, C.E.; Romanowski, A.; Yanovsky, M.J. Transcriptional and post-transcriptional control of the plant circadian gene regulatory network. Biochimica et biophysica acta. Gene Regul. Mech. 2017, 1860, 84–94. [Google Scholar]
  19. Shim, J.S.; Kubota, A.; Imaizumi, T. Circadian Clock and Photoperiodic Flowering in Arabidopsis: CONSTANS Is a Hub for Signal Integration. Plant Physiol. 2017, 173, 5–15. [Google Scholar] [CrossRef]
  20. Mizoguchi, T.; Wheatley, K.; Hanzawa, Y. LHY and CCA1 are partially redundant genes required to maintain circadian rhythms in Arabidopsis. Dev Cell. 2002, 2, 629–641. [Google Scholar] [CrossRef]
  21. Schaffer, R.; Ramsay, N.; Samach, A. The late elongated hypocotyl mutation of Arabidopsis disrupts circadian rhythms and the photoperiodic control of flowering. Cell 1998, 93, 1219–1229. [Google Scholar] [CrossRef] [PubMed]
  22. Doyle, M.R.; Davis, S.J.; Bastow, R.M. The ELF4 gene controls circadian rhythms and flowering time in Arabidopsis thaliana. Nature 2002, 419, 74–77. [Google Scholar] [CrossRef] [PubMed]
  23. Lin, K.; Zhao, H.; Gan, S. Arabidopsis ELF4-like proteins EFL1 and EFL3 influence flowering time. Gene 2019, 700, 131–138. [Google Scholar] [CrossRef] [PubMed]
  24. Gendron, J.M.; Pruneda-Paz, J.L.; Doherty, C.J. Arabidopsis circadian clock protein, TOC1, is a DNA-binding transcription factor. Proc. Nat. Acad. Sci. USA 2012, 109, 3167–3172. [Google Scholar] [CrossRef] [PubMed]
  25. Alabadí, D.; Oyama, T.; Yanovsky, M. Reciprocal Regulation between TOC1 and LHY/CCA1 within the Arabidopsis circadian. Clock. Sci. 2001, 293, 880–883. [Google Scholar] [CrossRef] [PubMed]
  26. Ding, Z.; Doyle, M.R.; Amasino, R.M. A Complex Genetic Interaction between Arabidopsis thaliana TOC1 and CCA1/LHY in Driving the Circadian Clock and in Output Regulation. Genetics 2007, 176, 1501–1510. [Google Scholar] [CrossRef] [PubMed]
  27. Kim, J.Y.; Song, H.R. Light-regulated translation mediates gated induction of the Arabidopsis clock protein LHY. EMBO J. 2014, 22, 935–944. [Google Scholar] [CrossRef]
  28. Anwer, M.U.; Davis, A.; Davis, S.J. Photoperiod sensing of the circadian clock is controlled by EARLY FLOWERING 3 and GIGANTEA. Plant J. 2020, 101, 1397–1410. [Google Scholar] [CrossRef]
  29. Suárez-López, P.; Wheatley, K.; Robson, F. CONSTANS mediates between the circadian clock and the control of flowering in Arabidopsis. Nature 2001, 410, 1116–1120. [Google Scholar] [CrossRef]
  30. Samach, A.; Onouchi, H.; Gold, S.E. Distinct Roles of CONSTANS Target Genes in Reproductive Development of Arabidopsis. Science 2000, 288, 1613–1616. [Google Scholar] [CrossRef]
  31. Yoo, S.K.; Chung, K.S.; Kim, J. CONSTANS Activates SUPPRESSOR OF OVEREXPRESSION OF CONSTANS 1 through FLOWERING LOCUS T to Promote Flowering in Arabidopsis. Plant Physiol. 2005, 139, 770–778. [Google Scholar] [CrossRef] [PubMed]
  32. Gangappa, S.N.; Botto, J.F. The BBX family of plant transcription factors. Trends Plant Sci. 2014, 19, 460–470. [Google Scholar] [CrossRef]
  33. Wu, F.; Price, B.W.; Haider, W. Functional and evolutionary characterization of the CONSTANS gene family in short-day photoperiodic flowering in soybean. PLoS ONE 2014, 9, e85754. [Google Scholar] [CrossRef] [PubMed]
  34. Zhang, Q.; Dong, J.; Wang, Z. Mungbean VrCOL1 regulates flowering time under short-day conditions in Arabidopsis. Plant Cell Tissue Organ Cult. 2022, 148, 599–608. [Google Scholar] [CrossRef]
  35. Fornara, F.; Panigrahi, K.C.; Gissot, L. Arabidopsis DOF transcription factors act redundantly to reduce CONSTANS expression and are essential for a photoperiodic flowering response. Dev. Cell. 2009, 17, 75–86. [Google Scholar] [CrossRef] [PubMed]
  36. Imaizumi, T.; Schultz, T.F.; Harmon, F.G. FKF1 F-box protein mediates cyclic degradation of a repressor of CONSTANS in Arabidopsis. Science 2005, 309, 293–297. [Google Scholar] [CrossRef] [PubMed]
  37. Goralogia, G.S.; Liu, T.K.; Zhao, L. CYCLING DOF FACTOR 1 represses transcription through the TOPLESS co-repressor to control photoperiodic flowering in Arabidopsis. Plant J. 2017, 92, 244–262. [Google Scholar] [CrossRef] [PubMed]
  38. Imaizumi, T.; Tran, H.G.; Swartz, T.E. FKF1 is essential for photoperiodic-specific light signalling in Arabidopsis. Nature 2003, 426, 302–306. [Google Scholar] [CrossRef]
  39. Sawa, M.; Nusinow, D.A.; Kay, S.A. FKF1 and GIGANTEA complex formation is required for day-length measurement in Arabidopsis. Science 2007, 318, 261–265. [Google Scholar] [CrossRef]
  40. Song, Y.H.; Estrada, D.A.; Johnson, R.S. Distinct roles of FKF1, Gigantea, and Zeitlupe proteins in the regulation of Constans stability in Arabidopsis photoperiodic flowering. Proc. Nat. Acad. Sci. USA 2014, 111, 17672–17677. [Google Scholar] [CrossRef]
  41. Ito, S.; Song, Y.H.; Josephson-Day, A.R. FLOWERING BHLH transcriptional activators control expression of the photoperiodic flowering regulator CONSTANS in Arabidopsis. Proc. Nat. Acad. Sci. USA 2012, 109, 3582–3587. [Google Scholar] [CrossRef] [PubMed]
  42. Liu, H.; Yu, X.; Li, K. Photoexcited CRY2 interacts with CIB1 to regulate transcription and floral initiation in Arabidopsis. Science 2008, 322, 1535–1539. [Google Scholar] [CrossRef] [PubMed]
  43. Sarid-Krebs, L.; Panigrahi, K.C.; Fornara, F. Phosphorylation of CONSTANS and its COP1-dependent degradation during photoperiodic flowering of Arabidopsis. Plant J. 2015, 84, 451–463. [Google Scholar] [CrossRef]
  44. Ordoñez-Herrera, N.; Trimborn, L.; Menje, M. The Transcription Factor COL12 Is a Substrate of the COP1/SPA E3 Ligase and Regulates Flowering Time and Plant Architecture. Plant Physiol. 2018, 176, 1327–1340. [Google Scholar] [CrossRef] [PubMed]
  45. Ponnu, J.; Hoecker, U. Illuminating the COP1/SPA Ubiquitin Ligase: Fresh Insights into Its Structure and Functions during Plant Photomorphogenesis. Front. Plant Sci. 2021, 12, 662793. [Google Scholar] [CrossRef] [PubMed]
  46. Song, Y.H.; Smith, R.W.; To, B.J. FKF1 conveys timing information for CONSTANS stabilization in photoperiodic flowering. Science 2012, 336, 1045–1049. [Google Scholar] [CrossRef] [PubMed]
  47. Tiwari, S.B.; Shen, Y.; Chang, H.C. The flowering time regulator CONSTANS is recruited to the FLOWERING LOCUS T promoter via a unique cis-element. New Phytol. 2010, 187, 57–66. [Google Scholar] [CrossRef] [PubMed]
  48. Yamaguchi, A.; Kobayashi, Y.; Goto, K. TWIN SISTER OF FT (TSF) acts as a floral pathway integrator redundantly with FT. Plant Cell Physiol. 2005, 46, 1175–1189. [Google Scholar] [CrossRef]
  49. Yoo, S.Y.; Kardailsky, I.; Lee, J.S. Acceleration of flowering by overexpression of MFT (MOTHER OF FT AND TFL1). Mol. Cells 2004, 17, 95–101. [Google Scholar] [CrossRef]
  50. Liu, L.J.; Zhang, Y.C.; Li, Q.H. COP1-mediated ubiquitination of CONSTANS is implicated in cryptochrome regulation of flowering in Arabidopsis. Plant Cell. 2008, 20, 292–306. [Google Scholar] [CrossRef]
  51. Liu, Y.; Li, X.; Ma, D. CIB1 and CO interact to mediate CRY2-dependent regulation of flowering. EMBO Rep. 2018, 19, e45762. [Google Scholar] [CrossRef] [PubMed]
  52. Sawa, M.; Kay, S.A. GIGANTEA directly activates Flowering Locus T in Arabidopsis thaliana. Proc. Nat. Acad. Sci. USA 2011, 108, 11698–11703. [Google Scholar] [CrossRef] [PubMed]
  53. Li, D.; Liu, C.; Shen, L. A Repressor Complex Governs the Integration of Flowering Signals in Arabidopsis. Dev. Cell. 2008, 15, 110–120. [Google Scholar] [CrossRef] [PubMed]
  54. Collani, S.; Neumann, M.; Yant, L. FT Modulates Genome-Wide DNA-Binding of the bZIP Transcription Factor FD. Plant Physiol. 2019, 180, 367–380. [Google Scholar] [CrossRef]
  55. Abe, M.; Kosaka, S.; Shibuta, M. Transient activity of the florigen complex during the floral transition in Arabidopsis thaliana. Development 2019, 146, 171504. [Google Scholar] [CrossRef]
  56. Bouché, F.; Lobet, G.; Tocquin, P. FLOR-ID: An interactive database of flowering-time gene networks in Arabidopsis thaliana. Nucleic Acids Res. 2015, 44, D1167–D1171. [Google Scholar] [CrossRef]
  57. Teper-Bamnolker, P.; Samach, A. The flowering integrator FT regulates SEPALLATA3 and FRUITFULL accumulation in Arabidopsis leaves. Plant Cell. 2005, 17, 2661–2675. [Google Scholar] [CrossRef]
  58. Lau, O.S.; Huang, X.; Charron, J.B. Interaction of Arabidopsis DET1 with CCA1 and LHY in mediating transcriptional repression in the plant circadian clock. Mol. Cell. 2011, 43, 703–712. [Google Scholar] [CrossRef]
  59. Huang, W.; Pérez-García, P.; Pokhilko, A. Mapping the core of the Arabidopsis circadian clock defines the network structure of the oscillator. Science 2012, 336, 75–79. [Google Scholar] [CrossRef]
  60. Nakamichi, N.; Kita, M.; Niinuma, K. Arabidopsis clock-associated pseudo-response regulators PRR9, PRR7 and PRR5 coordinately and positively regulate flowering time through the canonical CONSTANS-dependent photoperiodic pathway. Plant Cell Physiol. 2007, 48, 822–832. [Google Scholar] [CrossRef]
  61. Green, R.M.; Tobin, E.M. Loss of the circadian clock-associated protein 1 in Arabidopsis results in altered clock-regulated gene expression. Proc. Nat. Acad. Sci. USA 1999, 96, 4176–4179. [Google Scholar] [CrossRef] [PubMed]
  62. Lee, H.G.; Won, J.H.; Choi, Y.R. Brassinosteroids Regulate Circadian Oscillation via the BES1/TPL-CCA1/LHY Module in Arabidopsis thaliana. Science 2020, 23, 101528. [Google Scholar]
  63. Xu, G.; Jiang, Z.; Wang, H. The central circadian clock proteins CCA1 and LHY regulate iron homeostasis in Arabidopsis. J. Integr. Plant Biol. 2019, 61, 168–181. [Google Scholar] [CrossRef] [PubMed]
  64. Teixeira, R.T. Distinct Responses to Light in Plants. Plants 2020, 9, 894. [Google Scholar] [CrossRef] [PubMed]
  65. Müller, L.M.; von Korff, M.; Davis, S.J. Connections between circadian clocks and carbon metabolism reveal species-specific effects on growth control. J. Exp. Bot. 2014, 65, 2915–2923. [Google Scholar] [CrossRef] [PubMed]
  66. Fujiwara, S.; Nakagawa, M.; Kamada, H. Circadian clock components in Arabidopsis III. LHY/CCA1/GI in regulating the floral integrator genes LFY/SOC1/FT to control flowering time and shoot architecture. Plant Biotechnol. 2005, 22, 327–331. [Google Scholar] [CrossRef]
  67. Fowler, S.; Lee, K.; Onouchi, H. GIGANTEA: A circadian clock-controlled gene that regulates photoperiodic flowering in Arabidopsis and encodes a protein with several possible membrane-spanning domains. EMBO J. 1999, 18, 4679–4688. [Google Scholar] [CrossRef] [PubMed]
  68. Kim, D.; Paggi, J.M.; Park, C.; Bennett, C.; Salzberg, S.L. Graph-based genome alignment and genotyping with HISAT2 and HISAT-genotype. Nat. Biotechnol. 2019, 37, 907–915. [Google Scholar] [CrossRef]
  69. Love, M.I.; Huber, W.; Anders, S. Moderated estimation of fold change and dispersion for RNA-seq data with DESeq2. Genome Biol. 2014, 15, 1–21. [Google Scholar] [CrossRef]
  70. Young, M.D.; Wakefield, M.J.; Smyth, G.K.; Oshlack, A. Gene ontology analysis for RNA-seq: Accounting for selection bias. Genome Biol. 2010, 11, 1–12. [Google Scholar] [CrossRef]
  71. Kanehisa, M.; Goto, S. KEGG: Kyoto encyclopedia of genes and genomes. Nucleic Acids Res. 2000, 28, 27–30. [Google Scholar] [CrossRef] [PubMed]
  72. Langfelder, P.; Horvath, S. WGCNA: An R package for weighted correlation network analysis. BMC Bioinform. 2008, 9, 1–13. [Google Scholar] [CrossRef] [PubMed]
  73. Tamura, K.; Stecher, G.; Kumar, S. MEGA11: Molecular evolutionary genetics analysis version 11. Mol. Biol. Evol. 2021, 38, 3022–3027. [Google Scholar] [CrossRef] [PubMed]
Figure 1. GO and KEGG enrichment analysis of differentially expressed genes in water spinach under short-day and long-day conditions: (A) volcano plot indicating the DEGs under short-day and long-day conditions; (B) KEGG pathway enrichment of photoperiod-related genes; (C) GO functional enrichment of photoperiod-related genes. Three main GO categories are summarized: BP, CC, and MF. BP, biological process; CC, cellular component; MF, molecular function. The number of DEGs is shown on the bar.
Ijms 25 01420 g001
Figure 2. (A): Venn diagram representation of DEGs in long-day and short-day conditions; (B): KEGG enrichment analysis of 5355 circadian-rhythm-related genes; (C): Venn diagram representation of light-induced genes and dark-induced genes; (D): Venn diagram representation of photoperiod-related genes and circadian-rhythm-related genes.
Ijms 25 01420 g002
Figure 3. Phylogenetic analysis and transcript level of CCA1 (A), LHY (B), and TOC1 (C) in water spinach. S indicates short day; L indicates long day.
Ijms 25 01420 g003
Figure 4. Simplified photoperiod pathway controlling flowering time. Numbers in blue, green, yellow, purple, red, and white represent copy numbers in A. thaliana, water spinach, I. triloba, I. trifida, I. nil, and C. australis, respectively. Arrows and T-ends represent the promotion and inhibition of gene expression, respectively.
Ijms 25 01420 g004
Figure 5. Phylogenetic analysis (A) and transcript level (B) of GI in water spinach. S indicates a short day; L indicates a long day. Results of transcriptome analysis during the different time courses are shown.
Ijms 25 01420 g005
Figure 6. (A): Phylogenetic analysis and domain prediction of the CO subgroup members; (B): alignment of iaq.scaf_9.675 (IaCO1) and its ortholog XM_019330139.1; (C): synteny analysis between water spinach orthologs and the I. nil genome containing XR_002055520 encoding CO-like; (D): transcript level of CO-like genes in water spinach; (E): relative expression of iaq.scaf_9.675. S indicates short day; L indicates long day.
Ijms 25 01420 g006
Figure 7. (A): Phylogenetic analysis of FT/FTL1 gene family; (B): phylogenetic analysis of the FT subgroup members; (C): transcript levels of FT-like genes in water spinach; (D): multiple sequence alignment based on amino acid sequences. S indicates short day; L indicates long day. * asterisk in the middle of the figure representing 10 amino acids, which are 10, 30, and 50 respectively.
Ijms 25 01420 g007
Figure 8. Gene co-expression network analysis by WGCNA (A): hierarchical cluster of 37 modules of co-expressed genes; (B): module–trait relationship heatmap for different traits and modules; (C): module–sample relationship heatmap. S indicates short day; L indicates long day.
Ijms 25 01420 g008
Figure 9. Heatmap of genes in the four modules. (A): Yellow module; (B): red module; (C): pink module; (D): dark-magenta module. S indicates short day; L indicates long day.
Ijms 25 01420 g009
Figure 10. Co-expression network analysis of the flowering-associated genes in the four modules. (Ovals represent genes, and triangles represent transcription factors.) (A): Yellow module; (B): red module; (C): pink module; (D): dark magenta module. S specifies a short day; L indicates a long day.
Ijms 25 01420 g010
Table 1. Hub gene transcription factor information in four modules.
Gene IDModuleTF Family
iaq.scaf_90.574yellowBTB
iaq.scaf_605.27yellowHist_deacetyl
iaq.scaf_20.597yellowPribosyltran
iaq.scaf_90.957yellowRRM_1
iaq.scaf_32.479yellow2-Hacid_dh_C
iaq.scaf_9.878yellowG6PD_C
iaq.scaf_115.452yellowPkinase
iaq.scaf_107.111redPkinase_Tyr
iaq.scaf_507.139redDHBP_synthase
iaq.scaf_129.1922redAuxin_resp
iaq.scaf_330.427redAminotran_1_2
iaq.scaf_90.203redFAD_binding_8
iaq.scaf_10.197redSTART
iaq.scaf_73.1195redActin
iaq.scaf_47.109pinkActin
iaq.scaf_129.318pinkATP-synt_D
iaq.scaf_330.200_iaq.scaf_330.201pinkJmjC
iaq.scaf_940.73pinkHMG_box
iaq.scaf_41.108pinkAminotran_1_2
iaq.scaf_486.312pink3_5_exonuc
iaq.scaf_131.436pinkLipase_GDSL
iaq.scaf_20.568pinkKinesin
iaq.scaf_36.9pinkFAD_binding_3
iaq.scaf_59.231dark magentaCu_bind_like
iaq.scaf_59.232dark magentaCu_bind_like
iaq.scaf_25.72dark magentap450
iaq.scaf_17.334dark magentap450
iaq.scaf_446.1dark magentap450
iaq.scaf_6.63dark magentap450
iaq.scaf_32.522dark magentap450
iaq.scaf_129.934dark magentaPkinase_Tyr
iaq.scaf_59.210dark magentaLRRNT_2
iaq.scaf_56.581.1dark magentap450
iaq.scaf_29.92dark magentaSugar_tr
Disclaimer/Publisher’s Note: The statements, opinions and data contained in all publications are solely those of the individual author(s) and contributor(s) and not of MDPI and/or the editor(s). MDPI and/or the editor(s) disclaim responsibility for any injury to people or property resulting from any ideas, methods, instructions or products referred to in the content.

