CD99 Modulates the Proteomic Landscape of Ewing Sarcoma Cells and Related Extracellular Vesicles
Abstract
:1. Introduction
2. Results
2.1. Proteomics Analysis and Functional Annotations of CD99-Associated Proteins in EWS Cells
2.2. Identification and Functional Annotation of Shared Proteins between CD99pos/neg Cells and Related EVs
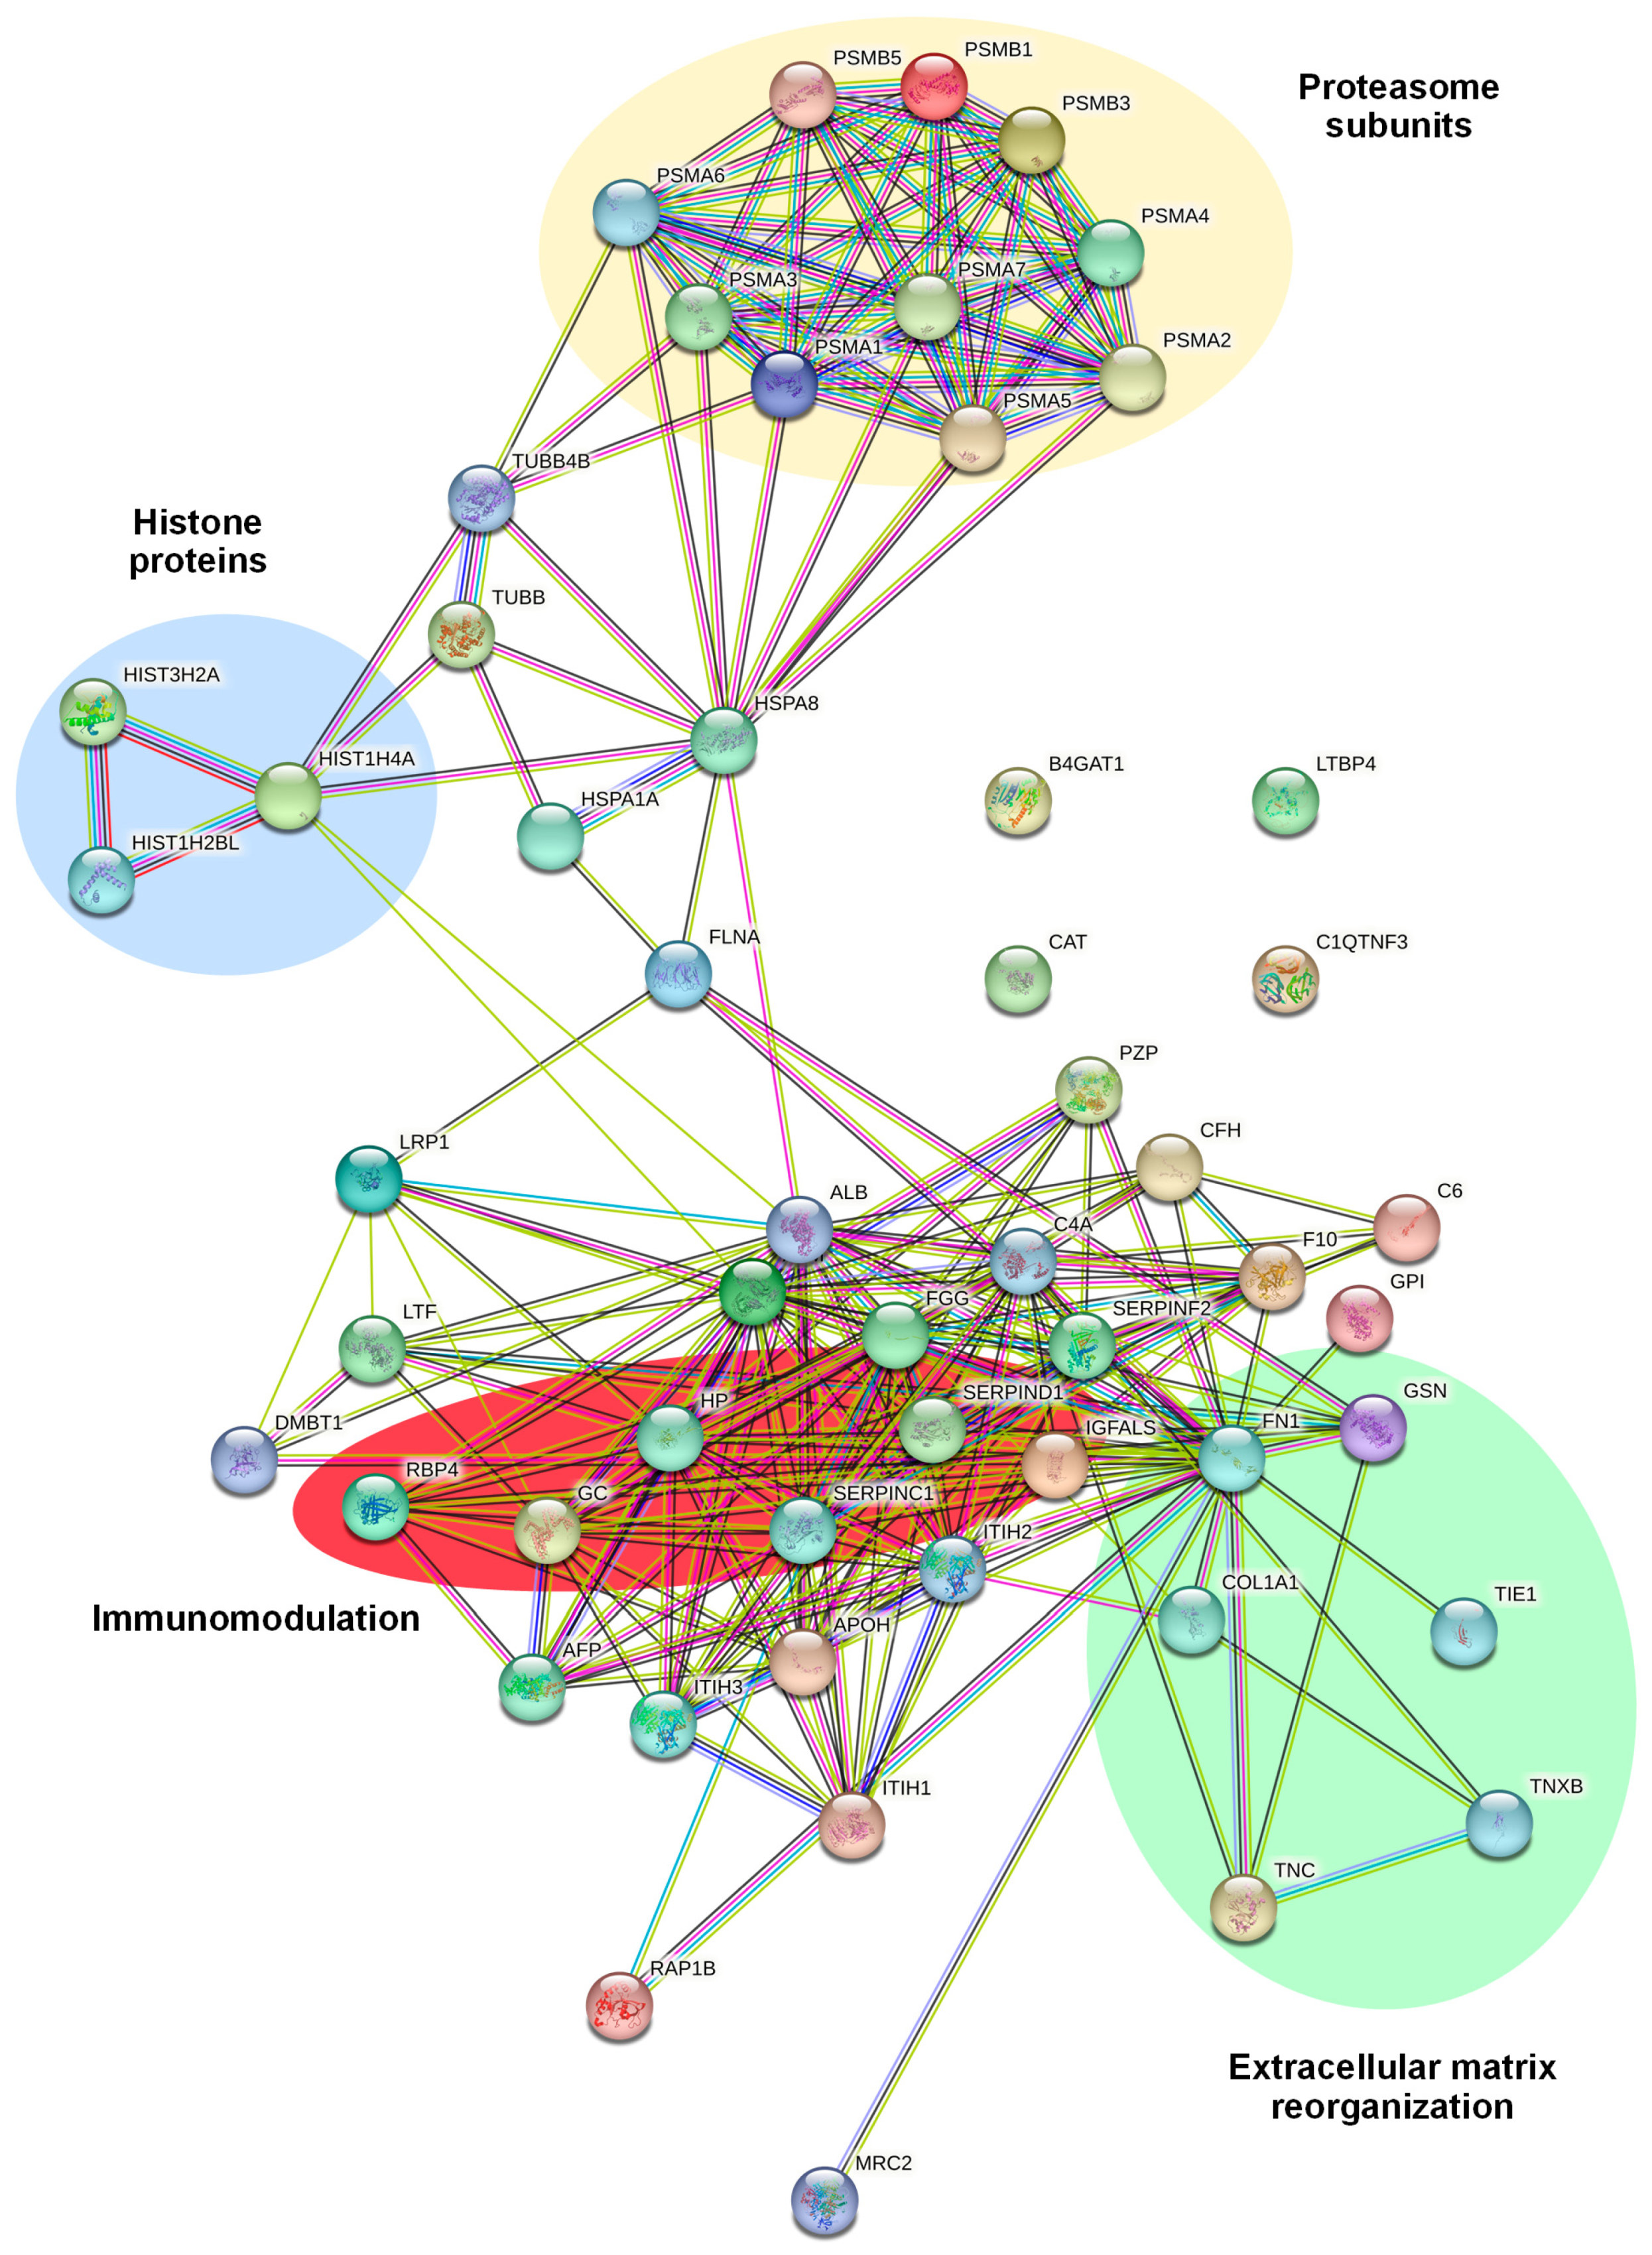
2.3. Identification and Functional Annotation of CD99-Associated Proteins in EVs
3. Discussion
4. Materials and Methods
4.1. Cell Lines
4.2. Isolation and Characterization of EVs
4.3. Western Blotting
4.4. Mass Spectrometry (MS)
4.4.1. Sample Preparation
4.4.2. Proteomic Analysis
4.5. Label-Free Proteomics Quantification and Differential Expression (Analysis of MS Data)
5. Conclusions
Supplementary Materials
Author Contributions
Funding
Institutional Review Board Statement
Informed Consent Statement
Data Availability Statement
Acknowledgments
Conflicts of Interest
References
- Zollner, S.K.; Amatruda, J.F.; Bauer, S.; Collaud, S.; de Alava, E.; DuBois, S.G.; Hardes, J.; Hartmann, W.; Kovar, H.; Metzler, M.; et al. Ewing Sarcoma-Diagnosis, Treatment, Clinical Challenges and Future Perspectives. J. Clin. Med. 2021, 10, 1685. [Google Scholar] [CrossRef]
- Grunewald, T.G.P.; Cidre-Aranaz, F.; Surdez, D.; Tomazou, E.M.; de Alava, E.; Kovar, H.; Sorensen, P.H.; Delattre, O.; Dirksen, U. Ewing sarcoma. Nat. Rev. Dis. Primers 2018, 4, 5. [Google Scholar] [CrossRef]
- Apfelbaum, A.A.; Wrenn, E.D.; Lawlor, E.R. The importance of fusion protein activity in Ewing sarcoma and the cell intrinsic and extrinsic factors that regulate it: A review. Front. Oncol. 2022, 12, 1044707. [Google Scholar] [CrossRef]
- Franzetti, G.A.; Laud-Duval, K.; van der Ent, W.; Brisac, A.; Irondelle, M.; Aubert, S.; Dirksen, U.; Bouvier, C.; de Pinieux, G.; Snaar-Jagalska, E.; et al. Cell-to-cell heterogeneity of EWSR1-FLI1 activity determines proliferation/migration choices in Ewing sarcoma cells. Oncogene 2017, 36, 3505–3514. [Google Scholar] [CrossRef]
- Chaturvedi, A.; Hoffman, L.M.; Welm, A.L.; Lessnick, S.L.; Beckerle, M.C. The EWS/FLI Oncogene Drives Changes in Cellular Morphology, Adhesion, and Migration in Ewing Sarcoma. Genes Cancer 2012, 3, 102–116. [Google Scholar] [CrossRef] [PubMed]
- Seong, B.K.A.; Dharia, N.V.; Lin, S.; Donovan, K.A.; Chong, S.; Robichaud, A.; Conway, A.; Hamze, A.; Ross, L.; Alexe, G.; et al. TRIM8 modulates the EWS/FLI oncoprotein to promote survival in Ewing sarcoma. Cancer Cell 2021, 39, 1262–1278 e1267. [Google Scholar] [CrossRef] [PubMed]
- Adane, B.; Alexe, G.; Seong, B.K.A.; Lu, D.; Hwang, E.E.; Hnisz, D.; Lareau, C.A.; Ross, L.; Lin, S.; Dela Cruz, F.S.; et al. STAG2 loss rewires oncogenic and developmental programs to promote metastasis in Ewing sarcoma. Cancer Cell 2021, 39, 827–844 e810. [Google Scholar] [CrossRef] [PubMed]
- Graham, G.T.; Selvanathan, S.P.; Zollner, S.K.; Stahl, E.; Shlien, A.; Caplen, N.J.; Uren, A.; Toretsky, J.A. Comprehensive profiling of mRNA splicing indicates that GC content signals altered cassette exon inclusion in Ewing sarcoma. NAR Cancer 2022, 4, zcab052. [Google Scholar] [CrossRef] [PubMed]
- Gorthi, A.; Romero, J.C.; Loranc, E.; Cao, L.; Lawrence, L.A.; Goodale, E.; Iniguez, A.B.; Bernard, X.; Masamsetti, V.P.; Roston, S.; et al. EWS-FLI1 increases transcription to cause R-loops and block BRCA1 repair in Ewing sarcoma. Nature 2018, 555, 387–391. [Google Scholar] [CrossRef] [PubMed]
- Cidre-Aranaz, F.; Watson, S.; Amatruda, J.F.; Nakamura, T.; Delattre, O.; de Alava, E.; Dirksen, U.; Grunewald, T.G.P. Small round cell sarcomas. Nat. Rev. Dis. Primers 2022, 8, 66. [Google Scholar] [CrossRef] [PubMed]
- Crompton, B.D.; Stewart, C.; Taylor-Weiner, A.; Alexe, G.; Kurek, K.C.; Calicchio, M.L.; Kiezun, A.; Carter, S.L.; Shukla, S.A.; Mehta, S.S.; et al. The genomic landscape of pediatric Ewing sarcoma. Cancer Discov. 2014, 4, 1326–1341. [Google Scholar] [CrossRef] [PubMed]
- Tirode, F.; Surdez, D.; Ma, X.; Parker, M.; Le Deley, M.C.; Bahrami, A.; Zhang, Z.; Lapouble, E.; Grossetete-Lalami, S.; Rusch, M.; et al. Genomic landscape of Ewing sarcoma defines an aggressive subtype with co-association of STAG2 and TP53 mutations. Cancer Discov. 2014, 4, 1342–1353. [Google Scholar] [CrossRef] [PubMed]
- Surdez, D.; Zaidi, S.; Grossetete, S.; Laud-Duval, K.; Ferre, A.S.; Mous, L.; Vourc’h, T.; Tirode, F.; Pierron, G.; Raynal, V.; et al. STAG2 mutations alter CTCF-anchored loop extrusion, reduce cis-regulatory interactions and EWSR1-FLI1 activity in Ewing sarcoma. Cancer Cell 2021, 39, 810–826 e819. [Google Scholar] [CrossRef] [PubMed]
- Manara, M.C.; Pasello, M.; Scotlandi, K. CD99: A Cell Surface Protein with an Oncojanus Role in Tumors. Genes 2018, 9, 159. [Google Scholar] [CrossRef] [PubMed]
- Pasello, M.; Manara, M.C.; Scotlandi, K. CD99 at the crossroads of physiology and pathology. J. Cell Commun. Signal. 2018, 12, 55–68. [Google Scholar] [CrossRef]
- Franzetti, G.A.; Laud-Duval, K.; Bellanger, D.; Stern, M.H.; Sastre-Garau, X.; Delattre, O. MiR-30a-5p connects EWS-FLI1 and CD99, two major therapeutic targets in Ewing tumor. Oncogene 2013, 32, 3915–3921. [Google Scholar] [CrossRef]
- Rocchi, A.; Manara, M.C.; Sciandra, M.; Zambelli, D.; Nardi, F.; Nicoletti, G.; Garofalo, C.; Meschini, S.; Astolfi, A.; Colombo, M.P.; et al. CD99 inhibits neural differentiation of human Ewing sarcoma cells and thereby contributes to oncogenesis. J. Clin. Investig. 2010, 120, 668–680. [Google Scholar] [CrossRef]
- Ventura, S.; Aryee, D.N.; Felicetti, F.; De Feo, A.; Mancarella, C.; Manara, M.C.; Picci, P.; Colombo, M.P.; Kovar, H.; Care, A.; et al. CD99 regulates neural differentiation of Ewing sarcoma cells through miR-34a-Notch-mediated control of NF-kappaB signaling. Oncogene 2016, 35, 3944–3954. [Google Scholar] [CrossRef]
- Balestra, T.; Manara, M.C.; Laginestra, M.A.; Pasello, M.; De Feo, A.; Bassi, C.; Guerzoni, C.; Landuzzi, L.; Lollini, P.L.; Donati, D.M.; et al. Targeting CD99 Compromises the Oncogenic Effects of the Chimera EWS-FLI1 by Inducing Reexpression of Zyxin and Inhibition of GLI1 Activity. Mol. Cancer Ther. 2022, 21, 58–69. [Google Scholar] [CrossRef]
- De Feo, A.; Sciandra, M.; Ferracin, M.; Felicetti, F.; Astolfi, A.; Pignochino, Y.; Picci, P.; Care, A.; Scotlandi, K. Exosomes from CD99-deprived Ewing sarcoma cells reverse tumor malignancy by inhibiting cell migration and promoting neural differentiation. Cell Death Dis. 2019, 10, 471. [Google Scholar] [CrossRef]
- Zucchini, C.; Manara, M.C.; Pinca, R.S.; De Sanctis, P.; Guerzoni, C.; Sciandra, M.; Lollini, P.L.; Cenacchi, G.; Picci, P.; Valvassori, L.; et al. CD99 suppresses osteosarcoma cell migration through inhibition of ROCK2 activity. Oncogene 2014, 33, 1912–1921. [Google Scholar] [CrossRef]
- Sciandra, M.; Marino, M.T.; Manara, M.C.; Guerzoni, C.; Grano, M.; Oranger, A.; Lucarelli, E.; Lollini, P.L.; Dozza, B.; Pratelli, L.; et al. CD99 drives terminal differentiation of osteosarcoma cells by acting as a spatial regulator of ERK 1/2. J. Bone Miner. Res. 2014, 29, 1295–1309. [Google Scholar] [CrossRef]
- Zhou, F.; Elzi, D.J.; Jayabal, P.; Ma, X.; Chiu, Y.C.; Chen, Y.; Blackman, B.; Weintraub, S.T.; Houghton, P.J.; Shiio, Y. GDF6-CD99 Signaling Regulates Src and Ewing Sarcoma Growth. Cell Rep. 2020, 33, 108332. [Google Scholar] [CrossRef]
- Doyle, L.M.; Wang, M.Z. Overview of Extracellular Vesicles, Their Origin, Composition, Purpose, and Methods for Exosome Isolation and Analysis. Cells 2019, 8, 727. [Google Scholar] [CrossRef]
- Couch, Y.; Buzas, E.I.; Di Vizio, D.; Gho, Y.S.; Harrison, P.; Hill, A.F.; Lotvall, J.; Raposo, G.; Stahl, P.D.; Thery, C.; et al. A brief history of nearly EV-erything—The rise and rise of extracellular vesicles. J. Extracell. Vesicles 2021, 10, e12144. [Google Scholar] [CrossRef]
- Aynaud, M.M.; Mirabeau, O.; Gruel, N.; Grossetete, S.; Boeva, V.; Durand, S.; Surdez, D.; Saulnier, O.; Zaidi, S.; Gribkova, S.; et al. Transcriptional Programs Define Intratumoral Heterogeneity of Ewing Sarcoma at Single-Cell Resolution. Cell Rep. 2020, 30, 1767–1779.e6. [Google Scholar] [CrossRef]
- Sheffield, N.C.; Pierron, G.; Klughammer, J.; Datlinger, P.; Schonegger, A.; Schuster, M.; Hadler, J.; Surdez, D.; Guillemot, D.; Lapouble, E.; et al. DNA methylation heterogeneity defines a disease spectrum in Ewing sarcoma. Nat. Med. 2017, 23, 386–395. [Google Scholar] [CrossRef] [PubMed]
- Showpnil, I.A.; Selich-Anderson, J.; Taslim, C.; Boone, M.A.; Crow, J.C.; Theisen, E.R.; Lessnick, S.L. EWS/FLI mediated reprogramming of 3D chromatin promotes an altered transcriptional state in Ewing sarcoma. Nucleic Acids Res. 2022, 50, 9814–9837. [Google Scholar] [CrossRef] [PubMed]
- Mancarella, C.; Pasello, M.; Ventura, S.; Grilli, A.; Calzolari, L.; Toracchio, L.; Lollini, P.L.; Donati, D.M.; Picci, P.; Ferrari, S.; et al. Insulin-Like Growth Factor 2 mRNA-Binding Protein 3 is a Novel Post-Transcriptional Regulator of Ewing Sarcoma Malignancy. Clin. Cancer Res. 2018, 24, 3704–3716. [Google Scholar] [CrossRef] [PubMed]
- Apfelbaum, A.A.; Wu, F.; Hawkins, A.G.; Magnuson, B.; Jimenez, J.A.; Taylor, S.D.; Wrenn, E.D.; Waltner, O.; Pfaltzgraff, E.R.; Song, J.Y.; et al. EWS::FLI1 and HOXD13 Control Tumor Cell Plasticity in Ewing Sarcoma. Clin. Cancer Res. 2022, 28, 4466–4478. [Google Scholar] [CrossRef] [PubMed]
- El-Naggar, A.M.; Veinotte, C.J.; Cheng, H.; Grunewald, T.G.; Negri, G.L.; Somasekharan, S.P.; Corkery, D.P.; Tirode, F.; Mathers, J.; Khan, D.; et al. Translational Activation of HIF1alpha by YB-1 Promotes Sarcoma Metastasis. Cancer Cell 2015, 27, 682–697. [Google Scholar] [CrossRef]
- Burns, J.; Wilding, C.P.; Krasny, L.; Zhu, X.; Chadha, M.; Tam, Y.B.; Ps, H.; Mahalingam, A.H.; Lee, A.T.J.; Arthur, A.; et al. The proteomic landscape of soft tissue sarcomas. Nat. Commun. 2023, 14, 3834. [Google Scholar] [CrossRef]
- Sinha, A.; Huang, V.; Livingstone, J.; Wang, J.; Fox, N.S.; Kurganovs, N.; Ignatchenko, V.; Fritsch, K.; Donmez, N.; Heisler, L.E.; et al. The Proteogenomic Landscape of Curable Prostate Cancer. Cancer Cell 2019, 35, 414–427.e6. [Google Scholar] [CrossRef] [PubMed]
- Connolly, E.A.; Grimison, P.S.; Horvath, L.G.; Robinson, P.J.; Reddel, R.R. Quantitative proteomic studies addressing unmet clinical needs in sarcoma. Front. Oncol. 2023, 13, 1126736. [Google Scholar] [CrossRef] [PubMed]
- Kikuta, K.; Tochigi, N.; Shimoda, T.; Yabe, H.; Morioka, H.; Toyama, Y.; Hosono, A.; Beppu, Y.; Kawai, A.; Hirohashi, S.; et al. Nucleophosmin as a candidate prognostic biomarker of Ewing’s sarcoma revealed by proteomics. Clin. Cancer Res. 2009, 15, 2885–2894. [Google Scholar] [CrossRef] [PubMed]
- Mooney, B.; Negri, G.L.; Shyp, T.; Delaidelli, A.; Zhang, H.F.; Spencer Miko, S.E.; Weiner, A.K.; Radaoui, A.B.; Shraim, R.; Lizardo, M.M.; et al. Surface and global proteome analyses identify ENPP1 and other surface proteins as actionable immunotherapeutic targets in Ewing sarcoma. Clin. Cancer Res. 2023. [Google Scholar] [CrossRef] [PubMed]
- Turaga, S.M.; Sardiu, M.E.; Vishwakarma, V.; Mitra, A.; Bantis, L.E.; Madan, R.; Merchant, M.L.; Klein, J.B.; Samuel, G.; Godwin, A.K. Identification of small extracellular vesicle protein biomarkers for pediatric Ewing Sarcoma. Front. Mol. Biosci. 2023, 10, 1138594. [Google Scholar] [CrossRef] [PubMed]
- Fan, Y.; Gong, Y.; Ghosh, P.K.; Graham, L.M.; Fox, P.L. Spatial coordination of actin polymerization and ILK-Akt2 activity during endothelial cell migration. Dev. Cell 2009, 16, 661–674. [Google Scholar] [CrossRef] [PubMed]
- Cash, T.; Yin, H.; McCracken, C.; Geng, Z.; DuBois, S.G.; Shehata, B.M.; Olson, T.A.; Katzenstein, H.M.; Wetmore, C. Correlation of Ezrin Expression Pattern and Clinical Outcomes in Ewing Sarcoma. Sarcoma 2017, 2017, 8758623. [Google Scholar] [CrossRef]
- Ohue, Y.; Kurose, K.; Mizote, Y.; Matsumoto, H.; Nishio, Y.; Isobe, M.; Fukuda, M.; Uenaka, A.; Oka, M.; Nakayama, E. Prolongation of overall survival in advanced lung adenocarcinoma patients with the XAGE1 (GAGED2a) antibody. Clin. Cancer Res. 2014, 20, 5052–5063. [Google Scholar] [CrossRef]
- Sabbatino, F.; Liguori, L.; Polcaro, G.; Salvato, I.; Caramori, G.; Salzano, F.A.; Casolaro, V.; Stellato, C.; Col, J.D.; Pepe, S. Role of Human Leukocyte Antigen System as A Predictive Biomarker for Checkpoint-Based Immunotherapy in Cancer Patients. Int. J. Mol. Sci. 2020, 21, 7295. [Google Scholar] [CrossRef]
- Chang, Q.H.; Mao, T.; Tao, Y.; Dong, T.; Tang, X.X.; Ge, G.H.; Xu, Z.J. Pan-cancer analysis identifies ITIH1 as a novel prognostic indicator for hepatocellular carcinoma. Aging 2021, 13, 11096–11119. [Google Scholar] [CrossRef]
- Yao, J.M.; Ying, H.Z.; Zhang, H.H.; Qiu, F.S.; Wu, J.Q.; Yu, C.H. Exosomal RBP4 potentiated hepatic lipid accumulation and inflammation in high-fat-diet-fed mice by promoting M1 polarization of Kupffer cells. Free Radic. Biol. Med. 2023, 195, 58–73. [Google Scholar] [CrossRef] [PubMed]
- Liu, X.F.; Helman, L.J.; Yeung, C.; Bera, T.K.; Lee, B.; Pastan, I. XAGE-1, a new gene that is frequently expressed in Ewing’s sarcoma. Cancer Res. 2000, 60, 4752–4755. [Google Scholar] [PubMed]
- Zendman, A.J.; Van Kraats, A.A.; Weidle, U.H.; Ruiter, D.J.; Van Muijen, G.N. The XAGE family of cancer/testis-associated genes: Alignment and expression profile in normal tissues, melanoma lesions and Ewing’s sarcoma. Int. J. Cancer 2002, 99, 361–369. [Google Scholar] [CrossRef]
- Altvater, B.; Kailayangiri, S.; Theimann, N.; Ahlmann, M.; Farwick, N.; Chen, C.; Pscherer, S.; Neumann, I.; Mrachatz, G.; Hansmeier, A.; et al. Common Ewing sarcoma-associated antigens fail to induce natural T cell responses in both patients and healthy individuals. Cancer Immunol. Immunother. 2014, 63, 1047–1060. [Google Scholar] [CrossRef]
- Pachva, M.C.; Lai, H.; Jia, A.; Rouleau, M.; Sorensen, P.H. Extracellular Vesicles in Reprogramming of the Ewing Sarcoma Tumor Microenvironment. Front. Cell Dev. Biol. 2021, 9, 726205. [Google Scholar] [CrossRef]
- Ben-Nissan, G.; Katzir, N.; Fuzesi-Levi, M.G.; Sharon, M. Biology of the Extracellular Proteasome. Biomolecules 2022, 12, 619. [Google Scholar] [CrossRef]
- Haselbach, D.; Schrader, J.; Lambrecht, F.; Henneberg, F.; Chari, A.; Stark, H. Long-range allosteric regulation of the human 26S proteasome by 20S proteasome-targeting cancer drugs. Nat. Commun. 2017, 8, 15578. [Google Scholar] [CrossRef] [PubMed]
- Kobatake, K.; Ikeda, K.; Teishima, J.; Sekino, Y.; Babasaki, T.; Kohada, Y.; Tasaka, R.; Takemoto, K.; Fukushima, T.; Miyamoto, S.; et al. Complexity in radiological morphology predicts worse prognosis and is associated with an increase in proteasome component levels in clear cell renal cell carcinoma. Front. Oncol. 2022, 12, 1039383. [Google Scholar] [CrossRef]
- Martire, S.; Banaszynski, L.A. The roles of histone variants in fine-tuning chromatin organization and function. Nat. Rev. Mol. Cell Biol. 2020, 21, 522–541. [Google Scholar] [CrossRef]
- Tucker, R.P.; Degen, M. Revisiting the Tenascins: Exploitable as Cancer Targets? Front. Oncol. 2022, 12, 908247. [Google Scholar] [CrossRef]
- Samuel, G.; Crow, J.; Klein, J.B.; Merchant, M.L.; Nissen, E.; Koestler, D.C.; Laurence, K.; Liang, X.; Neville, K.; Staggs, V.; et al. Ewing sarcoma family of tumors-derived small extracellular vesicle proteomics identify potential clinical biomarkers. Oncotarget 2020, 11, 2995–3012. [Google Scholar] [CrossRef]
- He, S.; Huang, Q.; Hu, J.; Li, L.; Xiao, Y.; Yu, H.; Han, Z.; Wang, T.; Zhou, W.; Wei, H.; et al. EWS-FLI1-mediated tenascin-C expression promotes tumour progression by targeting MALAT1 through integrin alpha5beta1-mediated YAP activation in Ewing sarcoma. Br. J. Cancer 2019, 121, 922–933. [Google Scholar] [CrossRef]
- Shukla, N.; Somwar, R.; Smith, R.S.; Ambati, S.; Munoz, S.; Merchant, M.; D’Arcy, P.; Wang, X.; Kobos, R.; Antczak, C.; et al. Proteasome Addiction Defined in Ewing Sarcoma Is Effectively Targeted by a Novel Class of 19S Proteasome Inhibitors. Cancer Res. 2016, 76, 4525–4534. [Google Scholar] [CrossRef]
- Ding, Z.; Wang, N.; Ji, N.; Chen, Z.S. Proteomics technologies for cancer liquid biopsies. Mol. Cancer 2022, 21, 53. [Google Scholar] [CrossRef] [PubMed]
- Punetha, A.; Kotiya, D. Advancements in Oncoproteomics Technologies: Treading toward Translation into Clinical Practice. Proteomes 2023, 11, 2. [Google Scholar] [CrossRef] [PubMed]
- Manfredi, M.; Martinotti, S.; Gosetti, F.; Ranzato, E.; Marengo, E. The secretome signature of malignant mesothelioma cell lines. J. Proteom. 2016, 145, 3–10. [Google Scholar] [CrossRef] [PubMed]
- Zhang, X.; Smits, A.H.; van Tilburg, G.B.; Ovaa, H.; Huber, W.; Vermeulen, M. Proteome-wide identification of ubiquitin interactions using UbIA-MS. Nat. Protoc. 2018, 13, 530–550. [Google Scholar] [CrossRef] [PubMed]
- Huber, W.; von Heydebreck, A.; Sultmann, H.; Poustka, A.; Vingron, M. Variance stabilization applied to microarray data calibration and to the quantification of differential expression. Bioinformatics 2002, 18 (Suppl. S1), S96–S104. [Google Scholar] [CrossRef] [PubMed]
- Ritchie, M.E.; Phipson, B.; Wu, D.; Hu, Y.; Law, C.W.; Shi, W.; Smyth, G.K. limma powers differential expression analyses for RNA-sequencing and microarray studies. Nucleic Acids Res. 2015, 43, e47. [Google Scholar] [CrossRef] [PubMed]
- Wu, T.; Hu, E.; Xu, S.; Chen, M.; Guo, P.; Dai, Z.; Feng, T.; Zhou, L.; Tang, W.; Zhan, L.; et al. clusterProfiler 4.0: A universal enrichment tool for interpreting omics data. Innovation 2021, 2, 100141. [Google Scholar] [CrossRef] [PubMed]
- Wickham, H. ggplot2: Elegant Graphics for Data Analysis; Springer: New York, NY, USA, 2016. [Google Scholar]
- Walter, W.; Sanchez-Cabo, F.; Ricote, M. GOplot: An R package for visually combining expression data with functional analysis. Bioinformatics 2015, 31, 2912–2914. [Google Scholar] [CrossRef] [PubMed]
- Bardou, P.; Mariette, J.; Escudie, F.; Djemiel, C.; Klopp, C. jvenn: An interactive Venn diagram viewer. BMC Bioinform. 2014, 15, 293. [Google Scholar] [CrossRef]
- Szklarczyk, D.; Kirsch, R.; Koutrouli, M.; Nastou, K.; Mehryary, F.; Hachilif, R.; Gable, A.L.; Fang, T.; Doncheva, N.T.; Pyysalo, S.; et al. The STRING database in 2023: Protein-protein association networks and functional enrichment analyses for any sequenced genome of interest. Nucleic Acids Res 2023, 51, D638–D646. [Google Scholar] [CrossRef]
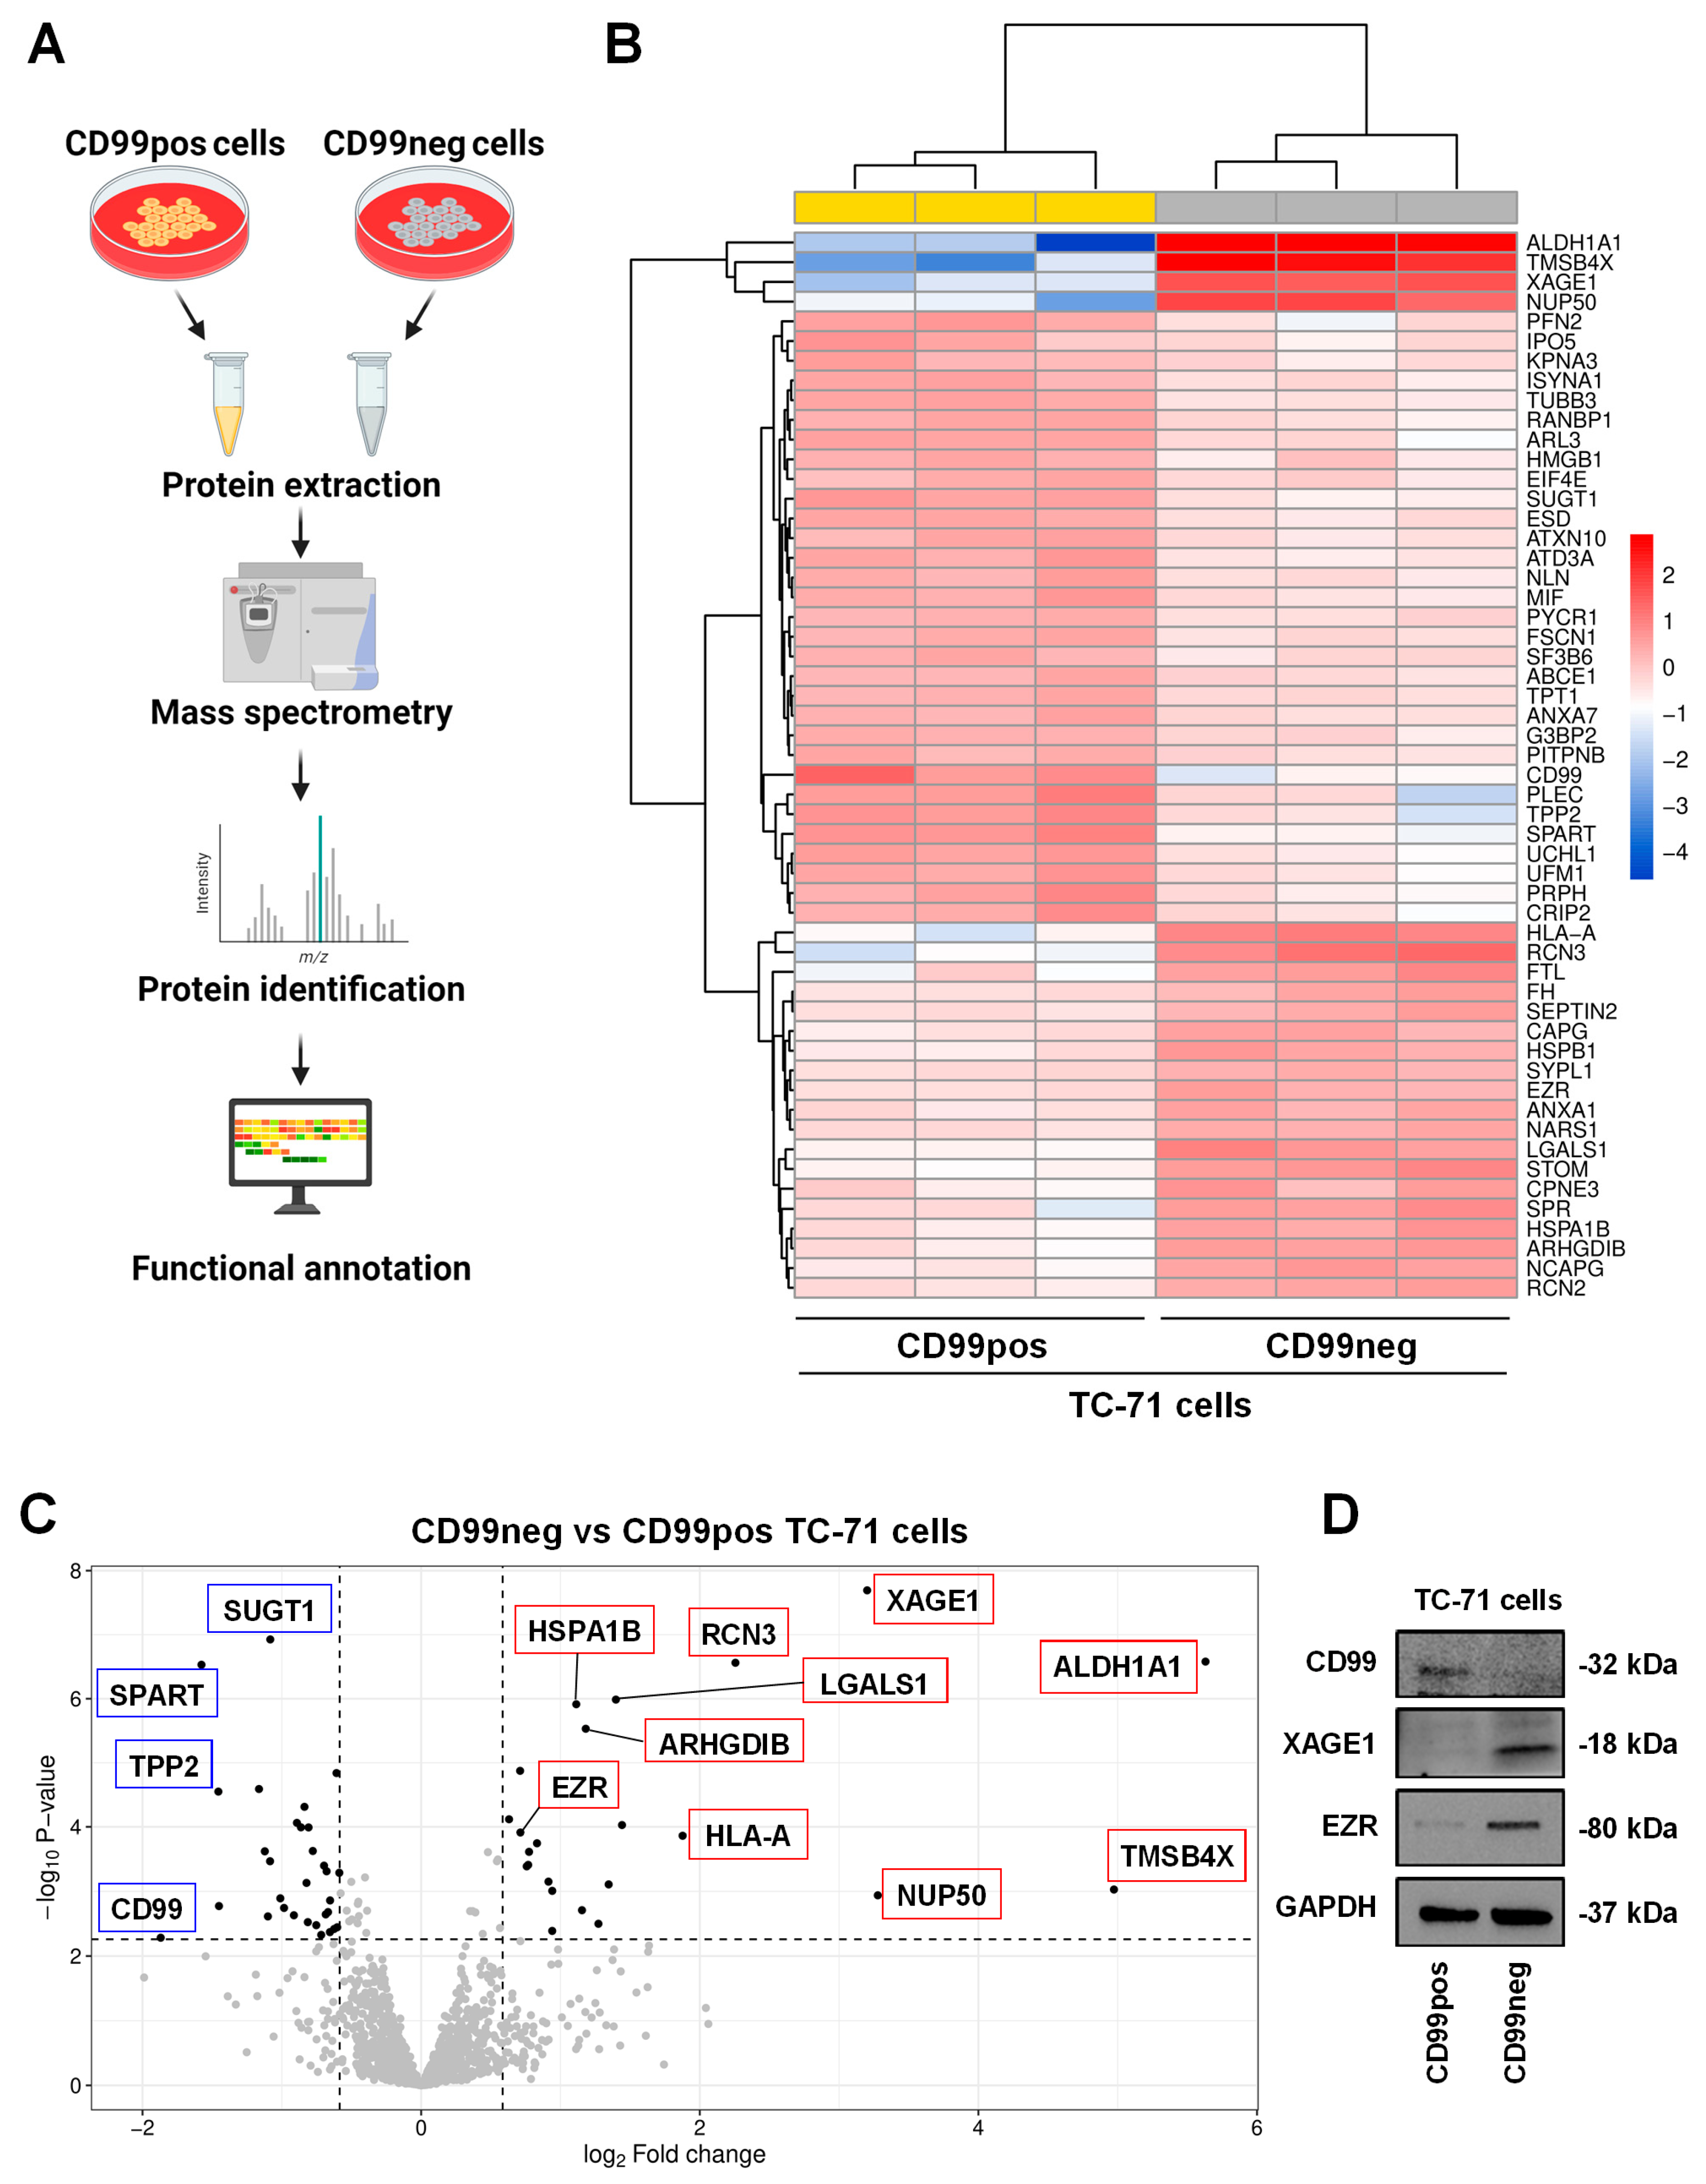
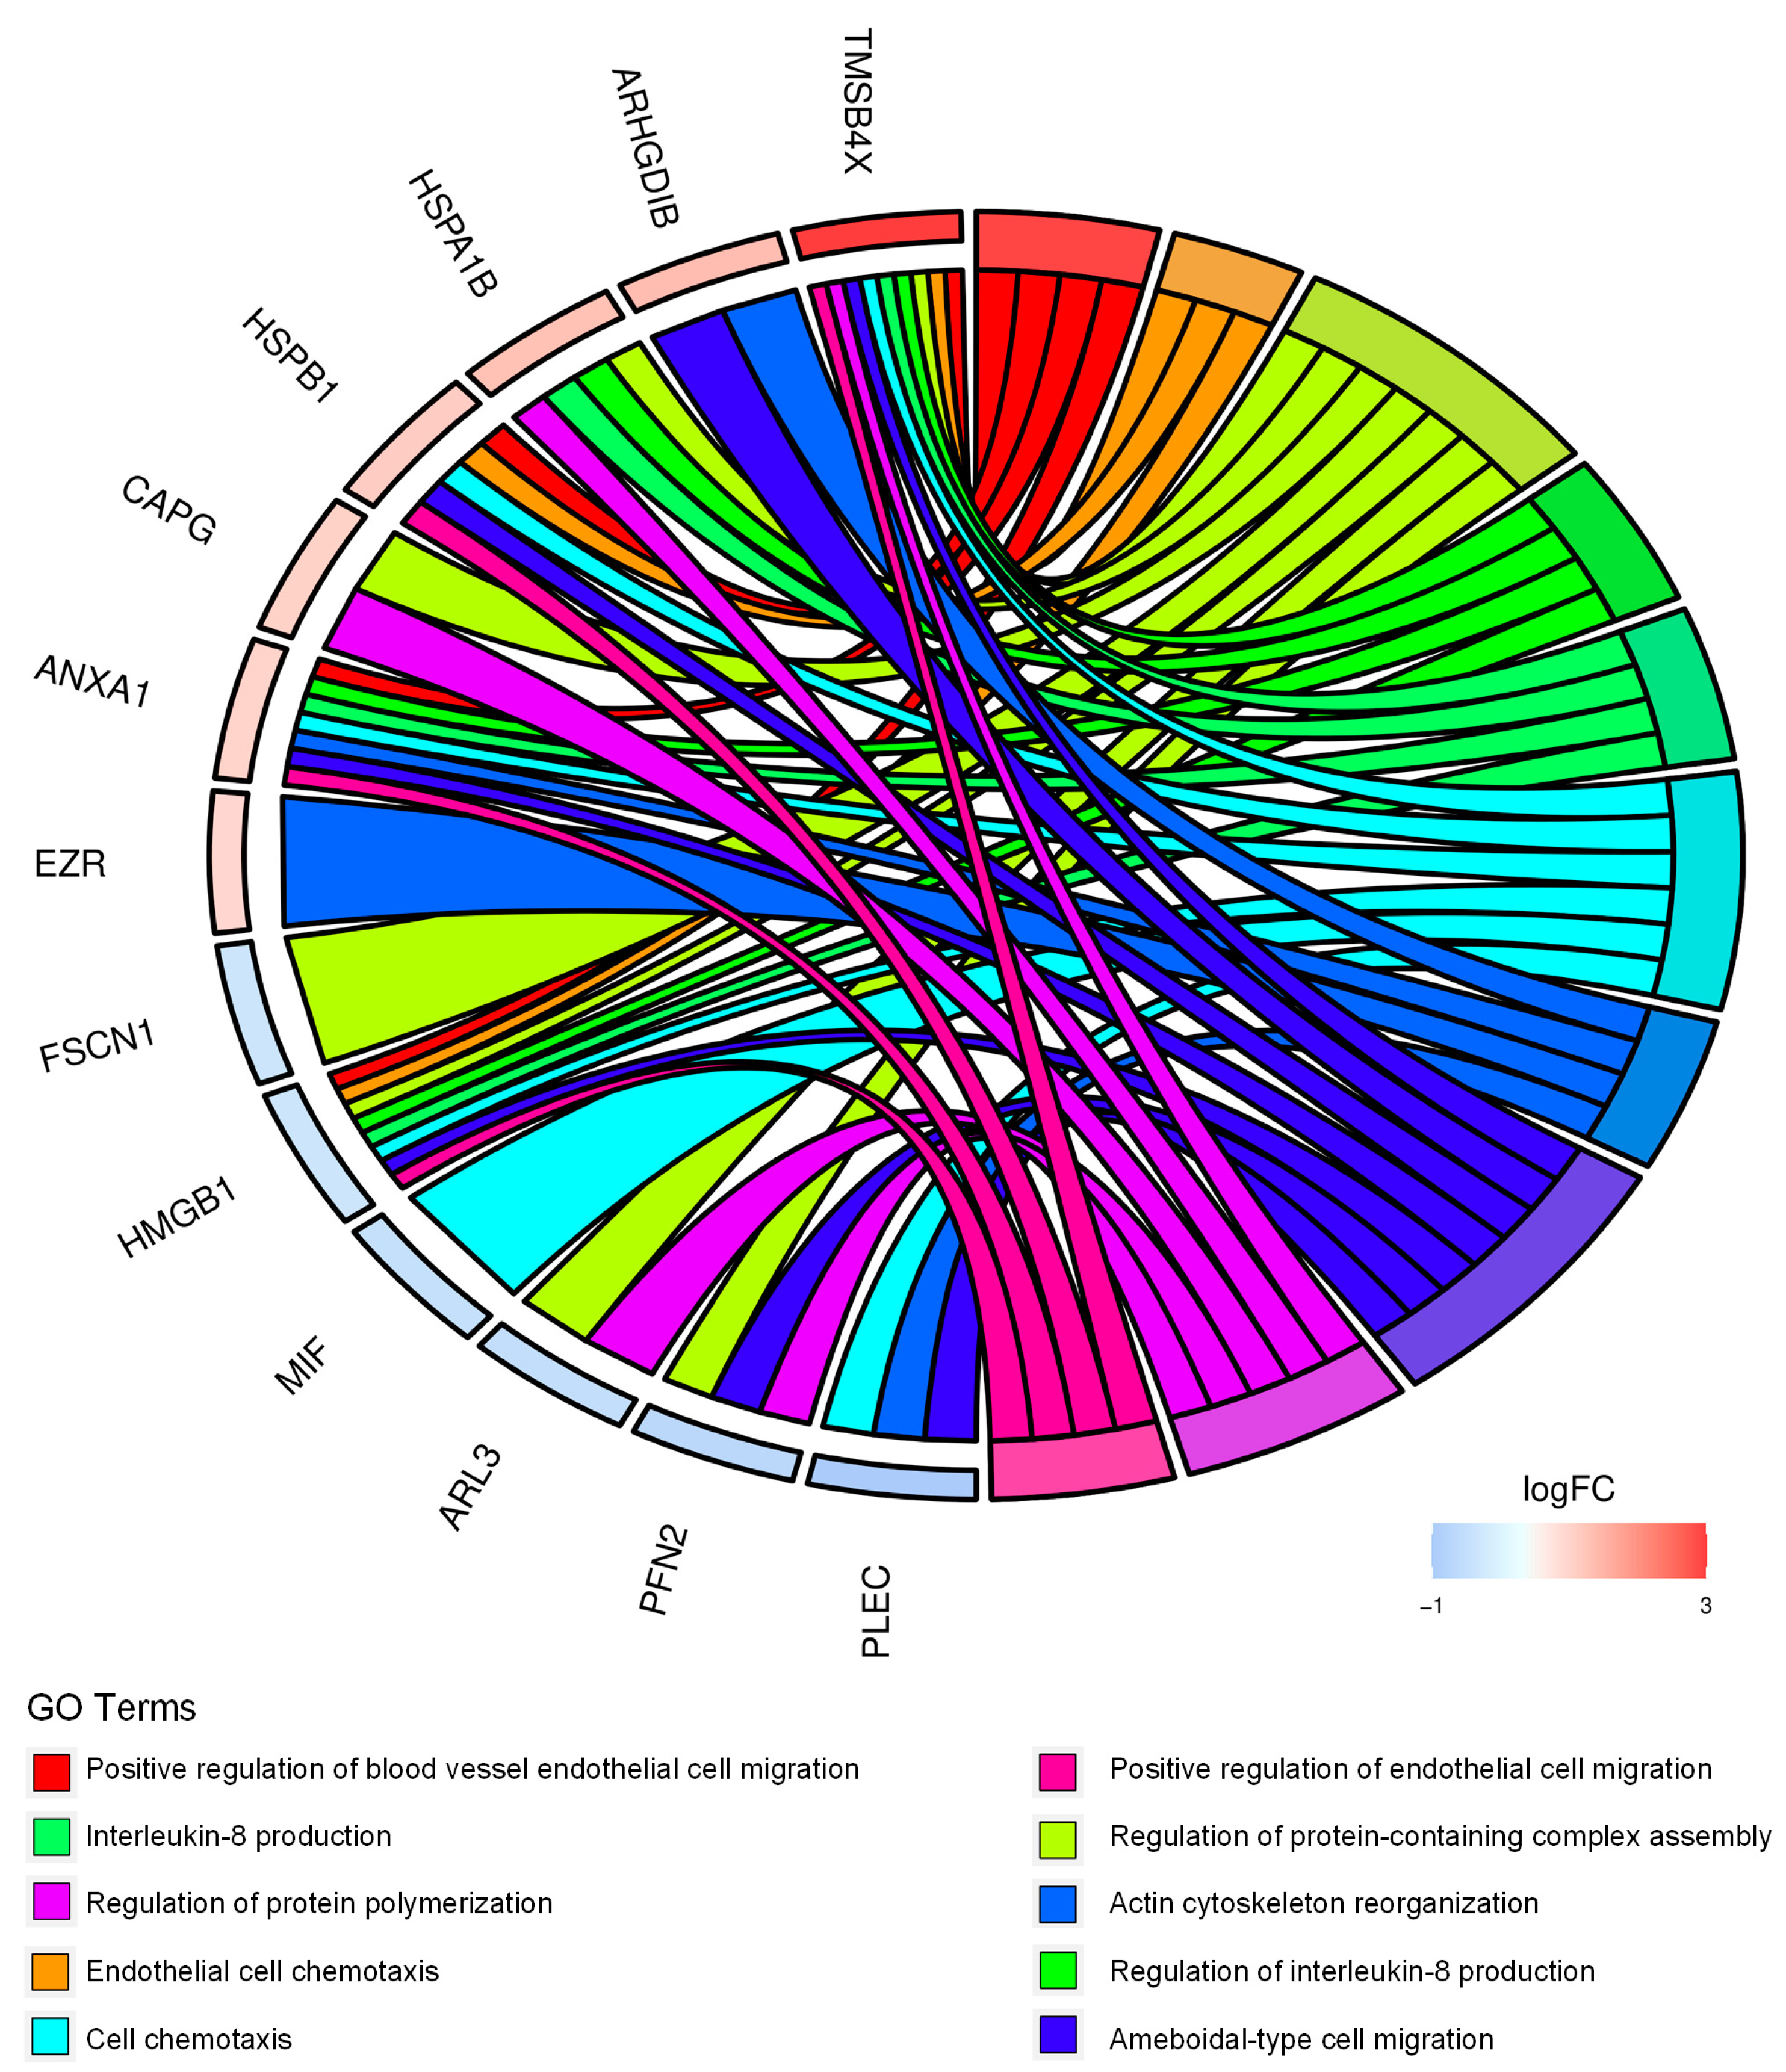
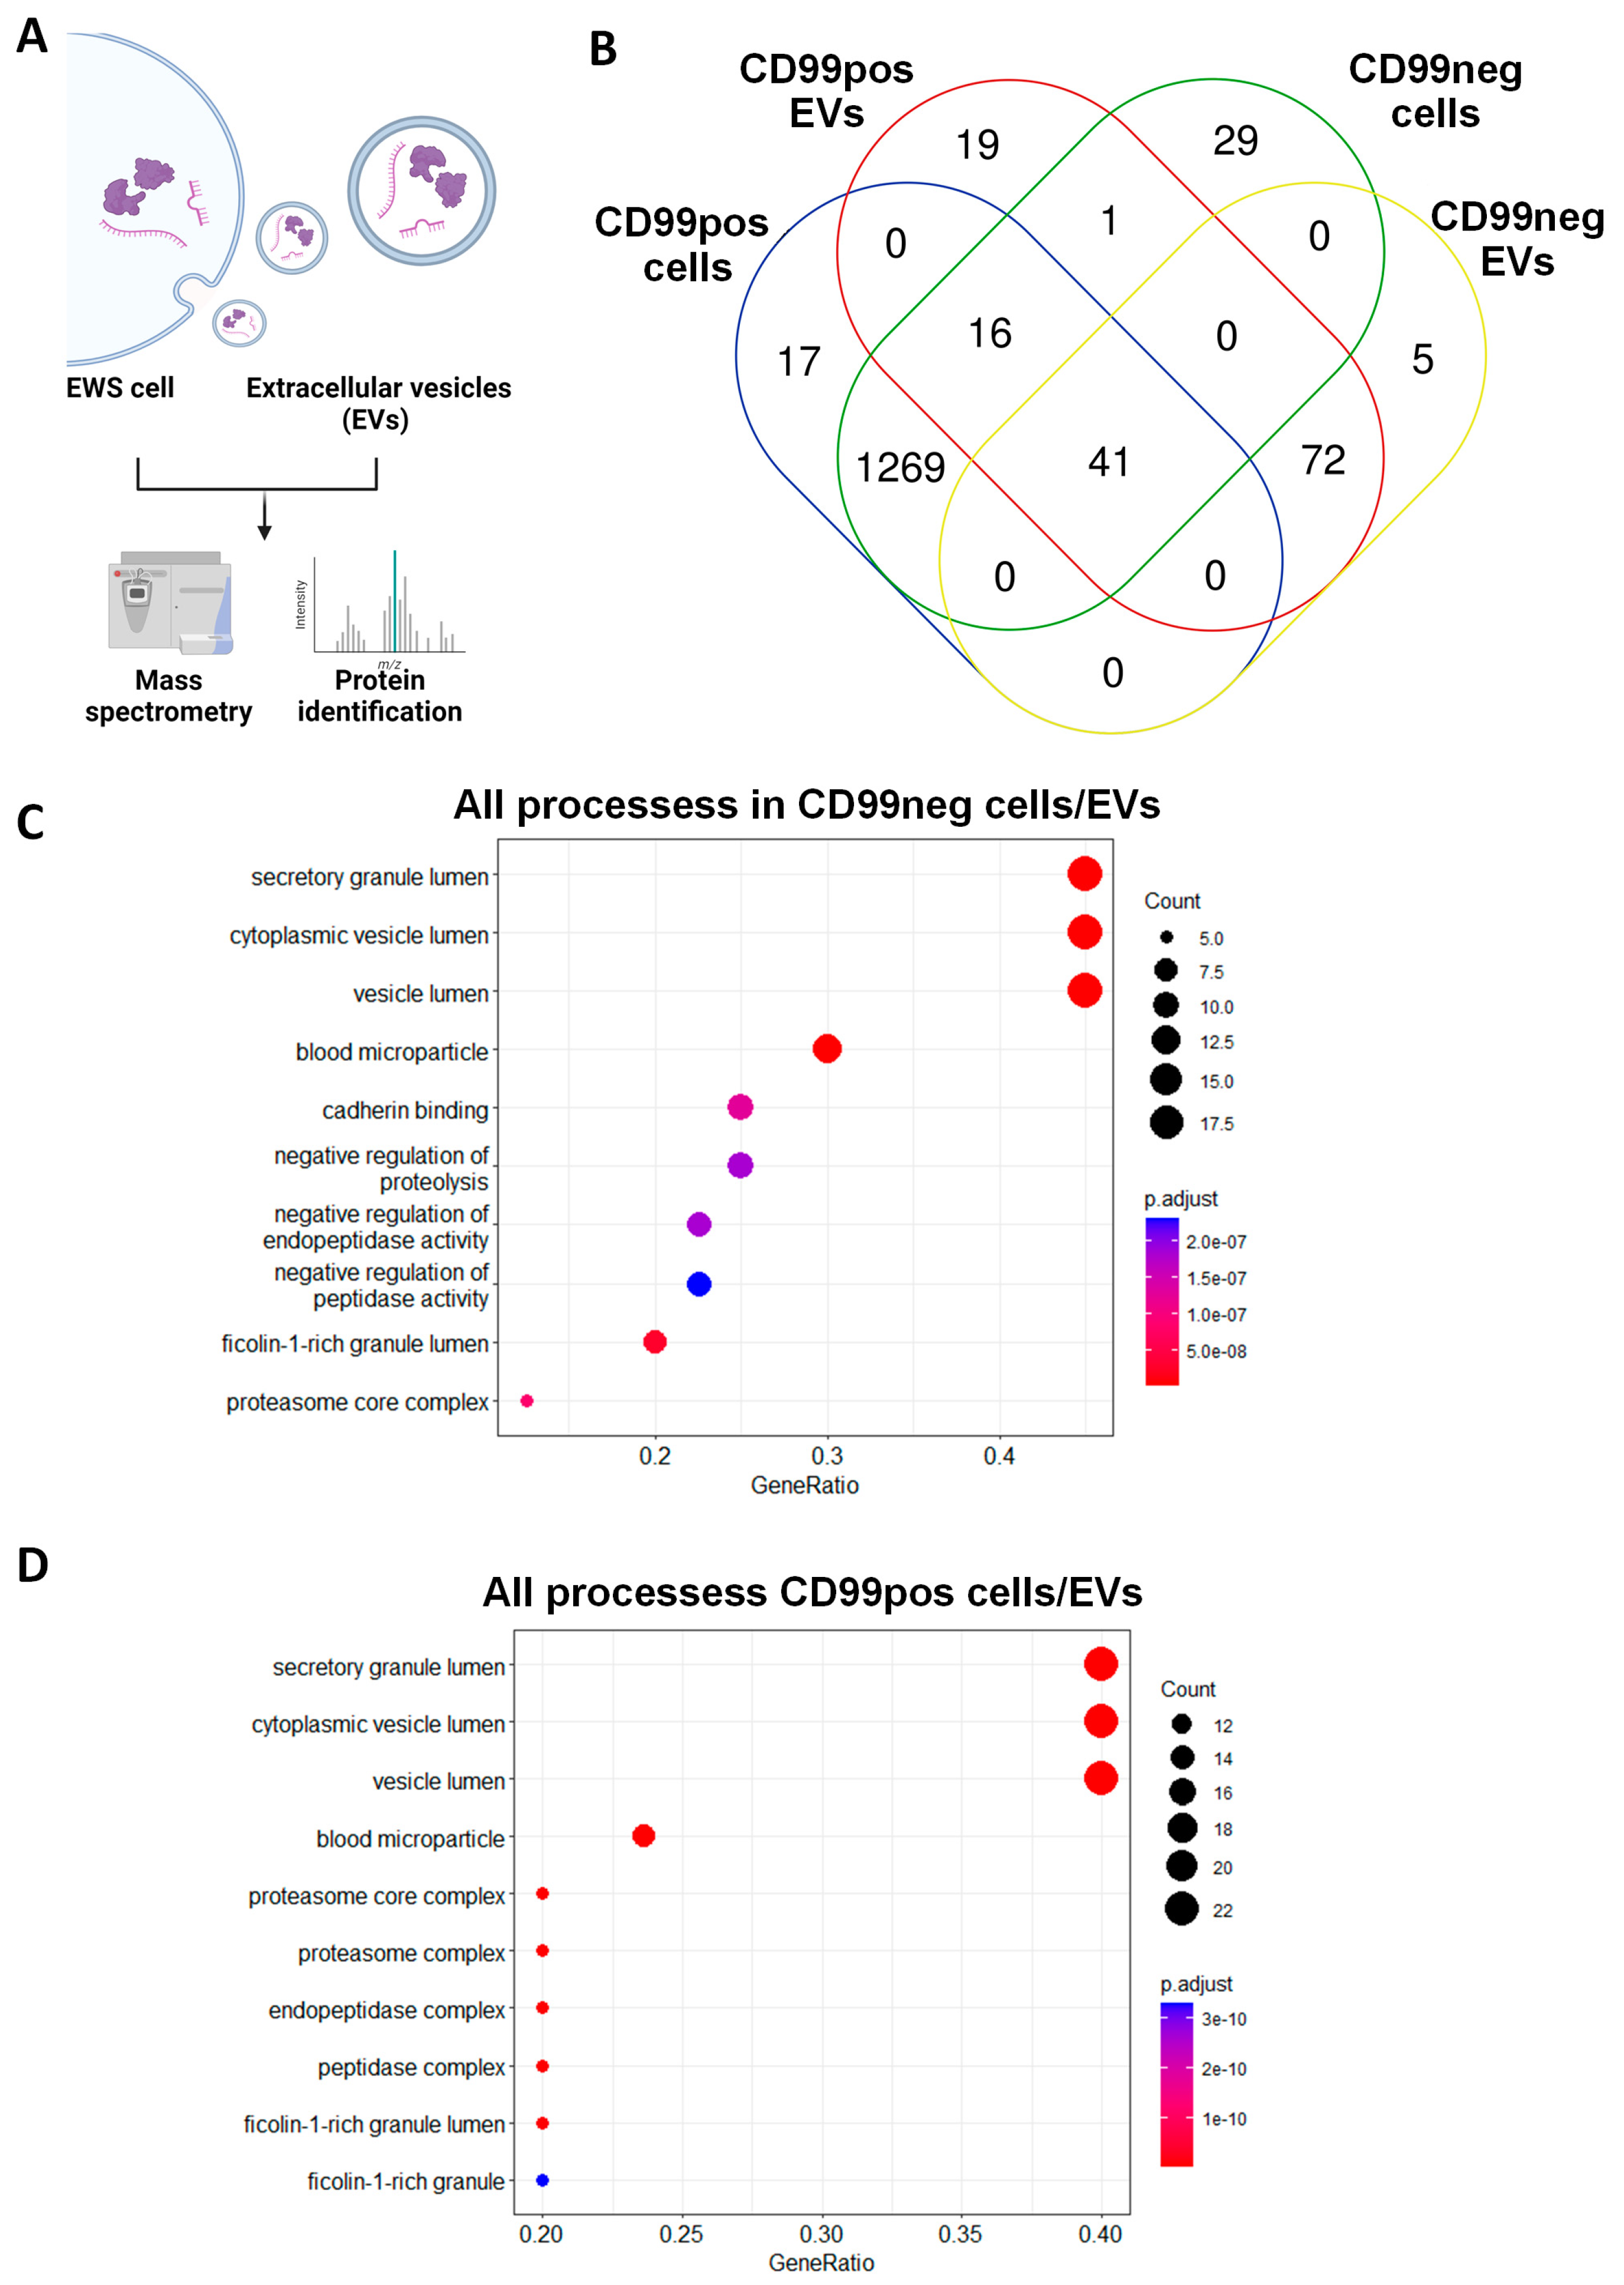

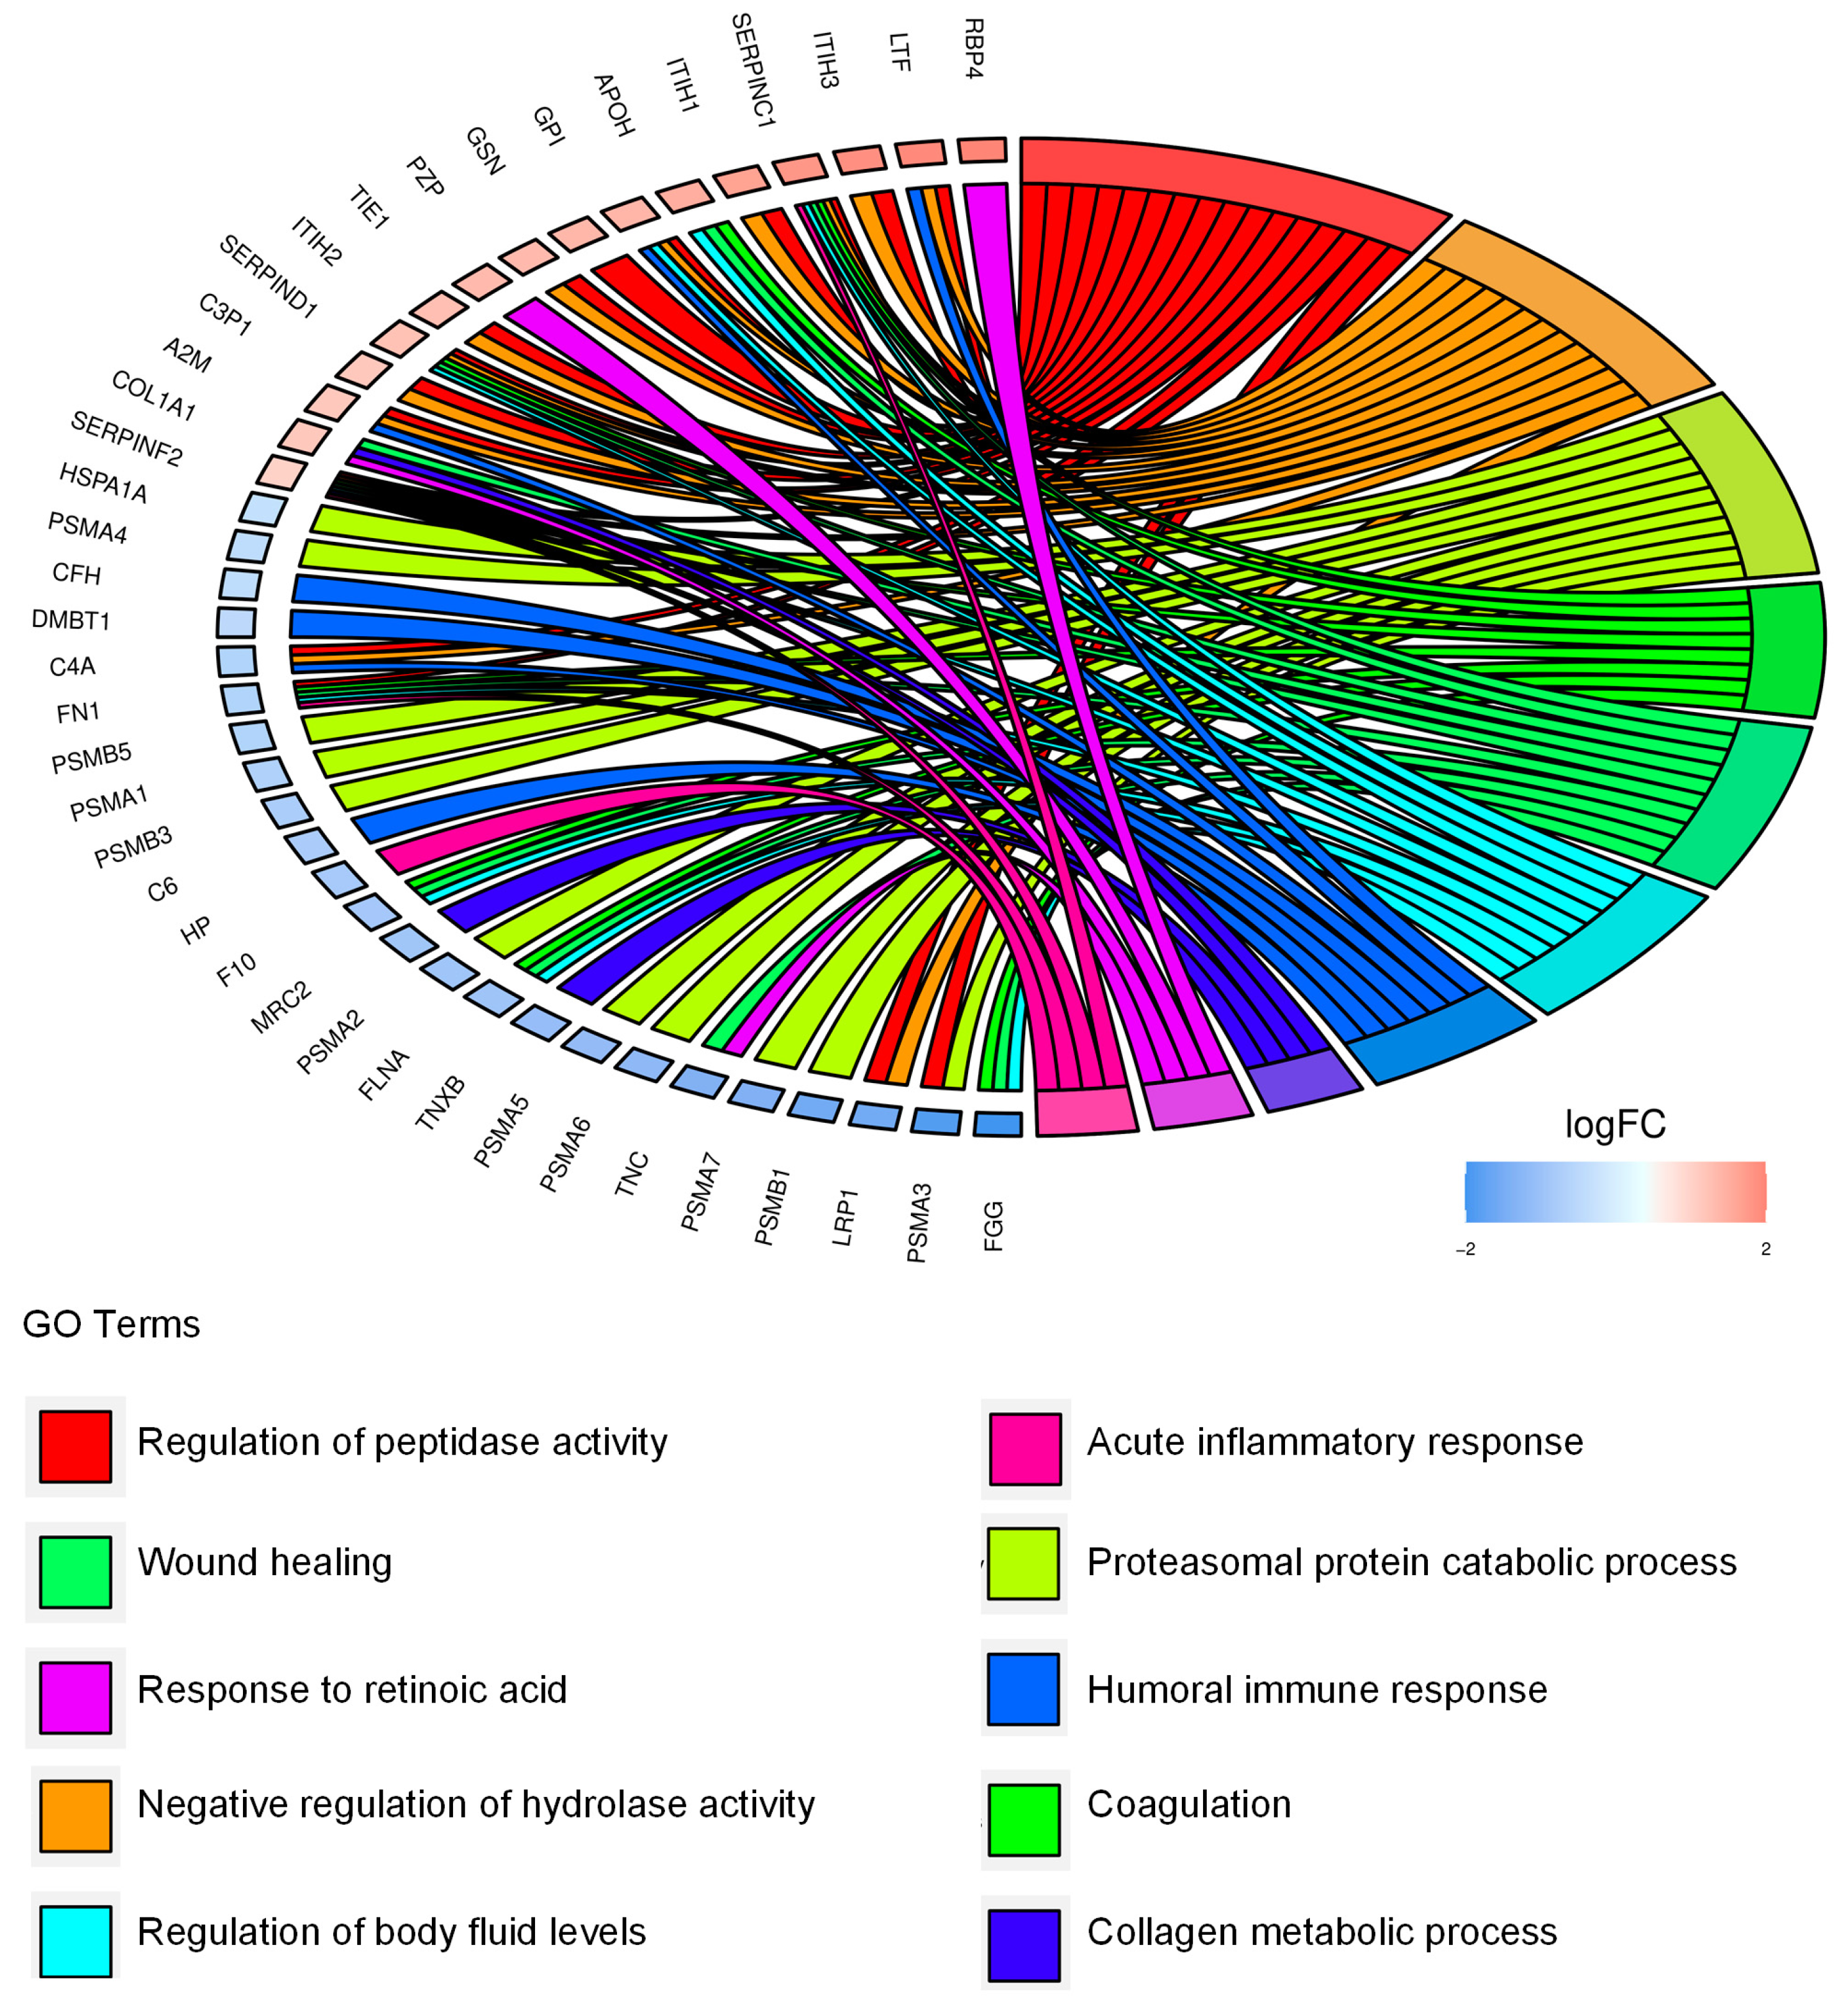
| Up-Regulated Proteins in CD99neg Cells | |||
| Accession Name | Name | Fold Change (log2) | FDR |
| ALDH1A1 | Aldehyde dehydrogenase 1A1 | 5.63 | 5.60 × 10⁻¹⁴ |
| TMSB4X | Thymosin beta-4 | 4.97 | 4.63 × 10⁻³ |
| NUP50 | Nuclear pore complex protein Nup50 | 3.28 | 6.42 × 10⁻³ |
| XAGE1 | X antigen family member 1 | 3.2 | 5.60 × 10⁻¹⁴ |
| RCN3 | Reticulocalbin-3 | 2.26 | 5.60 × 10⁻¹⁴ |
| HLA-A | HLA class I histocompatibility antigen, A alpha chain | 1.88 | 1.43 × 10⁻⁴ |
| STOM | Stomatin | 1.44 | 6.38 × 10⁻⁵ |
| LGALS1 | Galectin-1 (Gal-1) | 1.4 | 1.27 × 10⁻¹¹ |
| FTL | Ferritin light chain | 1.35 | 3.40 × 10⁻³ |
| SPR | Sepiapterin reductase | 1.27 | 2.42 × 10⁻² |
| ARHGDIB | Rho GDP-dissociation inhibitor 2 | 1.18 | 1.17 × 10⁻⁹ |
| NCAPG | Condensin complex subunit 3 | 1.15 | 1.32 × 10⁻² |
| HSPA1B | Heat shock 70 kDa protein 1B | 1.11 | 2.46 × 10⁻¹¹ |
| CPNE3 | Copine-3 | 0.941 | 3.34 × 10⁻² |
| RCN2 | Reticulocalbin-2 | 0.941 | 5.01 × 10⁻³ |
| HSPB1 | Heat shock protein beta-1 | 0.914 | 2.92 × 10⁻³ |
| CAPG | Macrophage-capping protein | 0.832 | 2.54 × 10⁻⁴ |
| ANXA1 | Annexin A1 | 0.774 | 4.49 × 10⁻⁴ |
| FH | Fumarate hydratase | 0.768 | 1.04 × 10⁻³ |
| SEPTIN2 | Septin-2 | 0.758 | 1.12 × 10⁻³ |
| EZR | Ezrin | 0.712 | 1.12 × 10⁻⁴ |
| NARS1 | Asparagine–tRNA ligase, cytoplasmic | 0.71 | 3.25 × 10⁻⁷ |
| SYPL1 | Synaptophysin-like protein 1 | 0.631 | 4.17 × 10⁻⁵ |
| Down-Regulated Proteins in CD99neg Cells | |||
| Accession Name | Name | Fold Change (log2) | FDR |
| CD99 | CD99 antigen | −1.87 | 4.51 × 10⁻² |
| SPART | Spartin | −1.58 | 5.60 × 10⁻¹⁴ |
| TPP2 | Tripeptidyl-peptidase 2 | −1.46 | 2.94 × 10⁻⁶ |
| PLEC | Plectin | −1.45 | 1.10 × 10⁻² |
| UCHL1 | Ubiquitin carboxyl-terminal hydrolase isozyme L1 | −1.16 | 2.31 × 10⁻⁶ |
| PRPH | Peripherin | −1.12 | 4.35 × 10⁻⁴ |
| PFN2 | Profilin-2 | −1.1 | 1.71 × 10⁻² |
| SUGT1 | Protein SGT1 homolog | −1.08 | 5.60 × 10⁻¹⁴ |
| UFM1 | Ubiquitin-fold modifier 1 | −1.08 | 8.38 × 10⁻⁴ |
| CRIP2 | Cysteine-rich protein 2 | −1.01 | 7.55 × 10⁻³ |
| ATAD3A | ATPase family AAA domain-containing protein 3A | −0.984 | 1.20 × 10⁻² |
| ARL3 | ADP-ribosylation factor-like protein 3 | −0.913 | 1.63 × 10⁻² |
| TUBB3 | Tubulin beta-3 chain | −0.892 | 5.47 × 10⁻⁵ |
| MIF | Macrophage migration inhibitory factor | −0.863 | 7.41 × 10⁻⁵ |
| RANBP1 | Ran-specific GTPase-activating protein | −0.838 | 1.38 × 10⁻⁵ |
| ESD | S-formylglutathione hydrolase | −0.823 | 3.13 × 10⁻³ |
| ISYNA1 | Inositol-3-phosphate synthase 1 | −0.814 | 2.25 × 10⁻² |
| NLN | Neurolysin, mitochondrial | −0.808 | 7.46 × 10⁻⁵ |
| ATXN10 | Ataxin-10 | −0.778 | 4.27 × 10⁻⁴ |
| IPO5 | Importin-5 | −0.753 | 2.58 × 10⁻² |
| HMGB1 | High mobility group protein B1 | −0.717 | 3.95 × 10⁻² |
| FSCN1 | Fascin | −0.697 | 1.08 × 10⁻³ |
| KPNA3 | Importin subunit alpha-4 | −0.685 | 1.57 × 10⁻² |
| ANXA7 | Annexin A7 | −0.679 | 1.55 × 10⁻³ |
| SF3B6 | Splicing factor 3B subunit 6 | −0.668 | 1.42 × 10⁻² |
| G3BP2 | Ras GTPase-activating protein-binding protein 2 | −0.655 | 3.52 × 10⁻² |
| PITPNB | Phosphatidylinositol transfer protein beta isoform | −0.654 | 8.42 × 10⁻³ |
| TPT1 | Translationally controlled tumor protein | −0.625 | 3.06 × 10⁻² |
| PYCR1 | Pyrroline-5-carboxylate reductase 1, mitochondrial | −0.608 | 4.07 × 10⁻⁷ |
| EIF4E | Eukaryotic translation initiation factor 4E | −0.603 | 2.84 × 10⁻² |
| ABCE1 | ATP-binding cassette sub-family E member 1 | −0.587 | 1.71 × 10⁻³ |
| Up-Regulated Proteins in CD99neg EVs | |||
| Accession Name | Name | Fold Change (log2) | p-Value |
| C1QTNF3 | Complement C1q tumor necrosis factor-related protein 3 | 1.66 | 6.94 × 10⁻³ |
| RBP4 | Retinol-binding protein 4 | 1.5 | 8.04 × 10⁻³ |
| LTF | Lactotransferrin | 1.43 | 2.00 × 10⁻⁶ |
| ITIH3 | Inter-alpha-trypsin inhibitor heavy chain H3 | 1.38 | 2.22 × 10⁻⁸ |
| IGFALS | Insulin-like growth factor-binding protein complex acid labile subunit | 1.34 | 3.44 × 10⁻⁴ |
| SERPINC1 | Antithrombin-II | 1.31 | 1.19 × 10⁻⁵ |
| ITIH1 | Inter-alpha-trypsin inhibitor heavy chain H1 | 1.17 | 1.52 × 10⁻⁵ |
| AFP | Alpha-fetoprotein | 1.09 | 1.86 × 10⁻⁵ |
| APOH | Beta-2-glycoprotein 1 | 1.03 | 4.85 × 10⁻² |
| CAT | Catalase | 1.02 | 3.89 × 10⁻³ |
| GC | Vitamin D-binding protein | 1.02 | 2.54 × 10⁻⁴ |
| GPI | Glucose-6-phosphate isomerase | 0.94 | 1.64 × 10⁻⁶ |
| GSN | Gelsolin | 0.921 | 1.56 × 10⁻⁸ |
| ALB | Albumin | 0.908 | 6.22 × 10⁻⁵ |
| PZP | Pregnancy zone protein | 0.892 | 6.90 × 10⁻⁷ |
| TIE1 | Tyrosine-protein kinase receptor Tie-1 | 0.878 | 1.24 × 10⁻² |
| ITIH2 | Inter-alpha-trypsin inhibitor heavy chain H2 | 0.832 | 1.31 × 10⁻⁵ |
| SERPIND1 | Heparin cofactor 2 | 0.802 | 4.36 × 10⁻⁸ |
| C3P1 | Putative protein C3P1 | 0.713 | 8.13 × 10⁻³ |
| A2M | Alpha-2-macroglobulin | 0.71 | 1.33 × 10⁻⁴ |
| COL1A1 | Collagen alpha-1(I) chain | 0.71 | 4.51 × 10⁻⁴ |
| SERPINF2 | Alpha-2-antiplasmin | 0.596 | 1.30 × 10⁻⁴ |
| Down-Regulated Proteins in CD99neg EVs | |||
| Accession name | Name | Fold Change (log2) | p-Value |
| HIST1H4A | Histone H4 | −2.55 | 2.71 × 10⁻⁸ |
| HIST3H2A | Histone H2A type 3 | −2.49 | 3.65 × 10⁻⁸ |
| FGG | Fibrinogen gamma chain | −2.16 | 2.07 × 10⁻³ |
| PSMA3 | Proteasome subunit alpha type-3 | −2.02 | 3.56 × 10⁻⁵ |
| LRP1 | Pro-low-density lipoprotein receptor-related protein 1 | −1.74 | 6.28 × 10⁻³ |
| PSMB1 | Proteasome subunit beta type-1 | −1.72 | 3.42 × 10⁻⁴ |
| PSMA7 | Proteasome subunit alpha type-7 | −1.61 | 1.19 × 10⁻⁴ |
| TNC | Tenascin | −1.58 | 2.72 × 10⁻⁴ |
| PSMA6 | Proteasome subunit alpha type-6 | −1.43 | 1.11 × 10⁻³ |
| PSMA5 | Proteasome subunit alpha type-5 | −1.37 | 5.83 × 10⁻⁵ |
| HIST1H2BL | Histone H2B type 1-L | −1.34 | 1.39 × 10⁻⁵ |
| TNXB | Tenascin-X | −1.33 | 8.98 × 10⁻⁸ |
| RAP1B | Ras-related protein Rap-1b | −1.27 | 2.65 × 10⁻² |
| FLNA | Filamin-A | −1.2 | 8.78 × 10⁻⁴ |
| PSMA2 | Proteasome subunit alpha type-2 | −1.19 | 5.16 × 10⁻³ |
| MRC2 | C-type mannose receptor 2 | −1.16 | 2.00 × 10⁻² |
| F10 | Coagulation factor X | −1.11 | 4.64 × 10⁻² |
| HP | Haptoglobin | −1.07 | 9.35 × 10⁻⁹ |
| TUBB4B | Tubulin beta-4B chain | −1.06 | 4.10 × 10⁻⁵ |
| C6 | Complement component C6 | −1.04 | 7.49 × 10⁻⁵ |
| LTBP4 | Latent-transforming growth factor beta-binding protein 4 | −1.04 | 7.37 × 10⁻³ |
| PSMB3 | Proteasome subunit beta type-3 | −1.03 | 6.70 × 10⁻³ |
| PSMA1 | Proteasome subunit alpha type-1 | −0.941 | 3.64 × 10⁻³ |
| PSMB5 | Proteasome subunit beta type-5 | −0.904 | 1.85 × 10⁻³ |
| FN1 | Fibronectin | −0.9 | 5.22 × 10⁻¹⁰ |
| C4A | Complement C4-A | −0.89 | 2.45 × 10⁻⁵ |
| B4GAT1 | Beta-1,4-glucuronyltransferase 1 | −0.816 | 1.78 × 10⁻² |
| HSPA8 | Heat shock cognate 71 kDa protein | −0.816 | 3.63 × 10⁻⁴ |
| DMBT1 | Deleted in malignant brain tumors 1 protein | −0.766 | 3.36 × 10⁻² |
| TUBB | Tubulin beta chain | −0.744 | 3.29 × 10⁻³ |
| CFH | Complement factor H | −0.714 | 2.93 × 10⁻⁵ |
| PSMA4 | Proteasome subunit alpha type-4 | −0.711 | 3.65 × 10⁻³ |
| HSPA1A | Heat shock 70 kDa protein 1A | −0.633 | 3.32 × 10⁻⁴ |
Disclaimer/Publisher’s Note: The statements, opinions and data contained in all publications are solely those of the individual author(s) and contributor(s) and not of MDPI and/or the editor(s). MDPI and/or the editor(s) disclaim responsibility for any injury to people or property resulting from any ideas, methods, instructions or products referred to in the content. |
© 2024 by the authors. Licensee MDPI, Basel, Switzerland. This article is an open access article distributed under the terms and conditions of the Creative Commons Attribution (CC BY) license (https://creativecommons.org/licenses/by/4.0/).
Share and Cite
De Feo, A.; Manfredi, M.; Mancarella, C.; Maqueda, J.J.; De Giorgis, V.; Pignochino, Y.; Sciandra, M.; Cristalli, C.; Donadelli, M.; Scotlandi, K. CD99 Modulates the Proteomic Landscape of Ewing Sarcoma Cells and Related Extracellular Vesicles. Int. J. Mol. Sci. 2024, 25, 1588. https://doi.org/10.3390/ijms25031588
De Feo A, Manfredi M, Mancarella C, Maqueda JJ, De Giorgis V, Pignochino Y, Sciandra M, Cristalli C, Donadelli M, Scotlandi K. CD99 Modulates the Proteomic Landscape of Ewing Sarcoma Cells and Related Extracellular Vesicles. International Journal of Molecular Sciences. 2024; 25(3):1588. https://doi.org/10.3390/ijms25031588
Chicago/Turabian StyleDe Feo, Alessandra, Marcello Manfredi, Caterina Mancarella, Joaquín J. Maqueda, Veronica De Giorgis, Ymera Pignochino, Marika Sciandra, Camilla Cristalli, Massimo Donadelli, and Katia Scotlandi. 2024. "CD99 Modulates the Proteomic Landscape of Ewing Sarcoma Cells and Related Extracellular Vesicles" International Journal of Molecular Sciences 25, no. 3: 1588. https://doi.org/10.3390/ijms25031588
APA StyleDe Feo, A., Manfredi, M., Mancarella, C., Maqueda, J. J., De Giorgis, V., Pignochino, Y., Sciandra, M., Cristalli, C., Donadelli, M., & Scotlandi, K. (2024). CD99 Modulates the Proteomic Landscape of Ewing Sarcoma Cells and Related Extracellular Vesicles. International Journal of Molecular Sciences, 25(3), 1588. https://doi.org/10.3390/ijms25031588


