Abstract
Climate change is expected to intensify the occurrence of abiotic stress in plants, such as hypoxia and salt stresses, leading to the production of reactive oxygen species (ROS), which need to be effectively managed by various oxido-reductases encoded by the so-called ROS gene network. Here, we studied six oxido-reductases families in three Brassicaceae species, Arabidopsis thaliana as well as Nasturtium officinale and Eutrema salsugineum, which are adapted to hypoxia and salt stress, respectively. Using available and new genomic data, we performed a phylogenomic analysis and compared RNA-seq data to study genomic and transcriptomic adaptations. This comprehensive approach allowed for the gaining of insights into the impact of the adaptation to saline or hypoxia conditions on genome organization (gene gains and losses) and transcriptional regulation. Notably, the comparison of the N. officinale and E. salsugineum genomes to that of A. thaliana highlighted changes in the distribution of ohnologs and homologs, particularly affecting class III peroxidase genes (CIII Prxs). These changes were specific to each gene, to gene families subjected to duplication events and to each species, suggesting distinct evolutionary responses. The analysis of transcriptomic data has allowed for the identification of genes related to stress responses in A. thaliana, and, conversely, to adaptation in N. officinale and E. salsugineum.
1. Introduction
The current climate change increases intense episodes of drought and floods also leading to higher salinity rates at the soil surface. In the case of flooding or high salt concentration, plants must withstand partial or total immersion, as well as osmotic stress leading to Reactive Oxygen Species (ROS) homeostatic variations involving oxidoreductases (ORs) [1,2].
To adapt to various biotic and abiotic stresses, plants have evolved very complex regulatory mechanisms that can modulate the cellular concentration of ROS, including superoxide anion (O2λ−), hydrogen peroxide (H2O2), and hydroxyl radical (HOλ). High levels of ROS are toxic and lead to oxidative damage. When their concentrations are controlled, ROS participate in some biological processes such as cell growth, programmed cell death, and signaling [3]. ROS homeostasis is determined by the interplay between ROS-producing and scavenging mechanisms controlled by haem and non-haem peroxidases, as well as other ORs that are part of the so-called ROS gene network [4]. These proteins belong to more than 100 classes and are encoded by multigenic families comprising two to more than one hundred members (https://peroxibase.toulouse.inrae.fr/, accessed on 30 November 2023). Members of this ROS gene network have been detected in many species [5], and some families such as superoxide dismutases (SODs) and peroxiredoxins have been found in all kingdoms. Regulation of ROS homeostasis by the ROS gene network is a major player in salinity and hypoxia acclimation and adaptation [6,7,8].
Six gene families belonging to this ROS gene network have been selected for this study. (i) The ascorbate peroxidases (APxs), which are encoded by small multigenic families (1–10 members), are only present in chloroplastic organisms and are highly conserved between species. They play a key role in H2O2 homeostasis [9]. (ii) The monofunctional (typical) catalases (Kats) are present in all aerobic organisms in which they transform H2O2 into H2O and oxygen [10]. The number of Kat genes can vary from one to three copies. (iii) The class III peroxidases (CIII Prxs), which are encoded by large multigenic families (2–150 members), are only found in Viridiplantae and their genes have been subjected to numerous duplication events, which can be species specific [11]. CIII Prxs are mainly predicted as cell wall proteins and participate in many different biological processes such as cell wall elongation and stiffening, or protection against pathogens [12,13]. (iv) The α-dioxygenases (DiOxs) belong to small families (1–2 members). Their genes are only found in plants and are rarely subjected to duplication [14]. They catalyze the initial step of the α-oxidation of polyunsaturated fatty acids. Their activation is part of the defense mechanisms induced to protect cells from oxidative stress [15]. Moreover, their enzymatic activity is part of the plant responses to saline stresses [16]. (v) The NADPH oxidases (RBOHs) are encoded by small multigenic families (1–10 members) highly conserved between species. They are transmembrane proteins located at the plasma membrane producing O2λ− extracellularly [17]. (vi) SODs are encoded by small multigene families (1–10 members). They catalyze the dismutation of O2λ− into H2O2. In plants, there are three SOD classes (FeSOD, MnSOD and CuZnSOD), and two SOD-related classes: SOD-like (SDL) and copper chaperone for SOD (CCS) [18].
Brassicaceae is a large plant family composed of 57 tribes, 349 genera and 4140 species [19]. It is highly studied for its fundamental, evolutionary and agronomical aspects. In the NCBI database (https://www.ncbi.nlm.nih.gov/genome/?term=Brassicaceae, accessed on 30 November 2023) [20], 96 genomes are available, as well as 237,803 Sequence Read Archives (SRAs), mainly from Arabidopsis thaliana (166112) and Brassica napus (21486). For this study, three Brassicaceae species have been chosen based on the following criteria: genomic sequences and transcriptomic data availability, taxonomic proximity, and capacity to adapt to hypoxia or salt stress. A. thaliana has been chosen as a “reference” species (not halophytic, not resistant to hypoxia), Eutrema salsugineum (formerly Thellungiella halophila) as a halophytic species, and Nasturtium officinale (watercress) as a semi-aquatic species adapted to hypoxia.
To better understand the mechanisms of plant adaptation to salt stress or hypoxia, we have performed two complementary approaches. On the one hand, we have performed a complete and exhaustive phylogenomic analysis to see whether the number of genes encoding each of the above-described OR families was correlated to the capacity of the plants to cope with salt stress or hypoxia. In this respect, to complement the available genomic sequence of N. officinale, we provide new genomic data resulting from the assembly of larger DNA fragments compared to a previous study [21]. As a tetraploid species, N. officinale was also used to study the pseudogenization process/rate of two gene copies (ohnologs) in the six OR gene families. On the other hand, taking advantage of the availability of transcriptomics data, we have looked at the changes in the level of expression of the selected ORs to see if the regulation of some of them is modified depending on the capacity of the plants to cope with salt stress or hypoxia.
2. Results and Discussion
2.1. A New Genome of N. officinale
When this work started, no genomic data were available for N. officinale. Commercially available seeds were sown, and the genomic DNA was extracted from young leaves of 17 d old plantlets. The quality of the DNA has been checked and most of the DNA fragments were larger than 90 kb (Figure S1). The HiFiasm de novo assembler, initially designed for PacBio HiFi reads, produced a complete primary sequence comprising 2667 scaffolds, with the largest one at almost 12 Mb and more than 50% larger than 1 Mb (N50) (Figure S2). The overall coverage of the genome was 57x The calculated assembly size of N. officinale (primary total length of 647 Mb) was twice as big as the heterozygous genome size of 395 Mb estimated with the jellyfish tool [22], consistent with the value of 377 Mb previously determined by flow cytometry [23]. The observed difference suggested that the sequenced DNA could correspond to an admixture of genotypes. In addition, a BUSCO of 98.8% was calculated for the primary assembly with the brassicales_odb10.2020-08-05 lineage as a reference. This result indicated a high completeness of the genome sequence. A duplicated BUSCO of 74.1% could also be calculated, which was consistent with the tetraploidy of N. officinale [24].
At the time that we had finalized the genomic sequence of N. officinale, another sequencing project was released [21]. This former sequencing was performed with Illumina short reads, resulting in a number of scaffolds four times higher than in our work (10793). The value of N50 was 94.2 kb and the number of contigs was 14,564 (https://www.ncbi.nlm.nih.gov/datasets/genome/GCA_900406445.1/, accessed on 6 November 2023). The overall sequence was 216.1 Mb in length. This size was smaller than that obtained with our sequencing data, consistent with the fact that our data corresponded to several populations, most probably three, with a major one named Pop 1 (Table S1). This was mostly due to the use of commercial seeds containing mixed populations. In addition, pairs of genes with a lower percentage of identity between them than with genes from different populations (90% versus 98%, respectively) have been considered as ohnologs and numbered A and B. Ohnologs are actually paralogs originating from a whole-genome duplication event [25]. The BUSCO and the coverage of the former genome were comparable with those of the genome we sequenced, with values of 98.3% and 59.0 x, respectively. As an example, only three sequences (NoffAPx02-1A, NoffPrx02-3B and NoffRboh[P]07-1B) were not found in this previous genome (Table S1).
As mentioned above, we could conclude that the new genomic data provided by this study correspond to three populations of plants with a major one (Pop 1 in Tables S1 and S2). The availability of the former genomic sequence of N. officinale allowed us to clarify the distribution of the ohnolog and homolog genes between these populations (Tables S1 and S2). The complementary analyses of the two genomes show the presence of pairs of ohnologs and pseudogenes, as well as the gain and loss of orthologs in the gene families of interest (see Section 2.2). On the other hand, our genome with much longer scaffolds allowed for the determination of more precise gene distribution in the genome in the case of genes located in close proximity (Table S1). Indeed, the 189 genes identified in N. officinale in this study have been detected in 81 scaffolds in the case of our assembly vs. 159 in the case of the former genome. For example, the A copies of NoffPrx69, 70, 71, 72, 73 (our work) are located on the same scaffold (ptg000119), whereas the corresponding genes of the previous genome are located on three different scaffolds (186 g, 3 g and 655 g) (Table S1). A similar situation was found for the B copies of the same genes. The localization of these five Prx genes on a single scaffold reflects the distribution of the ortholog genes in the A. thaliana genome.
The next step of this study was to perform a comparative phylogenetic analysis of six families of genes encoding proteins of the ROS network in three Brassicaceae adapted to different environmental conditions, N. officinale, E. salsugineum and A. thaliana.
2.2. Gene Duplications, Gains and Losses
A. thaliana and N. officinale belong to the Camelineae and Cardamineae tribes, respectively, which have diverged 20–30 MYA [26,27]. E. salsugineum, which belongs to the Eutremeae tribe, has diverged earlier, i.e., 24–35 MYA. A. thaliana and E. salsugineum are diploid species. It was recently shown that E. salsugineum did not experience an independent whole genome duplication event [28]. Conversely, N. officinale is a tetraploid. However, since this genome duplication event, some ohnologs could have been lost or pseudogenized.
In E. salsugineum, 10 APxs, 3 Kats, 74 CIII Prxs, 2 DiOxs, 11 RBOHs and 9 SODs have been found, including only eight pseudogenes for CIII Prxs (Table 1 and Table S2). The orthogroup analysis showed that only three CIII Prxs orthologs have been lost compared to A. thaliana, meaning that 15.9% of the orthologs of the CIII Prxs have been lost or are in a process of pseudogenization in E. salsugineum. No loss was observed for the five other gene families studied.

Table 1.
APxs, Kats, CIII Prxs, DiOxs, RBOHs and SOD genes have been annotated from the three Brassicaceae species (Table S2). Open reading frames with relevant predicted functional domains and pseudogenes (Ψ, corresponding to truncated amino acid sequence, nucleotidic sequences with in-frame stop codons, frameshifts or gaps) are indicated. Gene gains and losses have been determined using the A. thaliana orthologs as references. Only A and B genes of the major population of N. officinale have been considered for the calculations (Pop 1, Table S2).
In N. officinale, 14 APxs, 5 Kats, 128 CIII Prxs, 3 DiOxs, 19 RBOHs and 18 SODs have been found, including 2, no, 18, no, 4 and 1 pseudogenes, respectively (Table 1 and Table S2). The orthogroup analysis showed that 2, 1, 16, 1, 1 and no orthologs, respectively, have been lost compared to A. thaliana, meaning that 23 to 25% of the ohnologs of five out of the six OR families of interest have been lost or are on the way to be lost by pseudogenization in N. officinale. Most of the gain or loss events are not common to N. officinale and E. salsugineum consistent with their distinct tribal classification: only 24% of the events observed in N. officinale also occurred in E. salsugineum (Table S2). However, some events are common (Prx04, 16, 17, 38, 44 and 58) and these events could be associated with a gene-specific selection pressure.
Two CIII Prx genes (Prx16 and 22) have been detected in Camelineae and Cardamineae while they are missing in Eutremeae (not found in E. salsugineum and Eutrema halophilum). The four CIII Prx genes (Prx08, 14, 63 and 68), which are missing in N. officinale and E. salsugineum, have been gained in A. thaliana through recent tandem, segmental or chromosomal duplications [29]. The chronology of these events is confirmed by the presence of Prx63 and Prx68 only in A. thaliana and in Arabidopsis species (e.g., Arabidopsis lyrata) and their lack in the other Brassicaceae tribes (e.g., Prx63 and 68 are not detected in Capsella rubella and Brassica napus). Since the five other gene families (APxs, Kats, DiOxs, RBOHs and SODs) are much smaller than the CIII Prx families, they could be less subjected to the gain or loss of genes or pseudogenization events. Alternatively, the higher evolution rate of CIII Prxs could also be related to the diversity of their functions vs. the more specific functions of the five other gene families.
Independently of the sequence, the percentages of identity between the protein sequences of a given ortholog between the three species are very similar, with an average value of 85.7 ± 7.4% (Table S2). In addition, the percentages of identity are in the same range between (1) the orthologs, on the one hand, and (2) the ohnologs on the other hand, with an average value of 89.0% ± 10.3% for the latter, meaning that the selective pressure is sequence dependent, but similar at the intra- or inter-species levels. The Prx35 sequences are among the less conserved between species exhibiting 88.0% identity between ohnologs and 87.0% identity between orthologs (N. officinale vs. A. thaliana). However, they show 93.0% identity intra-tribe (i.e., between Camelineae), as shown by a BLAST query using the Redoxibase (https://peroxibase.toulouse.inrae.fr/; accessed on 30 November 2023). Conversely, the Prx42 protein sequences are highly conserved between the three species exhibiting 98.0% identity between the N. officinale ohnologs, 97.0% identity between A. thaliana and N. officinale orthologs, and 97.0–98.0% with the protein sequences of their orthologs from other Brassicaceae tribes (Arabideae, Brassiceae, Thlaspideae). This could be related to the fact that Prx42 have crucial functions. Indeed, we have not yet been able to isolate prx42 mutants (F. Passardi and C. Dunand, unpublished work).
The Ka/Ks ratio reflects the molecular evolution rate of a gene family. The ratio between the non-synonymous (Ka) and synonymous (Ks) substitution rates can be superior, inferior or equal to 1, indicating positive, purifying, or neutral selection, respectively [30]. The Ka/Ks ratios were calculated independently for each OR gene family (Figure S3). All of them were smaller than 1 (mean values between 0.03 and 0.19). It means that the mutations detected between orthologs and ohnologs are mostly synonymous, indicating that the evolution of the different OR families was driven by purifying selection pressure. This is probably related to the fact that the regulation of ROS homeostasis is highly critical, thus leading to low rates of evolution in the OR family genes. In addition, the percentage of identity is lower when one ortholog or one ohnolog is a pseudogene. These two results confirmed the hypothesis that the divergence between sequences (orthologs and ohnologs) is sequence dependent, thus possibly related to selective pressure. A similar evolutive scenario has already been described for the non-specific lipid transfer protein gene family in Nicotiana tabacum with a high percentage of identity between homologous sequences of three Nicotiana sp. and very low Ka/Ks ratios [31].
2.3. Differentially Expressed OR Genes upon Salt Stress
The differential expression of the OR genes of interest has then been analyzed upon salt stress in A. thaliana and E. salsugineum. Two experiments have been selected: (i) A. thaliana seedlings have been submitted to salt stress (50 mM NaCl) for 10 d in in vitro cultures [32], and (ii) 6-week-old E. salsugineum seedlings have been irrigated over 24 h with a 300 mM NaCl solution [33]. Both RNA-seq analyses were performed on roots.
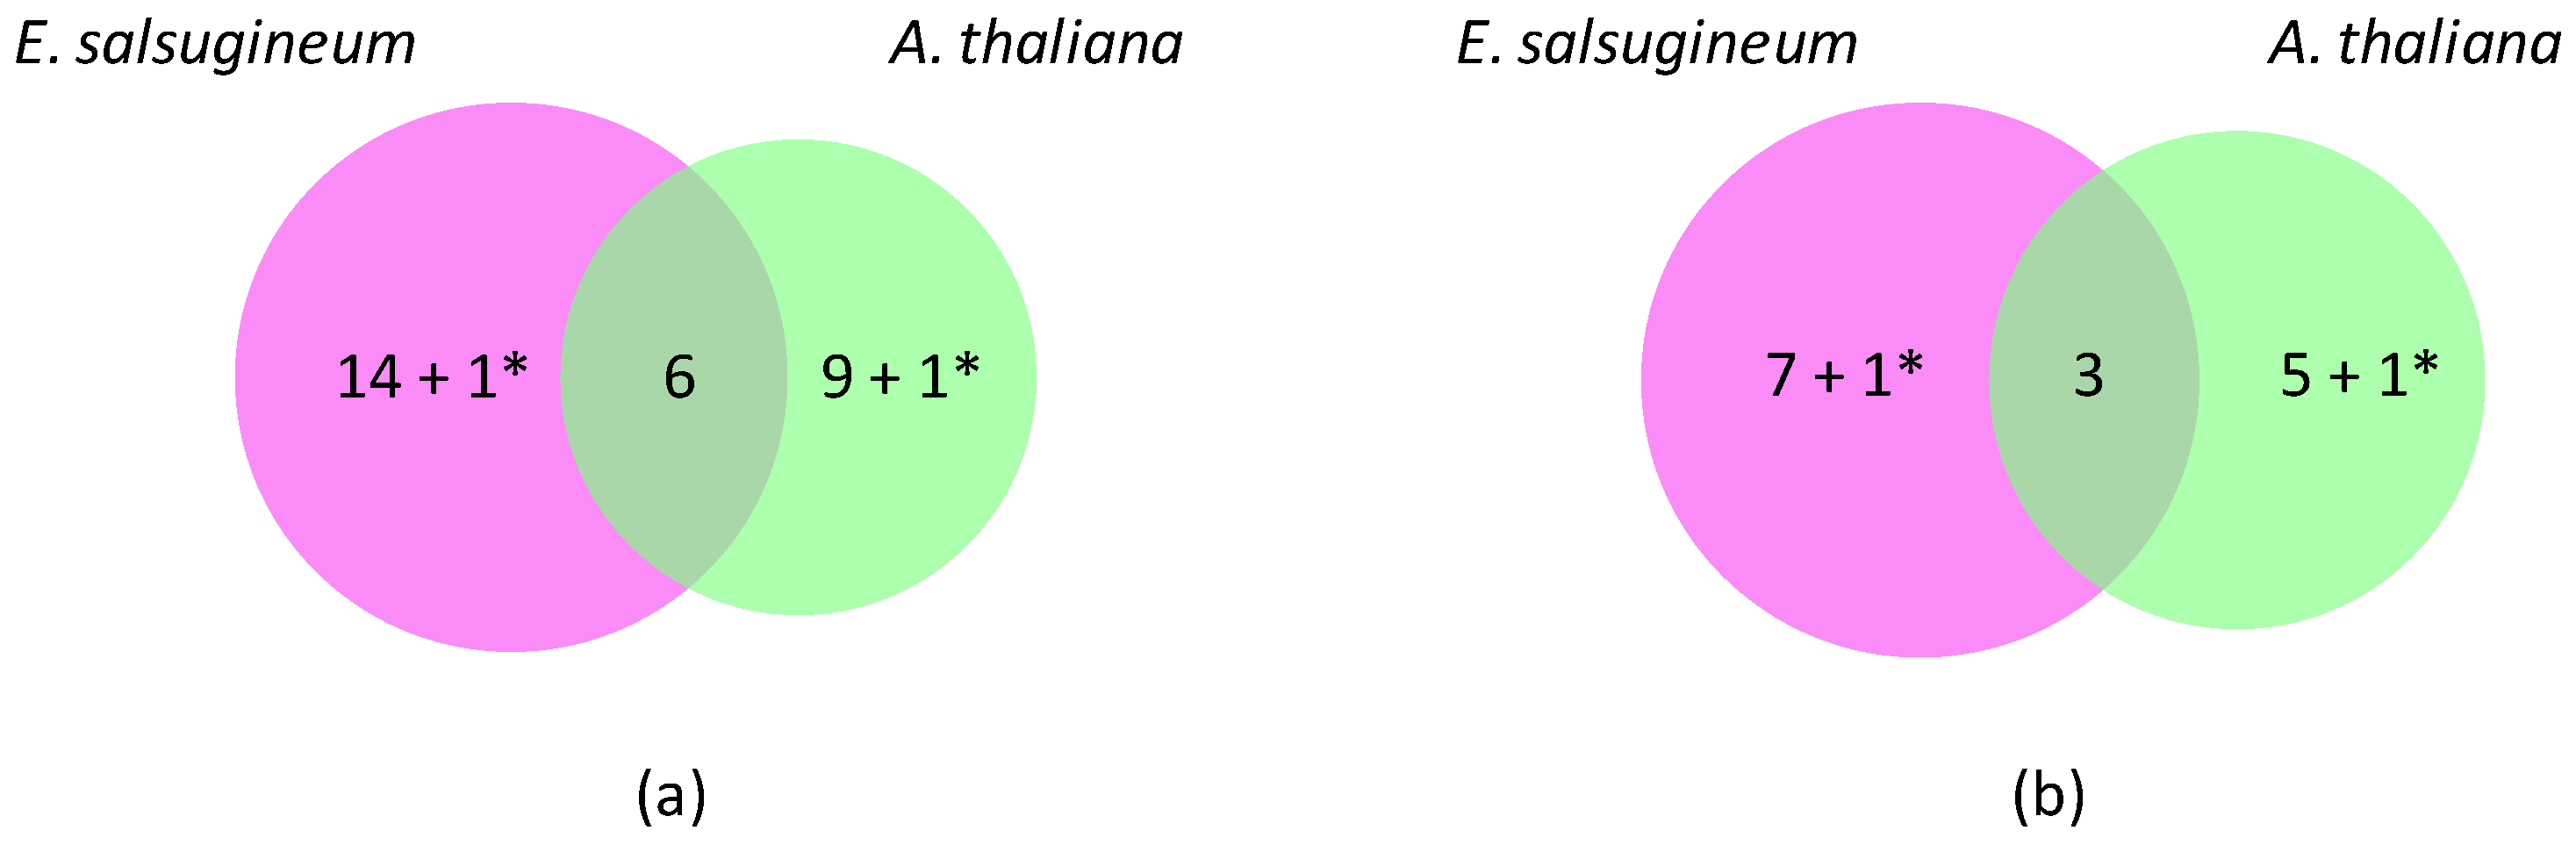
Under these conditions, 46 OR genes with a significant FC (fold change) value have been detected (Figure 1). Eight CIII Prxs (two are up-regulated and six are down-regulated) and one Kat show a change in their expression level in a similar way in both plants (Table S3). Conversely, one CIII Prx is up-regulated in A. thaliana (AtPrx10), whereas its ortholog is down-regulated in E. salsugineum (TsPrx10), and one APx is down-regulated in A. thaliana (AtAPx01), whereas its ortholog is up-regulated in E. salsugineum (TsAPx01) (Table 2).
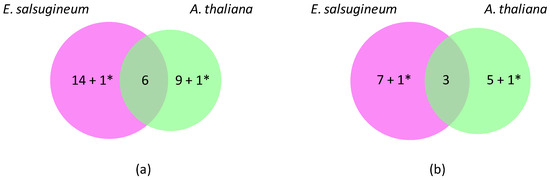
Figure 1.
Differentially expressed OR genes in A. thaliana and E. salsugineum under salt stress. (a) Venn diagram showing specific (25) and common (6) down-regulated genes. (b) Venn diagram showing specific (14) and common (3) up-regulated genes. A. thaliana has thus been chosen as a reference to calculate the number of differentially expressed genes. * corresponds to genes with opposite regulations (Prx10 and APx01).
Table 2.
OR genes regulated in contrasted manner between A. thaliana and E. salsugineum upon salt stress. The gene nomenclature is that of the online database Redoxibase (https://peroxibase.toulouse.inrae.fr/; accessed on 30 November 2023). Differential expression data are presented as log2(FC).
A total of 21 genes were specifically regulated in E. salsugineum, among which 6 were up-regulated and 15 down-regulated (Table 3). Among them, there are 15 CIII Prxs, 2 APxs, 2 DiOxs and 2 SODs. On the other hand, 14 genes were specifically regulated in A. thaliana, 5 were up-regulated and 9 were down-regulated (Table 3). Among them, there are nine CIII Prxs, two RBOHs, one Kat and three SODs. Some of the encoded proteins were found to be up- or down-accumulated by quantitative proteomics in E. salsugineum 4-week-old plants subjected to a 24 h watering with a 300 mM NaCl solution [34]. Some of these proteomics data show discrepancies with transcriptomics data, e.g., TsAPx02, TsPrx21, TsKat02 and TsCSD01 in Table 3 (see also [33,34]). This kind of difference has been described many times (for a review, see [35]).
Table 3.
APxs, Kats, CIII Prxs, DiOxs, RBOHs and SODs differentially expressed upon salt stress in E. salsugineum and A. thaliana. The gene nomenclature is that of the online database Redoxibase (https://peroxibase.toulouse.inrae.fr/; accessed on 30 November 2023). Differential expression data are presented as log2(FC). ‘No transcript’ indicates that no transcripts were detected, and ‘FDR > 0.05’ that the calculated FDR is greater than 0.05 (not statistically significant). (+) and (−) in the second [34] and third [36] columns indicate that the proteins were found to be up- or down-accumulated upon salt stress, respectively.
AtPrx01, AtPrx44 and AtPrx73 are repressed by salt stress in the roots of both species (Table S3). These genes are mainly expressed in roots and control root hair length in A. thaliana [37]. AtPrx34, which is required for root elongation [38], is repressed in A. thaliana, but not differentially expressed in E. salsugineum. The observed modifications of CIII Prx expression are thus with a reduction of root growth in A. thaliana upon salt stress. Indeed, the salt stress response is a complex one in roots with a first phase of growth inhibition, followed by a second one of growth recovery [39]. In E. salsugineum, it was shown that salt stress results in an increased oxidation level of 159 Cys residues within 107 different proteins including proteins of the ROS network (TsPrx30, 49 and 71; TsKat02; TsCSD01). Interestingly, the CIII Prx homologous to TsPrx03, 07 and 56 are down-regulated in Mesembryanthemum crystallinum, a plant highly tolerant to salinity, after exposure to salt stress like in E. salsugineum, suggesting a role for these genes in adaptation to salinity [40].
In addition, none of the genes duplicated in E. salsugineum (TsPrx22, 33 and 38; APx03; Rboh07) or of the A. thaliana genes corresponding to genes lost in E. salsugineum (AtPrx22, 33 and 38) have a modified level of expression upon salt stress, suggesting that they play no critical role for the adaptation to salt stress (Table S2).
2.4. Differentially Expressed OR Genes upon Hypoxia
Another pair of plants has been selected to study the differential expression of the OR genes of interest upon hypoxia: A. thaliana, which is sensitive to hypoxia, and N. officinale, which is tolerant. The A. thaliana data originate from a comprehensive meta-study constituted by 29 RNA-seq datasets selected through a keyword search [41]. Instead of providing FC values, these datasets offer a HN-score, reflecting the trend of a gene being up- or down-regulated across all the experiments included in the study. These scores enabled us to compare the way in which a given gene is regulated, although they do not provide information on the extent of differential expression between control and treated plants. For N. officinale, the hypoxia stress was induced by submerging plants at the five or six-leaf stage in water for 24 h and the RNA-seq experiments were performed on the stems [42].
Upon hypoxia, 84 genes for which a significant FC value or a HN-score different from zero were found, as well as 28 genes of N. officinale for which no transcripts were detected (Table S3). Altogether, 36 genes were regulated in A. thaliana and N. officinale upon hypoxia, among which 10 and 12 were down- or up-regulated in both plants, respectively (Figure 2). Eleven genes were down-regulated in A. thaliana, but up-regulated in N. officinale. In contrast, three genes were up-regulated in A. thaliana but down-regulated in N. officinale (APx02, Rboh04 and FSD01) (Table 4). In addition, 34 genes were down-regulated and 12 up-regulated in A. thaliana upon hypoxia, whereas only 2 genes were specifically up-regulated in N. officinale.
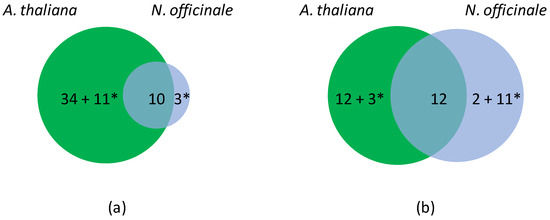
Figure 2.
Differentially expressed OR genes in A. thaliana and N. officinale upon hypoxia. (a) Venn diagram showing unique (48) and common (10) down-regulated genes. (b) Venn diagram showing unique (28) and common (12) up-regulated genes. Note that the experimental data do not allow distinguishing ohnologs in N. officinale. A. thaliana has thus been chosen as a reference to calculate the number of differentially expressed genes. * corresponds to genes with contrasted regulations.
Table 4.
OR genes regulated in contrasted manner between A. thaliana and N. officinale upon hypoxia. The gene nomenclature is that of the online database Redoxibase (https://peroxibase.toulouse.inrae.fr/; accessed on 30 November 2023). Differential expression data are presented as log2(FC).
As in the case of the salt stress, it was possible to identify genes specifically regulated in A. thaliana upon hypoxia (Table 5). Thirty-five genes were down-regulated, among which included 23 CIII Prxs, 3 APxs, 1 DiOx, 1 Rboh, 2 Kats and 4 SODs. Fifteen genes were up-regulated among which nine were Prxs and three were Rbohs. Conversely, only two genes were specifically up-regulated in N. officinale: Prx38 and Rboh05.
Table 5.
APxs, Kats, CIII Prxs, DiOxs, RBOHs and SODs differentially expressed upon hypoxia stress in N. officinale and A. thaliana. The gene nomenclature is that of the online database Redoxibase (https://peroxibase.toulouse.inrae.fr/; accessed on 30 November 2023). Differential expression data are presented as log2(FC). Differential expression data are presented in log2(FC) for N. officinale and HN-score for A. thaliana [42]. ‘No transcript’ indicates that no transcripts were detected, ‘FDR > 0.05’ that the calculated FDR was greater than 0.05 (not statistically significant), and [P] that no transcripts were detected because the gene was annotated as a pseudogene.
AtPrx07, AtPrx44 and AtPrx73 were found to be repressed in A. thaliana and not expressed in N. officinale (Table 5). AtPrx44 and AtPrx73 control root hair length in A. thaliana as shown by the phenotyping of mutants impaired in these genes and of over-expressors [37]. Yet, hypoxia inhibits root apical meristem (RAM) activity but increases root hair density and length [43].
AtRboh04/AtRBOHD was found to be up-regulated in many studies devoted to the analysis of the response of A. thaliana to hypoxia (HN-score of 26 out of the 29 analyzed sets of data), whereas it is weakly repressed in N. officinale (Table S3). This is consistent with the fact that the AtRboh04-mediated ROS burst induces genes required for hypoxia acclimation [44,45,46]. AtRboh04 expression is detected in all organs, and AtRBOH04 could be the source of H2O2 in both roots and shoots during hypoxia.
As previously shown [47], AtPrx04, AtPrx05 and AtPrx28 are induced in A. thaliana upon hypoxia, but they are not differentially expressed in N. officinale (Table 5). As for E. salsugineum upon salt stress, none of the three duplicated genes in N. officinale is induced upon hypoxia (NoffPrx17-2B, 44-2A and 44-2B), meaning that their role in the adaptation to hypoxia is not critical. In the same way, the loss of several gene copies does not prevent N. officinale from being adapted to hypoxia (NoffPrx04-1A, 05-1B, 30-1B, 32-1B, 46-1A, 58-1B, and 61-1B; NoffDiOx01-1B; NoffRboh07-1A). Their orthologs in A. thaliana undergo changes in their regulation being either up- or down-regulated, thus suggesting a role in the response to hypoxia.
The perception of both saline stress and hypoxia first occurs at the root level when plants are moderately overflooded, but developmental effects, such as growth inhibition, can be also observed in the aerial part of the plants. Changes in gene expression in response to these stresses can therefore be rapidly detected after perception in the root, but also in the shoot following signal transduction [36].
About one third of the A. thaliana OR genes differentially regulated upon hypoxia or salinity were actually responding to both stresses, among which were 2 APxs, 1 Kat, 17 Prxs, 4 SODs, and 2 Rbohs. AtPrx10 was identified as one of those genes and was previously shown to be involved in adventitious root formation, its mutant being impaired in root regeneration from leaf explants [48]. These genes could be part of a more general answer to abiotic stresses. None of them correspond to genes lost or gained in either genome. In addition, AtPrx62 and its N. officinale ortholog were both induced during hypoxia (Table S3). Now, AtPrx62 promotes root hair growth at low temperatures [49], which suggests that AtPrx62 could be associated with root growth regulation in response to different stresses and induced even in tolerant species.
The number of genes belonging to the six OR gene families expressed in the adapted species or in the sensitive one and differentially regulated upon salt stress is lower than upon hypoxia. This is probably because many more experiments have been included in the latter case. However, for each stress, it was possible to identify genes specifically regulated either in A. thaliana or in the tolerant species and genes regulated in both cases.
3. Materials and Methods
3.1. Growth of N. officinale
N. officinale seeds (NAST-OFFI, Semences du Puy, Le Puy-en-Velay, France) were sown directly on water-saturated soil and grown with 50% humidity, at 21 °C upon a 13 h light/11 h dark cycle. The leaves were collected after 17 d, frozen in liquid nitrogen and stored at −80 °C, prior to DNA extraction.
3.2. HMW DNA Extraction
DNA was isolated from young leaves using a Genomic-tips 500/G kit (Cat No./ID: 10262, QIAGEN, Courtabœuf, France) following the tissue protocol extraction. Briefly, 2 g of young leaf material was ground in liquid nitrogen with a mortar and pestle. After 3 h of lysis at 50 °C and one centrifugation step, DNA was immobilized on the provided column. After several washing steps, DNA was eluted from the column, then desalted and concentrated by alcohol precipitation. The DNA was resuspended in the EB buffer. The DNA amount was assessed using a NanoDrop One spectrophotometer (Thermo Fisher Scientific, Illkirch-Graffenstaden, France) and a Qbit 3 Fluorometer using the Qbit dsDNA BR assay (Invitrogen, Illkirch-Graffenstaden, France). The size of the DNA fragments was determined using the FemtoPulse system (Agilent, Santa Clara, CA, USA) (Figure S1).
3.3. N. officinale Genome Sequencing: HiFi PacBio Library Preparation
According to the manual ‘Procedure & Checklist—Preparing HiFi SMRTbell Libraries using the SMRTbell Express Template Prep Kit 2.0′ (PN 101-853-100, Pacific Biosciences of California, San Diego, CA, USA), the HiFi libraries were prepared with 10 µg DNA sheared by using the Megaruptor 1 system (Diagenode, San Diego, CA, USA) to obtain a 15–20 kb average size. Size-selected libraries were sequenced on the PacBio Sequel II system in CCS mode for 30 h (Pacific Biosciences of California). To assess the quality and the completeness of the genomes, we performed BUSCO (version 5.4.4) analysis with the brassicales_odb10.2020-08-05 lineage as a reference [50].
3.4. Genome Annotation
We have annotated the newly sequenced N. officinale genome and the one deposited at NCBI (http://www.ncbi.nlm.nih.gov/datasets/genome/GCA_900406445.1/, accessed on 7 February 2023, [21]) with Braker3 [51]. We have also performed a functional annotation with InterProScan [52]. The v1.0 version of the genomic sequence of E. salsugineum (Esalsugineum_173_v1.fa) and the corresponding annotation file (Thalophila_173_gene.gff) were downloaded from Phytozome (http://phytozome-next.jgi.doe.gov/info/Esalsugineum_v1_0, accessed on 11 April 2023) [53]. From the perspective of more exhaustive evolutionary analysis, the prediction of pseudogene sequences was performed with P-GRe [54] in order to detect potential gene losses (pseudogenization).
Codon-based alignments of the coding regions were performed with MACSE v2 [55] for each orthogroup in each OR family, with default parameters, except the gap end penalty set to 8. Ka, Ks and subsequent Ka/Ks ratios were calculated from these alignments for each pair of sequences using the method of model averaging (MA) implemented in the KaKs_calculator 3.0 [56].
3.5. Phylogeny
Six gene families belonging to this ROS gene network have been extracted from the annotated genome using their PFAM ID. These families have been selected based on the two following criteria: the number of gene copies (possibly subjected to duplications), and the level of sequence conservation (possibly subjected to selective pressure). To precisely define the presence or absence of sequences in comparison with A. thaliana, the orthology and ohnology relationships were analyzed. All the protein sequences annotated and used in this study have been made available in the Redoxibase (https://peroxibase.toulouse.inrae.fr, accessed on 30 November 2023) [57]). Multiple alignments of the sequences were made with ClustalW [58]. Alignment curation and tree construction (PhyML) were made using NGPhylogeny.fr (https://ngphylogeny.fr/, accessed on 2 October 2023) [59]. In parallel, the orthogroups were inferred via the OrthoFinder software [60].
3.6. RNA-Seq Data
Three sets of RNA-seq data and one meta-analysis of RNA-seq have been used for this study. Plants were submitted to (i) salt stress for A. thaliana and E. salsugineum [32,33] or (ii) hypoxia stress for A. thaliana and N. officinale [41,42]. The details of the experimental setups are recalled as follows.
For salt stress, expression data for A. thaliana (Col-0 ecotype) [32] were obtained from roots grown in vitro for 10 d in half-strength Murashige and Skoog basal medium (1/2 MS) with and without 50 mM NaCl. For E. salsugineum (Shandong ecotype), expression data were collected from roots of plants germinated on 1/2 MS, transferred to soil after 7 d for a 5-week-growth period, and subjected to either 300 mM NaCl solution (salt treated) or water (control) irrigation for 24 h before sampling. These two NaCl concentrations have been described as stressful [61] but not toxic for the two species [32,34].
In the case of hypoxia, metadata for A. thaliana were sourced from 29 RNA-seq datasets identified through a keyword search in the Gene Expression Omnibus (GEO) [62]. Most samples consisted of whole seedlings or aerial organs. For N. officinale, expression data were obtained from plant stems that were initially germinated in sterile soil, grown until they reached the 5–6 leaf stage, and then sampled after 24 h of submersion to induce hypoxia.
3.7. Pipeline for the OR Families Expression Analysis
In hypoxia conditions for A. thaliana (meta-analysis), differential expressions have been calculated in the form of an HN-score (hypoxia–normoxia score), as computed by the authors [41]. So, no associated statistical values were provided. For the other differential analyses, FCs with a Benjamini–Hochberg adjusted p-value (FDR or false discovery rate) have been employed. Differential expressions utilized for N. officinale [42] and A. thaliana [32] under saline conditions were directly derived from the published data.
Regarding E. salsugineum, RNAseq libraries (SRR6837742, SRR6837743, SRR14804236, SRR14804235, available at NCBI) were used for conducting a differential analysis using the nf-core/rnaseq pipeline version 3.10.1 in Nextflow v22.12.0 [63] with default parameters [64,65]. Next, the counts were normalized using the Trimmed Mean of M-values (TMM) method from the EdgeR package [66,67]. Subsequently, a selection of expressed genes was performed, using a threshold of expression higher than 0.1 cpm (count per million) across all replicates. Following a second TMM normalization on the expressed genes, an analysis was conducted using the EdgeR package. The expression of the log2FC threshold was set to 0 to distinguish the expressed genes (even if not differentially expressed) from genes with undetectable levels of expression.
To select the transcripts corresponding to the six investigated OR gene families, a BLAST analysis was carried out with the gene sequences annotated as described above.
4. Conclusions
This work has allowed for the expert annotation of 110 OR genes belonging to six different families in the diploid E. salsugineum and 188 in the tetraploid N. officinale. They were compared to the 108 already-annotated OR genes of A. thaliana. We could show that most of the orthologous sequences are conserved between the three species, which probably diverged 30 MYA, thus supporting the idea that OR families have critical functions for ROS homeostasis. As for other plants, polyploidy could have been an asset for the adaptation and evolution of N. officinale [68]. Also, we have observed that less than 30% of the ohnologs of N. officinale have been lost or pseudogenized, suggesting that the conservation of the two copies brought sufficient advantages (such as sub-functionalization or dose effect) to bypass the loss of duplicated genes [69].
Global gene expression analyses showed genes similarly regulated in the species subjected to comparable stresses. However, we also observed genes only regulated by stress in A. thaliana, which is sensitive to both stresses. Conversely, there were genes only regulated in the halophytic E. salsugineum upon salt stress or in the hypoxia-tolerant N. officinale upon hypoxia. In addition, among the six OR classes studied, CIII Prx genes represent two thirds of the genes analyzed and have been largely described as stress markers [12]. Their roles seem to be critical, especially upon hypoxia. It is also important to recall that the six OR classes analyzed in this work are members of the so-called ROS gene network, which contains dozens of other OR classes participating in ROS homeostasis during regular metabolism but also following stressing events. The OR genes highlighted by this work could be targets for functional analyses to better understand their roles either in the acclimation to hypoxia or salinity or in the stress responses.
Supplementary Materials
The following supporting information can be downloaded at: https://www.mdpi.com/article/10.3390/ijms25031938/s1.
Author Contributions
Conceptualization, C.D.; methodology, A.B., C.D., C.C., C.M., S.C.C., T.H.B. and C.D.; validation, A.B., C.C., C.M., S.C.C. and C.D.; formal analysis, C.M., S.C.C., T.H.B. and C.D.; investigation, E.J., S.C.C., T.H.B. and C.D.; resources, C.D.; data curation, S.C.C., T.H.B. and C.D.; writing—original draft preparation, E.J., T.H.B. and C.D.; writing—review and editing, E.J., T.H.B. and C.D.; visualization, T.H.B. and C.D.; supervision, C.M., E.J. and C.D.; project administration, C.D.; funding acquisition, C.D. All authors have read and agreed to the published version of the manuscript.
Funding
The authors are thankful to the Paul Sabatier-Toulouse 3 University and the Centre National de la Recherche Scientifique (CNRS) for providing grants for their work. This research was funded by the TULIP LabEx project (ANR-10-LABX-41), École Universitaire de Recherche (EUR) TULIP-GS (ANR-18-EURE-0019) and by the Agrobiosciences Interactions and Biodiversity Research Federation (FR AIB).
Institutional Review Board Statement
Not applicable.
Informed Consent Statement
Not applicable.
Data Availability Statement
The N. officinale protein sequences translated from the genome available at NCBI (Kiefer. 2019) are available in the Redoxibase (https://peroxibase.toulouse.inrae.fr, accessed on 30 November 2023).
Conflicts of Interest
The authors declare no conflicts of interest.
References
- León, J.; Castillo, M.C.; Gayubas, B. The hypoxia-reoxygenation stress in plants. J. Exp. Bot. 2021, 72, 5841–5856. [Google Scholar] [CrossRef] [PubMed]
- Martinière, A.; Fiche, J.B.; Smokvarska, M.; Mari, S.; Alcon, C.; Dumont, X.; Hematy, K.; Jaillais, Y.; Nollmann, M.; Maurel, C. Osmotic stress activates two reactive oxygen species pathways with distinct effects on protein nanodomains and diffusion. Plant Physiol. 2019, 179, 1581–1593. [Google Scholar] [CrossRef] [PubMed]
- Apel, K.; Hirt, H. Reactive oxygen species: Metabolism, oxidative stress, and signal transduction. Annu. Rev. Plant Biol. 2004, 55, 373–399. [Google Scholar] [CrossRef] [PubMed]
- Mittler, R. ROS are good. Trends Plant Sci. 2017, 22, 11–19. [Google Scholar] [CrossRef] [PubMed]
- Inupakutika, M.A.; Sengupta, S.; Devireddy, A.R.; Azad, R.K.; Mittler, R. The evolution of reactive oxygen species metabolism. J. Exp. Bot. 2016, 67, 5933–5943. [Google Scholar] [CrossRef] [PubMed]
- Zhang, H.; Han, B.; Wang, T.; Chen, S.; Li, H.; Zhang, Y.; Dai, S. Mechanisms of plant salt response: Insights from proteomics. J. Proteome Res. 2012, 11, 49–67. [Google Scholar] [CrossRef] [PubMed]
- Patel, M.K.; Pandey, S.; Burritt, D.J.; Tran, L.S.P. Plant responses to low-oxygen stress: Interplay between ROS and NO signaling pathways. Environ. Exp. Bot. 2019, 161, 134–142. [Google Scholar] [CrossRef]
- Hossain, M.S.; Dietz, K.J. Tuning of redox regulatory mechanisms, reactive oxygen species and redox homeostasis under salinity stress. Front. Plant Sci. 2016, 7, 548. [Google Scholar] [CrossRef]
- Yu, S.; Kakar, K.U.; Yang, Z.; Nawaz, Z.; Lin, S.; Guo, Y.; Ren, X.L.; Baloch, A.A.; Han, D. Systematic study of the stress-responsive Rboh gene family in Nicotiana tabacum: Genome-wide identification, evolution and role in disease resistance. Genomics 2020, 112, 1404–1418. [Google Scholar] [CrossRef]
- Mhamdi, A.; Queval, G.; Chaouch, S.; Vanderauwera, S.; Van Breusegem, F.; Noctor, G. Catalase function in plants: A focus on Arabidopsis mutants as stress-mimic models. J. Exp. Bot. 2010, 61, 4197–4220. [Google Scholar] [CrossRef]
- Mathé, C.; Barre, A.; Jourda, C.; Dunand, C. Evolution and expression of class III peroxidases. Arch. Biochem. Biophys. 2010, 500, 58–65. [Google Scholar] [CrossRef]
- Passardi, F.; Penel, C.; Dunand, C. Performing the paradoxical: How plant peroxidases modify the cell wall. Trends Plant Sci. 2004, 9, 534–540. [Google Scholar] [CrossRef] [PubMed]
- Francoz, E.; Ranocha, P.; Nguyen-Kim, H.; Jamet, E.; Burlat, V.; Dunand, C. Roles of cell wall peroxidases in plant development. Phytochemistry 2015, 112, 15–21. [Google Scholar] [CrossRef] [PubMed]
- Machado, L.; Castro, A.; Hamberg, M.; Bannenberg, G.; Gaggero, C.; Castresana, C.; De León, I.P. The Physcomitrella patens unique alpha-dioxygenase participates in both developmental processes and defense responses. BMC Plant Biol. 2015, 15, 45. [Google Scholar] [CrossRef] [PubMed]
- Hamberg, M.; Sanz, A.; Rodriguez, M.J.; Calvo, A.P.; Castresana, C. Activation of the fatty acid alpha-dioxygenase pathway during bacterial infection of tobacco leaves. Formation of oxylipins protecting against cell death. J. Biol. Chem. 2003, 278, 51796–51805. [Google Scholar] [CrossRef] [PubMed]
- Tirajoh, A.; Aung, T.S.; McKay, A.B.; Plant, A.L. Stress-responsive alpha-dioxygenase expression in tomato roots. J. Exp. Bot. 2005, 56, 713–723. [Google Scholar] [CrossRef] [PubMed]
- Chapman, J.M.; Muhlemann, J.K.; Gayomba, S.R.; Muday, G.K. RBOH-dependent ROS synthesis and ROS scavenging by plant specialized metabolites to modulate plant development and stress responses. Chem. Res. Toxicol. 2019, 32, 370–396. [Google Scholar] [CrossRef] [PubMed]
- Wang, W.; Xia, M.X.; Chen, J.; Yuan, R.; Deng, F.N.; Shen, F.F. Gene Expression characteristics and regulation mechanisms of superoxide dismutase and its physiological roles in plants under stress. Biochemistry 2016, 81, 465–480. [Google Scholar] [CrossRef]
- Cole, S.T.; Eiglmeier, K.; Parkhill, J.; James, K.D.; Thomson, N.R.; Wheeler, P.R.; Honoré, N.; Garnier, T.; Churcher, C.; Harris, D.; et al. Massive gene decay in the leprosy bacillus. Nature 2001, 409, 1007–1011. [Google Scholar] [CrossRef]
- Sharma, S.; Ciufo, S.; Starchenko, E.; Darji, D.; Chlumsky, L.; Karsch-Mizrachi, I.; Schoch, C.L. The NCBI biocollections database. Database 2018, 2018, bay2006. [Google Scholar] [CrossRef]
- Kiefer, C.; Willing, E.M.; Jiao, W.B.; Sun, H.; Piednoël, M.; Hümann, U.; Hartwig, B.; Koch, M.A.; Schneeberger, K. Interspecies association mapping links reduced CG to TG substitution rates to the loss of gene-body methylation. Nat. Plants 2019, 5, 846–855. [Google Scholar] [CrossRef]
- Marçais, G.; Kingsford, C. A fast, lock-free approach for efficient parallel counting of occurrences of k-mers. Bioinformatics 2011, 27, 764–770. [Google Scholar] [CrossRef]
- Morozowska, M.; Czarna, A.; Jedrzejczyk, I.; Bocianowski, J. Genome size, leaf, fruit and seed traits–taxonomic tools for species identification in the genus Nasturtium R. Br. Acta Biol. Crac. Ser. Bot. 2015, 57, 114–124. [Google Scholar] [CrossRef]
- Mandáková, T.; Pouch, M.; Brock, J.R.; Al-Shehbaz, I.A.; Lysak, M.A. Origin and evolution of diploid and allopolyploid Camelina genomes were accompanied by chromosome shattering. Plant Cell 2019, 31, 2596–2612. [Google Scholar] [CrossRef] [PubMed]
- Glover, N.M.; Redestig, H.; Dessimoz, C. Homoeologs: What are they and how do we infer them? Trends Plant Sci. 2016, 21, 609–621. [Google Scholar] [CrossRef] [PubMed]
- Guo, X.; Liu, J.; Hao, G.; Zhang, L.; Mao, K.; Wang, X.; Zhang, D.; Ma, T.; Hu, Q.; Al-Shehbaz, I.A.; et al. Plastome phylogeny and early diversification of Brassicaceae. BMC Genom. 2017, 18, 176. [Google Scholar] [CrossRef] [PubMed]
- Cardinal-McTeague, W.M.; Sytsma, K.J.; Hall, J.C. Biogeography and diversification of Brassicales: A 103 million year tale. Mol. Phylogenet Evol. 2016, 99, 204–224. [Google Scholar] [CrossRef] [PubMed]
- Xiao, M.; Hao, G.; Guo, X.; Feng, L.; Lin, H.; Yang, W.; Chen, Y.; Zhao, K.; Xiang, L.; Jiang, X.; et al. A high-quality chromosome-level Eutrema salsugineum genome, an extremophile plant model. BMC Genom. 2023, 24, 174. [Google Scholar] [CrossRef] [PubMed]
- Tognolli, M.; Penel, C.; Greppin, H.; Simon, P. Analysis and expression of the class III peroxidase large gene family in Arabidopsis thaliana. Gene 2002, 288, 129–138. [Google Scholar] [CrossRef] [PubMed]
- Yang, Z.; Bielawski, J.P. Statistical methods for detecting molecular adaptation. Trends Ecol. Evol. 2000, 15, 496–503. [Google Scholar] [CrossRef]
- Yang, Y.; Li, P.; Liu, C.; Wang, P.; Cao, P.; Ye, X.; Li, Q. Systematic analysis of the non-specific lipid transfer protein gene family in Nicotiana tabacum reveal its potential roles in stress responses. Plant Physiol. Biochem. 2022, 172, 33–47. [Google Scholar] [CrossRef] [PubMed]
- Eljebbawi, A.; Guerrero, Y.D.C.R.; Dunand, C.; Estevez, J.M. Highlighting reactive oxygen species as multitaskers in root development. iScience 2021, 24, 101978. [Google Scholar] [CrossRef] [PubMed]
- Li, C.; Qi, Y.; Zhao, C.; Wang, X.; Zhang, Q. Transcriptome profiling of the salt stress response in the leaves and roots of halophytic Eutrema salsugineum. Front. Genet. 2021, 12, 770742. [Google Scholar] [CrossRef] [PubMed]
- Li, J.; Yang, X.; Liu, F.; Liu, X.; Zhao, T.; Yan, X.; Pang, Q. Redox regulation of salt tolerance in Eutrema salsugineum by Proteomics. Int. J. Mol. Sci. 2023, 24, 14518. [Google Scholar] [CrossRef] [PubMed]
- Zapalska-Sozoniuk, M.; Chrobak, L.; Kowalczyk, K.; Kankofer, M. Is it useful to use several “omics” for obtaining valuable results? Mol. Biol. Rep. 2019, 46, 3597–3606. [Google Scholar] [CrossRef]
- Leschevin, M.; Ismael, M.; Quero, A.; San Clemente, H.; Roulard, R.; Bassard, S.; Marcelo, P.; Pageau, K.; Jamet, E.; Rayon, C. Physiological and biochemical traits of two major Arabidopsis accessions, Col-0 and Ws, under salinity. Front. Plant Sci. 2021, 12, 639154. [Google Scholar] [CrossRef] [PubMed]
- Marzol, E.; Borassi, C.; Carignani Sardoy, M.; Ranocha, P.; Aptekmann, A.A.; Bringas, M.; Pennington, J.; Paez-Valencia, J.; Martínez Pacheco, J.; Rodríguez-Garcia, D.R.; et al. Class III peroxidases PRX01, PRX44, and PRX73 control root hair growth in Arabidopsis thaliana. Int. J. Mol. Sci. 2022, 23, 5375. [Google Scholar] [CrossRef]
- Passardi, F.; Tognolli, M.; De Meyer, M.; Penel, C.; Dunand, C. Two cell wall associated peroxidases from Arabidopsis influence root elongation. Planta 2006, 223, 965–974. [Google Scholar] [CrossRef]
- Geng, Y.; Wu, R.; Wee, C.W.; Xie, F.; Wei, X.; Chan, P.M.; Tham, C.; Duan, L.; Dinneny, J.R. A spatio-temporal understanding of growth regulation during the salt stress response in Arabidopsis. Plant Cell 2013, 25, 2132–2154. [Google Scholar] [CrossRef]
- Tsukagoshi, H.; Suzuki, T.; Nishikawa, K.; Agarie, S.; Ishiguro, S.; Higashiyama, T. RNA-seq analysis of the response of the halophyte, Mesembryanthemum crystallinum (ice plant) to high salinity. PLoS ONE 2015, 10, e0118339. [Google Scholar] [CrossRef]
- Tamura, K.; Bono, H. Meta-analysis of RNA sequencing data of Arabidopsis and rice under hypoxia. Life 2022, 12, 1079. [Google Scholar] [CrossRef] [PubMed]
- Müller, J.T.; Van Veen, H.; Bartylla, M.M.; Akman, M.; Pedersen, O.; Sun, P.; Schuurink, R.C.; Takeuchi, J.; Todoroki, Y.; Weig, A.R.; et al. Keeping the shoot above water-submergence triggers antithetical growth responses in stems and petioles of watercress (Nasturtium officinale). New Phytol. 2021, 229, 140–155. [Google Scholar] [CrossRef]
- Kumar, V.; Vogelsang, L.; Schmidt, R.R.; Sharma, S.S.; Seidel, T.; Dietz, K.J. Remodeling of root growth under combined arsenic and hypoxia stress is linked to nutrient deprivation. Front. Plant Sci. 2020, 11, 569687. [Google Scholar] [CrossRef] [PubMed]
- Sun, L.; Ma, L.; He, S.; Hao, F. AtrbohD functions downstream of ROP2 and positively regulates waterlogging response in Arabidopsis. Plant Signal Behav. 2018, 13, e1513300. [Google Scholar] [CrossRef] [PubMed]
- Yeung, E.; Van Veen, H.; Vashisht, D.; Sobral Paiva, A.L.; Hummel, M.; Rankenberg, T.; Steffens, B.; Steffen-Heins, A.; Sauter, M.; De Vries, M.; et al. A stress recovery signaling network for enhanced flooding tolerance in Arabidopsis thaliana. Proc. Natl. Acad. Sci. USA 2018, 115, E6085–E6094. [Google Scholar] [CrossRef] [PubMed]
- Wang, F.; Chen, Z.H.; Liu, X.; Colmer, T.D.; Shabala, L.; Salih, A.; Zhou, M.; Shabala, S. Revealing the roles of GORK channels and NADPH oxidase in acclimation to hypoxia in Arabidopsis. J. Exp. Bot. 2017, 68, 3191–3204. [Google Scholar] [CrossRef] [PubMed]
- Yang, C.Y.; Hsu, F.C.; Li, J.P.; Wang, N.N.; Shih, M.C. The AP2/ERF transcription factor AtERF73/HRE1 modulates ethylene responses during hypoxia in Arabidopsis. Plant Physiol. 2011, 156, 202–212. [Google Scholar] [CrossRef]
- Yan, J.; Song, Y.; Li, M.; Hu, T.; Hsu, Y.F.; Zheng, M. IRR1 contributes to de novo root regeneration from Arabidopsis thaliana leaf explants. Physiol. Plant 2023, 175, e14047. [Google Scholar] [CrossRef]
- Pacheco, J.M.; Ranocha, P.; Kasulin, L.; Fusari, C.M.; Servi, L.; Aptekmann, A.A.; Gabarain, V.B.; Peralta, J.M.; Borassi, C.; Marzol, E.; et al. Apoplastic class III peroxidases PRX62 and PRX69 promote Arabidopsis root hair growth at low temperature. Nat. Commun. 2022, 13, 1310. [Google Scholar] [CrossRef]
- Simão, F.A.; Waterhouse, R.M.; Ioannidis, P.; Kriventseva, E.V.; Zdobnov, E.M. BUSCO: Assessing genome assembly and annotation completeness with single-copy orthologs. Bioinformatics 2015, 31, 3210–3212. [Google Scholar] [CrossRef]
- Gabriel, L.; Brůna, T.; Hoff, K.J.; Ebel, M.; Lomsadze, A.; Borodovsky, M.; Stanke, M. BRAKER3: Fully automated genome annotation using RNA-Seq and protein evidence with GeneMark-ETP, AUGUSTUS and TSEBRA. bioRxiv 2023. [Google Scholar] [CrossRef]
- Jones, P.; Binns, D.; Chang, H.Y.; Fraser, M.; Li, W.; McAnulla, C.; McWilliam, H.; Maslen, J.; Mitchell, A.; Nuka, G.; et al. InterProScan 5: Genome-scale protein function classification. Bioinformatics 2014, 30, 1236–1240. [Google Scholar] [CrossRef] [PubMed]
- Goodstein, D.M.; Shu, S.; Howson, R.; Neupane, R.; Hayes, R.D.; Fazo, J.; Mitros, T.; Dirks, W.; Hellsten, U.; Putnam, N.; et al. Phytozome: A comparative platform for green plant genomics. Nucleic Acids Res. 2012, 40, D1178–D1186. [Google Scholar] [CrossRef] [PubMed]
- Cabanac, S.; Mathé, C.; Dunand, C. P-GRe: An efficient pipeline to maximised pseudogene prediction in plants/eucaryotes. bioRxiv 2023. [Google Scholar] [CrossRef]
- Ranwez, V.; Douzery, E.J.P.; Cambon, C.; Chantret, N.; Delsuc, F. MACSE v2: Toolkit for the alignment of coding sequences accounting for frameshifts and stop codons. Mol. Biol. Evol. 2018, 35, 2582–2584. [Google Scholar] [CrossRef] [PubMed]
- Zhang, Z. KaKs_Calculator 3.0: Calculating selective pressure on coding and non-coding sequences. Genom. Proteom. Bioinform. 2022, 20, 536–540. [Google Scholar] [CrossRef] [PubMed]
- Savelli, B.; Li, Q.; Webber, M.; Jemmat, A.M.; Robitaille, A.; Zamocky, M.; Mathé, C.; Dunand, C. RedoxiBase: A database for ROS homeostasis regulated proteins. Redox Biol. 2019, 26, 101247. [Google Scholar] [CrossRef] [PubMed]
- Thompson, J.D.; Gibson, T.J.; Higgins, D.G. Multiple sequence alignment using ClustalW and ClustalX. Curr. Protoc. Bioinform. 2002, 2, 2–3. [Google Scholar] [CrossRef]
- Lemoine, F.; Correia, D.; Lefort, V.; Doppelt-Azeroual, O.; Mareuil, F.; Cohen-Boulakia, S.; Gascuel, O. NGPhylogeny.fr: New generation phylogenetic services for non-specialists. Nucleic Acids Res. 2019, 47, W260–W265. [Google Scholar] [CrossRef] [PubMed]
- Emms, D.M.; Kelly, S. OrthoFinder: Phylogenetic orthology inference for comparative genomics. Genome Biol. 2019, 20, 238. [Google Scholar] [CrossRef]
- Bartels, D.; Dinakar, C. Balancing salinity stress responses in halophytes and non-halophytes: A comparison between Thellungiella and Arabidopsis thaliana. Funct. Plant Biol. 2013, 40, 819–831. [Google Scholar] [CrossRef]
- Clough, E.; Barrett, T. The Gene Expression Omnibus database. Methods Mol. Biol. 2016, 1418, 93–110. [Google Scholar] [CrossRef]
- Di Tommaso, P.; Chatzou, M.; Floden, E.W.; Barja, P.P.; Palumbo, E.; Notredame, C. Nextflow enables reproducible computational workflows. Nat. Biotechnol. 2017, 35, 316–319. [Google Scholar] [CrossRef] [PubMed]
- Patel, H.; Lee, S.H.; Breen, G.; Menzel, S.; Ojewunmi, O.; Dobson, R.J.B. The COPILOT raw Illumina genotyping QC protocol. Curr. Protoc. 2022, 2, e373. [Google Scholar] [CrossRef] [PubMed]
- Ewels, P.A.; Peltzer, A.; Fillinger, S.; Patel, H.; Alneberg, J.; Wilm, A.; Garcia, M.U.; Di Tommaso, P.; Nahnsen, S. The nf-core framework for community-curated bioinformatics pipelines. Nat. Biotechnol. 2020, 38, 276–278. [Google Scholar] [CrossRef] [PubMed]
- Robinson, M.D.; McCarthy, D.J.; Smyth, G.K. edgeR: A Bioconductor package for differential expression analysis of digital gene expression data. Bioinformatics 2010, 26, 139–140. [Google Scholar] [CrossRef] [PubMed]
- McCarthy, D.J.; Chen, Y.; Smyth, G.K. Differential expression analysis of multifactor RNA-Seq experiments with respect to biological variation. Nucleic Acids Res. 2012, 40, 4288–4297. [Google Scholar] [CrossRef] [PubMed]
- Del Pozo, J.C.; Ramirez-Parra, E. Whole genome duplications in plants: An overview from Arabidopsis. J. Exp. Bot. 2015, 66, 6991–7003. [Google Scholar] [CrossRef]
- Panchy, N.; Lehti-Shiu, M.; Shiu, S.H. Evolution of gene duplication in plants. Plant Physiol. 2016, 171, 2294–2316. [Google Scholar] [CrossRef] [PubMed]

Disclaimer/Publisher’s Note: The statements, opinions and data contained in all publications are solely those of the individual author(s) and contributor(s) and not of MDPI and/or the editor(s). MDPI and/or the editor(s) disclaim responsibility for any injury to people or property resulting from any ideas, methods, instructions or products referred to in the content. |
© 2024 by the authors. Licensee MDPI, Basel, Switzerland. This article is an open access article distributed under the terms and conditions of the Creative Commons Attribution (CC BY) license (https://creativecommons.org/licenses/by/4.0/).