Article

Genome-Wide Identification of B-Box Gene Family and Candidate Light-Related Member Analysis of Tung Tree (Vernicia fordii)

1
Key Laboratory of Cultivation and Protection for Non-Wood Forest Trees, Ministry of Education, Central South University of Forestry and Technology, Changsha 410004, China
2
Hunan Forestry Seedling Breeding Demonstration Center, The Forestry Department of Hunan Province, Changsha 410329, China
*
Authors to whom correspondence should be addressed.
Int. J. Mol. Sci. 2024, 25(4), 1977; https://doi.org/10.3390/ijms25041977
Submission received: 18 December 2023 / Revised: 22 January 2024 / Accepted: 27 January 2024 / Published: 6 February 2024
(This article belongs to the Section Molecular Plant Sciences)

Abstract

:
Light is one of the most important environmental factors for plant growth. In the production process of tung oil tree cultivation, due to the inappropriate growth of shading conditions, the lower branches are often dry and dead, which seriously affects the yield of tung oil trees. However, little is known about the key factors of light-induced tree photomorphogenesis. In this study, a total of 22 VfBBX family members were identified to provide a reference for candidate genes in tung tree seedlings. All members of the VfBBX family have different numbers of highly conserved B-box domains or CCT domains. Phylogenetic evolution clustered the VfBBX genes into four categories, and the highest density of members was on chromosome 6. Interspecific collinearity analysis suggested that there were six pairs of duplicate genes in VfBBX members, but the expression levels of all family members in different growth and development stages of the tung tree were significantly divergent. After different degrees of shading treatment and physiological data determination of tung tree seedlings, the differential expression level and chlorophyll synthesis genes correlation analysis revealed that VfBBX9 was a typical candidate nuclear localization transcription factor that was significantly differentially expressed in light response. This study systematically identified the VfBBX gene family and provided a reference for studying its molecular function, enhanced the theoretical basis for tung tree breeding, and identified excellent varieties.

1. Introduction

Light is an indispensable environmental factor for plants, playing a pivotal role in modulating their growth and developmental processes by regulating shade avoidance, directional growth, and photoperiodic flowering. In the widely utilized cultivation of plant seedlings in facilities, the facility skeleton and greenhouse film may exert a certain shielding effect on light, or changes in climate and weather conditions may induce shade, thereby influencing plant growth [1]. Research has demonstrated that plants exposed to partial shade or darkness typically exhibit a symptomatic shade-avoidance syndrome (SAS), characterized by weakened seed germination, elongated hypocotyls and petioles, reduced leaf surface area, etiolated leaves, accelerated flowering, and decreased branching [2]. These mechanisms reciprocally regulate various photomorphogenesis programs, impacting plant growth, fruit formation, and the production of secondary metabolites [3]. In the photomorphogenesis process, active photoreceptors negatively control the photomorphogenesis inhibitors, releasing downstream light-promoting transcription factors by absorbing visible light [4]. Shade-avoidance responses are mediated by photoreceptors, with typical nuclear-localized phytochromes promoting or inhibiting the degradation of various transcription factors, such as PHYTOCHROME-INTERACTING FACTORs (PIFs) [5], LONG HYPOCOTYL 5 (HY5) [6], and B-BOX (BBX) proteins [7].
The B-box (BBX) family represents a typical class of transcription factors involved in 26S proteasome-mediated degradation by directly activating E3 ubiquitin ligases, such as COP1 [7]. BBX family proteins typically contain one or two conserved BBX domains at the N-terminal region, and some members also possess a CCT (Constans, CO-like, and TOC1) structure at the C-terminal region [8]. In Arabidopsis thaliana, BBX proteins have been reported to exhibit diverse functions, including negative regulation of flowering time [9], involvement in brassinosteroid signaling and inhibition of seedling development [4], promotion of hypocotyl growth, primary root elongation, and UV-B tolerance [10]. Moreover, most BBX genes act as regulators of photomorphogenesis, influencing photomorphogenesis in Arabidopsis seedlings through interactions with COP1 or HY5. For instance, BBX32 plays a crucial role in the control of acclimation to high light in mature Arabidopsis leaves, and plants overexpressing BBX32 are strongly impaired in acclimation to intermittent episodes of high light [11]. BBX11 serves as a positive regulator of red light signaling, and the BBX11-BBX21-HY5 positive feedback loop promotes Arabidopsis photomorphogenesis [12]. BBX21, another positive regulator of light signaling, interacts with COP1 in vivo and depends on COP1 for 26S proteasome-mediated degradation in dark-grown Arabidopsis seedlings. Additionally, BBX20, a protein that positively regulates light signaling, interacts with COP1 and undergoes COP1-mediated degradation [13]. BBX21 binds to the T/G-box in the HY5 promoter, underscoring its role as a key component in the COP1-HY5 regulatory network [14]. Despite the well-established roles of BBX proteins in regulating the growth and development of Arabidopsis, their functions in forest tree model systems remain to be explored.
The Tung tree (Vernicia fordii) is a plant of the genus Vernicia in the family Euphorbiaceae. It is native to China and is an important industrial woody oil species known for its widespread distribution, ease of cultivation, and high oil production, making it one of the most extensively cultivated commercial tree species. As one of the most promising biomass energy tree species, tung oil tree seeds can be used as an environmentally friendly coating to meet the needs of the modern consumer market [15]. The Tung tree is a deciduous tree with a strong ability to adapt to its surroundings. It is light-loving, resistant to high temperatures and drought, and rapid growth and early fruiting are intricately linked to the process of photosynthesis. However, the rapid growth and expansive crown of the tung tree pose challenges, as the shade cast by the upper branches can hinder the development of lower branches, leading to a significant number of dead branches throughout the cultivation process. This situation directly impacts the light environment experienced by tung tree leaves, contributing to the occurrence of dead branches and adversely affecting the normal growth and yield of the tung tree [16]. However, existing research on tung tree photosynthesis primarily revolves around physiological comparative analyses of photosynthetic features in different varieties, with limited exploration into gene expression responses to the tung tree’s light environment.
To study the role of the BBX family in the process of light-induced photomorphogenesis during the growth and development of tung trees. In this study, VfBBX family members were identified from the genome sequence of the tung tree, which found that VfBBX transcription factors had a wide range of biological functions in the process of photomorphogenesis of tung tree seedlings. These findings can be used to provide fundamental guidance for the study of VfBBX gene functions, as well as offer a theoretical foundation for initiatives related to breeding, identification of superior varieties, and the development of high-quality cultivation practices for the tung tree.

2. Results

2.1. Genome-Wide Identification B-Box (BBX) Family Members in Tung Tree

Utilizing a hidden Markov model (HMM)-based profile associated with the B-box-type zinc-finger domain (PF00643), and putative BBX candidate genes were acquired through an HMMER3 search conducted on the tung tree protein database. A total of 22 VfBBX family members, were designated as VfBBX1VfBBX22 based on their positions on chromosomal scaffolds. The significant variation in molecular weights (Mw) spanned from 13,502.70 Da (VfBBX5) to 57,450.27 Da (VfBBX19). Isoelectric points (PI) of the VfBBX proteins demonstrated diversity, fluctuating between 4.40 (VfBBX21) and 7.52 (VfBBX5), signifying predominantly weakly acidic proteins. Subcellular localization prediction software indicated that these VfBBX proteins predominantly reside in the nucleus. Notably, only three members (VfBBX2, VfBBX19, and VfBBX21) exhibited extracellular localization, specifically in structures such as chloroplasts and mitochondria (Table 1).

2.2. Conserved Domains and Gene Structure Analysis of VfBBX Genes in Tung Tree

Conserved structural domains revealed that two distinctive forms of the conserved zinc finger domain of B-box, namely B-box1 (C-X2-C-X7–8-C-X2-D-X-A-X-L-C-X2-C-D-X3-H-X2 -N-X4-H, indicated in orange) and B-box2 (C-X2-C-X8-C-X7-C-X2- C-X4-H(N)-X6–8-H, indicated in green), were identified. Protein sequence alignment highlighted the high similarity in the conserved sequences of these two B-BOX domains. Additionally, the BBX family also exhibited a highly conserved CCT domain (R-X5-R-Y-X2-K-X3-R-X3-K-X2-R-Y-X2-R-K-X2-A-X2-R-X-R-X2-G-R-F-X-K), represented by a blue bar in Figure 1A. Notably, the cysteine (C) and aspartic acid (D) residues of the zinc finger exhibited substantial conservation within the B-BOX domain (Figure 1A). The conservative motif symbol was reversed due to the conserved amino acid residues (Asn, Leu, His, and Arg) in the B-box1 domain, making the B-box1 domain motifs more conserved than those of the B-box2 domain (Figure S1). Among the 22 VfBBX proteins, only three members (VfBBX2 and CaBBX21) contained a single B-box1 domain, while three proteins (VfBBX9, VfBBX10 and CaBBX18) possessed B-box1 and CCT domain. The remaining 17 genes featured both B-box1 and B-box2 domains, with 10 members including the conserved CCT domain. Gene structure analysis revealed that the number of exons in the VfBBX gene family ranged from one to five. Among them, 8 VfBBX genes (36.36%) had two exons, 3 members exhibited three exons, 7 VfBBX genes (31.81%) had four exons, and 3 members had five exons. Notably, VfBBX5 was unique with only one exon (Figure 1B).

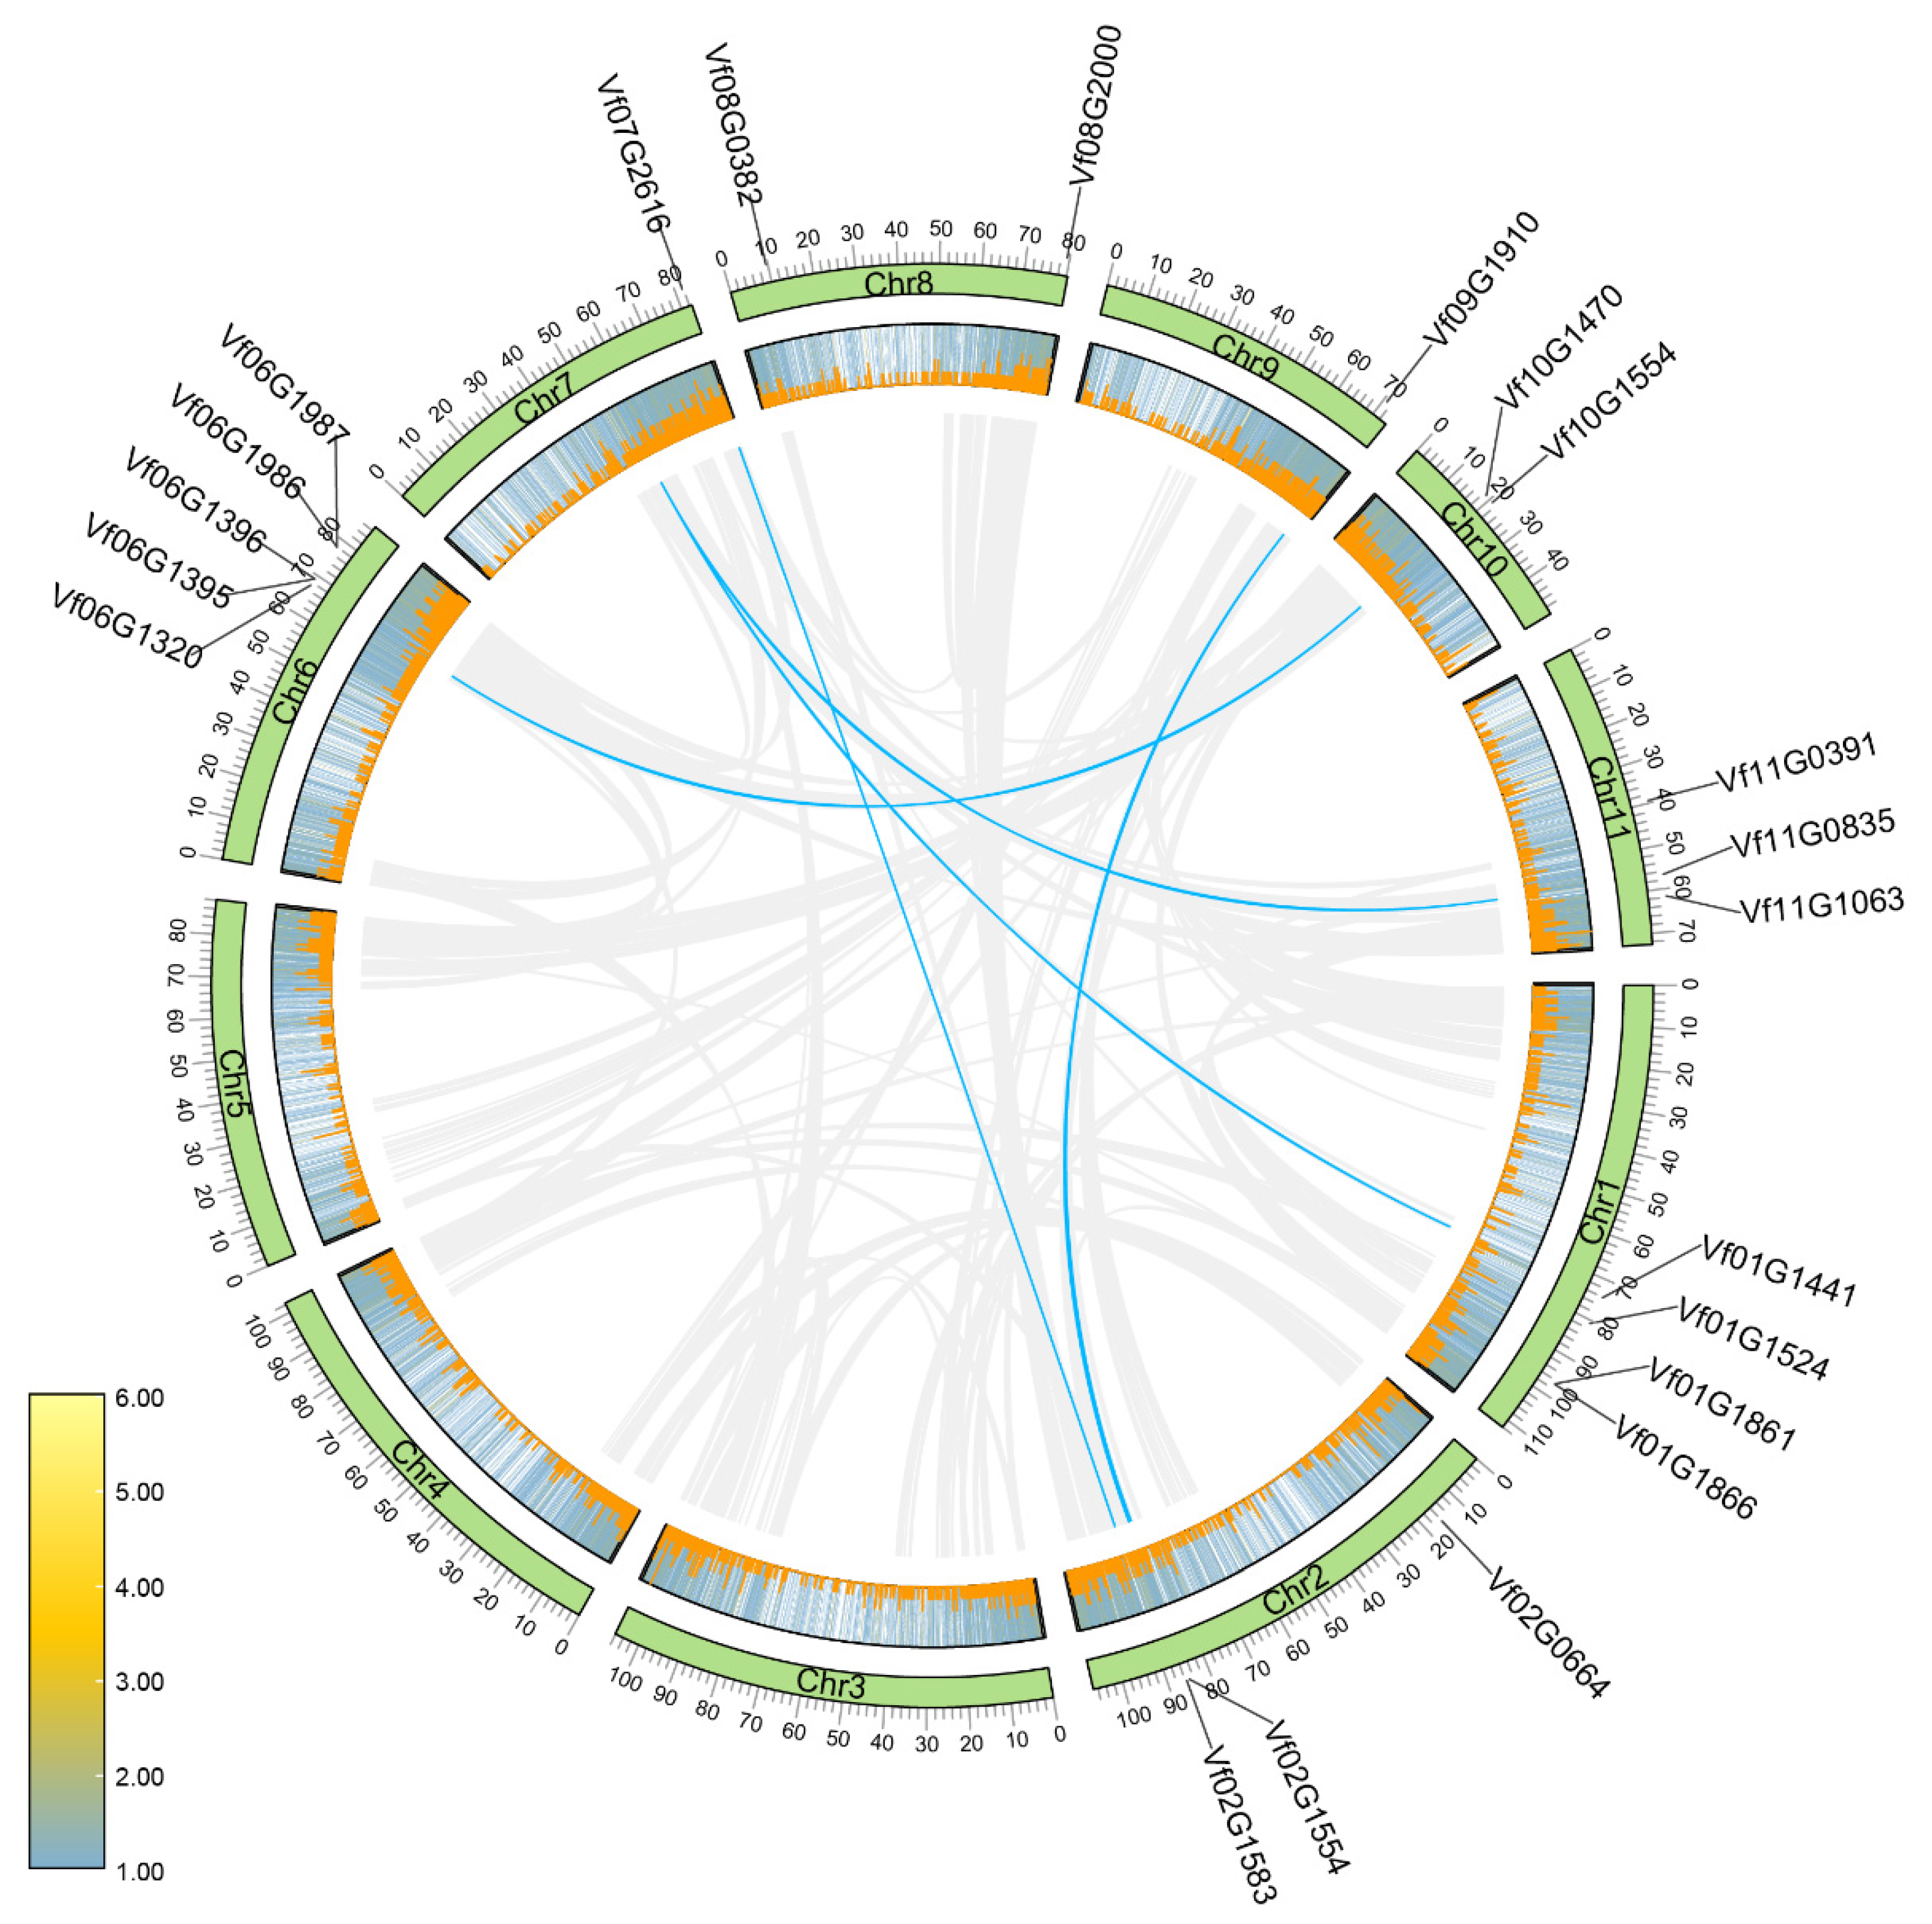
2.3. Chromosomal Distribution and Interspecies Synteny Analyses for VfBBXs

The chromosomal distribution analysis revealed that the 21 VfBBX genes were broadly distributed across 8 chromosomes, and VfBBX1 was situated on chromosome ‘00’. Chromosome 7 exhibited the highest abundance of VfBBX genes, hosting 5 VfBBX members. Chromosomes 1 accommodated four genes, chromosomes 2 and 11 existed three members each, chromosomes 8 and 10 existed two VfBBX genes each, chromosomes 7 and 9 only accommodated one VfBBX each, while the remaining chromosomes contained no VfBBX member. A total of four VfBBX genes exist duplication genes phenomenon in the tung tree genome (Figure 2). It is noteworthy that VfBBX2 and VfBBX21 duplicate with Vf07G0713, yet Vf07G0713 is not considered to be a member of the BBX family, indicating that there is still a loss of conserved regions during duplication. The evaluation of selection pressure in duplicated genes involved assessing non-synonymous mutations (Ka), synonymous mutations (Ks), and their ratio (Ka/Ks). The Ks values ranged between 1.86 and 1.94. For all duplicated gene pairs, the Ka/Ks values were less than 1.00, falling within the range of 0.16 to 0.28, suggesting that the sets of VfBBX duplicated genes underwent purifying selection throughout the evolutionary process. Among these, the duplicate gene pair VfBBX21-Vf07G0713 exhibited the minimum Ks and the maximum Ka/Ks values, indicating a potentially stronger purifying selection acting on these two genes. However, due to the high sequence divergence value (pS > 0.75), the Ks value was not calculated for the VfBBX7-VfBBX17 and VfBBX8-VfBBX17 duplicated gene pairs (Table S1).

2.4. Cis-Elements Analysis in the Promoter of VfBBXs

Utilizing conserved protein sequences, the 22 VfBBX proteins were classified into four distinct phylogenetic groups. In the evolutionary classification, Group I included VfBBX4, VfBBX5, VfBBX3, VfBBX19, VfBBX14, VfBBX12, and VfBBX13 genes. Group II comprised VfBBX15, VfBBX16, VfBBX1, VfBBX10, and VfBBX11 members. Group III encompassed VfBBX2, VfBBX21, VfBBX7, VfBBX22, VfBBX6, VfBBX20, VfBBX8, and VfBBX17, while Group IV included VfBBX9 and VfBBX18 proteins (Figure 3A). Analysis of the promoter regions located 2000 base pairs (bp) upstream of the coding region was chosen to analyze cis-elements in the VfBBX genes using the PlantCARE website (Figure 4). Among these, light response regulation association cis-elements, such as Sp1, GATA-motif, GT1-motif, AE-box, G-box, GA-motif, and I-box. Moreover, some genes exhibited cis-elements associated with hormone-responsive elements such as ethylene response element (ERE), abscisic acid (ABA) responsive elements (ABRE, ABA responsiveness), and MeJA acid responsive elements (CGTCA-motif and TGACG-motif) were identified. Other stress-responsive elements included drought-related regulatory elements (MBS), low-temperature response elements (LTR, low-temperature responsiveness), anaerobic response regulatory elements (ARE, anaerobic responsiveness), defense and stress responsiveness (TC-rich motif), and wounding and pathogen responsiveness (W-box) (Figure 3B). Notably, each gene exhibited a unique composition of cis-elements (Table S2), with VfBBX1, VfBBX2, VfBBX9, and VfBBX21 specially containing a higher abundance of light-responsive cis-elements, while VfBBX1 and VfBBX2 displayed a greater prevalence of hormone-responsive elements.

2.5. Expressions Analyzed of VfBBXs in Divergence Stages by RNA-seq Data

The RNA-seq data analysis of VfBBX gene family expression across various developmental stages and organs in tung trees provided valuable insights into their potential functions (Figure 4A). There are some members specifically highly expressed in some tissues, for example, VfBBX20 and VfBBX3 were highly expressed in the 10 BF of male flower, indicating that these two genes may be significantly involved in the early stage of male flower formation. Some family members such as VfBBX12, VfBBX4, VfBBX5, VfBBX14, and VfBBX19 may be involved in the whole process of endosperm formation, while VfBBX10, VfBBX17, VfBBX20, VfBBX7, and VfBBX21 gene was specifically highly expressed in the roots and stems of tung tree. Particularly, VfBBX9 was significantly highly expressed in the leaves of the tung tree. However, VfBBX12, VfBBX4, VfBBX5, VfBBX10, and VfBBX17 displayed consistently low expression levels across various both male flowers and female flowers development stages, while VfBBX20, VfBBX7, VfBBX9, VfBBX22, VfBBX15, VfBBX1, VfBBX16, VfBBX2, and VfBBX18 exhibited low expression levels throughout seed development stages. These findings underscore the diverse functions of VfBBX genes during the growth and development of tung trees across different tissues and developmental stages.
The assigned Gene Ontology (GO) terms of all 23 VfBBXs covered three main categories: cellular component, molecular function, and biological process based on a corrected p-value < 0.05. In the cellular component category, the highly enriched terms for all the VfBBX genes were the cell part and cell. For molecular function, VfBBXs were predominantly associated with the binding and the organic cyclic compound binding process. The biological process category showcased a wide range of assignments for VfBBX genes, including metabolic process, regulation of the biological process, and response to stress. Kyoto Encyclopedia of Genes and Genomes (KEGG) analysis showed all VfBBX gene family members significantly enriched in metabolic pathway, biosynthesis of secondary metabolism, fatty acid biosynthesis, plant circadian rhythm, ribosome, photosynthesis, and flavonoid biosynthesis. GO and KEGG terms provide valuable insights into the diverse functional roles played by the VfBBX gene family across various processes.

2.6. Different Light-Shading-Treatment of Tung Tree Seedlings

To study the role of the VfBBX family and their involvement in the photomorphogenesis of the tung tree, the seedlings were treated with normal light (L1), 75% (L2), 50% (L3), and 25% (L4) light intensity levels, respectively. As shown in Figure 5A and Figure S3, the average plant height of L3 treatment was significantly higher than that of seedlings under L1, which was significantly increased by 35.66%, 56.23%, and 45.05%, respectively, compared with L1, L2, and L4 (p < 0.05), indicating that 50% light led to overgrowth of seedlings. L4 treatment directly affected seedling dwarfing and leaf thinning. Further, tung tree seedlings exhibit an increasing trend in chlorophyll a, chlorophyll b, and total chlorophyll content, while the chlorophyll a/b ratio gradually decreases with decreasing light intensity. Chlorophyll a, chlorophyll b, and total chlorophyll reached their maximum in the L4 treatment, which significantly increased compared to L1 (Figure 2B). The peroxidase (POD) activity increased initially and then decreased with the increasing shading intensity. The L3 treatment showed a significant elevation in POD activity compared to other treatments, with increases of 83.61%, 52.44%, and 41.90% relative to the other L1, L2, and L4 treatments, respectively (Figure 5C). However, the MDA content, superoxide dismutase (SOD) activity and catalase (CAT) activity in tung tree seedlings significantly increased with the increase in shading intensity. The MDA content in L4 increased significantly by 87.66%, 82.50%, and 45.49% compared to L1, L2, and L3, respectively. The CAT activity in the L4 treatment exhibited a significant increase of 56.18%, 26.87%, and 7.02% compared to the L1, L2, and L3 treatments, respectively (Figure 5D,E). In addition, the SOD activity of the L4 treatment increased with significant differences by 49.33%, 40.56%, and 7.73% compared to the L1, L2, and L3 treatments, respectively (Figure 5F).
Moreover, qRT-PCR analysis to validate the expression patterns of VfBBXs in the different light-shading treatments. According to the expression level, six genes including VfBBX4, VfBBX5, VfBBX9, VfBBX12, VfBBX13, and VfBBX22 were found to be specifically highly expressed in leaves as candidate shading-responsive genes. Results suggested that the expression level of VfBBX5, VfBBX12, and VfBBX13 were significantly decreased only under L2 treatment, but no significant changes under both L3 and L4 treatment. The expression level of VfBBX4 was significantly high under the L3 treatment, and VfBBX22 has a high expression level under the L4 treatment. In particular, the expression level of VfBBX9 was significantly high under both L2 and L4 treatment (Figure 5G).

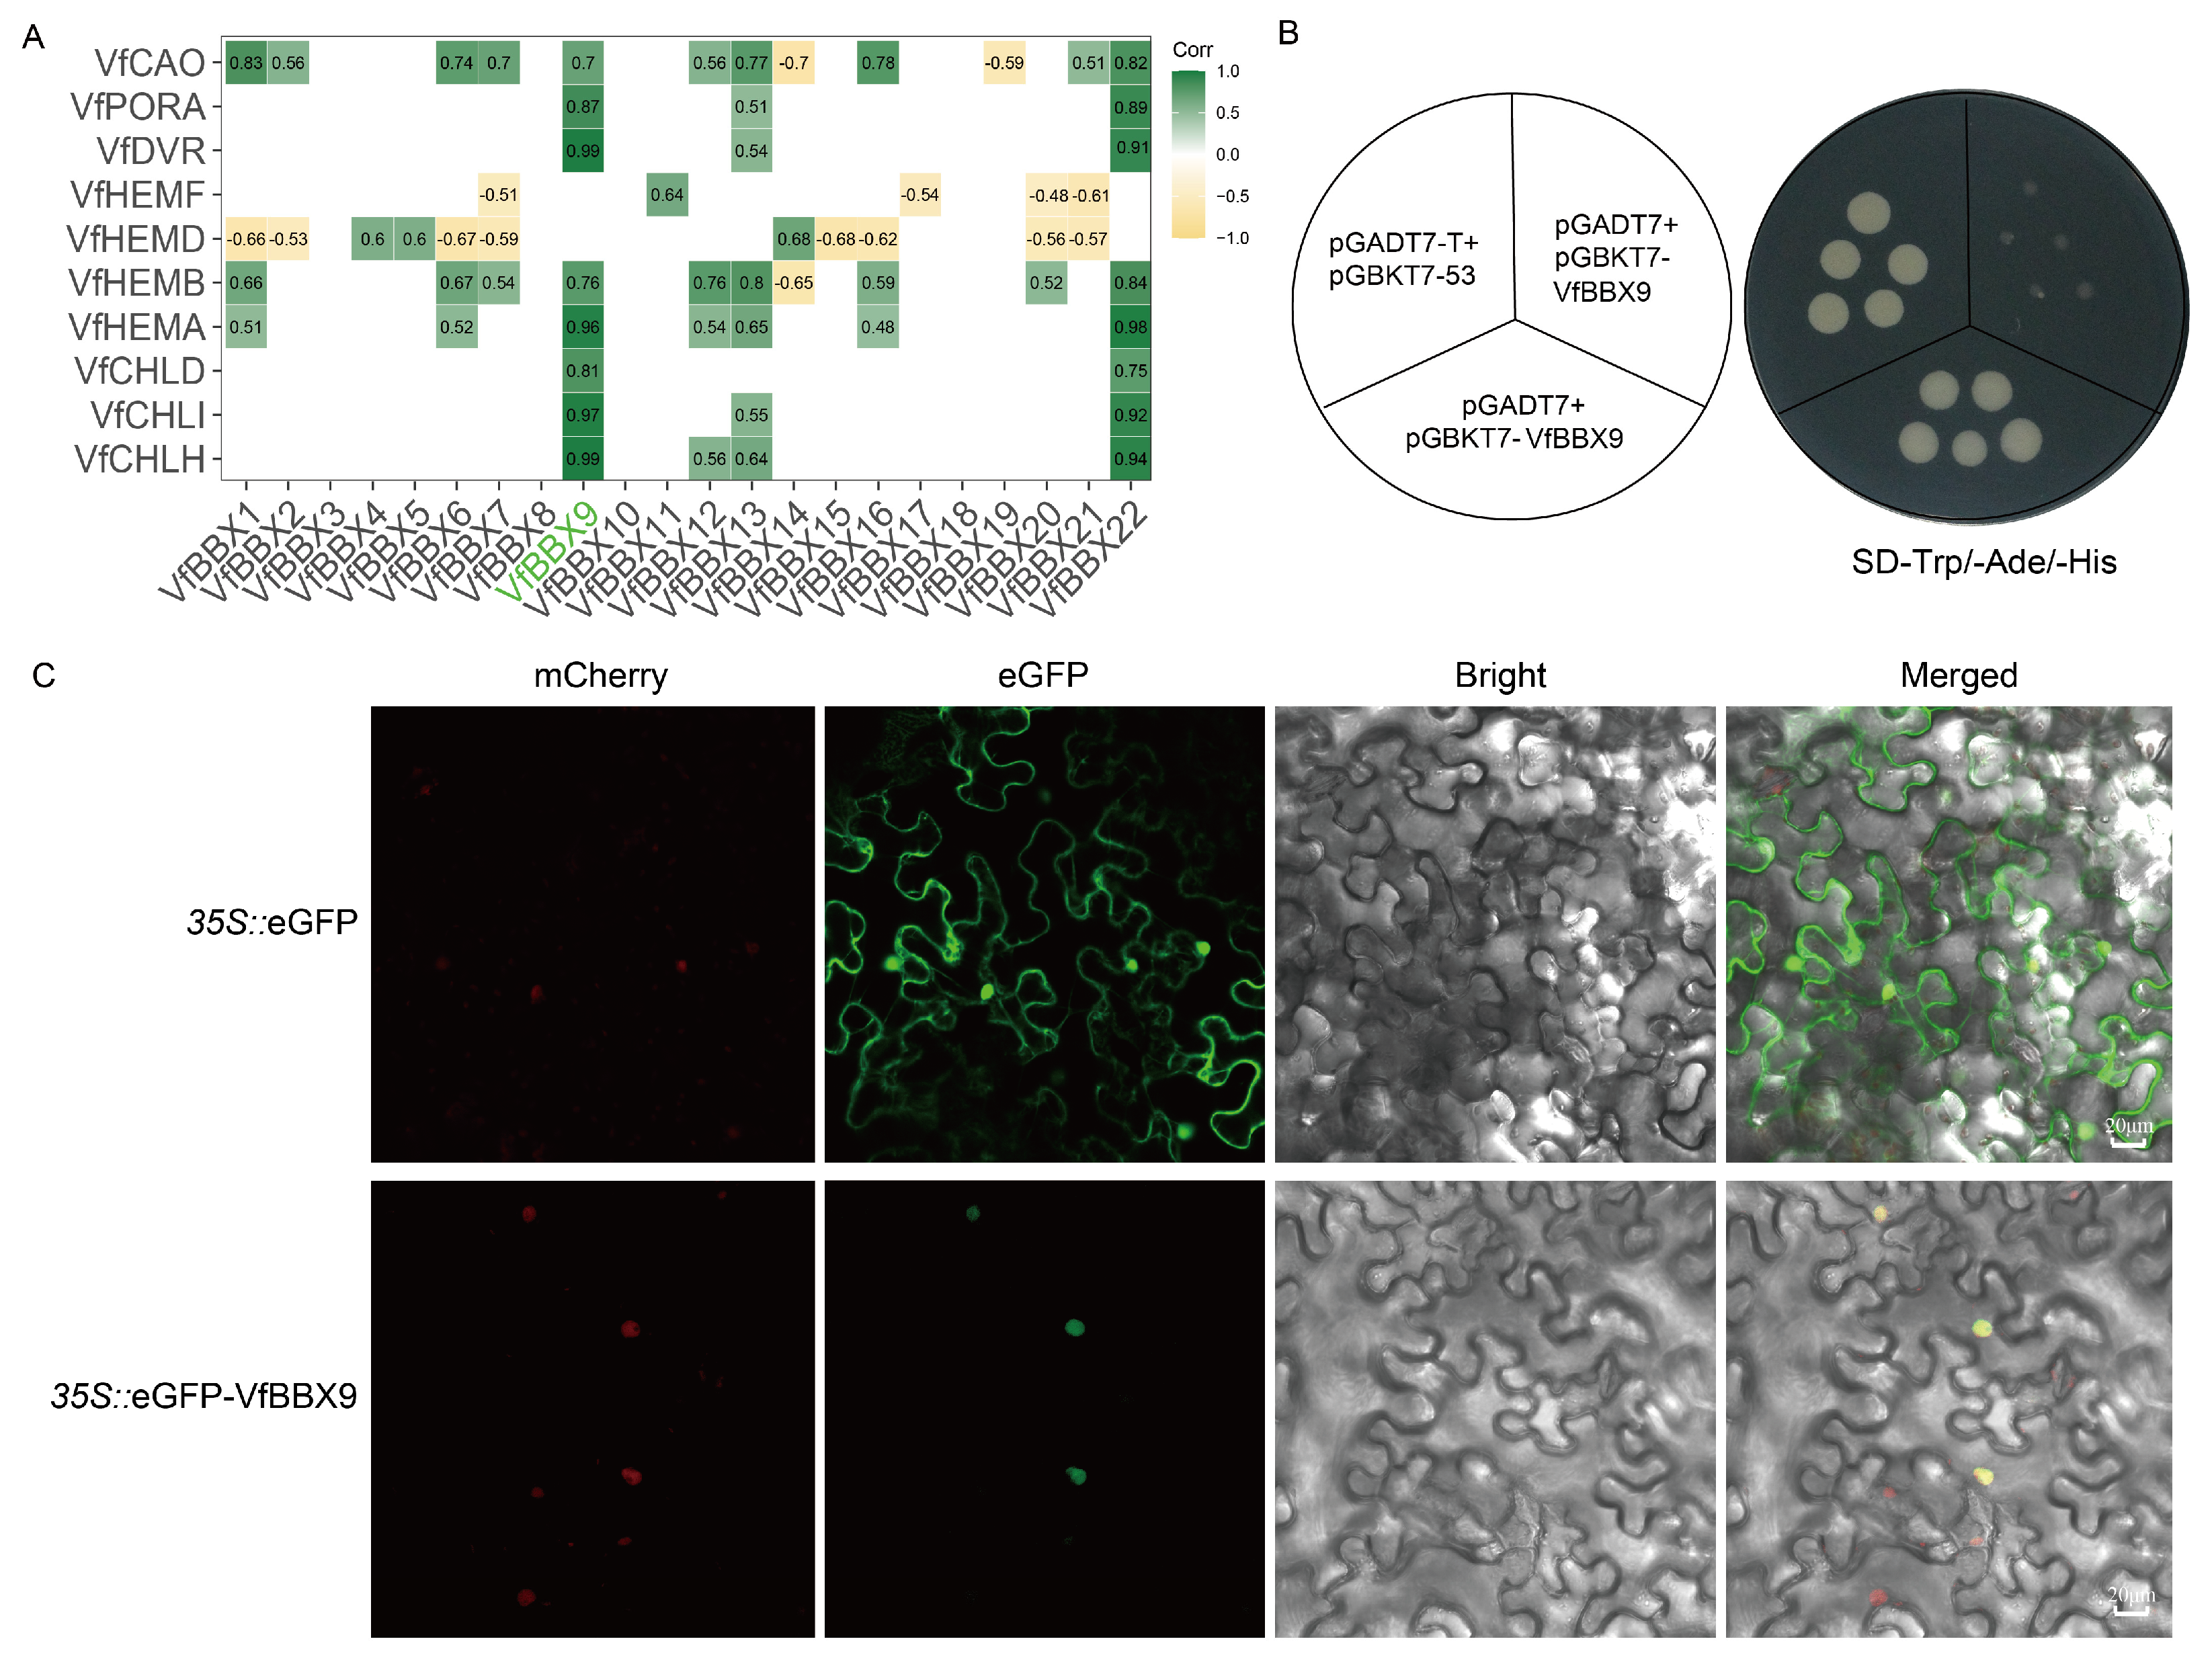
2.7. A Candidate VfBBX9 May Be Involved in Photomorphogenesis Process

Due to the effect of light on chlorophyll content, Pearson correlation analysis was performed between chlorophyll biosynthesis genes and VfBBX family members. VfBBX9 and VfBBX22 were strongly positively linked with most chlorophyll biosynthesis genes, and VfBBX9 had the highest expression in leaves according to gene expression. As a result, we believe VfBBX9 is an important candidate gene controlling chlorophyll biosynthesis and photomorphogenesis (Figure 6A and Figure S4). The transcriptional activity of VfBBX9 was studied in a yeast system to better understand its function. The Y2H Gold yeast strain expressing BD- VfBBX9 and the activation domain (AD) thrived on SD-Trp/-Ade/-His media similarly to the positive control, indicating that VfBBX9 possesses robust transcriptional activation activity (Figure 6B). Subcellular localization was accomplished by a method using 35S::VfBBX9-eGFP transiently transformed tobacco leaves. Green eGFP fluorescence was observed throughout the cytoplasm and nucleus in 35S::eGFP transiently transformed control tobacco cells by confocal laser microscopy. In contrast, 35S::VfBBX9-eGFP only 1detected green fluorescence in the nucleus. Therefore, VfBBX9 is considered a typical nuclear protein (Figure 6C).

3. Discussion

Light plays a pivotal role in regulating diverse photomorphogenic processes, encompassing plant shade avoidance, directional growth, and photoperiodic flowering. These light-induced processes have significant implications for plant growth, fruit development, and the synthesis of secondary metabolites. The B-box (BBX) transcription factors, constituting a subset of the zinc finger protein family, have garnered considerable research interest due to their diverse biological functions, especially in the light-photomorphogenesis process [17]. This study identified a total of 22 VfBBX family members in the tung tree, and the distribution of VfBBXs was uneven across the 8 chromosomes of the tung tree genome. The members of BBX were comparatively lower than that of Arabidopsis (32 ATBBXs) [18], and 29 tomato SlBBXs [19] (Figure S2). Differences in the numbers of BBX family transcription factors among species may arise from species-specific duplications or deletions during the course of evolution. Furthermore, the subcellular location of VfBBX family genes implies that the majority of them are localized in the nucleus and are highly likely to be transcription factors, which is consistent with the findings in other species [20]. The B-box conserved motifs at the C-terminal were crucial for protein interaction and transcriptional regulation, and the N-terminal was complemented by the CCT domain, which is primarily involved in nuclear transport and transcriptional regulation [8]. Furthermore, the exon-intron structures contributed to gene functions, with the VfBBX family displaying variations in exon numbers ranging from two to five. Functional diversity also arose from distinct cis-regulatory elements in the promoter regions [21]. Numerous cis-elements in the promoter region were associated with light responsiveness, such as Box 4, G-Box, TCT-motif, and GT1-motif. Several BBX proteins, like AtBBX20, are known to play pivotal roles in light signaling pathways [22]. Additionally, cis-elements like ABRE, TC-rich repeats, TCA-element, and ARE were implicated in abscisic acid responsiveness or anaerobic induction. Hormone-related cis-elements, including ERE, CGTCA-motif, TGACG-motif, and GARE-motif, were also present in the VfBBX promoter region. The diverse domains, structures, and cis-elements within the promoter region collectively contribute to the varied functions exhibited by the VfBBX family of transcription factors.
Gene duplication stands out as a pivotal mechanism driving the expansion and functional diversification of gene families [23]. Within the tung tree, six duplicated pairs were identified, contributing significantly to the enlargement of the VfBBX family. This pattern aligns with findings in other plant species such as the pepper CaBBX family [8], and tomato SlBBX family [19]. Intriguingly, the expression levels of the members of the VfBBX family members vary significantly despite the fact that many of their gene pairs are duplicated. It is reasonable to speculate that functional transcription and translation areas have developed distinct functions, while duplicated genes typically repeat non-specific conserved non-functional sequences (Figure 4). Furthermore, the VfBBX family genes show a wide range of differential expression in each growth and development stage of the tung tree, indicating that it may be a crucial transcription factor family engaged in the entire life cycle of the tung tree. Studies have shown that BBX genes have divergence functions in other species, such as SlBBX20 was found to be a positive regulator of fruit carotenoid accumulation, which interacted with SlDET1 leading to the ubiquitination and 26S proteasome-mediated degradation of SlBBX20 in tomato [24]. Furthermore, overexpressed SlBBX17 has affected plant growth and enhanced heat tolerance in tomatoes [25]. However, the functions of BBX proteins have rarely been found in other fruit crops except the fleshy fruits tomato model system.
More importantly, a number of studies have revealed that BBX proteins are involved in light signaling and either promote or inhibit photomorphogenic development. In Arabidopsis, BBX21, a positive regulator of light signaling, interacted with COP1 in vivo and relies on COP1 targeting 26S proteasome-mediated degradation in dark-grown Arabidopsis seedlings [14]. HY5 contributes to the degradation of BBX22 under light, and the expression of BBX22 will accumulate briefly during photomorphogenesis, indicating that BBX22 is also a positive regulator [26]. BBX20, a protein that positively regulates light signaling, interacts with COP1 and undergoes COP1-mediated degradation [13]. On the contrary, BBX28 can interfere with the binding of transcription factor HY5 to its target gene promoter and negatively regulate photomorphogenesis [27]. Similarly, BBX25 and BBX24, as transcriptional co-repressors, may regulate light-mediated seedling development by forming inactive heterodimers with HY5 and down-regulating the expression of BBX22 [28]. These studies have also extensively revealed that BBX proteins can be degraded by ubiquitin-mediated protein degradation in the light signal transduction pathway, thereby affecting their regulatory activity. We also determined the expression levels of BBX family members following various shading treatments on tung tree seedlings. Simultaneously, based on the expression level and link between chlorophyll biosynthesis genes and the VfBBX family, we hypothesized that VfBBX9 could be a possible component implicated in the high response of tung tree seedlings to light. We also demonstrated that VfBBX9 is a nuclear localization transcription factor with high transcriptional activation activity and that it shares the most homolog with BBX14 of Arabidopsis. BBX14 protein is considered a negative regulator that inhibits nitrogen deprivation and dark-induced leaf senescence [29]. This study provides a candidate target for the subsequent study into the function and light response of the tung tree VfBBX family.
In conclusion, in this study, we included the fundamental data of the initial members of the tung tree VfBBX family genes. The expression of VfBBX genes in tung tree seedlings under various light-shading treatments and correlation analysis of chlorophyll biosynthesis genes suggests that VfBBX9, as a nuclear localization gene, maybe a candidate critical transcription factor involved in the photomorphogenesis of tung tree. The next study will look into the biological function and regulatory network of VfBBX9 as a potential role in the light response of tung trees. This study not only provides comprehensive and accurate identification information for the BBX gene family of tung trees but also provides a theoretical foundation for the high-yield and high-quality cultivation of tung trees.

4. Materials and Methods

4.1. Identification of VfBBX Transcription Factors in Tung Tree

To discern the BBX family of transcription factors, the hidden Markov model (HMM) profile of the B-box-type zinc finger domain (PF00643) was used and sourced from the Pfam database [30]. The reference genomes of the tung tree (Vernicia fordii) constituted the basis of this study [15]. Employing the HMMER SEARCH3.0 with a cutoff E value ≤ 0.01 and SMART database, the presence of conserved domains is validated within the BBX family members [31]. Theoretical isoelectric point (pI) and molecular weight (Mw) values were calculated using the ExPaSy online tool (https://web.expasy.org/compute_pi/, accessed on 10 October 2023) [32]. For protein modeling, the SWISS-MODEL online tool (https://swissmodel.expasy.org/, accessed on 10 October 2023) was employed [33], while the putative subcellular localization of genes was predicted using the Softberry online software (http://www.softberry.com, accessed on 11 October 2023).

4.2. Conserved Motifs, Gene Structures, and Phylogenetic Analysis of VfBBX Members

The identification of conserved motifs was carried out using the MEME online tool (Version 5.1.0, National Institutes of Health, Bethesda, MD, USA), and the aligned domains were visualized using DNAMAN (Version 8.0.8, Lynnon Biosoft, San Ramon, CA, USA). Predictions regarding the gene structures of VfBBXs were made using the Gene Structure Display Server [34]. The construction of an unrooted neighbor-joining phylogenetic tree for VfBBXs, SlBBXs, and AtBBXs proteins, along with bootstrap testing replicated 1000 times, was performed using MEGA11 (https://www.megasoftware.net/home) [35].

4.3. Synteny Analysis and Cis-Elements Analysis of VfBBXs

Intra-species collinearity analysis and synonymous (Ks) and nonsynonymous (Ka) substitution rates are used by Tbtools-II [36]. The Circos diagram illustrates the chromosomal location, collinearity, and Ka/Ks values for the genes. The promoter region, selected as 2000 bp upstream sequences of coding DNA sequences (CDS), was analyzed for cis-elements using the PlantCARE web tool (http://bioinformatics.psb.ugent.be/webtools/plantcare/html/, accessed on 20 October 2023) [37].

4.4. Materials and RNA-seq Analysis

The experiment was carried out at Central South University of Forestry and Technology (28.10° N, 113.23° E), which belongs to a subtropical monsoon climate, and the frost-free period of the whole year is about 275 days. The mean annual temperature ranges from 28 to 37.5 °C, and the 88 mm average monthly precipitation. The material was collected from the National Germplasm Resource Storage of Vernicia fordii in Qingping Town, Xiangxi, Hunan, which is located at 110°29′ E, 28°32′ N, with an altitude of about 530–600 m. The indoor shade was dried for three months, and the tung tree seedlings were used after 1 month of seed germination. The raw RNA-seq data utilized in the analysis were obtained from the Tung Tree eFP Browser [15]. GO enrichment analyses were carried out using the Plant Transcriptional Regulatory Map [38], with a significance threshold set at a corrected p-value < 0.05. KEGG analyses use KOBAS-i:intelligence online tools (http://bioinfo.org/kobaskobas3/?t=1, accessed on 25 October 2023) and plot by R [39].

4.5. Different Light-Shading Treatment Analysis of Tung Tree Seedlings

A total of four light treatments were set up in this study, and the light transmittance was measured by LI-6400 portable photosynthesis meter. The optical density was controlled by different layers of black shading net. The relative light intensities of the four treatments were 100% (L1), 75% (L2), 50% (L3), and 20% (L4), respectively. The seedlings of tung tree with basically the same size and growth were transplanted into a plastic basin with an inner diameter of 24 cm and a depth of 23 cm (1/2 of nutrient soil and quartz sand), 18 pots for each treatment. A total of 72 pots were treated with four treatments, and a shading test was carried out after 40 days of normal water management. The seedling height, leaf area, and ground diameter of tung tree seedlings of four treatments were measured by vernier caliper and tape ruler. Nine plants were selected from each treatment and the mean ± SDs value was taken. The chlorophyll content, Total-Superoxide Dismutase (T-SOD), Catalase (CAT), Peroxidase (POD), and oxidative products including malondialdehyde (MDA) were quantified of tung tree seedlings by the plant assay kits (Nanjing Jiancheng Biotechnology Co., Ltd., Nanjing, China). Two grouping-variable bar graphs and a one-way analysis of variance (ANOVA) were employed. Data are presented as means ± standard deviation (SD; n = 9).

4.6. Quantitative Real-Time PCR (qRT-PCR) Analysis

Total RNA extraction was performed using the TransZol kit (TransGen Biotech, Inc., Beijing, China), and cDNA synthesis was carried out using the HiScript® II QRT SuperMix for qPCR (+gDNA wiper) kit from Vazyme (Piscataway, NJ, USA). The LightCycle * 96 Real-Time PCR System from Roche (Basel, Switzerland) was employed for qRT-PCR experiments. A 50 μL reaction system was configured, and each sample underwent three biological repeats with three technical repeats. The HiScript® II Q RT SuperMix for qPCR (+gDNA wiper) kit from Vazyme (Piscataway, NJ, USA) was utilized for reverse transcription. Relative expressions were calculated using the 2−ΔΔCt formula. Primers for VfBBXs and the actin EF1α gene are detailed in Table S3. All data are expressed as mean ± SDs (Student’s t-test; * p < 0.05, ** p < 0.01, and *** p < 0.001 considered statistically significant).

4.7. Pearson Correlation Coefficient and Transcriptional Activity Analysis

The Pearson correlation coefficient (r) method was used to calculate the correlation between chlorophyll biosynthesis genes and VfBBX transcription factors. The larger the absolute value of r is, the stronger the correlation is, and the absolute value of r is greater than 0.5 showed in Figure 6A. The full-length CDS of VfBBX9 was inserted into the pGBDKT7 vector. The pGBDKT7-VfBBX9, pGBDKT7-53 vector (positive control), and pGBDKT7-lam vector (negative control) were transformed into the Y2HGold yeast strain. Three SD/-Trp and SD/-Trp/-His/-Ade plates were used to culture the altered yeast cells. Primer information is provided in Supplementary Table S3.

4.8. Subcellular Localization Assay of VfBBX9

The complete coding sequence (CDS) of VfBBX9, excluding the stop codon, was cloned into the pSUPER1300 vector and fused with the green fluorescent protein (GFP) to generate a VfBBX9–GFP fusion protein. The empty pSUPER1300 vector served as the control. These constructs were then introduced into the Agrobacterium tumefaciens strain GV3101. Co-transformation of the GFP-fusion constructs and the nuclear location marker (NF-YA4-mCherry) was performed in Nicotiana benthamiana leaves. Following 48 h of infiltration, fluorescence signals were observed at excitation/emission wavelengths of 488/510 nm (GFP) and 552/610 nm (mCherry) using a confocal laser scanning microscope (Leica SP8, Heidelberg, Germany). Primer information is provided in Supplementary Table S3.

Supplementary Materials

The supporting information can be downloaded at: https://www.mdpi.com/article/10.3390/ijms25041977/s1.

Author Contributions

Investigation, X.T. and J.Y.; Resources, Z.L.; Data curation, K.S., G.Z., Z.L., J.Z. and L.W.; Writing—original draft, K.S.; Writing—review & editing, Z.L.; Visualization, K.S.; Project administration, J.Y.; Funding acquisition, X.T. and J.Y. All authors have read and agreed to the published version of the manuscript.

Funding

This work was funded by the Major project of Natural Science Foundation of Hunan Province (2021JC0007).

Institutional Review Board Statement

Not applicable.

Informed Consent Statement

Not applicable.

Data Availability Statement

Data is contained within the article and Supplementary Material.

Acknowledgments

We are very grateful to Jin Wang from College of Horticulture, Hunan Agricultural University for the discussions and critical reading of this manuscript.

Conflicts of Interest

The authors declare no conflicts of interest.

References

  1. Knödler, M.; Rühl, C.; Emonts, J.; Buyel, J.F. Seasonal Weather Changes Affect the Yield and Quality of Recombinant Proteins Produced in Transgenic Tobacco Plants in a Greenhouse Setting. Front. Plant Sci. 2019, 10, 1245. [Google Scholar] [CrossRef] [PubMed]
  2. Calderon, R.H.; Dalton, J.; Zhang, Y.; Quail, P.H. Shade triggers posttranscriptional PHYTOCHROME-INTERACTING FACTOR-dependent increases in H3K4 trimethylation. Plant Physiol. 2022, 190, 1915–1926. [Google Scholar] [CrossRef] [PubMed]
  3. Kami, C.; Lorrain, S.; Hornitschek, P.; Fankhauser, C. Light-regulated plant growth and development. Curr. Top. Dev. Biol. 2010, 91, 29–66. [Google Scholar] [PubMed]
  4. Cao, J.; Liang, Y.; Yan, T.; Wang, X.; Zhou, H.; Chen, C.; Zhang, Y.; Zhang, B.; Zhang, S.; Liao, J.; et al. The photomorphogenic repressors BBX28 and BBX29 integrate light and brassinosteroid signaling to inhibit seedling development in Arabidopsis. Plant Cell 2022, 34, 2266–2285. [Google Scholar] [CrossRef] [PubMed]
  5. Pham, V.N.; Kathare, P.K.; Huq, E. Phytochromes and Phytochrome Interacting Factors. Plant Physiol. 2018, 176, 1025–1038. [Google Scholar] [CrossRef] [PubMed]
  6. Chang, C.S.; Li, Y.H.; Chen, L.T.; Chen, W.C.; Hsieh, W.P.; Shin, J.; Jane, W.N.; Chou, S.J.; Choi, G.; Hu, J.M.; et al. LZF1, a HY5-regulated transcriptional factor, functions in Arabidopsis de-etiolation. Plant J. 2008, 54, 205–219. [Google Scholar] [CrossRef]
  7. Crocco, C.D.; Holm, M.; Yanovsky, M.J.; Botto, J.F. AtBBX21 and COP1 genetically interact in the regulation of shade avoidance. Plant J. 2010, 64, 551–562. [Google Scholar] [CrossRef]
  8. Wang, J.; Yang, G.; Chen, Y.; Dai, Y.; Yuan, Q.; Shan, Q.; Pan, L.; Dai, L.; Zou, X.; Liu, F.; et al. Genome-Wide Characterization and Anthocyanin-Related Expression Analysis of the B-BOX Gene Family in Capsicum annuum L. Front. Genet. 2022, 13, 847328. [Google Scholar] [CrossRef]
  9. Xu, X.; Xu, J.; Yuan, C.; Chen, Q.; Liu, Q.; Wang, X.; Qin, C. BBX17 Interacts with CO and Negatively Regulates Flowering Time in Arabidopsis thaliana. Plant Cell Physiol. 2022, 63, 401–409. [Google Scholar] [CrossRef]
  10. Yadav, A.; Lingwan, M.; Yadukrishnan, P.; Masakapalli, S.K.; Datta, S. BBX31 promotes hypocotyl growth, primary root elongation and UV-B tolerance in Arabidopsis. Plant Signal. Behav. 2019, 14, e1588672. [Google Scholar] [CrossRef]
  11. Alvarez-Fernandez, R.; Penfold, C.A.; Galvez-Valdivieso, G.; Exposito-Rodriguez, M.; Stallard, E.J.; Bowden, L.; Moore, J.D.; Mead, A.; Davey, P.A.; Matthews, J.S.A.; et al. Time-series transcriptomics reveals a BBX32-directed control of acclimation to high light in mature Arabidopsis leaves. Plant J. 2021, 107, 1363–1386. [Google Scholar] [CrossRef] [PubMed]
  12. Zhao, X.; Heng, Y.; Wang, X.; Deng, X.W.; Xu, D. A Positive Feedback Loop of BBX11-BBX21-HY5 Promotes Photomorphogenic Development in Arabidopsis. Plant Commun. 2020, 1, 100045. [Google Scholar] [CrossRef] [PubMed]
  13. Fan, X.Y.; Sun, Y.; Cao, D.M.; Bai, M.Y.; Luo, X.M.; Yang, H.J.; Wei, C.Q.; Zhu, S.W.; Sun, Y.; Chong, K.; et al. BZS1, a B-box protein, promotes photomorphogenesis downstream of both brassinosteroid and light signaling pathways. Mol. Plant 2012, 5, 591–600. [Google Scholar] [CrossRef] [PubMed]
  14. Xu, D.; Jiang, Y.; Li, J.; Lin, F.; Holm, M.; Deng, X.W. BBX21, an Arabidopsis B-box protein, directly activates HY5 and is targeted by COP1 for 26S proteasome-mediated degradation. Proc. Natl. Acad. Sci. USA 2016, 113, 7655–7660. [Google Scholar] [CrossRef]
  15. Zhang, L.; Liu, M.; Long, H.; Dong, W.; Pasha, A.; Esteban, E.; Li, W.; Yang, X.; Li, Z.; Song, A.; et al. Tung Tree (Vernicia fordii) Genome Provides A Resource for Understanding Genome Evolution and Improved Oil Production. Genom. Proteom. Bioinform. 2019, 17, 558–575. [Google Scholar] [CrossRef] [PubMed]
  16. Li, Z.; Long, H.; Zhang, L.; Liu, Z.; Cao, H.; Shi, M.; Tan, X. The complete chloroplast genome sequence of tung tree (Vernicia fordii): Organization and phylogenetic relationships with other angiosperms. Sci. Rep. 2017, 7, 1869. [Google Scholar] [CrossRef]
  17. Gangappa, S.N.; Botto, J.F. The BBX family of plant transcription factors. Trends Plant Sci. 2014, 19, 460–470. [Google Scholar] [CrossRef]
  18. Khanna, R.; Kronmiller, B.; Maszle, D.R.; Coupland, G.; Holm, M.; Mizuno, T.; Wu, S.H. The Arabidopsis B-box zinc finger family. Plant Cell 2009, 21, 3416–3420. [Google Scholar] [CrossRef]
  19. Chu, Z.; Wang, X.; Li, Y.; Yu, H.; Li, J.; Lu, Y.; Li, H.; Ouyang, B. Genomic Organization, Phylogenetic and Expression Analysis of the B-BOX Gene Family in Tomato. Front. Plant Sci. 2016, 7, 1552. [Google Scholar] [CrossRef]
  20. Feng, Z.; Li, M.; Li, Y.; Yang, X.; Wei, H.; Fu, X.; Ma, L.; Lu, J.; Wang, H.; Yu, S. Comprehensive identification and expression analysis of B-Box genes in cotton. BMC Genom. 2021, 22, 439. [Google Scholar] [CrossRef]
  21. Haberer, G.; Hindemitt, T.; Meyers, B.C.; Mayer, K.F. Transcriptional similarities, dissimilarities, and conservation of cis-elements in duplicated genes of Arabidopsis. Plant Physiol. 2004, 136, 3009–3022. [Google Scholar] [CrossRef]
  22. Datta, S.; Hettiarachchi, C.; Johansson, H.; Holm, M. SALT TOLERANCE HOMOLOG2, a B-box protein in Arabidopsis that activates transcription and positively regulates light-mediated development. Plant Cell 2007, 19, 3242–3255. [Google Scholar] [CrossRef] [PubMed]
  23. Wang, J.; Liu, Y.; Tang, B.; Dai, X.; Xie, L.; Liu, F.; Zou, X. Genome-Wide Identification and Capsaicinoid Biosynthesis-Related Expression Analysis of the R2R3-MYB Gene Family in Capsicum annuum L. Front. Genet. 2020, 11, 598183. [Google Scholar] [CrossRef]
  24. Xiong, C.; Luo, D.; Lin, A.; Zhang, C.; Shan, L.; He, P.; Li, B.; Zhang, Q.; Hua, B.; Yuan, Z.; et al. A tomato B-box protein SlBBX20 modulates carotenoid biosynthesis by directly activating PHYTOENE SYNTHASE 1, and is targeted for 26S proteasome-mediated degradation. New Phytol. 2019, 221, 279–294. [Google Scholar] [CrossRef] [PubMed]
  25. Xu, X.; Wang, Q.; Li, W.; Hu, T.; Wang, Q.; Yin, Y.; Liu, X.; He, S.; Zhang, M.; Liang, Y.; et al. Overexpression of SlBBX17 affects plant growth and enhances heat tolerance in tomato. Int. J. Biol. Macromol. 2022, 206, 799–811. [Google Scholar] [CrossRef]
  26. Chang, C.S.; Maloof, J.N.; Wu, S.H. COP1-mediated degradation of BBX22/LZF1 optimizes seedling development in Arabidopsis. Plant Physiol. 2011, 156, 228–239. [Google Scholar] [CrossRef]
  27. Lin, F.; Jiang, Y.; Li, J.; Yan, T.; Fan, L.; Liang, J.; Chen, Z.J.; Xu, D.; Deng, X.W. B-BOX DOMAIN PROTEIN28 Negatively Regulates Photomorphogenesis by Repressing the Activity of Transcription Factor HY5 and Undergoes COP1-Mediated Degradation. Plant Cell 2018, 30, 2006–2019. [Google Scholar] [CrossRef]
  28. Gangappa, S.N.; Holm, M.; Botto, J.F. Molecular interactions of BBX24 and BBX25 with HYH, HY5 HOMOLOG, to modulate Arabidopsis seedling development. Plant Signal. Behav. 2013, 8, e25208. [Google Scholar] [CrossRef]
  29. Buelbuel, S.; Sakuraba, Y.; Sedaghatmehr, M.; Watanabe, M.; Hoefgen, R.; Balazadeh, S.; Mueller-Roeber, B. Arabidopsis BBX14 negatively regulates nitrogen starvation- and dark-induced leaf senescence. Plant J. 2023, 116, 251–268. [Google Scholar] [CrossRef]
  30. El-Gebali, S.; Mistry, J.; Bateman, A.; Eddy, S.R.; Luciani, A.; Potter, S.C.; Qureshi, M.; Richardson, L.J.; Salazar, G.A.; Smart, A.; et al. The Pfam protein families database in 2019. Nucleic Acids Res. 2019, 47, 427–432. [Google Scholar] [CrossRef] [PubMed]
  31. Finn, R.D.; Clements, J.; Eddy, S.R. HMMER web server: Interactive sequence similarity searching. Nucleic Acids Res. 2011, 39, W29–W37. [Google Scholar] [CrossRef]
  32. Gasteiger, E.; Gattiker, A.; Hoogland, C.; Ivanyi, I.; Appel, R.D.; Bairoch, A. ExPASy: The proteomics server for in-depth protein knowledge and analysis. Nucleic Acids Res. 2003, 31, 3784–3788. [Google Scholar] [CrossRef] [PubMed]
  33. Schwede, T.; Kopp, J.; Guex, N.; Peitsch, M.C. SWISS-MODEL: An automated protein homology-modeling server. Nucleic Acids Res. 2003, 31, 3381–3385. [Google Scholar] [CrossRef]
  34. Hu, B.; Jin, J.; Guo, A.Y.; Zhang, H.; Luo, J.; Gao, G. GSDS 2.0: An upgraded gene feature visualization server. Bioinformatics 2015, 31, 1296–1297. [Google Scholar] [CrossRef]
  35. Kumar, S.; Stecher, G.; Li, M.; Knyaz, C.; Tamura, K. MEGA X: Molecular Evolutionary Genetics Analysis across Computing Platforms. Mol. Biol. Evol. 2018, 35, 1547–1549. [Google Scholar] [CrossRef]
  36. Chen, C.; Wu, Y.; Li, J.; Wang, X.; Zeng, Z.; Xu, J.; Liu, Y.; Feng, J.; Chen, H.; He, Y.; et al. TBtools-II: A “one for all, all for one” bioinformatics platform for biological big-data mining. Mol. Plant 2023, 16, 1733–1742. [Google Scholar] [CrossRef]
  37. Lescot, M.; Déhais, P.; Thijs, G.; Marchal, K.; Moreau, Y.; Van de Peer, Y.; Rouzé, P.; Rombauts, S. PlantCARE, a database of plant cis-acting regulatory elements and a portal to tools for in silico analysis of promoter sequences. Nucleic Acids Res. 2002, 30, 325–327. [Google Scholar] [CrossRef] [PubMed]
  38. Jin, J.; Tian, F.; Yang, D.C.; Meng, Y.Q.; Kong, L.; Luo, J.; Gao, G. PlantTFDB 4.0: Toward a central hub for transcription factors and regulatory interactions in plants. Nucleic Acids Res. 2017, 45, 1040–1045. [Google Scholar] [CrossRef] [PubMed]
  39. Bu, D.; Luo, H.; Huo, P.; Wang, Z.; Zhang, S.; He, Z.; Wu, Y.; Zhao, L.; Liu, J.; Guo, J.; et al. KOBAS-i: Intelligent prioritization and exploratory visualization of biological functions for gene enrichment analysis. Nucleic Acids Res. 2021, 49, W317–W325. [Google Scholar] [CrossRef] [PubMed]
Figure 1. Conserved domains and gene structure of the VfBBX gene family. (A) The distributions of conserved motifs in VfBBXs, orange bars represent as B-box1 motif, blue bars represent as B-box2 motif, and green bars represent as CCT motif; (B) Gene structure of VfBBX genes, the blue squares represent the exon, and the black dotted lines represent intron.
Ijms 25 01977 g001
Figure 2. Chromosomal location and interspecies gene synteny in VfBBX genes. Blue lines in the middle indicate duplicated gene pairs of VfBBXs. The positions of VfBBX genes in the tung tree genome are marked on chromosomes; Chr refers to chromosomes.
Ijms 25 01977 g002
Figure 3. Phylogenetic relationships and predicted cis-elements analysis of VfBBX genes. (A) Phylogenetic tree for the 22 VfBBXs. Red genes were classified in Group I, blue members belonged to Group II, green genes to Group III, and yellow members to Group IV. (B) Promoter sequences (−2000 bp) of VfBBXs were analyzed using PlantCARE. Different shapes and colors represent different elements. Annotated cis-elements are listed in Supplementary Table S2.
Ijms 25 01977 g003
Figure 4. Expression patterns, GO, and KEGG enrichment of VfBBX family members. (A) Expression profiles based on RNA-seq fragments per kilobase million (FPKM) data. WAF: weeks after flowering; DBF: days before flowering; (B) GO enrichment pathway analysis of VfBBX genes. Different degrees of the green bar represented cellular components, molecular function, and biological process, respectively; (C) KEGG enrichment analysis of VfBBX family members.
Ijms 25 01977 g004
Figure 5. Phenotypes of different light-shading treatments of tung tree seedlings. (A) Tung tree seedlings in different light-shading treatments, normal light (L1), 75% (L2), 50% (L3), and 25% (L4) light intensity levels; (B) Chlorophyll content of tung tree seedlings in different light-shading treatments; (C) POD activity of tung tree seedlings in different light-shading treatments; (D) MDA content of tung tree seedlings in different light-shading treatments; (E) CAT activity of tung tree seedlings in different light-shading treatments; (F) SOD activity of tung tree seedlings in different light-shading treatments, * p < 0.05, ** p < 0.01, and *** p < 0.001 considered statistically significant; (G) Relative expression analysis of candidate VfBBX genes in different light-shading treatments, * p < 0.05, and *** p < 0.001 considered statistically significant.
Ijms 25 01977 g005
Figure 6. Candidate gene analysis, transcriptional activity, and subcellular localization of VfBBX9. (A) Pearson correlation analysis between chlorophyll biosynthesis genes and VfBBX genes, the larger the |r| value, the higher the correlation, and the correlation of |r| > 0.45 is shown in the figure. The positive correlation is represented by green, and the negative correlation is represented by yellow; (B) Transcriptional activation activity of VfBBX9 in yeast. Positive control, BD-53 + AD-T; negative control, pGBKT7-VfBBX9 + pGADT7; (C) The fusion protein 35S::GFP-VfBBX9 and the control vector was transiently expressed in tobacco leaves and subsequently observed using fluorescence microscopy. The scale bar represents 20 μm.
Ijms 25 01977 g006
Table 1. The basic information of VfBBX gene family in tung tree.
IDGeneIDChrStartEndStrainPIMw (Da)Subcellular Localization
VfBBX1Vf00G1104089,66291,7386.01 45,087.65 Nuclear
VfBBX2Vf01G1441174,174,77574,175,5234.82 24,310.77 Extracellular
VfBBX3Vf01G1524180,724,51980,726,304+5.14 48,109.19 Nuclear
VfBBX4Vf01G1861196,727,79296,732,3895.26 45,193.41 Nuclear
VfBBX5Vf01G1866196,872,98296,873,3507.52 13,502.70 Nuclear
VfBBX6Vf02G0664216,076,93516,079,364+4.91 26,074.67 Nuclear
VfBBX7Vf02G1554284,978,26884,980,266+6.30 23,345.27 Nuclear
VfBBX8Vf02G1583285,667,65385,669,2725.12 38,733.10 Nuclear
VfBBX9Vf06G1320667,314,27767,315,8415.64 51,051.01 Nuclear
VfBBX10Vf06G1395669,031,67069,033,068+4.77 32,524.05 Nuclear
VfBBX11Vf06G1396669,040,07069,041,484+5.61 39,894.44 Nuclear
VfBBX12Vf06G1986677,933,55077,935,9265.80 43,554.53 Nuclear
VfBBX13Vf06G1987677,938,31277,940,6885.80 43,538.49 Nuclear
VfBBX14Vf07G2616781,738,81081,741,4716.52 54,454.33 Nuclear
VfBBX15Vf08G038289,584,1019,585,3136.35 41,569.61 Nuclear
VfBBX16Vf08G2000879,397,60679,398,6945.94 37,033.50 Nuclear
VfBBX17Vf09G1910970,869,95770,871,084+6.35 34,220.51 Nuclear
VfBBX18Vf10G14701018,835,58418,837,119+5.10 51,746.70 Nuclear
VfBBX19Vf10G15541020,915,53120,922,830+5.91 57,450.27 Extracellular
VfBBX20Vf11G03911139,393,70639,397,065+5.79 31,878.61 Nuclear
VfBBX21Vf11G08351156,711,53056,712,5334.40 29,473.33 Extracellular
VfBBX22Vf11G10631161,707,35761,713,7975.31 20,704.38 Nuclear
Disclaimer/Publisher’s Note: The statements, opinions and data contained in all publications are solely those of the individual author(s) and contributor(s) and not of MDPI and/or the editor(s). MDPI and/or the editor(s) disclaim responsibility for any injury to people or property resulting from any ideas, methods, instructions or products referred to in the content.

