Article

Alterations in Genome Organization in Lymphoma Cell Nuclei due to the Presence of the t(14;18) Translocation

1
Clinical Genomics Laboratory, Royal Marsden NHS Foundation Trust, London SW3 6JJ, UK
2
Department of Biological, Geological, and Environmental Sciences, University of Catania, Via Androne 81, 95124 Catania, Italy
3
Centre for Genome Engineering and Maintenance (CenGEM), College of Health, Medicine and Life Sciences, Brunel University London, Kingston Lane, Uxbridge UB8 3PH, UK
4
Leukaemia and Chromosome Research Laboratory, College of Health, Medicine and Life Sciences, Brunel University London, Kingston Lane, Uxbridge UB8 3PH, UK
*
Author to whom correspondence should be addressed.
Int. J. Mol. Sci. 2024, 25(4), 2377; https://doi.org/10.3390/ijms25042377
Submission received: 15 January 2024 / Revised: 10 February 2024 / Accepted: 15 February 2024 / Published: 17 February 2024
(This article belongs to the Special Issue Genome Functions and Chromatin Organization in Health and Disease)

Abstract

:
Chromosomal rearrangements have been shown to alter genome organization, consequently having an impact on gene expression. Studies on certain types of leukemia have shown that gene expression can be exacerbated by the altered nuclear positioning of fusion genes arising from chromosomal translocations. However, studies on lymphoma have been, so far, very limited. The scope of this study was to explore genome organization in lymphoma cells carrying the t(14;18)(q32;q21) rearrangement known to results in over-expression of the BCL2 gene. In order to achieve this aim, we used fluorescence in situ hybridization to carefully map the positioning of whole chromosome territories and individual genes involved in translocation in the lymphoma-derived cell line Pfeiffer. Our data show that, although there is no obvious alteration in the positioning of the whole chromosome territories, the translocated genes may take the nuclear positioning of either of the wild-type genes. Furthermore, the BCL2 gene was looping out in a proportion of nuclei with the t(14;18) translocation but not in control nuclei without the translocation, indicating that chromosome looping may be an essential mechanism for BCL2 expression in lymphoma cells.

1. Introduction

Follicular lymphoma is a notoriously indolent type of non-Hodgkin lymphoma affecting B-cell lineage in adults. A classical hallmark of follicular lymphoma is the chromosomal translocation t(14;18)(q32;q21), which is present in 85–90% of cases [1,2,3]. The mechanisms of tumorigenesis associated with t(14;18) have been attributed to a block of apoptosis brought about by an ectopic over-expression of the anti-apoptotic factor BCL2. The translocation, in fact, relocates the BCL2 gene within the transcriptional influence of the IGH enhancer [4]. Additional cooperating events are, however, required for full transformation and disease manifestation [5,6,7,8].
It is now well established that chromosomal rearrangements can disturb the arrangement of the genome within the nucleus [9,10,11]. From the observation of non-random occupancy of chromosomes into territories and the transcriptionally dependent localization of individual genes [12,13,14], an increasing number of studies are focusing on the link between nuclear disturbance and the development of disease [9,15,16]. Studies have proven that the localization of genes within the nucleus is generally associated with their transcriptional activity, with the inner portion of the nucleus usually being transcriptionally active and peripheral regions tending to be transcriptionally repressed [17,18,19,20]. It has also been shown that this genomic property is evolutionary conserved in all primates [21].
While various studies have found an association between chromosomal rearrangements and a dysregulation of the genes implicated in leukemia in relation to nuclear organization [22,23], the lymphoma-associated translocation t(14;18) has not been investigated in this context to date.
In this study, we sought to characterize the nuclear localization of chromosomal territories and individual genes involved in the t(14;18) translocation in the Pfeiffer cell line. By using different combinations of FISH probes specific to the loci involved in this translocation, we were able to investigate their functional organization in interphase nuclei of the Pfeiffer cell line and in healthy lymphocytes.

2. Results

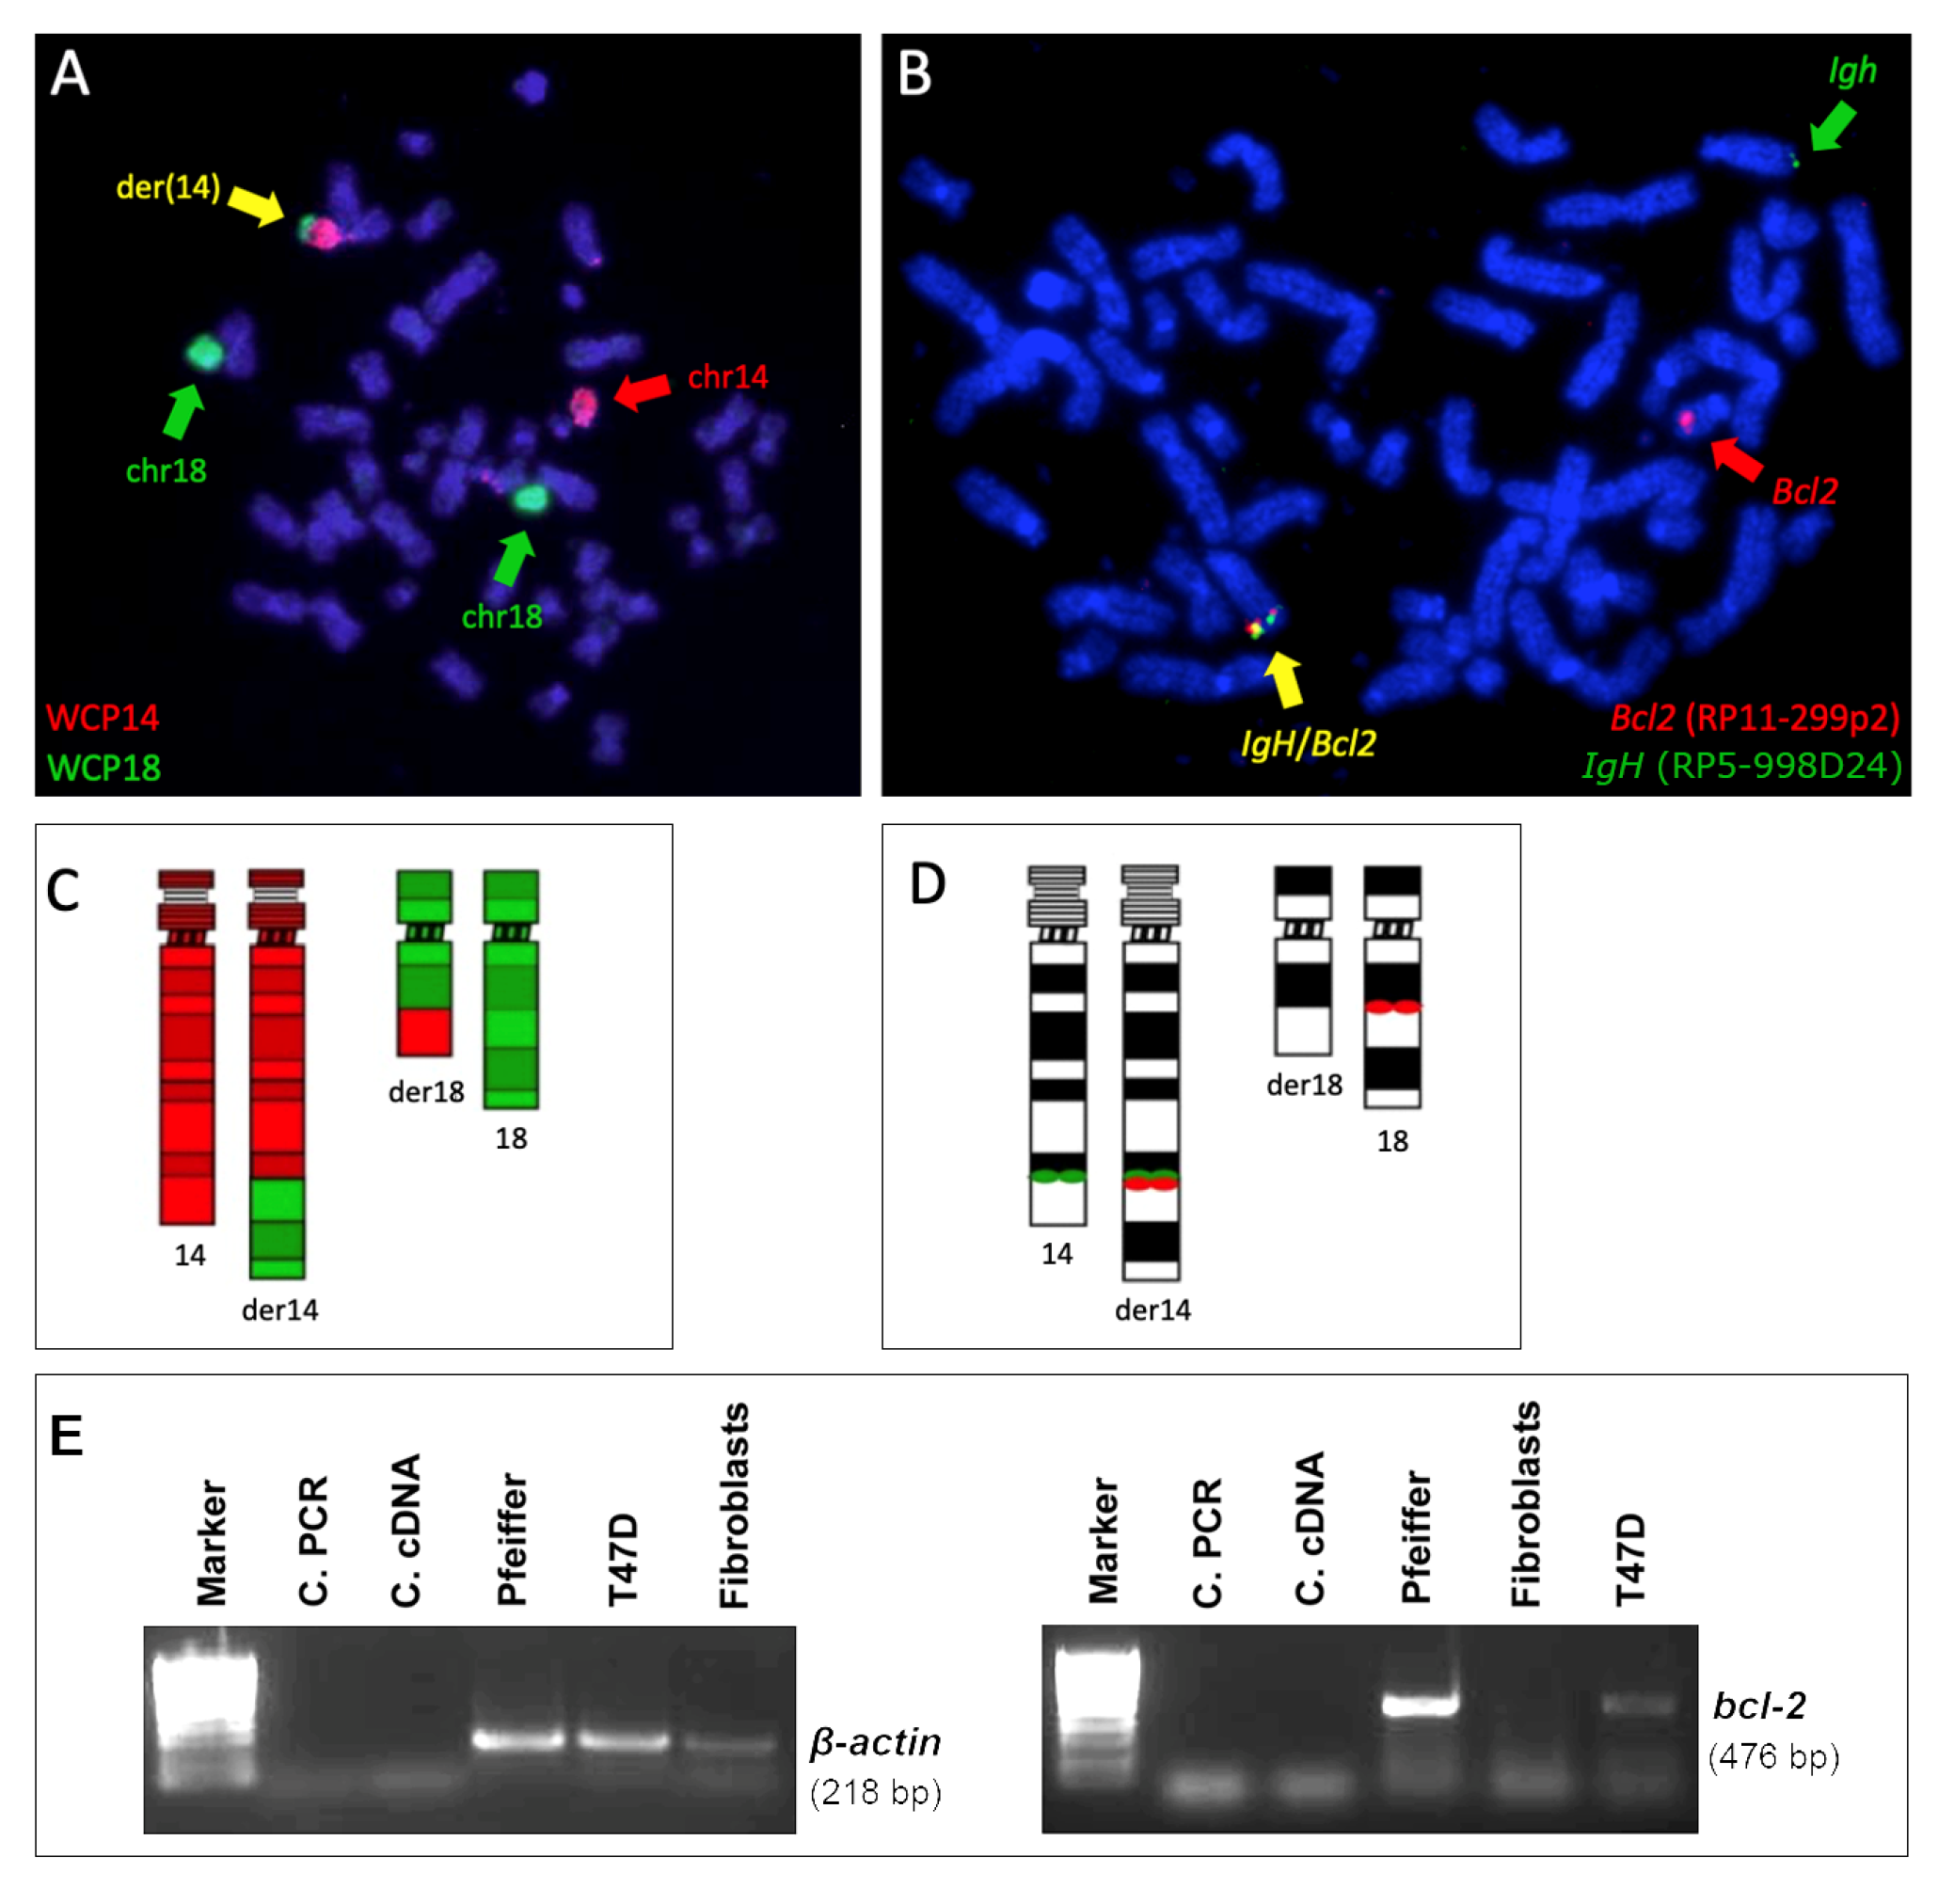
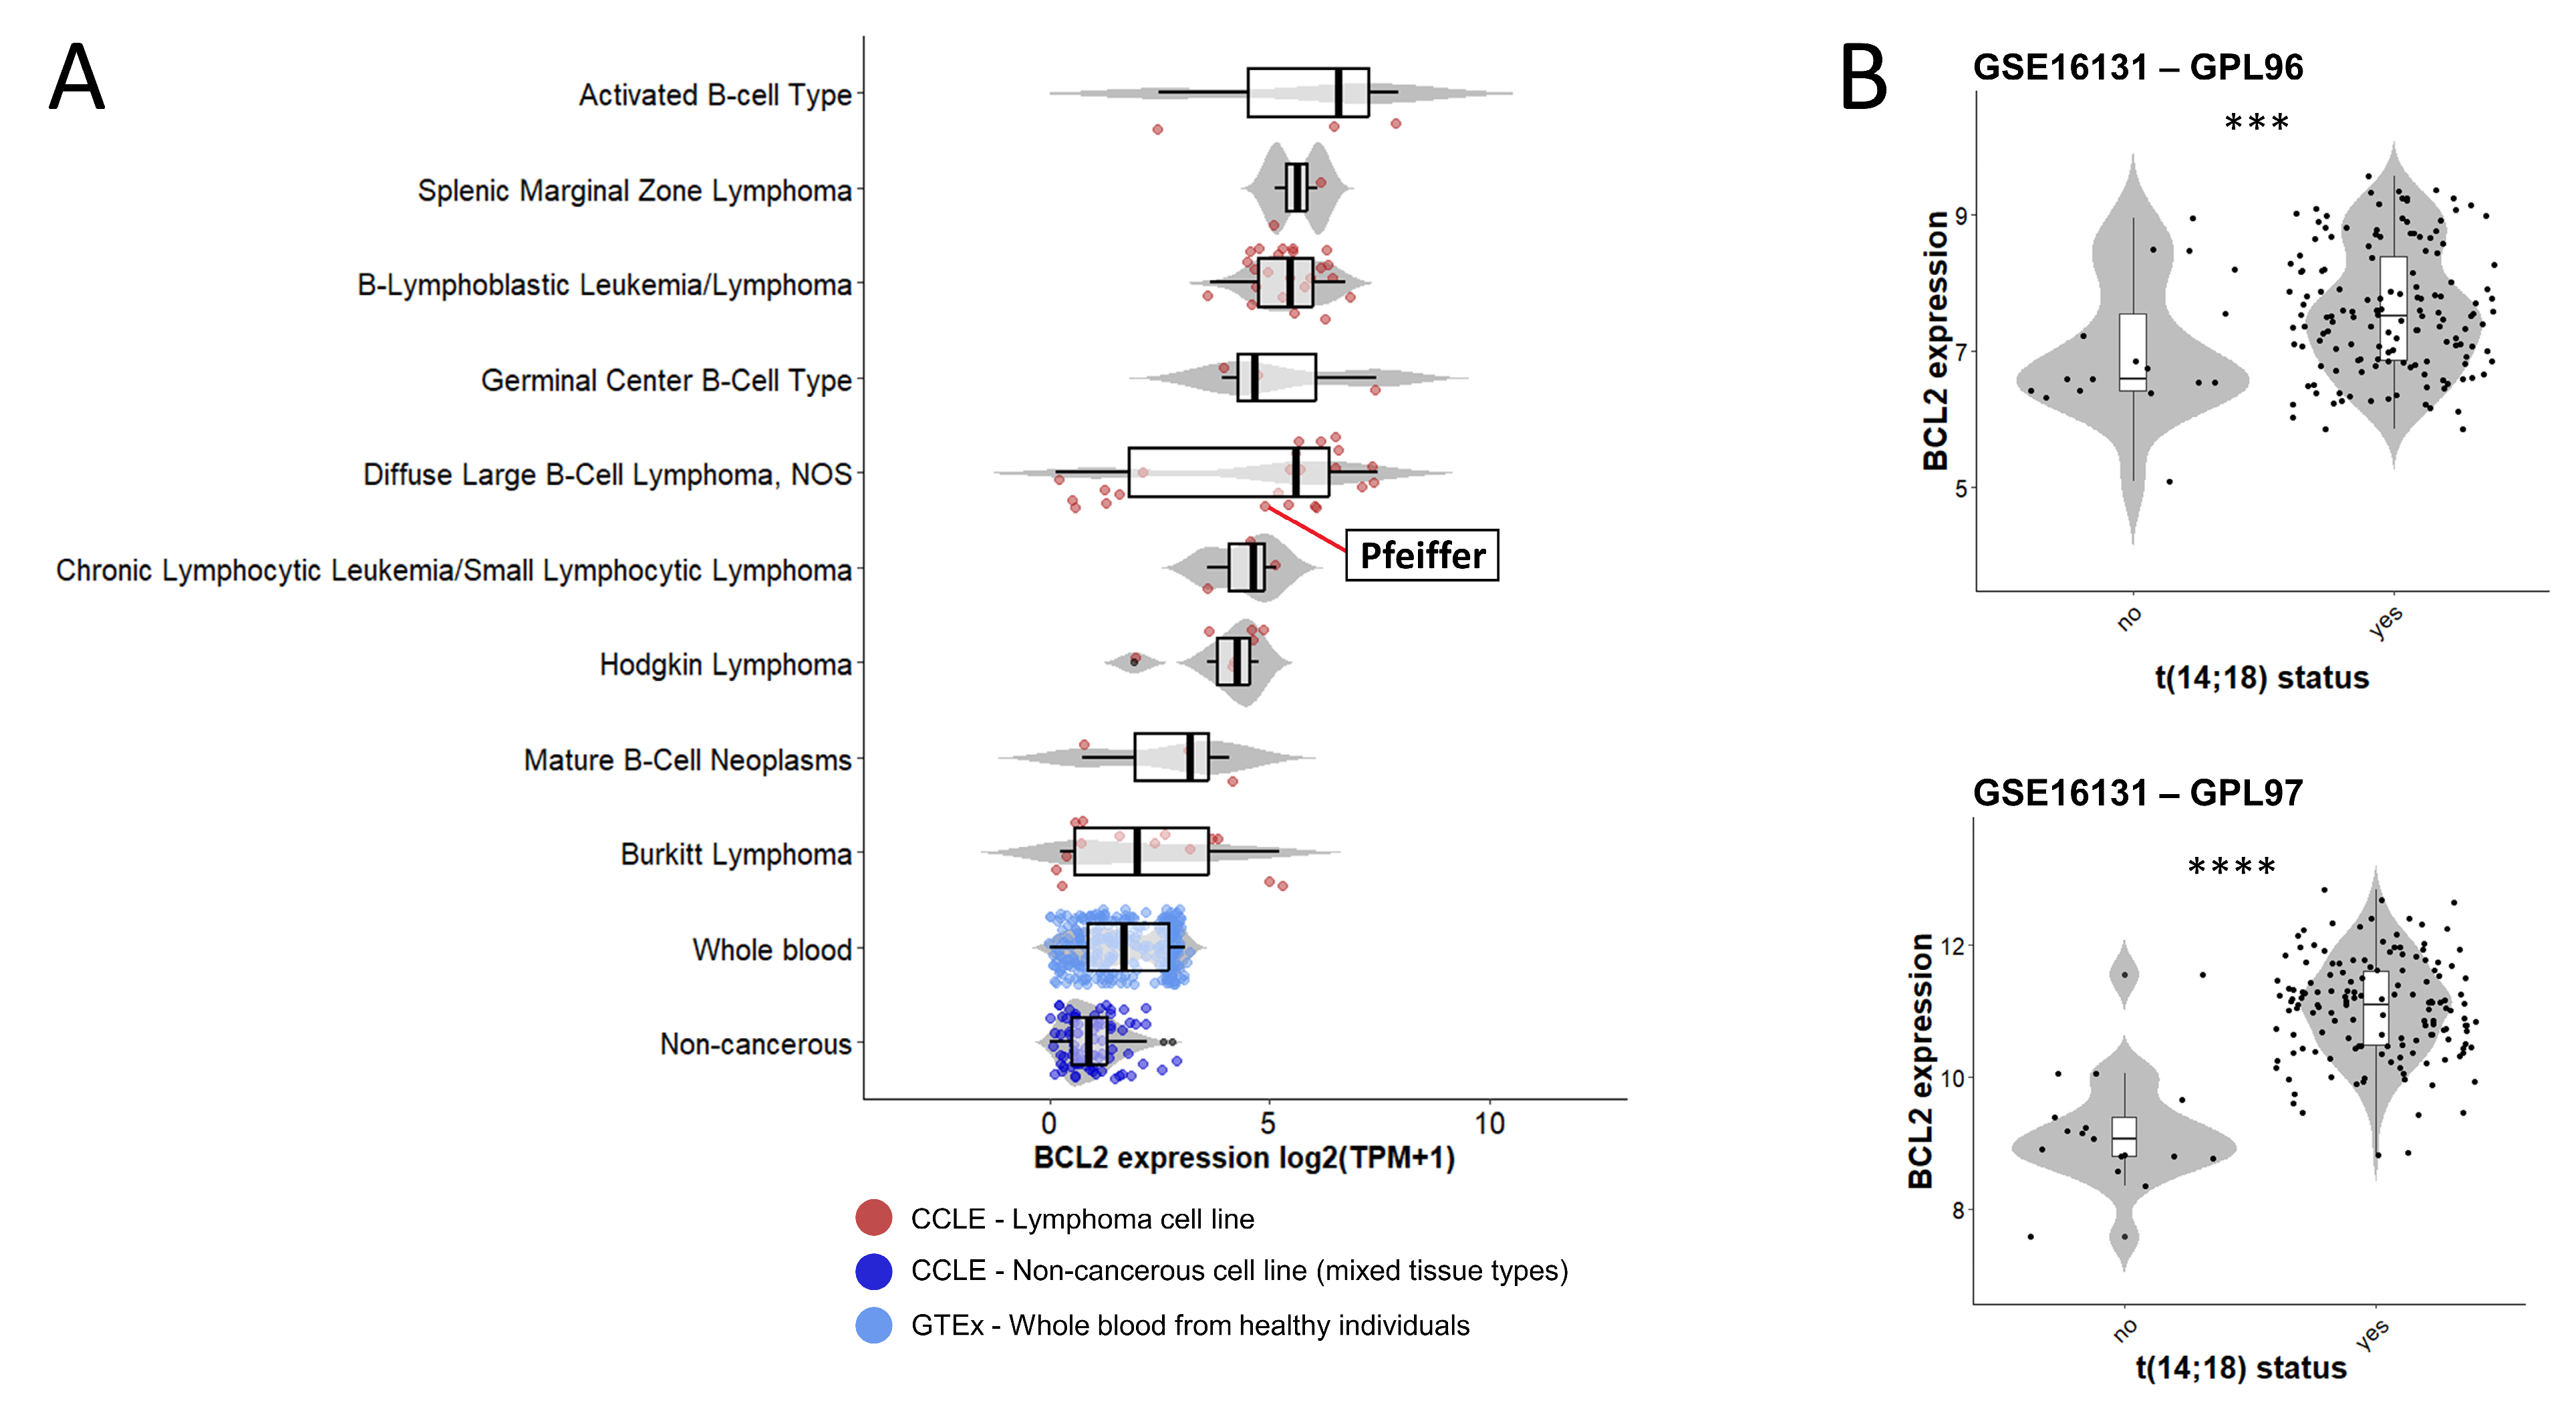
2.1. t(14;18) Translocation and BCL2 Expression in the Pfeiffer Cell Line

The presence of t(14;18) in the Pfeiffer cell line was confirmed by FISH using the probe combinations described in the Section 4. Due to the limited extent of the translocated portion from chromosome 14, der(18) was undetectable with the use of whole chromosome painting (WCP) (Figure 1A). The use of both WCP and bacterial artificial clone (BAC) probes, respectively, enabled us to clearly identify der(14) and IGH::BCL2 gene fusion (Figure 1). The presence of this translocation is consistent with the BCL2 gene expression detected in this cell line as well as in patients with lymphoma (Figure 2). RNA-seq data from lymphoma cell lines retrieved from the Cancer Cell Line Encyclopedia (CCLE) showed different levels of BCL2 expression, with the highest levels being observed in diffuse large B-cell lymphoma lines, including the Pfeiffer line, whereas the lowest expression levels were seen in whole blood and non-cancerous tissue (Figure 2A). BCL2 expression in the Pfeiffer cell lines was also confirmed in-house using reverse transcription (RT) PCR (Figure 1E). We also interrogated the expression of BCL2 from patients with follicular lymphoma with and without t(14;18) from publicly available data (GSE16131) [24]. BCL2 expression was significantly higher in patients harboring the translocation compared to patients without t(14;18) in both of the microarray experiments considered in this study (GPL96 and GPL97) (Figure 2B).

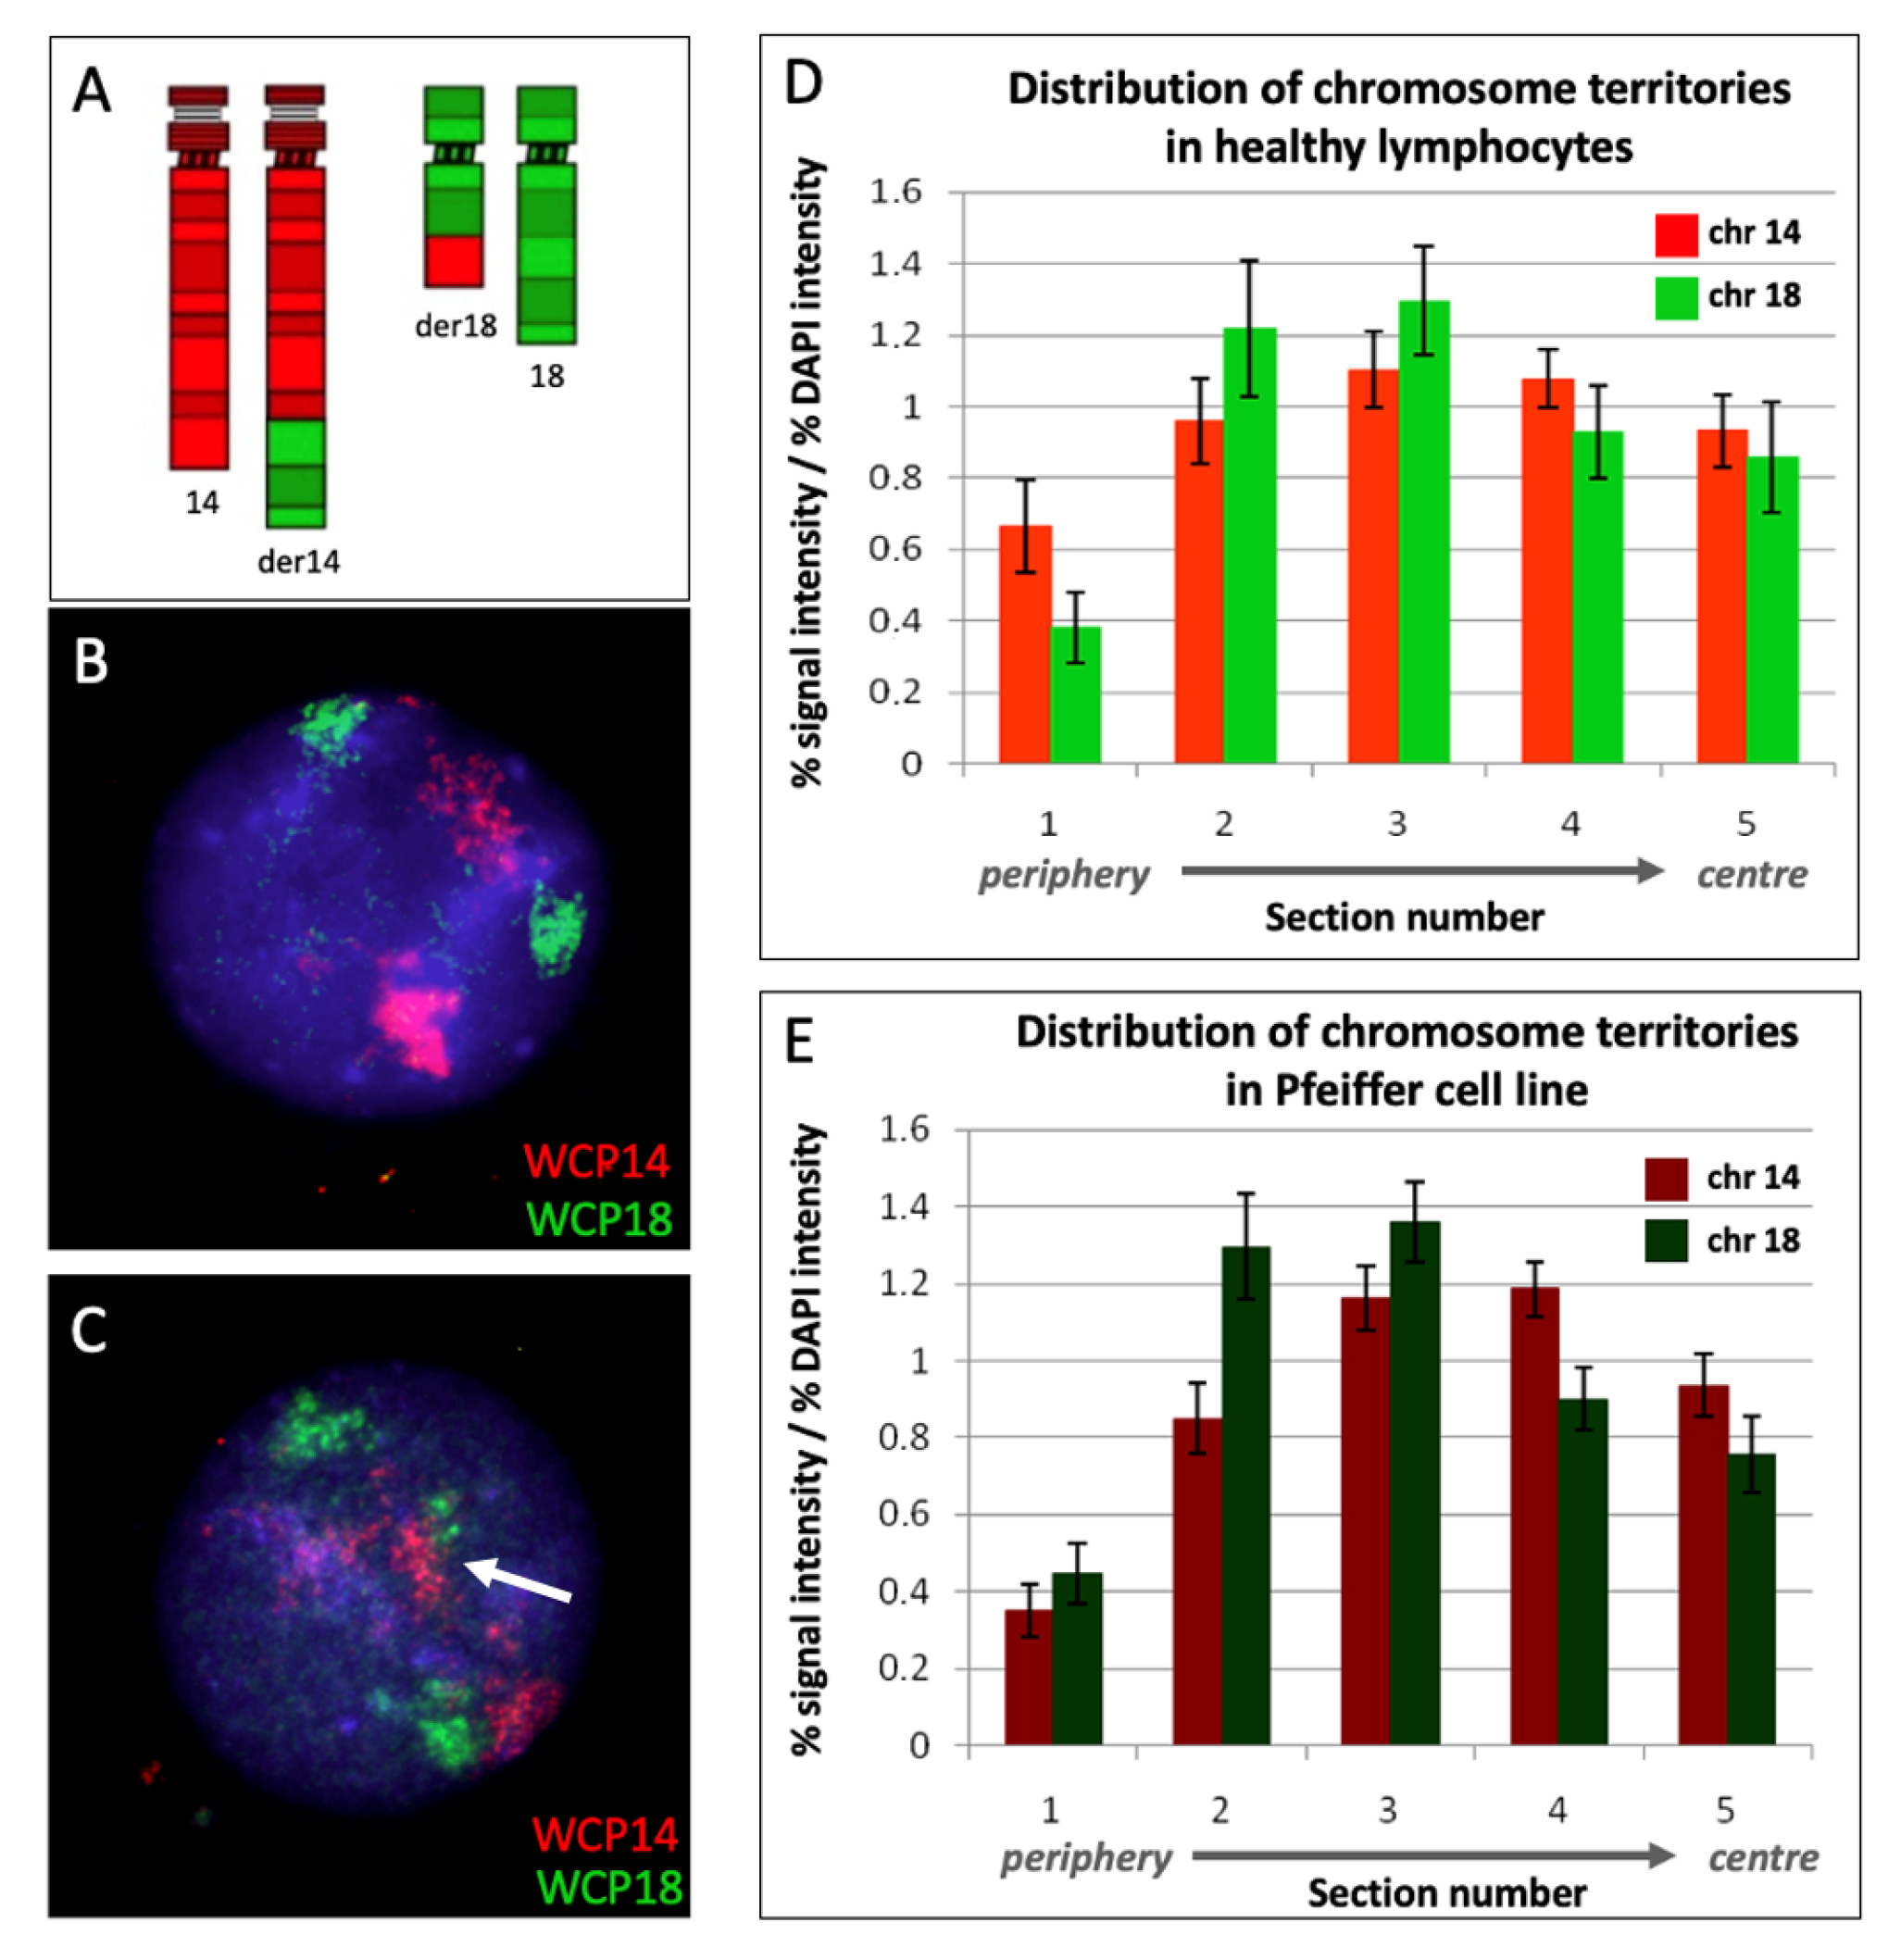
2.2. Chromosome Territories 14 and 18 Are Unaltered in the Pfeiffer Cell Line Compared to Healthy Lymphocytes

The distribution of the territories of chromosomes 14 and 18 were determined in nuclei from healthy lymphocytes and the Pfeiffer cell line. When using WCP probes for chromosomes 14 and 18 (Figure 3A), normal lymphocytes revealed an intermediate positioning of chromosome 14 and a peripheral positioning of chromosome 18 (Figure 3B).
The same probe combination was used in the Pfeiffer cell line (Figure 3C). The analysis of the non-translocated chromosomes 14 and 18 did not detect positional shifts in the location of these chromosomes compared to the controls. Specifically, the intermediate positioning of chromosome 14 and the peripheral positioning of chromosome 18 observed in the control lymphocytes (Figure 3D) was maintained in the Pfeiffer cell nuclei (Figure 3E).

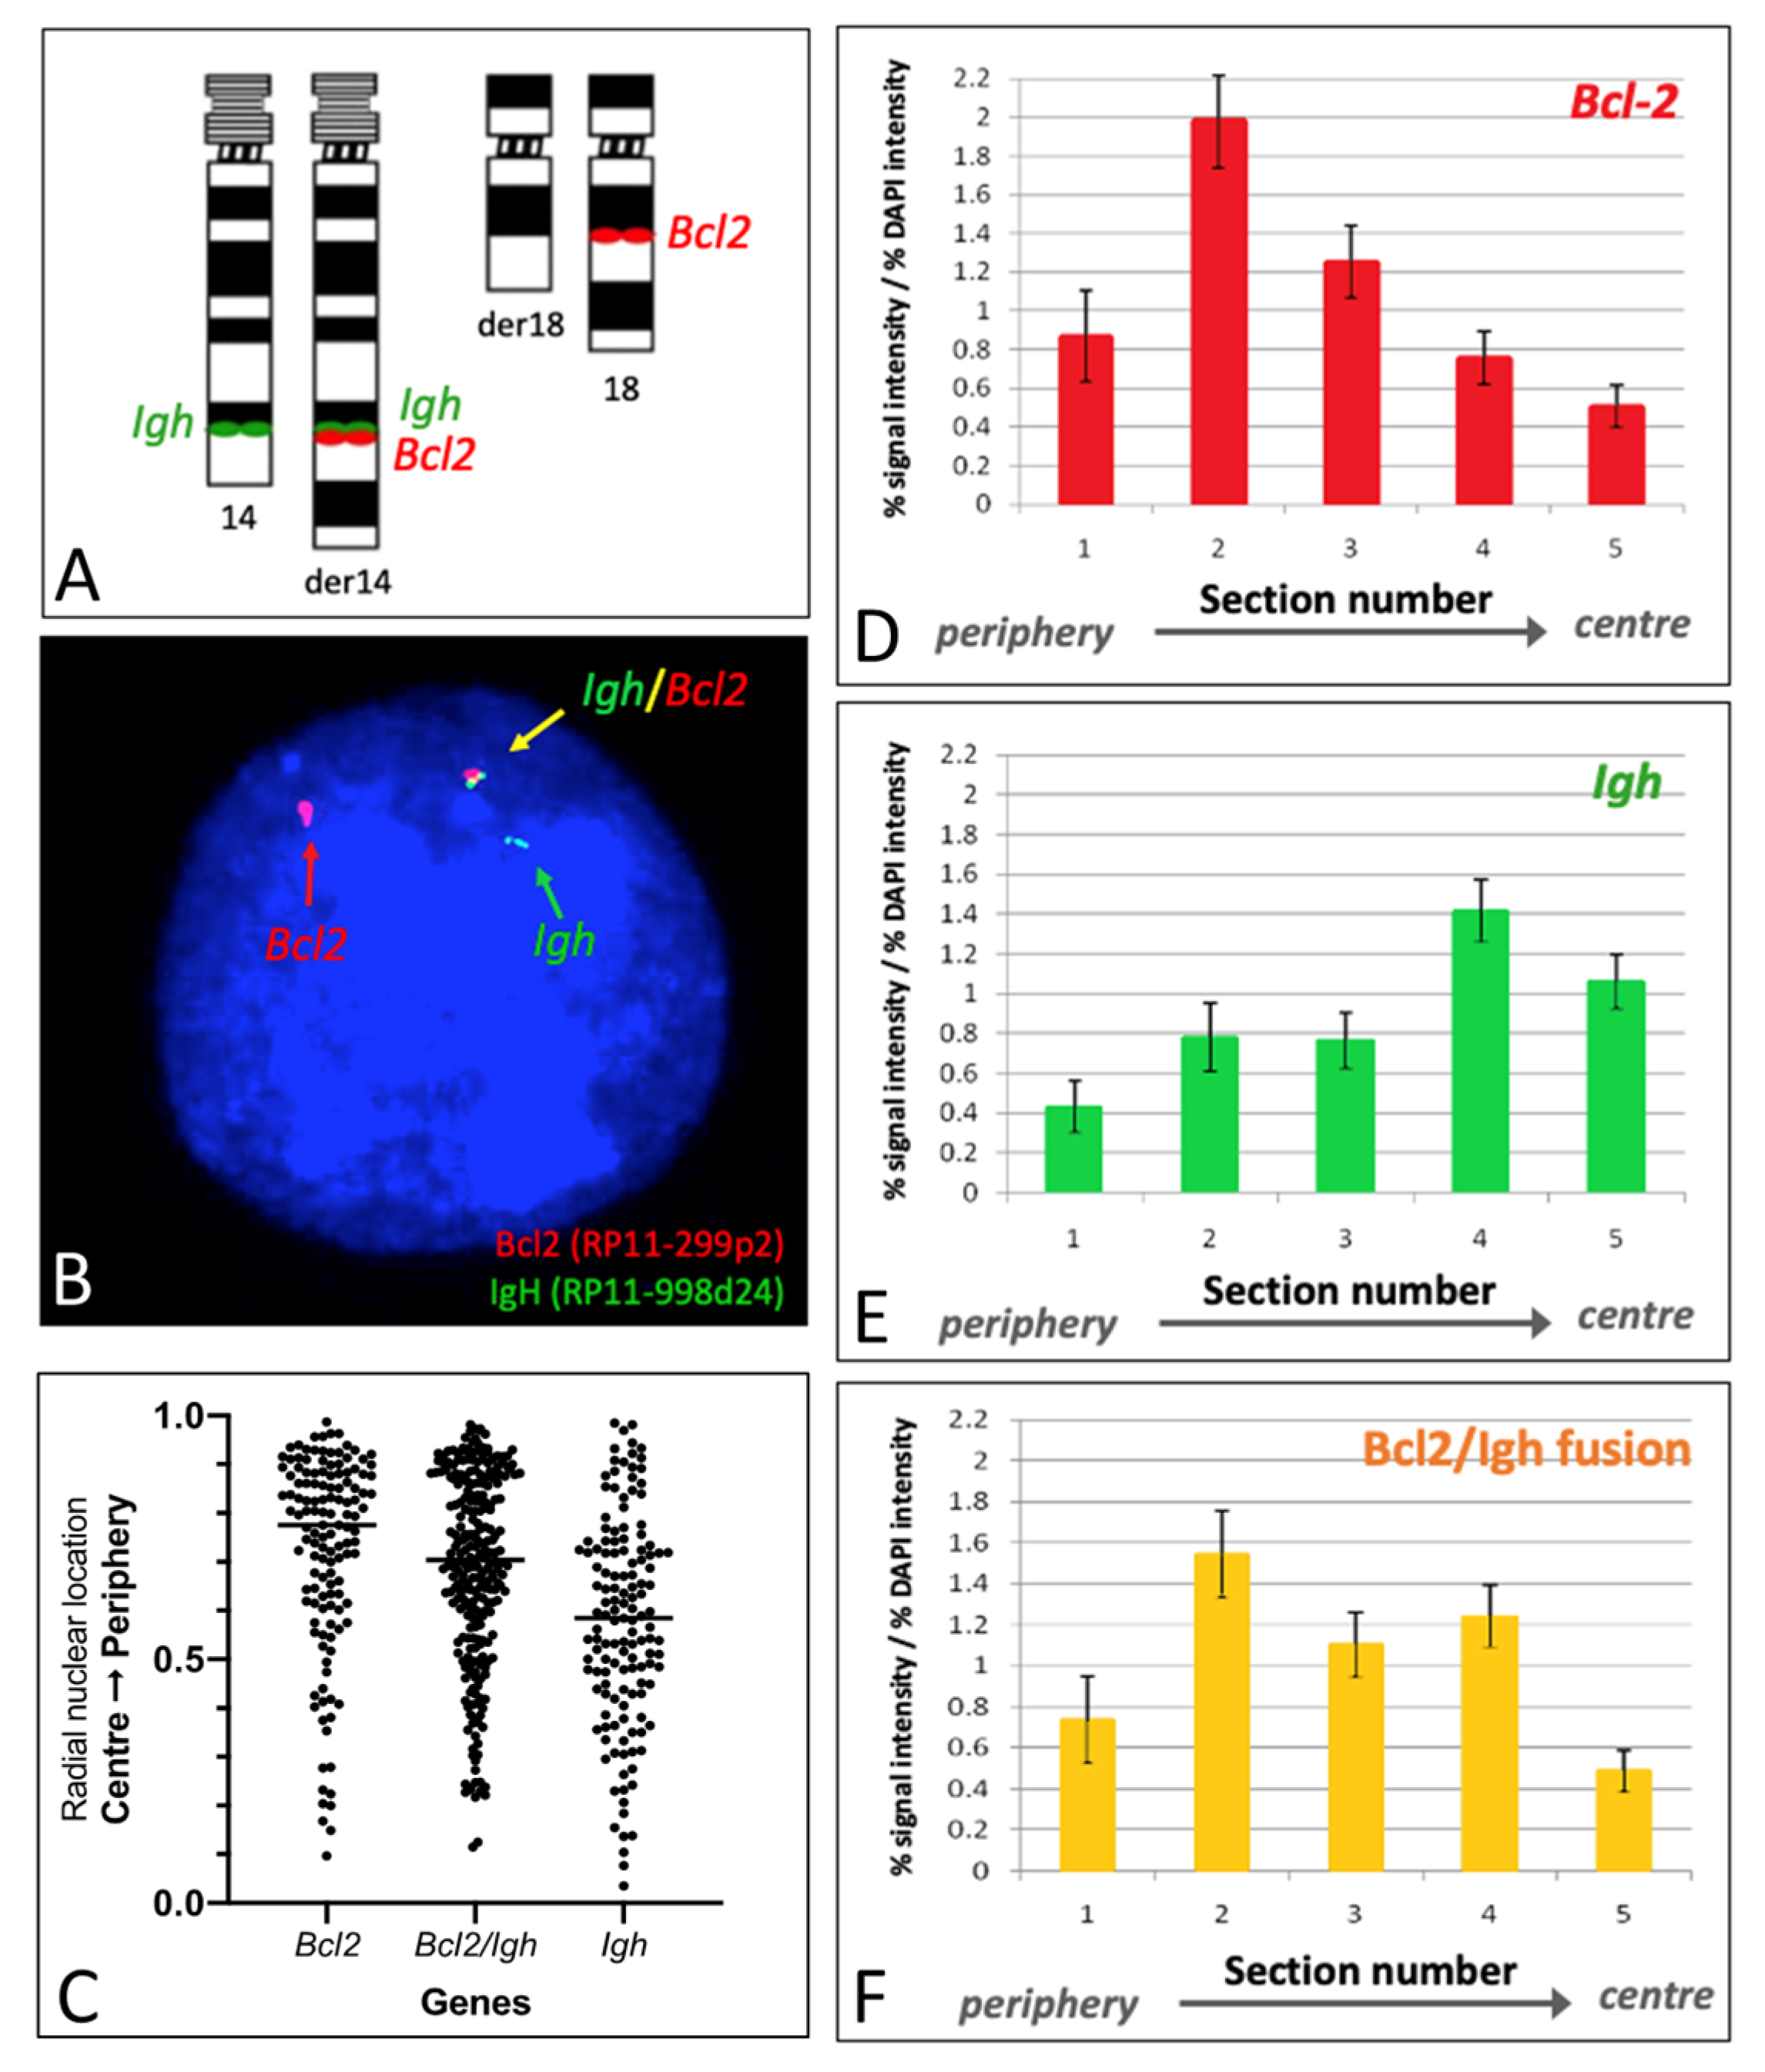
2.3. Nuclear Positioning of BCL2, IGH, and BCL2::IGH

We determined the position of the individual genes involved in t(14;18), namely, BCL2 (18q21) and IGH (14q32), and the resulting fusion gene, BCL2::IGH. FISH, using single-locus probes (Figure 4A), allowed the discrimination of the translocated and non-translocated alleles. As shown in a representative nucleus of the Pfeiffer cell line (Figure 4B), the non-translocated BCL2 locus is visible in red, the non-translocated IGH in green, and the fusion on der(14) is detectable in yellow. The positioning of the individual genes within the nucleus was determined by radial nuclear location (RNL) [22] (Figure 4C) and by an erosion analysis based on the evaluation of signal intensity in each nuclear section [25] (Figure 4D,E).
Using both RNL and erosion analysis, the highest signal intensity for the non-translocated BCL2 allele was found within nuclear zone 2, indicating a preferentially peripheral localization (Figure 4C,D). The non-translocated IGH allele displayed an inner/intermediate localization, with a peak in the intermediate nuclear Section 4 (Figure 4C,E). The localization of the BCL2::IGH fusion signal presented a bimodal distribution within the analyzed nuclei, with two peaks at sections 2 (more peripheral) and 4 (more internal) mimicking the positioning of both wild-type alleles (Figure 4C,F).

2.4. Gene Nuclear Positioning in Relation to Their Corresponding Chromosomal Territories

In order to define the nuclear localization of individual genes in relation to their respective chromosomal territories, we conducted dual-color FISH by combining WCP paints and single-locus probes for BCL2 and IGH, respectively (Figure 5 and Figure 6). FISH using the IGH + 14WCP probe combination showed that the IGH gene was localized within the chromosome 14 territory in the majority of lymphocyte nuclei (58.1%), whereas it was looping out in the majority of nuclei in the Pfeiffer cell line from at least one chromosome (54.9% of nuclei) or from both chromosomes (7.3%). Looping out of the IGH locus in the Pfeiffer cell line is statistically different compared to the control cells (p = 0.005 evaluated by a Chi-square test) (Figure 5C). FISH using the BCL2 + 18WCP probe combination showed that almost 100% of lymphocyte nuclei retained the BCL2 signal within the chromosome 18 territory, whereas, in the Pfeiffer cell line, the BCL2 signal was found within the chromosome 18 territory when observing the non-translocated chromosome 18 and was looping out of the der(14) territory in 15.5% of the nuclei. Looping out of the BCL2 locus in the Pfeiffer cell line is significantly statistically different compared to the control cells (p = 0.005 evaluated by Chi-square test) (Figure 6C).

3. Discussion

The Pfeiffer cell line is a good cellular model for studying hematological malignancies characterized by BCL2 over-expression. The cell line was originally derived from a patient with diffuse large B-cell lymphoma (DLBCL), harboring the t(14;18) translocation [26]. The pathogenesis of t(14;18) precludes the activation of the BCL2 gene due to its juxtaposition under the regulatory influence of the IGH locus. In this study, we examined the nuclear organization of the loci involved in this rearrangement in the Pfeiffer cell line to better understand the mechanisms of transcriptional activation in relation to genome organization when a translocation does not result in the generation of a chimeric protein but in the activation of a proto-oncogene.
Our observations demonstrate that, in the Pfeiffer cell line, the chromosome territories contributing to the t(14;18) translocation do not show dramatic changes in their nuclear positioning compared to healthy lymphocytes. However, when observing the individual genes involved in the translocation, signals specific to the BCL2::IGH fusion indicate that the translocation may take the nuclear positioning of either of the wild-type genes. Previous reports on the nuclear positioning of translocation derivatives have documented various scenarios. For instance, the fusion gene EWSR1::FLI1 resulting from t(11;22) in Ewing sarcoma has been reported to take an intermediate position in the cell nucleus when compared with wild-type EWSR1 and FLI1 [27]. Similarly, the translocation t(7;12)(q36,p13) in childhood acute myeloid leukemia results in the repositioning of the translocated MNX1 gene to a more internal portion of the cell nucleus, driven by its translocation partner ETV6 [28]. On the other hand, the Philadelphia chromosome resulting from t(9;22) in chronic myeloid leukemia does not change nuclear positioning compared to wild-type BCR and ABL since both genes occupy similar regions in the cell nucleus [29].
In this study, not only did we observe the positioning of translocation genes in the context of the cell nucleus, but we also looked at their positioning in relation to their chromosome territories. We noticed that BCL2 was looping out of the chromosome territory only when translocated, hence protruding from the der(14) territory, in a relatively small percentage of nuclei. In absence of the translocation, we observed that BCL2 remained within the chromosome 18 territory in normal lymphocytes, with no exception. This discrepancy may be due to a lack of BCL2 expression in normal lymphocytes. Our observations strongly suggest that chromosome looping may be essential for BCL2 expression in t(14;18) lymphoma, where the BCL2 locus happens to be juxtaposed to the IGH promoter/enhancer on der(14). It remains to be clarified whether the new position of BCL2 on der(14) requires looping in order to initiate transcription simply due to the usual process that would occur for IGH wild-type or whether BCL2 looping is an essential process also in those rare cases where BCL2 expression is observed in absence of the t(14;18) translocation. Further studies on a broader range of lymphoma cell lines will aim at elucidating this aspect. It has to be noted that chromosome looping occurs only in a proportion of nuclei in the Pfeiffer cell line. This may signify that BCL2 is not transcribed simultaneously in all cells carrying the translocation at any given time. The phenomenon of chromosome looping is well documented and has been shown to be fundamental for the transcriptional up-regulation of genes [30,31,32]. The development of techniques of chromatin conformation capture (Hi-C) to study interactions within the genome has allowed the creation of a genome-wide catalog of chromatin loops [33,34,35]. This report provides further insight on the mechanism of alterations in genome organization in a disease situation caused by an acquired chromosomal rearrangement.
The long-term presence of t(14;18) in circulating blood has been documented in healthy individuals [36,37]. Given the physiological lifespan of naïve B-cells, the persistence of t(14;18) clones for several years could be attributed to a sustained expression of the BCL2 gene to prevent programmed cell death. However, exposure to specific pathogens (e.g., hepatitis C virus) has been associated with the presence of long-lived memory B-cells [36,38]. Nevertheless, the occurrence of the translocation may represent a pre-lymphoma state, which requires additional mutational events to fully manifest the malignancy. At the molecular level, no changes have been observed between BCL2::IGH fusion junctions between patients with lymphoma and healthy individuals harboring t(14;18). Specific clones may take over with distinct advantageous characteristics, such as a higher expression of BCL2. It could be speculated that a reorganization of nuclear positioning may facilitate the transcriptional landscape required for the clones to propagate. In this context, one could also speculate that the changes seen at the level of genome organization and here described in the Pfeiffer cell line may not be related to the t(14;18) rearrangement itself but to the effect of some other mutations that changed the three-dimensional organization of the nucleus as a whole. Whilst this is plausible, there may also be changes to nuclear structures such as the lamina that would also impact genome organization with consequences on gene expression and cellular health [18,39,40]. Current genome editing technologies already make it possible to generate specific chromosomal rearrangements in a targeted manner. Future studies aimed at generating an in vitro model of t(14;18) lymphoma will be instrumental in defining the impact of this translocation on genome organization in this disease.
The relevance of genome organization studies through the analysis of chromosome territories and gene positioning has a potential value in cancer diagnosis and as a predictor of clinical outcome [41,42]. However, studies on lymphoma have been, so far, rather limited [43]. Previous studies have investigated the spatial organization of BCL2 alleles in cancer pathologies such as cervical squamous epithelium neoplasia and have observed an unequal allelic BCL2 gene positioning, speculating that transcriptional BCL2 activation is associated with BCL2 relocation towards the nuclear periphery [44]. The unravelling of 3D genome architecture is an emerging field in cell biology with implications for the understanding of mechanisms of disease development and progression, including cancer. With the advancement of genome editing technologies and a better understanding of 3D genome interactions, the future of biomedicine may be shaped towards finding ways to manipulate 3D nuclear architecture to restore health [45].

4. Materials and Methods

4.1. Cell Culture

The Pfeiffer cell line (CRL2632TM) was purchased from the American Tissue Culture Collection (ATCC, LGC standards, Teddington, UK) and was cultured in RMPI-1640, 10% fetal bovine serum (FBS), and 1% penicillin/streptomycin and incubated at 37 °C, 5% CO2, according to the instructions from the supplier.

4.2. Expression Analysis of Publicly Available Data

Expression of the BCL2 gene in different lymphoma cell lines from the Cancer Cell Line Encyclopedia (CCLE) was retrieved from RNA sequencing data from the Expression Public 23Q4 project via the DepMap Portal accessible online at https://depmap.org/portal/ accessed on 15 December 2023. RNA sequencing data for the expression of BCL2 in whole blood of healthy individuals were extracted from GTEx via the Xena platform [46]. Microarray expression data from patients with diffuse lymphoma were downloaded from GSE16131 [24]; the differential expression of BCL2 was computed in the R environment (The R Foundation for statistical Computing, Vienna, Austria-version 4.3.2; Rstudio software, Boston, MA, USA-version 2023.12.0+369).

4.3. Control Samples

Archival chromosome and nuclei fixed suspensions from whole peripheral blood samples of healthy volunteers were obtained as part of previous studies [22]. Samples from four volunteers (two males and two females) aged between 20 and 30 years old were used. Ethical approval was obtained from the Ethics Committee of Brunel University London (Ethical approval no: 16516-TISS-Apr/2019-18741-2). Control cDNA from human fibroblasts used for reverse transcription (RT) PCR was obtained as part of previous studies [47]. Another cDNA used as a positive control in the RT-PCR experiments was obtained from the T-47D cell line, purchased from the American Tissue Culture Collection (ATCC).

4.4. Reverse Transcription (RT) PCR

Reverse transcription PCR was performed as previously described [22]. The primers used in this study are shown in Table 1.

4.5. Fluorescence In Situ Hybridization (FISH) on Metaphase Chromosomes and Interphase Nuclei

Fluorescence in situ hybridization experiments were performed as previously described [22]. The FISH probes used in this study are shown in Table 2.
Microscope images were captured and analyzed using the fluorescence microscope Zeiss Axioplan2 equipped with a Sensys cooled CCD camera (Zeiss, Oberkoche, Germany).

4.6. Nuclear Localization Analysis

The radial nuclear localization (RNL) of the PAC/BAC probes was obtained using a method previously described [22]. Briefly, a large number of hybridized nuclei were recorded, and each hybridization signal was radially localized by assigning a value between 0 and 1, with 0 being the value of the signals positioned in the center of the nucleus and 1 the peripheral edge of the nucleus. The data obtained from the analysis of at least 300 nuclei were analyzed using the software Prism v. 8.0 (GraphPad Software, San Diego, CA, USA).
Chromosome and gene positioning in interphase nuclei using erosion analysis was performed using 50+ images of flattened nuclei taken for each of the FISH probes used. The bespoke script delineates the nucleus using the DAPI signal; it then erodes in from the edge of each nucleus to the interior, constructing five shells of equal areas. The signal intensity of each FISH signal and the DAPI are measured in each shell (1–5). In order to normalize the data and extrapolate them to a 3D situation, the FISH gene measurement is divided by the DAPI signal measurement in each shell [25].

4.7. Statistical Analysis

Statistical analyses were performed with the software Prism v. 8.0 (GraphPad Software, San Diego, CA, USA) and Microsoft Excel v. 16.54. Statistical differences were determined by Student’s t test. The level of significance between groups was set to p < 0.05 (*), p < 0.01 (**), p < 0.001 (***), and p < 0.0001 (***).

Author Contributions

Conceptualization, S.T. and J.M.B.; validation, S.T. and J.M.B.; formal analysis, E.G., D.R., F.B., C.F. and S.S.; investigation, E.G., C.F., D.R. and F.B.; writing—original draft preparation, D.R. and S.T.; writing—review and editing, E.G., C.F., D.R., S.S., J.M.B. and S.T.; visualization, E.G., D.R. and S.S.; supervision, S.T. and J.M.B.; project administration, S.T. All authors have read and agreed to the published version of the manuscript.

Funding

This research received no external funding.

Institutional Review Board Statement

This study was conducted in accordance with the Declaration of Helsinki and approved by the Ethics Committee of Brunel University London (Ethical approval no: 16516-TISS-Apr/2019-18741-2).

Informed Consent Statement

Informed consent was obtained from all the subjects involved in this study.

Data Availability Statement

The data presented in this study are available on reasonable request from the corresponding author. The expression data analyzed here is available from: the Expression Public 23Q4 project via the DepMap Portal accessible online at https://depmap.org/portal/ (accessed on 15 November 2023); from GTEx via the Xena platform [47] (accessed on 6 February 2024); from GSE16131 [24] (accessed on 17 October 2023).

Acknowledgments

The authors would like to thank Amanda Harvey for providing the T-47D cDNA and the β-actin and BCL2 primers.

Conflicts of Interest

The authors declare no conflicts of interest.

References

  1. Swerdlow, S.H.; Campo, E.; Pileri, S.A.; Harris, N.L.; Stein, H.; Siebert, R.; Advani, R.; Ghielmini, M.; Salles, G.A.; Zelenetz, A.D. The 2016 Revision of the World Health Organization Classification of Lymphoid Neoplasms. Blood J. Am. Soc. Hematol. 2016, 127, 2375–2390. [Google Scholar] [CrossRef] [PubMed]
  2. Jacobsen, E. Follicular Lymphoma: 2023 Update on Diagnosis and Management. Am. J. Hematol. 2022, 97, 1638–1651. [Google Scholar] [CrossRef] [PubMed]
  3. Katsuyoshi, T. Highlights: Follicular Lymphoma. J. Clin. Exp. Hematop. 2023, 63, 212–213. [Google Scholar]
  4. Küppers, R. Mechanisms of B-Cell Lymphoma Pathogenesis. Nat. Rev. Cancer 2005, 5, 251–262. [Google Scholar] [CrossRef] [PubMed]
  5. Egle, A.; Harris, A.W.; Bath, M.L.; O’Reilly, L.; Cory, S. VavP-Bcl2 Transgenic Mice Develop Follicular Lymphoma Preceded by Germinal Center Hyperplasia. Blood 2004, 103, 2276–2283. [Google Scholar] [CrossRef] [PubMed]
  6. Bonzheim, I.; Salaverria, I.; Haake, A.; Gastl, G.; Adam, P.; Siebert, R.; Fend, F.; Quintanilla-Martinez, L. A Unique Case of Follicular Lymphoma Provides Insights to the Clonal Evolution from Follicular Lymphoma in Situ to Manifest Follicular Lymphoma. Blood J. Am. Soc. Hematol. 2011, 118, 3442–3444. [Google Scholar] [CrossRef] [PubMed]
  7. Devan, J.; Janikova, A.; Mraz, M. New Concepts in Follicular Lymphoma Biology: From BCL2 to Epigenetic Regulators and Non-Coding RNAs. Semin. Oncol. 2018, 45, 291–302. [Google Scholar] [CrossRef] [PubMed]
  8. Mozas, P.; López, C.; Grau, M.; Nadeu, F.; Clot, G.; Valle, S.; Kulis, M.; Navarro, A.; Ramis-Zaldivar, J.E.; González-Farré, B. Genomic Landscape of Follicular Lymphoma Across a Wide Spectrum of Clinical Behaviors. Hematol. Oncol. 2023, 41, 631–643. [Google Scholar] [CrossRef]
  9. Federico, C.; Bruno, F.; Ragusa, D.; Clements, C.S.; Brancato, D.; Henry, M.P.; Bridger, J.M.; Tosi, S.; Saccone, S. Chromosomal Rearrangements and Altered Nuclear Organization: Recent Mechanistic Models in Cancer. Cancers 2021, 13, 5860. [Google Scholar] [CrossRef]
  10. Bridger, J.M.; Pereira, R.T.; Pina, C.; Tosi, S.; Lewis, A. Alterations to Genome Organisation in Stem Cells, Their Differentiation and Associated Diseases. In Nuclear, Chromosomal, and Genomic Architecture in Biology and Medicine; Springer: Berlin/Heidelberg, Germany, 2022; pp. 71–102. [Google Scholar]
  11. Fritz, A.J.; Sehgal, N.; Pliss, A.; Xu, J.; Berezney, R. Chromosome Territories and the Global Regulation of the Genome. Genes Chromosomes Cancer 2019, 58, 407–426. [Google Scholar] [CrossRef]
  12. Parada, L.A.; Sotiriou, S.; Misteli, T. Spatial Genome Organization. Exp. Cell Res. 2004, 296, 64–70. [Google Scholar] [CrossRef] [PubMed]
  13. Schneider, R.; Grosschedl, R. Dynamics and Interplay of Nuclear Architecture, Genome Organization, and Gene Expression. Genes Dev. 2007, 21, 3027–3043. [Google Scholar] [CrossRef] [PubMed]
  14. Bickmore, W.A.; Van Steensel, B. Genome Architecture: Domain Organization of Interphase Chromosomes. Cell 2013, 152, 1270–1284. [Google Scholar] [CrossRef] [PubMed]
  15. Bridger, J.M.; Arican-Gotkas, H.D.; Foster, H.A.; Godwin, L.S.; Harvey, A.; Kill, I.R.; Knight, M.; Mehta, I.S.; Ahmed, M.H. The Non-Random Repositioning of Whole Chromosomes and Individual Gene Loci in Interphase Nuclei and its Relevance in Disease, Infection, Aging, and Cancer. Adv. Exp. Med. Biol. 2014, 773, 263–279. [Google Scholar] [PubMed]
  16. Szczepińska, T.; Rusek, A.M.; Plewczynski, D. Intermingling of Chromosome Territories. Genes Chromosomes Cancer 2019, 58, 500–506. [Google Scholar] [CrossRef]
  17. Finlan, L.E.; Sproul, D.; Thomson, I.; Boyle, S.; Kerr, E.; Perry, P.; Ylstra, B.; Chubb, J.R.; Bickmore, W.A. Recruitment to the Nuclear Periphery can Alter Expression of Genes in Human Cells. PLoS Genet. 2008, 4, e1000039. [Google Scholar] [CrossRef]
  18. Guerreiro, I.; Kind, J. Spatial Chromatin Organization and Gene Regulation at the Nuclear Lamina. Curr. Opin. Genet. Dev. 2019, 55, 19–25. [Google Scholar] [CrossRef]
  19. Lemaître, C.; Bickmore, W.A. Chromatin at the Nuclear Periphery and the Regulation of Genome Functions. Histochem. Cell Biol. 2015, 144, 111–122. [Google Scholar] [CrossRef]
  20. Kumar, Y.; Sengupta, D.; Bickmore, W.A. Recent Advances in the Spatial Organization of the Mammalian Genome. J. Biosci. 2020, 45, 1–15. [Google Scholar] [CrossRef]
  21. Tanabe, H.; Müller, S.; Neusser, M.; von Hase, J.; Calcagno, E.; Cremer, M.; Solovei, I.; Cremer, C.; Cremer, T. Evolutionary conservation of chromosome territory arrangements in cell nuclei from higher primates. Proc. Natl. Acad. Sci. USA 2022, 99, 4424–4429. [Google Scholar] [CrossRef] [PubMed]
  22. Federico, C.; Owoka, T.; Ragusa, D.; Sturiale, V.; Caponnetto, D.; Leotta, C.G.; Bruno, F.; Foster, H.A.; Rigamonti, S.; Giudici, G. Deletions of Chromosome 7q Affect Nuclear Organization and HLXB9 Gene Expression in Hematological Disorders. Cancers 2019, 11, 585. [Google Scholar] [CrossRef] [PubMed]
  23. Ragusa, D.; Cicirò, Y.; Federico, C.; Saccone, S.; Bruno, F.; Saeedi, R.; Sisu, C.; Pina, C.; Sala, A.; Tosi, S. Engineered Model of T (7; 12)(q36; p13) AML Recapitulates Patient-Specific Features and Gene Expression Profiles. Oncogenesis 2022, 11, 50. [Google Scholar] [CrossRef] [PubMed]
  24. Leich, E.; Salaverria, I.; Bea, S.; Zettl, A.; Wright, G.; Moreno, V.; Gascoyne, R.D.; Chan, W.; Braziel, R.M.; Rimsza, L.M. Follicular Lymphomas with and without Translocation T (14; 18) Differ in Gene Expression Profiles and Genetic Alterations. Blood J. Am. Soc. Hematol. 2009, 114, 826–834. [Google Scholar]
  25. Clements, C.S.; Bikkul, U.; Ahmed, M.H.; Foster, H.A.; Godwin, L.S.; Bridger, J.M. Visualizing the Spatial Relationship of the Genome with the Nuclear Envelope using Fluorescence in Situ Hybridization. Nucl. Envel. Methods Protoc. 2016, 1411, 387–406. [Google Scholar]
  26. Gabay, C.; Ben-Bassat, H.; Schlesinger, M.; Laskov, R. Somatic Mutations and Intraclonal Variations in the Rearranged Vk Genes of B-non-Hodgkin’s Lymphoma Cell Lines. Eur. J. Haematol. 1999, 63, 180–191. [Google Scholar] [CrossRef]
  27. Taslerová, R.; Kozubek, S.; Lukášová, E.; Jirsová, P.; Bártová, E.; Kozubek, M. Arrangement of Chromosome 11 and 22 Territories, EWSR1 and FLI1 Genes, and Other Genetic Elements of these Chromosomes in Human Lymphocytes and Ewing Sarcoma Cells. Hum. Genet. 2003, 112, 143–155. [Google Scholar] [CrossRef]
  28. Ballabio, E.; Cantarella, C.D.; Federico, C.; Di Mare, P.; Hall, G.; Harbott, J.; Hughes, J.; Saccone, S.; Tosi, S. Ectopic Expression of the HLXB9 Gene is Associated with an Altered Nuclear Position in T (7; 12) Leukaemias. Leukemia 2009, 23, 1179–1182. [Google Scholar] [CrossRef]
  29. Lukášová, E.; Kozubek, S.; Kozubek, M.; Kjeronská, J.; Rýznar, L.; Horáková, J.; Krahulcová, E.; Horneck, G. Localisation and Distance between ABL and BCR Genes in Interphase Nuclei of Bone Marrow Cells of Control Donors and Patients with Chronic Myeloid Leukaemia. Hum. Genet. 1997, 100, 525–535. [Google Scholar] [CrossRef]
  30. Volpi, E.V.; Chevret, E.; Jones, T.; Vatcheva, R.; Williamson, J.; Beck, S.; Campbell, R.D.; Goldsworthy, M.; Powis, S.H.; Ragoussis, J. Large-Scale Chromatin Organization of the Major Histocompatibility Complex and Other Regions of Human Chromosome 6 and its Response to Interferon in Interphase Nuclei. J. Cell. Sci. 2000, 113, 1565–1576. [Google Scholar] [CrossRef]
  31. Morgan, G.T. Imaging the Dynamics of Transcription Loops in Living Chromosomes. Chromosoma 2018, 127, 361–374. [Google Scholar] [CrossRef]
  32. Gabriele, M.; Brandão, H.B.; Grosse-Holz, S.; Jha, A.; Dailey, G.M.; Cattoglio, C.; Hsieh, T.S.; Mirny, L.; Zechner, C.; Hansen, A.S. Dynamics of CTCF-and Cohesin-Mediated Chromatin Looping Revealed by Live-Cell Imaging. Science 2022, 376, 496–501. [Google Scholar] [CrossRef] [PubMed]
  33. Rao, S.S.; Huntley, M.H.; Durand, N.C.; Stamenova, E.K.; Bochkov, I.D.; Robinson, J.T.; Sanborn, A.L.; Machol, I.; Omer, A.D.; Lander, E.S. A 3D Map of the Human Genome at Kilobase Resolution Reveals Principles of Chromatin Looping. Cell 2014, 159, 1665–1680. [Google Scholar] [CrossRef]
  34. Karasu, N.; Sexton, T. 4C-Seq: Interrogating Chromatin Looping with Circular Chromosome Conformation Capture. Capturing Chromosome Conform. Methods Protoc. 2021, 2157, 19–34. [Google Scholar]
  35. Krietenstein, N.; Abraham, S.; Venev, S.V.; Abdennur, N.; Gibcus, J.; Hsieh, T.S.; Parsi, K.M.; Yang, L.; Maehr, R.; Mirny, L.A. Ultrastructural Details of Mammalian Chromosome Architecture. Mol. Cell 2020, 78, 554–565.e7. [Google Scholar] [CrossRef]
  36. Roulland, S.; Lebailly, P.; Lecluse, Y.; Heutte, N.; Nadel, B.; Gauduchon, P. Long-Term Clonal Persistence and Evolution of T (14; 18)-Bearing B Cells in Healthy Individuals. Leukemia 2006, 20, 158–162. [Google Scholar] [CrossRef]
  37. Roulland, S.; Kelly, R.S.; Morgado, E.; Sungalee, S.; Solal-Celigny, P.; Colombat, P.; Jouve, N.; Palli, D.; Pala, V.; Tumino, R. T (14; 18) Translocation: A Predictive Blood Biomarker for Follicular Lymphoma. J. Clin. Oncol. 2014, 32, 1347. [Google Scholar] [CrossRef]
  38. Giannelli, F.; Moscarella, S.; Giannini, C.; Caini, P.; Monti, M.; Gragnani, L.; Romanelli, R.G.; Solazzo, V.; Laffi, G.; La Villa, G. Effect of Antiviral Treatment in Patients with Chronic HCV Infection and T (14; 18) Translocation. Blood 2003, 102, 1196–1201. [Google Scholar] [CrossRef]
  39. Santini, G.T.; Shah, P.P.; Karnay, A.; Jain, R. Aberrant Chromatin Organization at the Nexus of Laminopathy Disease Pathways. Nucleus 2022, 13, 302–314. [Google Scholar] [CrossRef] [PubMed]
  40. Luperchio, T.R.; Wong, X.; Reddy, K.L. Genome Regulation at the Peripheral Zone: Lamina Associated Domains in Development and Disease. Curr. Opin. Genet. Dev. 2014, 25, 50–61. [Google Scholar] [CrossRef]
  41. Meaburn, K.J. Spatial Genome Organization and its Emerging Role as a Potential Diagnosis Tool. Front. Genet. 2016, 7, 134. [Google Scholar] [CrossRef]
  42. Tian, X.; Wang, Y.; Zhao, F.; Liu, J.; Yin, J.; Chen, D.; Ma, W.; Ke, X. A New Classification of Interphase Nuclei Based on Spatial Organizations of Chromosome 8 and 21 for T (8; 21)(q22; q22) Acute Myeloid Leukemia by Three-Dimensional Fluorescence in Situ Hybridization. Leuk. Res. 2015, 39, 1414–1420. [Google Scholar] [CrossRef]
  43. Lima, M.F.d.; Lisboa, M.d.O.; Terceiro, L.E.; Rangel-Pozzo, A.; Mai, S. Chromosome Territories in Hematological Malignancies. Cells 2022, 11, 1368. [Google Scholar] [CrossRef]
  44. Wiech, T.; Stein, S.; Lachenmaier, V.; Schmitt, E.; Schwarz-Finsterle, J.; Wiech, E.; Hildenbrand, G.; Werner, M.; Hausmann, M. Spatial Allelic Imbalance of BCL2 Genes and Chromosome 18 Territories in Nonneoplastic and Neoplastic Cervical Squamous Epithelium. Eur. Biophys. J. 2009, 38, 793–806. [Google Scholar] [CrossRef] [PubMed]
  45. Tiukacheva, E.A.; Ulianov, S.V.; Karpukhina, A.; Razin, S.V.; Vassetzky, Y. 3D Genome Alterations and Editing in Pathology. Mol. Ther. 2023, 31, 924–933. [Google Scholar] [CrossRef] [PubMed]
  46. Goldman, M.J.; Craft, B.; Hastie, M.; Repečka, K.; McDade, F.; Kamath, A.; Banerjee, A.; Luo, Y.; Rogers, D.; Brooks, A.N. Visualizing and Interpreting Cancer Genomics Data Via the Xena Platform. Nat. Biotechnol. 2020, 38, 675–678. [Google Scholar] [CrossRef] [PubMed]
  47. Bikkul, M.U.; Faragher, R.G.; Worthington, G.; Meinke, P.; Kerr, A.R.; Sammy, A.; Riyahi, K.; Horton, D.; Schirmer, E.C.; Hubank, M. Telomere Elongation through hTERT Immortalization Leads to Chromosome Repositioning in Control Cells and Genomic Instability in Hutchinson-Gilford Progeria Syndrome Fibroblasts, Expressing a Novel SUN1 Isoform. Genes Chromosomes Cancer 2019, 58, 341–356. [Google Scholar] [CrossRef] [PubMed]
Figure 1. Visualization of t(14;18) in metaphase chromosomes of the Pfeiffer cell line. Fluorescence in situ hybridization (FISH) using WCP14 (red), indicated by a red arrow, and WCP18 (green), indicated by a green arrow, probes in a dual-color combination highlights the presence of der(14), indicated by a yellow arrow (A). BAC/PAC probes containing BCL2 (red), indicated by a red arrow, and IGH (green), indicated by a green arrow, signals highlight the presence of IGH:BCL2 gene fusion, indicated by a yellow arrow (B). Ideograms of chromosomes 14 and 18 and their respective derivatives provide a schematic representation of the distribution of the painting probes WCP14 (red) and WCP18 (green) (C) and of the single-locus probes. The red spots indicate the hybridization in the two chromatids of the chromosome (D). Reverse transcription PCR (RT-PCR) showing the presence of a BCL2 transcript in the Pfeiffer cell line ((E), right panel). RT-PCR to detect β-actin expression, as a reference control, is shown ((E), left panel), marker: Hyperladder IV; C.PCR: PCR negative control; C.cDNA: cDNA negative control; T47D: BCL2 positive control cells; and fibroblasts: BCL2 negative control cells.
Ijms 25 02377 g001
Figure 2. BCL2 gene expression in lymphoma cell lines and patients. BCL2 expression range in different lymphoma cell lines from the Cancer Cell Line Encyclopedia (CCLE), highlighting the Pfeiffer cell line. Expression of BCL2 is also shown in non-cancerous cell lines of various tissue types (CCLE) and in whole blood from healthy individuals (GTEx database). Expression values are retrieved from RNA sequencing in the units of log2(TPM + 1). Boxplots and violin plots summarize data distribution with dots representing individual cell lines or samples, which are color-coded by sample type (A). BCL2 expression in RNA units in patients with diffuse lymphoma with and without t(14;18) from two microarray experiments (GPL96 and GPL97) downloaded from GSE16131. Boxplots and violin plots summarize data distribution with dots representing individual patient samples. Statistical significance is calculated by T test with p values ≤ 0.0001 (***), and 0.00001 (****) (B).
Ijms 25 02377 g002
Figure 3. Distribution of territories of chromosomes 14 and 18 within interphase nuclei of Pfeiffer cells and healthy lymphocytes. Combination of whole chromosome paint FISH probes for chromosomes 14 (red) and 18 (green) (A); example of lymphocyte interphase nucleus used as a control showing distinct territories for chromosomes 14 and 18, respectively (B); example of Pfeiffer interphase nucleus showing the fusion of the chromosome territories in der(14) indicated by the white arrow (C); erosion analysis of the distribution of chromosome territories in lymphocytes from healthy donors (D); and erosion analysis of the distribution of chromosome territories in the Pfeiffer cell line (E). The bars are the mean of more than 50 nuclear images analyzed with the erosion script. The error bars are the standard error of the mean. Chromosome 14 and chromosome 18 did not show statistically significant differences in their nuclear location in the Pfeiffer cells compared to the controls (p > 0.05).
Ijms 25 02377 g003
Figure 4. Nuclear localization of BCL2 and IGH genes in Pfeiffer nuclei. Ideogram to show chromosomal locations of the FISH probes used for the BCL2 (red dots) and IGH (green dots) loci (A). Pfeiffer cell line nucleus hybridized with the probe combination shown in panel A, which allows the visualization of the non-translocated BCL2 in red (indicated by a red arrow), the non-translocated IGH in green (indicated by a green arrow), and the fusion signal, red and green close to each other, corresponding to the BCL2::IGH fusion (indicated by a yellow arrow) (B). Radial nuclear positioning, obtained by a statistical analysis distribution of a hundred signals, shows localization of the wild-type BCL2 allele towards the periphery of the nucleus, whereas the positioning of the wild-type IGH allele is more central, and the fusion BCL2::IGH shows a bimodal distribution within two main areas, in the periphery and closer to the center of the nucleus, respectively (C). The erosion analysis shows the positioning of the wild-type BCL2 allele towards the nuclear periphery, mainly in zone 2 (D), positioning of the wild-type IGH allele towards the inner/intermediate portion of the nucleus, mainly in zone 4–5 (E), and a fusion signal corresponding to the BCL2::IGH fusion occupying prevalently zone 2 and zone 4, mimicking the positioning of both wild-type alleles (F). The bars are the mean of more than 50 nuclear images analyzed with the erosion script. The error bars are the standard error of the mean.
Ijms 25 02377 g004
Figure 5. Nuclear localization of the IGH locus in relation to the chromosome 14 territory. Ideograms showing the probe combination depicts 14WCP in red and the IGH probe in green in lymphocytes and Pfeiffer cells ((A,D), respectively). Examples of lymphocyte nuclei showing WCP14/IGH hybridization in lymphocytes and Pfeiffer cells. In the Pfeiffer nuclei der(18) is indicated. Der(14) is not indicated due to being not distinguishable from the normal chromosome 14 ((B,E), respectively). Schematic representations of the FISH patterns observed, with the different proportions of nuclei with signals, from left to right, specific for both alleles within the chromosome territory, one allele within the chromosome territory, or both alleles looping out of the chromosome territory ((C,F), respectively).
Ijms 25 02377 g005
Figure 6. Nuclear localization of BCL2 in relation to the chromosome 18 territory. Ideogram showing the probe combination depicts 18WCP in green and the BCL2 probe in red in lymphocytes and Pfeiffer cells ((A,D), respectively). Example of nuclei showing WCP14/BCL2 hybridization in lymphocytes and Pfeiffer cells. In the Pfeiffer nuclei, the normal chromosome 18 (green territory with red signal), der(14) (smaller green territory with red signals), and der(18) (slightly larger green territory with no red signals) ((B,E), respectively) are indicated. Schematic representations of the FISH patterns observed in healthy lymphocytes showing different proportions of nuclei with signals specific for both alleles within the chromosome territory, one allele within the chromosome territory, or both alleles looping out of the chromosome territory (C); and in Pfeiffer cells showing all BCL2 wild-type alleles localized within the normal chromosome18 territory and the translocated BCL2 allele looping out of the der(14) territory in approximately 15% of nuclei (F).
Ijms 25 02377 g006
Table 1. Bcl-2 and β-actin primer sequences.
Primer NameSequence
β-actin Forward 5′-AAGAGAGGCATCCTCACCCT-3′
β-actin Reverse 5′-TACATGGCTGGGGTGTTGAA-3′
Bcl-2 Forward 5′-ACGGAGGCTGGGATGCCTTTG-3′
Bcl-2 Reverse 5‘-ACACGAAGCGGTGCTTGGCA-3′
Table 2. FISH probes used in this study.
Probe NameVector TypeLength, bpLocusPositionLabelling
RP5-998D24PAC165,821IGH14q32Digoxigenin-FITC
RP11-299P2BAC146,688BCL218q21Biotin-Texas Red
WCP14 *Paint Chr 14Biotin-Texas Red
WCP18 *Paint Chr 18FITC
* From Cambio, Cambridge, UK.
Disclaimer/Publisher’s Note: The statements, opinions and data contained in all publications are solely those of the individual author(s) and contributor(s) and not of MDPI and/or the editor(s). MDPI and/or the editor(s) disclaim responsibility for any injury to people or property resulting from any ideas, methods, instructions or products referred to in the content.

