Article

Shedding Light on Heavy Metal Contamination: Fluorescein-Based Chemosensor for Selective Detection of Hg2+ in Water

by
Maksim N. Zavalishin
1,*,
Alexey N. Kiselev
2,
Alexandra K. Isagulieva
3,4,
Anna V. Shibaeva
5,
Vladimir A. Kuzmin
5,6,
Vladimir N. Morozov
5,
Eugene A. Zevakin
7,
Ulyana A. Petrova
1,
Alina A. Knyazeva
1,
Alexey V. Eroshin
1,
Yuriy A. Zhabanov
1 and
George A. Gamov
1
1
Faculty of Inorganic Chemistry and Technology, Ivanovo State University of Chemistry and Technology, 153000 Ivanovo, Russia
2
G.A. Krestov Institute of Solution Chemistry, Russian Academy of Sciences, 153045 Ivanovo, Russia
3
Burnazyan Federal Medical Biophysical Center, Federal Medical Biological Agency of the Russian Federtion, 123182 Moscow, Russia
4
Institute of Gene Biology, Russian Academy of Sciences, 119991 Moscow, Russia
5
Emanuel Institute of Biochemical Physics, Russian Academy of Sciences, 119334 Moscow, Russia
6
National Research Nuclear University MEPhI, 115409 Moscow, Russia
7
Vernadsky Institute of Geochemistry and Analytical Chemistry, Russian Academy of Sciences, 119991 Moscow, Russia
*
Author to whom correspondence should be addressed.
Int. J. Mol. Sci. 2024, 25(6), 3186; https://doi.org/10.3390/ijms25063186
Submission received: 17 February 2024 / Revised: 6 March 2024 / Accepted: 8 March 2024 / Published: 10 March 2024
(This article belongs to the Collection Feature Papers in Molecular Toxicology)

Abstract

:
This article discusses the design and analysis of a new chemical chemosensor for detecting mercury(II) ions. The chemosensor is a hydrazone made from 4-methylthiazole-5-carbaldehyde and fluorescein hydrazide. The structure of the chemosensor was confirmed using various methods, including nuclear magnetic resonance spectroscopy, infrared spectroscopy with Fourier transformation, mass spectroscopy, and quantum chemical calculations. The sensor’s ability in the highly selective and sensitive discovery of Hg2+ ions in water was demonstrated. The detection limit for mercury(II) ions was determined to be 0.23 µM. The new chemosensor was also used to detect Hg2+ ions in real samples and living cells using fluorescence spectroscopy. Chemosensor 1 and its complex with Hg2+ demonstrate a significant tendency to enter and accumulate in cells even at very low concentrations.

1. Introduction

Heavy metals are significant pollutants due to their ubiquitous presence in almost all natural ecosystems and their resistance to degradation processes, unlike organic pollutants [1]. Metal ions accumulate in soil easily, but their removal is difficult and slow, leading to their intensive accumulation in the tissues and organs of humans, living organisms, and hydrobionts [2,3]. Mercury occupies an unique position among heavy metals as its compounds are among the most toxic and hazardous substances [4]. The areas with the highest levels of mercury pollution in Russia are in proximity to metallurgical plants located in the Kola Peninsula, Urals, and Norilsk, where concentrations are several times higher than background levels [5,6]. The World Health Organization (WHO) defines the maximum allowable mercury concentration in drinking water as 0.006 mg/L [7]. Regular consumption of seafood increases the risk of methylmercury poisoning, as various studies worldwide have discovered [8]. Once in the body, the bloodstream easily transports mercury ions, leading to serious damage to the liver, kidneys, and brain [8,9,10]. Mercury salts commonly exist as divalent cations in an aqueous solution. Therefore, monitoring the Hg2+ ions in surface waters is a significant environmental safety task for numerous countries.
Conventional methods like atomic absorption spectrometry (AAS) [11], ion chromatography (IC) [12], and optical emission spectroscopy with inductively coupled plasma (ICP) [13] have frequently been used to detect Hg2+ ions in the environment. The implementation of these techniques for on-site or real-time analyses is challenging due to the equipment’s high cost, intricate pre-processing procedures, and time-consuming nature. Optical techniques such as absorption spectroscopy and spectrofluorimetry rely on changes in color or fluorescence intensity and are not hindered by these problems [14,15]. Fluorescent chemosensors for Hg2+ ions are mainly derived from carbon dots [16,17], metal–organic frameworks [18,19], porphyrin [20], BODIPY [21,22], naphthalimide [23], coumarin [24], rhodamine [25,26], and fluorescein [27,28,29]. The development of new chemosensors for mercury ions is an important goal for researchers worldwide due to adverse environmental conditions.
Fluorescein is extensively used as a signaling component in fluorescent chemosensors because of its high quantum yield, photostability, and ease of functionalization [30,31,32]. A hydrazo group is frequently used as a connection between the receptor and the signaling fragment in fluorescein-based chemosensors [33,34]. Fluorescein hydrazones can be obtained with high yields and without generating by-products, making them a valuable asset for optical chemosensors. Recently, numerous fluorescent chemosensors for ions such as Cu2+ [35,36,37], Ni2+ and Al3+ [38], Zn2+ [39], Cd2+ [40], and Hg2+ [27,28,29] were developed based on fluorescein. As for Hg2+ chemosensors, 7-hydroxy-4-methylcoumarin-8-carbaldehyde [27], (pyridin-2-ylmethoxy)-naphthalene-1-carbaldehyde [28], and thiophene-2-aldehyde [29] were used as receptors. Based on the results of predicting the sensing ability of organic compounds towards metal ions based on their chemical formulae, hydrazone derived from fluorescein and 4-methylthiazole-5-carbaldehyde was found to be a potential chemosensor for Hg2+ ions [41] (Figure S1). The aim of this study is to broaden the choice of available chemosensors based on fluorescein molecules.
In the present article, we describe the synthesis and characteristics of a new sensor derived from 4-methylthiazole-5-carbaldehyde and hydrazide fluorescein (chemosensor 1) to recognize mercury(II) ions. The ability of the compound to sense cations (Na+, K+, Ag+, Ca2+, Mg2+, Ba2+, Co2+, Ni2+, Cu2+, Zn2+, Cd2+, Pb2+, Hg2+, Cr3+, Fe3+, Ce3+, Al3+, In3+) was evaluated using UV-Vis and fluorescence experimental methods in an H2O/DMSO mixture. To supplement the experimental data, density functional theory (DFT) calculations were performed to determine the structure of 1 in solution. We also detected a strong enough fluorescence signal from the sensor with mercury ions in living cells, so it makes possible further work on the improvement of this sensor for application on living models.

2. Results and Discussion

2.1. Selection of the Optimal H2O/DMSO Ratio for the Determination of Hg2+ Ions

Chemosensor 1 is insoluble in water, but soluble in many organic solvents (acetonitrile, alcohols, DMSO, THF, and DMF). Of these, DMSO is the most suitable for the determination of analytes because it has low toxicity to living organisms and is a high-boiling solvent, which makes it easier to prepare solutions of known concentrations. For these reasons, to select the optimal conditions for the determination of Hg2+ ions, we studied the fluorescence of the mixture 1-Hg2+ in the H2O-DMSO system. Up to a 30 vol.% of water, chemosensor 1 exhibits no reaction with Hg2+ ions, likely due to the strong solvation of the cations by DMSO molecules [42]. Additionally, the opening reaction of the spirolactam ring of fluorescein derivatives occurs most efficiently in aqueous solutions [43]. Optimal fluorimetric conditions for the determination of mercury ions are observed in H2O-DMSO (8:2 v/v) (Figure 1). A sharp decrease in fluorescence intensity at 90 vol.% H2O is caused by aggregation of chemosensor 1.

2.2. Selectivity of Chemosensor 1 towards Hg2+ and Other Cations in H2O-DMSO (8:2 v/v)

UV-Vis and fluorescence studies were performed using a 50 μM solution of chemosensor 1 in H2O-DMSO (8:2 v/v) with 5 eq. of common metal ions (Na+, K+, Ag+, Ca2+, Mg2+, Ba2+, Co2+, Ni2+, Cu2+, Zn2+, Cd2+, Pb2+, Hg2+, Cr3+, Fe3+, Al3+, Ga3+, In3+, and Ce3+) (Figure 2).
Chemosensor 1 has two maxima in the UV region (276 and 336 nm). There are no absorption bands in the visible spectral region because of the closed spirolactam cycle, which makes the solution of 1 colorless (Figure 2a,c) [44]. However, when Hg2+ ions are added, the solution changes from transparent to brown, and a broad absorption band with a maximum of 448 nm appears. Additionally, fluorescence intensity at 520 nm significantly increases with the addition of 5 equiv. of Hg2+. The quantum yield also increases to 3.9% after the probe reacts with Hg2+ ions only, which demonstrates the excellent selectivity of chemosensor 1 for Hg2+ over other metal ions (Figure 2d). This selectivity can be utilized for the fluorescent determination of Hg2+ ions in solution. Fe3+ ions also induce the opening of the spirolactam cycle. However, their absorption is observed in the UV region and no fluorescence enhancement is observed (Figure 2c,d).
Chemosensor 1 has a substantial affinity towards mercury ions, which renders hydrazone a fitting alternative for detecting Hg2+. Accordingly, the fluorescence response of 1 (50 μM) to Hg2+ ions (1 equiv.) mixed with some other metal ions (1 equiv.) in H2O-DMSO (8:2 v/v) is shown in Figure 3a. As can be seen from Figure 3, fluorescence intensity does not change significantly when 1 equiv. of various metal ions apart from Fe3+ is added to the chemosensor 1 solution. However, Fe3+ ions only interfere with the quantitative recognition of Hg2+ ions. Probably, Hg2+ and Fe3+ ions are competitors for opening the spirolactam ring of chemosensor 1. Therefore, to determine Hg2+ in the presence of Fe3+ ions, it is necessary to mask the iron(III) ions. Fluorides are a suitable masking agent as they form a stable colorless complex [FeF5]2−. Chemosensor 1 exhibits high selectivity for Hg2+ ions, which is not hindered by most of the other metal ions in the H2O-DMSO mixture. Anions have a negligible impact on the fluorimetric detection of Hg2+ ions in solution, except halides such as Cl, Br, and I (Figure 3b). According to the literature, Hg2+ ions can form stable complexes of the composition [HgHaln]2−n with halides [45,46,47]. Such anions as Cl, Br, and I are competing with chemosensor 1 for Hg2+ ions in solution. However, qualitative determination of mercury(II) ions is possible, when Hg2+ ions and halides (Cl, Br, or I) are equimolar in solution.
Adding increasing amounts (up to 180 µM) of Hg2+ ions (Figure 4a) leads to an increase in the intensity of the emission band, with a maximum at 520 nm in the fluorescent spectra of chemosensor 1. This increase in fluorescence is attributed to the formation of a coordination compound with a higher quantum yield in comparison to chemosensor 1. We attribute such changes to opening the spirolactam ring of the chemosensor by complexation. The mechanism of spirolactam opening in xanthene dyes, leading to fluorescence turn-on, is well known [48,49]. The stability constant of the 1-Hg2+ complex was computed from the spectrofluorimetric data (Figure 4) using KEV software, version 0.7 [50], while the stoichiometry of the 1-Hg2+ complex was determined via mass spectrometry (Figure S2). Furthermore, the best description of the experimental fluorimetric data is observed for the 1:1 stoichiometric model (R2 = 0.958) (Figure S3). The stoichiometric model 1:2 is suboptimal, leading to the conclusion that the formation of a 1:2 complex is improbable (Figure S4). The conditional stability constant of 1-Hg2+ lg β = 3.54 ± 0.24 was determined using KEV software, version 0.7 [50] (Figure S3). A possible reaction scheme between chemosensor 1 and the Hg2+ ion is shown in Figure S5. The detection limit of chemosensor 1 for Hg2+ was also calculated from the titration to be 0.23 μM (Figure S6), which was lower than the majority of the reported LOD values for Hg2+ chemosensors (Table S1).
Figure 5a shows that the absorption properties of chemosensor 1 remain stable for 8 days, proving its practicality for Hg2+ recognition purposes. Upon the addition of Hg2+ to the chemosensor 1 solution, the fluorescence intensity quickly approached its peak after 100 min and remained stable thereafter (indicated by red dots). This demonstrates the chemosensor’s rapid detection capability for mercury(II) ions.

2.3. Practical Application

We tested the practical usefulness of chemosensor 1 by examining water samples from local rivers for Hg2+ ions. The water was collected from the Uvod (57°00′09.0″ N 40°59′46.7″ E) and Uhtokhma rivers (56°89′62.7″ N 40°63′29.6″ E) in the Ivanovo region, Russia. The samples were filtered to remove solids and then treated with a standard solution containing different concentrations of Hg2+ ions. The experiment was conducted three times to ensure accuracy. Figure S7 displays an instance of the spectral measurements of chemosensor 1 when Hg2+ ions were present in the sample. The results, shown in Table 1, indicate that chemosensor 1 effectively identifies Hg2+ ions in real samples.
It is also possible to qualitatively determine mercury(II) ions using a UV lamp. Yellow-green fluorescence is only observed when Hg2+ ions are in solution (Figure 2b).

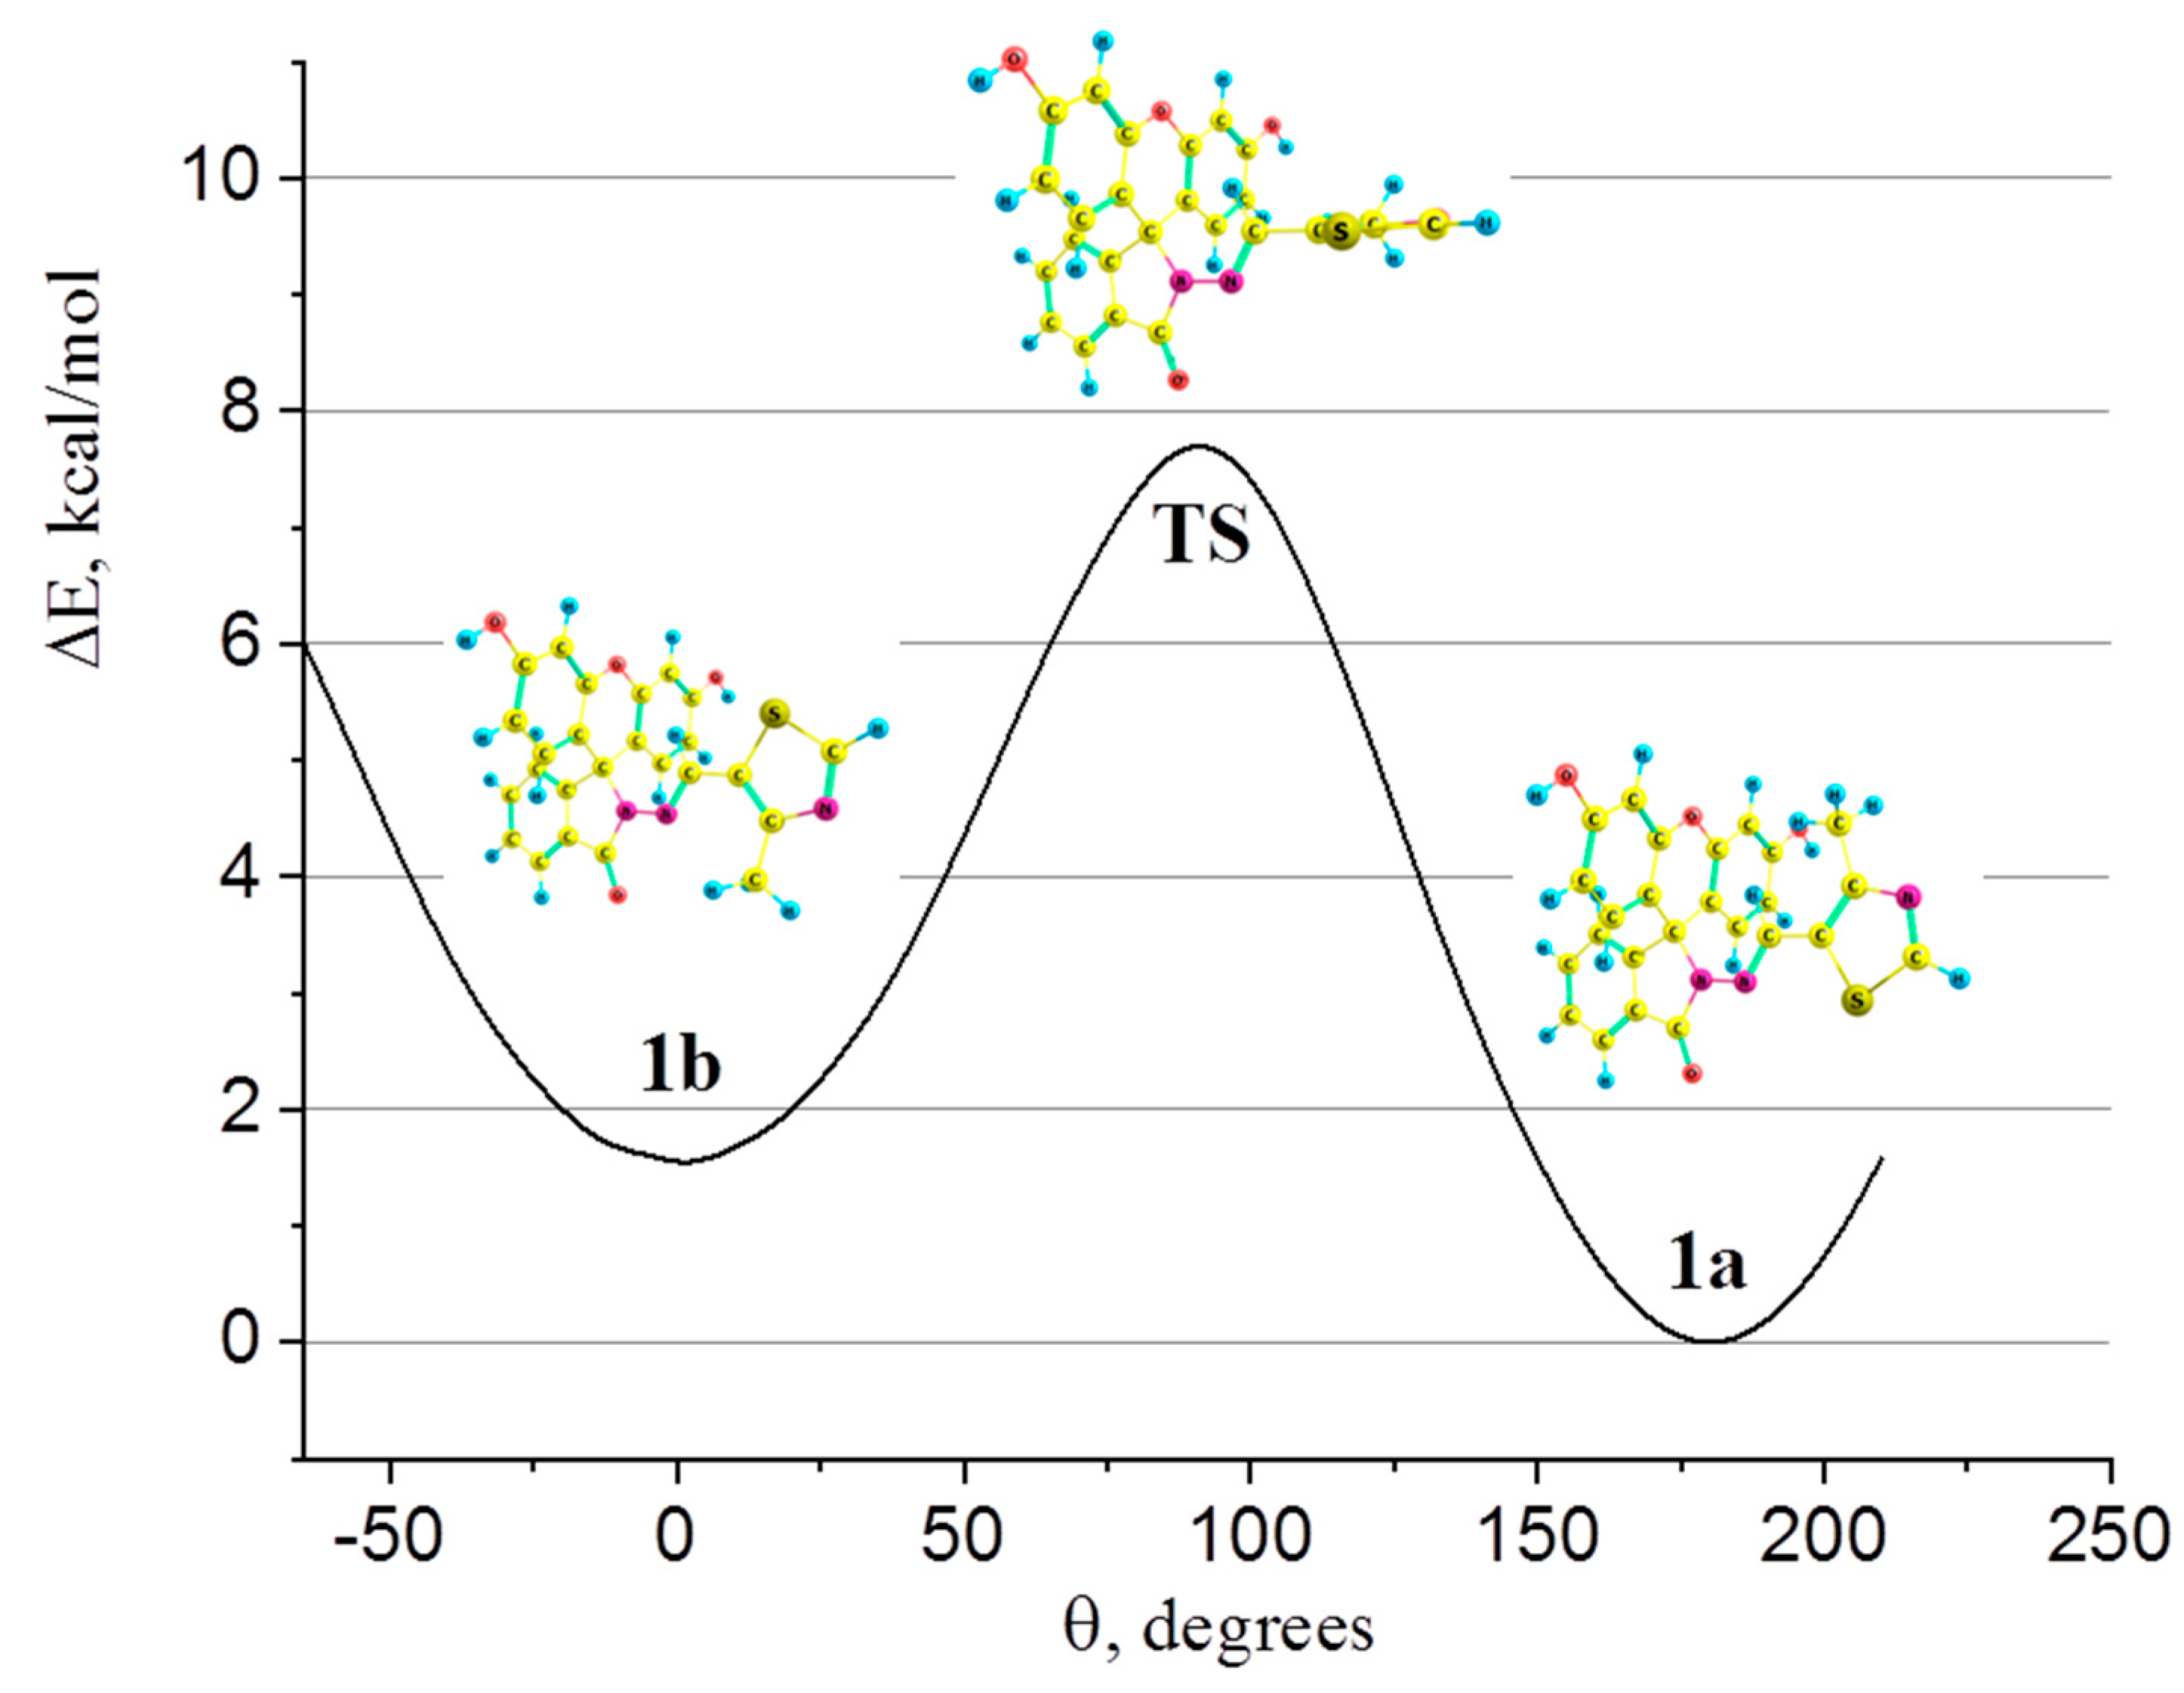
2.4. Molecular Structure and Electronic Spectra of Chemosensor 1

Electronic absorption spectra play an important role in the design of chemosensors. Quantum chemical (QC) calculations are a powerful tool for simulating and then understanding the nature of electronic absorption spectra. It is also important to take into account that compounds can exist as several forms (conformers), which affect reactivity and spectral characteristics.
Quantum chemical calculations showed the coexistence of two conformers (1a and 1b) of 1 at room temperature (RT, T = 298 K), differing by an orientation of methylthiazole fragment (Figure 6). Both conformers possess a Cs symmetry point group, i.e., there is a plane of symmetry including the atoms of thiazole and isoindoline rings. The contributions of 1a and 1b are directly proportional to e G i R T and were evaluated as:
x i = e G i R T e G i R T
where G i is the relative Gibbs energy of the conformer. So, 1a dominates in equilibrium at RT; its amount is 96 mol. %. The transition from 1a to 1b can be achieved by rotating the thiazole ring around the hydrazone bridge with a barrier of ~7.7 kcal/mol (numbers of atoms correspond to those in the scheme for synthesizing). The potential energy surface profile of such a rotation is depicted in Figure 6; enlarged images of molecular models of 1a, 1b, and transition state (TS), along with their relative energies and contributions, can be found in ESI (Figure S8).
Since the simulated electronic absorption spectra of 1a and 1b are close to each other (maximal difference in band position is 4 nm, Figure 7), we describe below only the spectrum of 1a, which is favorable according to QC calculations. The highest occupied molecular orbital (HOMO, Figure 8) with a” symmetry is localized on the bonding π-orbitals of the thiazole and isoindoline rings and the C-N-bridge between them—however, without orbitals of the sulfur atom. The most intensive peak in the spectra is at 319 nm and corresponds to electronic transitions from HOMO to the lowest unoccupied molecular orbital (LUMO). The latter includes π-orbitals centered on the same rings as HOMO but with sulfur atomic orbitals. So, the band at 319 nm is caused by π → π* transitions in these fragments. The calculated composition of the lowest excited states and corresponding oscillator strengths are listed in Table S2. Shapes of orbitals involved in electronic transitions are represented in Table S3.

2.5. Cytotoxicity of 1 and 1:Hg2+ Complex

The detection of mercury and its ions in living organisms may be very useful for various medical and research tasks due to their danger to the metabolism. Potential chemosensors must be both neutral to biological systems and highly sensitive, to detect very small amounts of target ions. Thus, to investigate possible harmful effects, 1 and its complex with Hg2+ were tested using the MTT assay (Figure 9, Table 2). Compound 1 is found toxic enough to both tumor (HCT116) and non-tumor (HEK293T) cell lines when incubated for 3 days at a concentration of 20 μM or more. Half-maximal inhibitory concentrations (IC50) in these cases are about 21 and 20 μM, respectively. In turn, the cytotoxicity of the 1:Hg2+ complex is a little higher: the corresponding IC50 values are about 15 and 16 μM. These results partly limit the application of the 1 compound as a chemosensor for living systems but pose the task of further modifying it in order to reduce such negative effects.

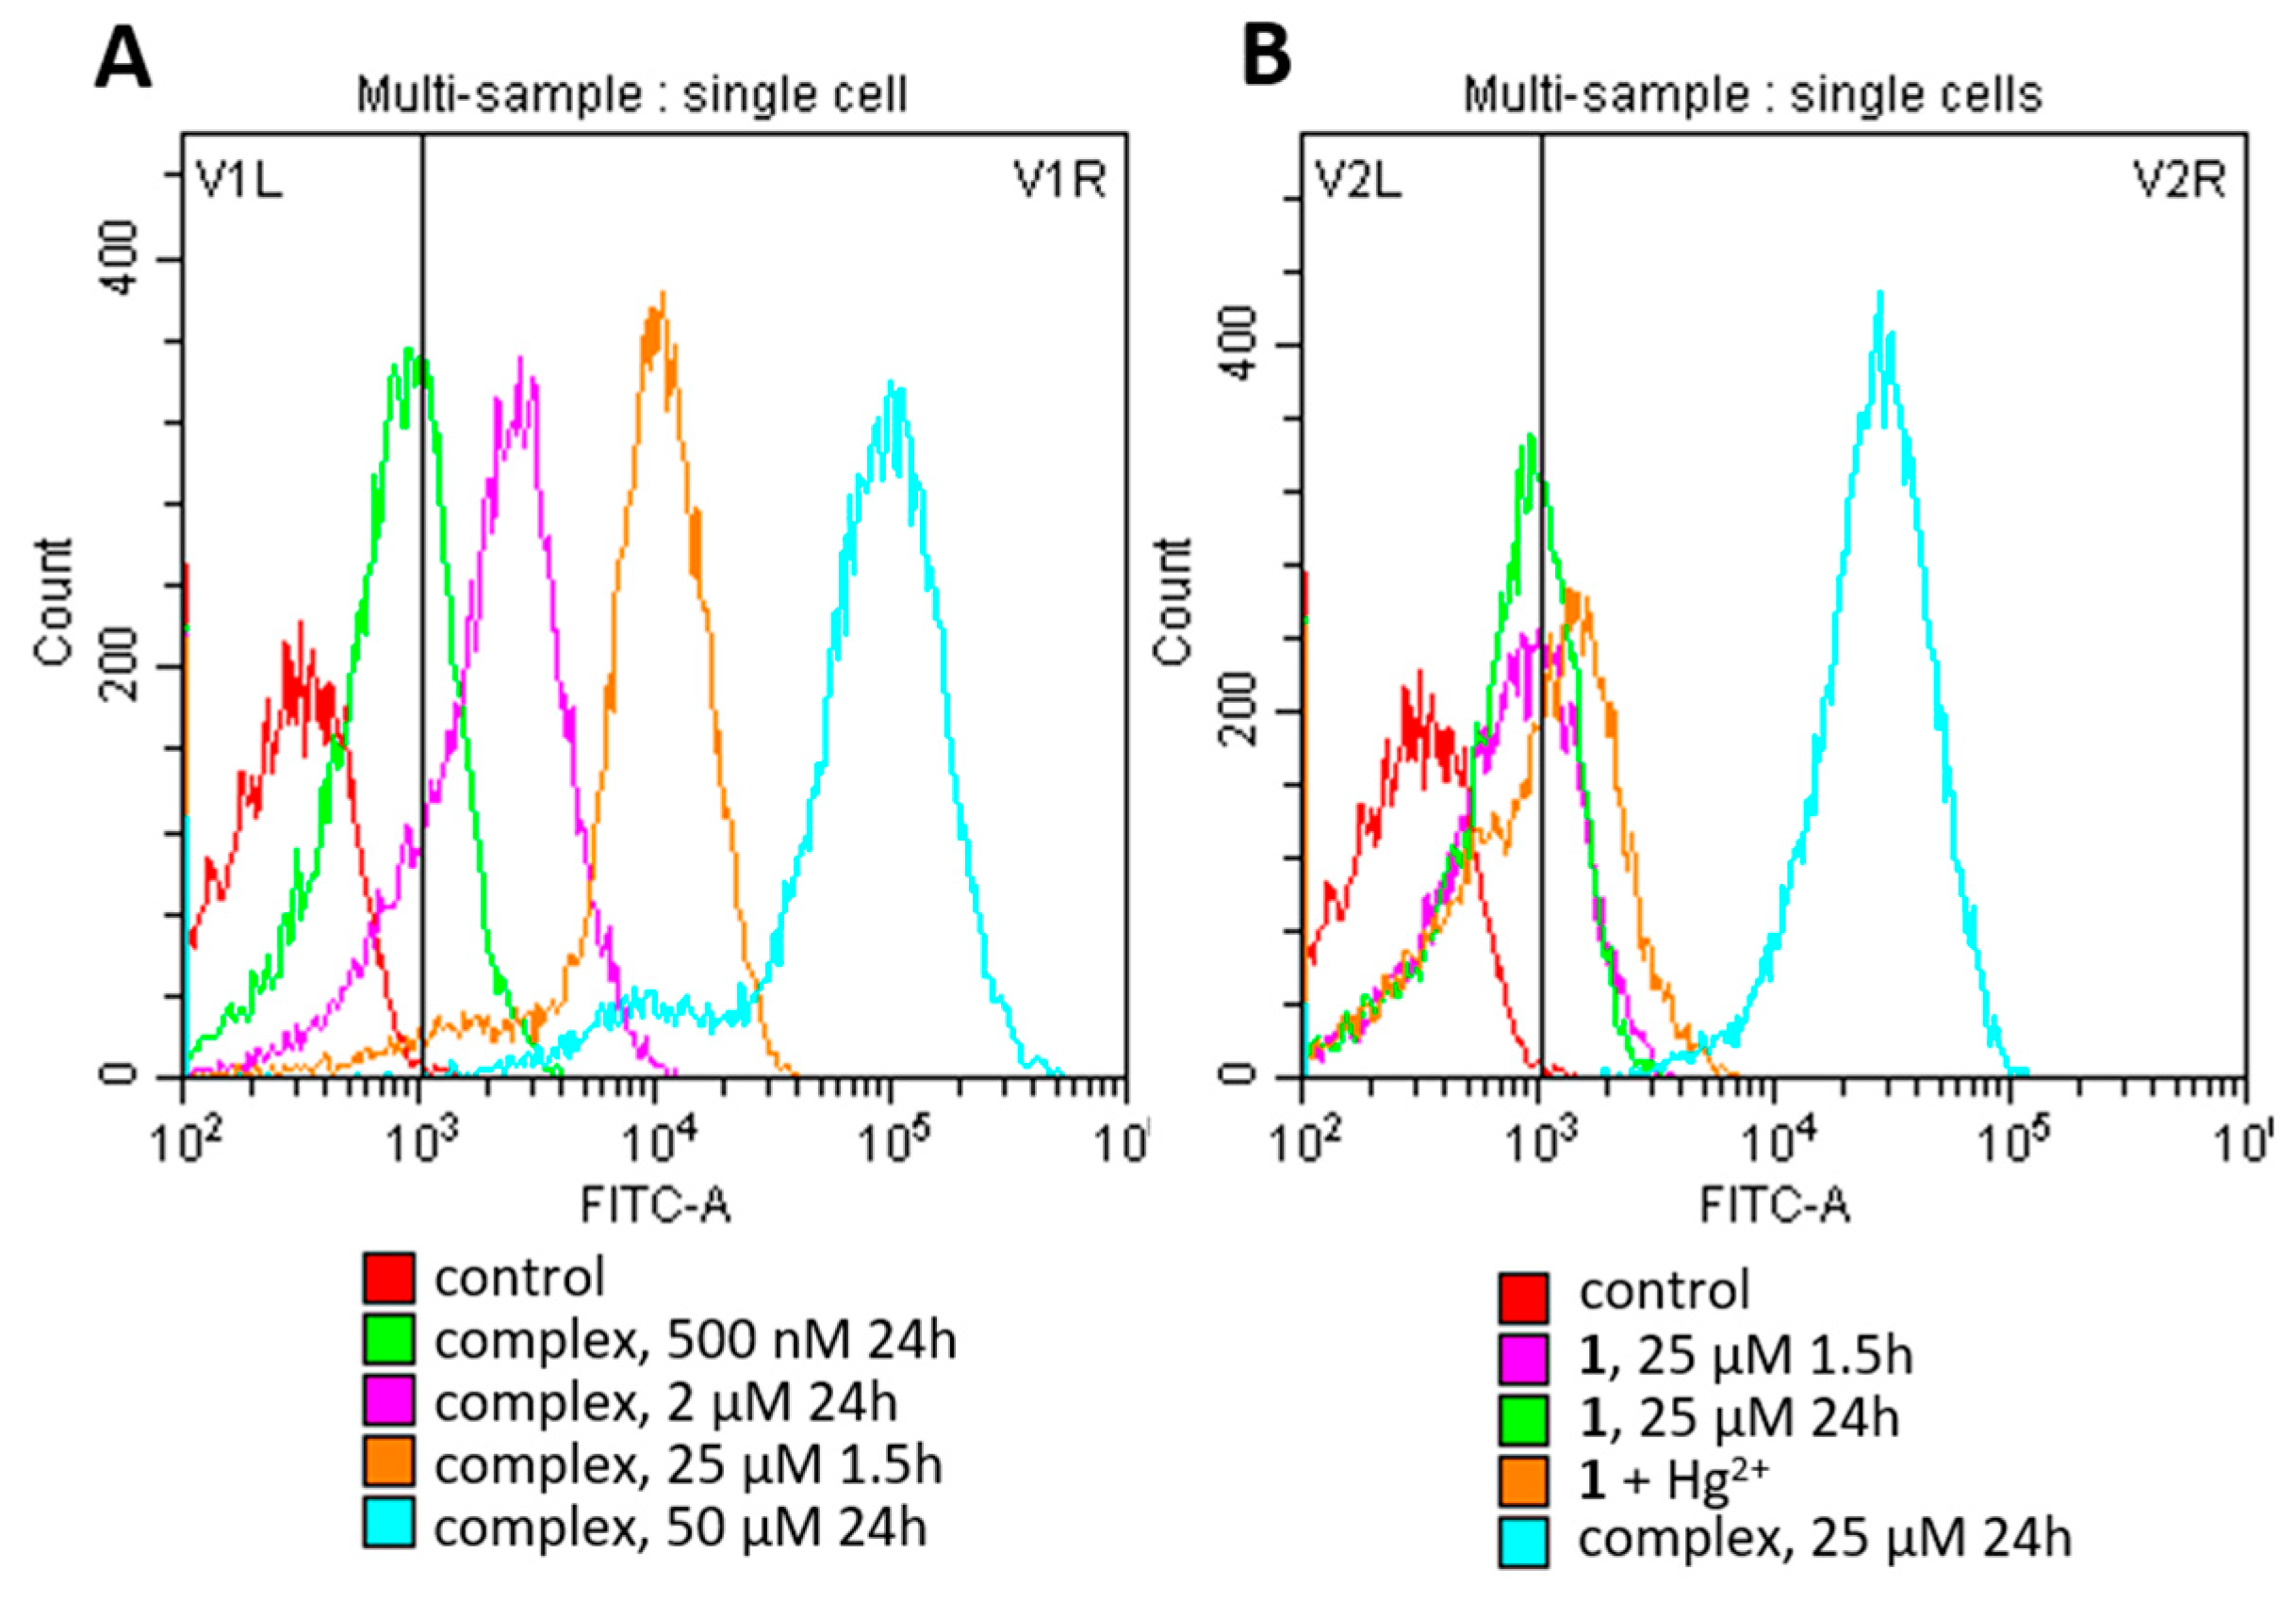
2.6. Detection of 1 and 1:Hg2+ Complex in Living Cells

Molecules of the 1:Hg2+ complex are successfully accumulated by HCT116 cells in a quantity that is sufficient for fine fluorescence detection using flow cytometry. Although concentrations of 25 and 50 μM are lethal for 50% of the cell population after 3 days of exposition, a short incubation (1.5 or 24 h) allows us to visualize cellular uptake and the accumulation of the complex with a strong signal (Figure 10A). In non-toxic concentrations up to 2 μM, the signal is much weaker even after 24 h; however, the complex is still detectable (see green and pink lines in Figure 10A).
The difficulty is to estimate the intracellular uptake and long accumulation of 1 alone (Figure 10B, pink and green lines) because of its weak fluorescence and solubility properties. At the same time, we have shown that 4 h preincubation with 25 μM of 1, followed by the addition of 50 μM Hg2+, almost does not increase the cellular accumulation of the newly formed complex after 24 h of total incubation (see orange line in Figure 10B). This fact may also be explained by a poor reaction of 1 and Hg2+ in the cultural medium.
We also investigated the intracellular fluorescence of 1 and the 1:Hg2+ complex by confocal microscopy. As shown in Figure 11, the 1:Hg2+ complex is well visualized in HCT116 cells both at chemosensor concentrations of 10 and 25 μM. The fluorescence signal of compound 1 at a concentration of 10 μM is not registered in cells. At a concentration of 25 μM, compound 1 shows extremely weak, almost invisible fluorescence. Accumulation of the 1:Hg2+ complex occurred mainly in the cytoplasm (there is also the possibility of accumulation in the mitochondria, lysosomes, and endoplasmic reticulum) and, to a much lesser extent, in the cell nucleus. Summarizing the data of in vitro experiments, chemosensor 1 and its complex with Hg2+ have the fundamental ability to permeate and accumulate in cells even in a nanomolar concentration; however, the cells accumulate compound 1 alone at a much lower level than its complex with mercury. Thus, despite relatively high cytotoxic effects for tumor and non-tumor cells, the tested compound is of great interest for future investigation as a fluorescence probe of mercury ions.

3. Materials and Methods

3.1. Chemicals

4-methylthiazole-5-carbaldehyde and fluorescein hydrazide (BLD Pharm, Telangana, India) were utilized in their pure form. The manufacturers claimed the purity of the reagents to be >98 wt.%. Nitrate salts of Na+, K+, Ag+, Ca2+, Mg2+, Ba2+, Co2+, Ni2+, Cu2+, Zn2+, Cd2+, Hg2+, Pb2+, Cr3+, Fe3+, Al3+, Ga3+, In3+, and Ce3+ procured from Reakhim (Staraya Kupavna, Russia), were used as received. Sodium salts of F, Cl, Br, I, CN, NCS, NO3, ClO3, SO32−, H2PO4, HSO4, AcO, and ClO4 procured from Reakhim (Staraya Kupavna, Russia), were also utilized without purification. Solutions of cation and anion salts were prepared using deionized water (conductivity of κ = 3.6 μS/cm and pH = 6.6). Commercially available dimethyl sulfoxide and ethanol (EKOS-1, Staraya Kupavna, Russia, purity > 99.9% and 95.58%) were also incorporated.

3.2. Synthesis of Chemosensor 1

Solutions of 4-methylthiazole-5-carbaldehyde (0.1281 g, 1.0 mmol) and fluorescein hydrazide (0.3466 g, 1.0 mmol) in ethanol were mixed in a flask. The resultant mixture was refluxed and stirred for 6 h. Upon cooling to room temperature, a finely dispersed pale grey precipitate formed. The obtained crystalline product was filtered, washed with ice-cold ethanol and acetone, and dried at 40 °C to a constant weight. The yield was 0.3097 g (68%). The synthesis pathway for chemosensor 1 is depicted in Figure 12.
(E)-3′,6′-dihydroxy-2-((4-methylthiazol-5-yl)methyleneamino)spiro[isoindoline-1,9′-xanthen]-3-one: 1H NMR, δ, ppm (DMSO-d6): 9.95s (2H, OH), 9.08s (1H, H2), 8.94s (1H, H6), 7.92d (3J = 7.4 Hz, 1H, H8), 7.66t (3J = 7.0 Hz, 1H, H10), 7.61t (3J = 7.0 Hz, 1H, H9), 7.14d (3J = 7.4 Hz, 1H, H11), 6.65d (4J = 1.1 Hz, 2H, H18), 6.48d (4J = 1.1 Hz, 4H, H15,16), 2.29s (3H, H4′). 13C NMR, δ, ppm (DMSO-d6: 164.0 (C=O), 159.2 (C17), 155.7 (C2), 154.7 (C19), 152.7 (C4), 150.8 (C12), 141.2 (C6), 134.6 (C7), 129.7 (C10), 129.3 (C15), 128.6 (C5), 128.6 (C8), 124.4 (C11), 123.7 (C9), 112.9 (C16), 110.1 (C14), 102.8 (C18), 65.7 (C13), 15.5 (C4′). m/z = 456.55 [1+H+], theoretical m/z = 456.49 [1+H+]. IR, (KBr) cm−1: 3422s, 2921m, 2851s, 1701s, 1669s, 1614s, 1505s, 1446s, 1390m, 1312s, 1269s, 1172s, 1113s, 994m, 849m, 758m, 692m, 625w, 475w.
IR, MS, 1H, and 13C NMR spectra are given in the supplementary information (Figures S9–S12).

3.3. Spectral Measurements

The UV-Vis spectra were measured using a double-beamed Shimadzu UV1800 spectrophotometer (Shimadzu, Somerset, NJ, USA). The wavelength range was 260–700 nm and the absorbance range was 0–1 in H2O-DMSO (8:2 v/v). H2O-DMSO (8:2 v/v) was used as a blank solution. The temperature was kept constant at 298.2 ± 0.1 K with an external thermostat.
Fluorescence spectra were recorded using the RF6000 setup (Shimadzu, Somerset, NJ, USA) with an excitation wavelength of λex = 446 nm and an emission wavelength range of 470–750 nm. The excitation and emission slit widths were set to 5 nm. The temperature was maintained at 298.2 ± 0.1 K using an external thermostat.
Three-dimensional fluorescence spectra were obtained by recording the spectra within the range of λex = 300–600 nm and λem = 320–800 nm (Figure 13). The optimal excitation wavelength for detecting Hg2+ with chemosensor 1, which results in strong emission intensity, was found to be λex = 446 nm.
The NMR experiments for chemosensor 1 were conducted on a Bruker Avance III 500 NMR spectrometer (Bruker, Billerica, MA, USA) with 500.17 MHz and 125.77 MHz frequencies for 1H and 13C, respectively, in DMSO-d6. Temperature control was maintained using a Bruker variable temperature unit (BVT-2000), and the experiments were carried out at 298 K without sample spinning. The accuracy of the chemical shift measurement was determined to be ±0.01 ppm for 1H NMR spectra and ±0.1 ppm for 13C NMR, according to the external standard, HMDSO.
The MS (MALDI TOF) spectra for chemosensor 1 and 1+Hg2+ were obtained using the Shimadzu Biotech Axima Confidence system, which was produced by Shimadzu in the NJ, United States. The samples were dissolved in an EtOH-H2O mixture and applied to the plate. The samples were then allowed to air-dry before the experiment.
The Avatar 360 FTIR spectrometer, manufactured by Thermo Nicolet in the MA, United States, was used to record the IR spectra for chemosensor 1. The sample was dispersed in KBr, and a range of 400–4000 cm−1 was scanned.

3.4. Computational Details

The Gaussian 09 [51] program was used for geometry optimization, followed by harmonic frequencies calculation. The calculations were carried out using density functional theory (B97D functional [52]) with a triple-zeta def2-TZVP basis set [53] taken from the EMSL BSE library [54,55,56]. Basis sets for S, O, and N atoms were also augmented by diffuse functions (def2-TZVPD [53,57]). Electronic absorption spectra were calculated using the time-dependent density functional theory approach. The number of excited states was 30. The polarizable continuum model (PCM, the solvent is water) was applied to take into account solvation effects in electron absorption spectra calculations. Cartesian coordinates of quantum chemical structures are presented in Figure S13.

3.5. Cells

Embryonic human kidney cells (HEK293T) and human colon adenocarcinoma (HCT116) were obtained from the American Type Culture Collection (ATCC, Manassas, VA, USA). Cells were cultivated at 37 °C in a 5% CO2 atmosphere. For this, DMEM (PanEco, Moscow, Russia) supplemented with 10% FBS (Cytiva, Marlborough, MA, USA), 2 mM L-glutamine (PanEco, Moscow, Russia), 100 U/mL penicillin (PanEco, Russia), and 100 μg mL−1 streptomycin (PanEco, Moscow, Russia) was used.

3.6. MTT Assay

The cytotoxicity of compounds was measured by using the MTT assay (MTT is an abbreviation for the dye compound 3-(4,5-Dimethylthiazol-2-yl)-2,5-diphenyltetrazolium bromide). Doxorubicin (Veropharm, Moscow, Russia) was taken as a control. Cells were seeded in 96-well plates in a density of 5000 cells per well. At 24 h after attachment, the compounds were added at a different concentration for the next 72 h. After incubation, 5 mg/mL of MTT reagent (Dia-M, Moscow, Russia) was added to each well; then, the plates were incubated for another 3 h under the same conditions. The precipitate of formazan crystals was dissolved in 100 μL DMSO. Colorimetric measurement was performed at λ = 570 nm using a CLARIOstar Plus microplate reader (BMG LABTECH, Ortenberg, Germany). The experiment was repeated at least 3 times.

3.7. Flow Cytometry

The accumulation of 1 and its complex with Hg2+ in cells was investigated using flow cytometry. HCT116 cells were seeded on 35 mm Petri dishes in a density of 300,000 cells per dish. At 24 h after attachment, compounds were added to the culture; then, the cells were incubated for a different time. Before measuring, the cells were rinsed with PBS, detached by Versene solution (PanEco, Moscow, Russia), and centrifuged at 500 rcf for 5 min. Cell pellets were resuspended and rinsed twice in fresh PBS and analyzed using a CytoFLEX flow cytometer (Beckman Coulter, Brea, CA, USA) in FITC channel (λex = 488 nm, λem = 525/40 nm).

3.8. Confocal Microscopy

HCT116 cells were seeded in a density of 100,000 cells per well on 35 mm confocal dishes (Eppendorf, Hamburg, Germany) and were incubated at 37 °C in 5% CO2 for 24 h. Then, the compound under assay was added and cells were incubated for another 4 h under the same conditions. The fluorescence in PBS was excited at λex = 458 nm and detected in the wavelength range of 490–560 nm. The signal was normalized by the control dish without the compound. Samples were recorded on the laser scanning confocal microscope Leica TCS SPE 5 with LAS AF software, version 2.6 (Leica Microsystems GmbH, Wetzlar, Germany).

4. Conclusions

A novel fluorescent chemosensor designed for detecting mercury(II) ions, hydrazone derived from 4-methylthiazole-5-carbaldehyde and fluorescein hydrazide was synthesized and characterized using various spectral methods and quantum chemical calculations. According to the quantum chemical calculations results, chemosensor 1 exists in the form of two conformers differing by an orientation of the methylthiazole fragment; however, the electronic absorption spectra of these conformers are almost the same. Chemosensor 1 exhibited increased emission intensity in its H2O-DMSO (8:2 v/v) solution in the presence of Hg2+ ions, while the addition of other ions such as Na+, K+, Ag+, Ca2+, Mg2+, Ba2+, Co2+, Ni2+, Cu2+, Zn2+, Cd2+, Pb2+, Cr3+, Fe3+, Al3+, Ga3+, In3+, and Ce3+ did not affect its intrinsic fluorescence. The interference of different cations was also investigated, and a qualitative analysis of Hg2+ ions was shown to be possible in the presence of most cations in the sample. The detection limit (LOD = 0.23 µM) for chemosensor 1 was determined and compared with the literature data. Chemosensor 1 was demonstrated to be applicable for monitoring the mercury(II) concentration in real samples with a high recovery rate. Despite of a relatively high cytotoxic effect for tumor and non-tumor cells, chemosensor 1 is of great interest for future investigation as a fluorescence detector of mercury ions. Future work will focus on expanding the range of cations that can be analyzed using fluorescein hydrazones.

Supplementary Materials

The following supporting information can be downloaded at: https://www.mdpi.com/article/10.3390/ijms25063186/s1. The following papers are cited in the supplementary file [27,29,58,59,60,61,62].

Author Contributions

Conceptualization, M.N.Z.; methodology, M.N.Z., A.K.I., A.V.S. and Y.A.Z.; validation, M.N.Z., Y.A.Z. and G.A.G.; formal analysis, M.N.Z., A.N.K., A.K.I. and A.V.E.; investigation, M.N.Z., A.N.K., A.K.I., A.V.S., V.A.K., E.A.Z., U.A.P. and A.V.E.; resources, A.N.K. and Y.A.Z.; data curation, M.N.Z., A.K.I., A.V.S. and A.V.E.; writing—original draft preparation, M.N.Z., A.K.I., A.V.S. and A.V.E.; writing—review and editing, M.N.Z., V.N.M. and G.A.G.; visualization, U.A.P. and A.A.K.; supervision, G.A.G.; project administration, M.N.Z.; funding acquisition, M.N.Z. All authors have read and agreed to the published version of the manuscript.

Funding

This research was funded by the Russian Science Foundation, grant number 23-73-01112, https://rscf.ru/project/23-73-01112, accessed on 6 March 2024.

Institutional Review Board Statement

Not applicable.

Informed Consent Statement

Not applicable.

Data Availability Statement

All the data used are given either in the text of the present paper or the Supplementary Materials.

Acknowledgments

Equipment from the Centers of Joint Use of Ivanovo State University of Chemistry and Technology (ISUCT) was used to perform the IR study with the financial support of the Ministry of Science and Higher Education and the Russian Federation (project 075-15-2021-671). The authors would like to thank the Center for Precision Genome Editing and Genetic Technologies for Biomedicine, IGB RAS, for providing The Beckman Coulter CytoFLEX flow cytometer and CLARIOStar Plus microplate reader. Confocal microscopy experiments were performed in the Core Facility ‘New Materials and Technologies’ at the N.M. Emanuel Institute of Biochemical Physics, Russian Academy of Sciences.

Conflicts of Interest

The authors declare no conflicts of interest.

References

  1. Järup, L. Hazards of Heavy Metal Contamination. Br. Med. Bull. 2003, 68, 167–182. [Google Scholar] [CrossRef] [PubMed]
  2. Jezierska, B.; Ługowska, K.; Witeska, M. The Effects of Heavy Metals on Embryonic Development of Fish (a Review). Fish Physiol. Biochem. 2009, 35, 625–640. [Google Scholar] [CrossRef] [PubMed]
  3. Briffa, J.; Sinagra, E.; Blundell, R. Heavy Metal Pollution in the Environment and Their Toxicological Effects on Humans. Heliyon 2020, 6, e04691. [Google Scholar] [CrossRef] [PubMed]
  4. Zahir, F.; Rizwi, S.J.; Haq, S.K.; Khan, R.H. Low Dose Mercury Toxicity and Human Health. Environ. Toxicol. Pharmacol. 2005, 20, 351–360. [Google Scholar] [CrossRef] [PubMed]
  5. Makarov, D.A.; Ovcharenko, V.V.; Nebera, E.A.; Kozhushkevich, A.I.; Shelepchikov, A.A.; Turbabina, K.A.; Kalantaenko, A.M.; Bardyugov, N.S.; Gergel, M.A. Geographical Distribution of Dioxins, Cadmium, and Mercury Concentrations in Reindeer Liver, Kidneys, and Muscle in the Russian Far North. Environ. Sci. Pollut. Res. 2022, 29, 12176–12187. [Google Scholar] [CrossRef]
  6. Barsova, N.; Yakimenko, O.; Tolpeshta, I.; Motuzova, G. Current State and Dynamics of Heavy Metal Soil Pollution in Russian Federation—A Review. Environ. Pollut. 2019, 249, 200–207. [Google Scholar] [CrossRef] [PubMed]
  7. Guidelines for Drinking-Water Quality: Fourth Edition Incorporating the First and Second Addenda. ISBN 978-92-4-004506-4. 2023. Available online: https://www.ncbi.nlm.nih.gov/books/NBK579461/ (accessed on 9 March 2024).
  8. Clarkson, T.W.; Magos, L. The Toxicology of Mercury and Its Chemical Compounds. Crit. Rev. Toxicol. 2006, 36, 609–662. [Google Scholar] [CrossRef]
  9. Neathery, M.W.; Miller, W.J. Metabolism and Toxicity of Cadmium, Mercury, and Lead in Animals: A Review. J. Dairy Sci. 1975, 58, 1767–1781. [Google Scholar] [CrossRef]
  10. Jaishankar, M.; Tseten, T.; Anbalagan, N.; Mathew, B.B.; Beeregowda, K.N. Toxicity, Mechanism and Health Effects of Some Heavy Metals. Interdiscip. Toxicol. 2014, 7, 60–72. [Google Scholar] [CrossRef]
  11. Švehla, J.; Žídek, R.; Ružovič, T.; Svoboda, K.; Kratzer, J. Simple Approaches to On-Line and off-Line Speciation Analysis of Mercury in Flue Gases with Detection by Atomic Absorption Spectrometry: A Pilot Study. Spectrochim. Acta Pt. B At. Spectrosc. 2019, 156, 51–58. [Google Scholar] [CrossRef]
  12. Liu, Q. Determination of Mercury and Methylmercury in Seafood by Ion Chromatography Using Photo-Induced Chemical Vapor Generation Atomic Fluorescence Spectrometric Detection. Microchem. J. 2010, 95, 255–258. [Google Scholar] [CrossRef]
  13. Wu, X.; Yang, W.; Liu, M.; Hou, X.; Zheng, C. Vapor Generation in Dielectric Barrier Discharge for Sensitive Detection of Mercury by Inductively Coupled Plasma Optical Emission Spectrometry. J. Anal. At. Spectrom. 2011, 26, 1204. [Google Scholar] [CrossRef]
  14. Kumari, N.; Singh, S.; Baral, M.; Kanungo, B.K. Schiff Bases: A Versatile Fluorescence Probe in Sensing Cations. J. Fluoresc. 2023, 33, 859–893. [Google Scholar] [CrossRef]
  15. Udhayakumari, D. Review on Fluorescent Sensors-Based Environmentally Related Toxic Mercury Ion Detection. J. Incl. Phenom. Macrocycl. Chem. 2022, 102, 451–476. [Google Scholar] [CrossRef]
  16. Peng, L.; Guo, H.; Wu, N.; Wang, M.; Hao, Y.; Ren, B.; Hui, Y.; Ren, H.; Yang, W. A Dual-Functional Fluorescence Probe CDs@ZIF-90 for Highly Specific Detection of Al3+ and Hg2+ in Environmental Water Samples. Anal. Chim. Acta 2024, 1288, 342171. [Google Scholar] [CrossRef]
  17. Liu, Y.; Su, X.; Liu, H.; Zhu, G.; Ge, G.; Wang, Y.; Zhou, P.; Zhou, Q. Construction of Eco-Friendly Dual Carbon Dots Ratiometric Fluorescence Probe for Highly Selective and Efficient Sensing Mercury Ion. J. Environ. Sci. 2025, 148, 1–12. [Google Scholar] [CrossRef]
  18. Bu, Y.; Wang, K.; Yang, X.; Nie, G. Photoelectrochemical Sensor for Detection Hg2+ Based on in Situ Generated MOFs-like Structures. Anal. Chim. Acta 2022, 1233, 340496. [Google Scholar] [CrossRef]
  19. Li, C.; Xu, R.; Liu, X.; Tian, L.; Wang, H.; Zhang, Y.; Wei, Q. Visible Self-Luminous Indium-Based Metal–Organic Framework for Electrochemiluminescence Detection of Hg2+. Sens. Actuators B Chem. 2024, 405, 135383. [Google Scholar] [CrossRef]
  20. Mariammal, M.; Sahane, N.; Tiwari, S. Water-Soluble Anionic N-Confused Porphyrin for Sensitive and Selective Detection of Heavy Metal Pollutants in Aqueous Environment. Anal. Sci. 2023, 39, 1317–1325. [Google Scholar] [CrossRef] [PubMed]
  21. He, J.; Li, C.; Cheng, X. Water Soluble Chitosan-Amino Acid-BODIPY Fluorescent Probes for Selective and Sensitive Detection of Hg2+/Hg+ Ions. Mater. Chem. Phys. 2023, 295, 127081. [Google Scholar] [CrossRef]
  22. Yemisci, E.; Nuri Kursunlu, A.; Oguz, M.; Oguz, A.; Yilmaz, M. A Useful Macrocyclic Combination of Pillar[5]Arene and Bodipy for Fluorometric Analysis of Hg2+: High-Resolution Monitoring in Fish Sample and Living Cells. J. Mol. Liq. 2023, 369, 120940. [Google Scholar] [CrossRef]
  23. Mishra, T.; Guria, S.; Sadhukhan, J.; Das, D.; Das, M.K.; Adhikari, S.S.; Maity, S.; Maiti, P. A Naphthalimide Appended Rhodamine Based Biocompatible Fluorescent Probe: Chemosensor for Selective Detection of Hg2+ Ion, Live Cell Imaging and DFT Study. J. Photochem. Photobiol. Chem. 2024, 446, 115168. [Google Scholar] [CrossRef]
  24. Nesaragi, A.R.; Hunsur Ravikumar, C.; Kumar Kalagatur, N.; Hoolageri, S.R.; Mussuvir Pasha, K.M.; Geetha Balakrishna, R.; Patil, S.A. In Vitro and in Vivo Nanomolar Hg2+ Detection in Live Cells and Zebrafish, Theoretical Studies. J. Photochem. Photobiol. Chem. 2023, 445, 115079. [Google Scholar] [CrossRef]
  25. Das, S.; Das, M.; Das, U.K.; Chandra Samanta, B.; Bag, A.; Patra, A.; Bhattacharya, N.; Maity, T. Spirolactam Ring Locking and Unlocking Tuned Solvent Regulated Unique Hg(II) Sensing by a Novel AIE Active Rhodamine −1, 2 Diamino Propane-Based Schiff Chemosensor and Its pH Sensor Performance. Dye. Pigment. 2024, 222, 111884. [Google Scholar] [CrossRef]
  26. Huang, J.; Liu, K.; Tian, J.; Wei, H.; Kan, C. A Rhodamine NIR Probe for Naked Eye Detection of Mercury Ions and Its Application. Spectrochim. Acta A. Mol. Biomol. Spectrosc. 2024, 306, 123553. [Google Scholar] [CrossRef]
  27. Mohammad, H.; Islam, A.S.M.; Prodhan, C.; Ali, M. A Fluorescein-Based Chemosensor for “Turn-on” Detection of Hg2+ and the Resultant Complex as a Fluorescent Sensor for S2− in Semi-Aqueous Medium with Cell-Imaging Application: Experimental and Computational Studies. New J. Chem. 2019, 43, 5297–5307. [Google Scholar] [CrossRef]
  28. Zhao, G.; Sun, Y.; Duan, H. Four Xanthene–Fluorene Based Probes for the Detection of Hg2+ Ions and Their Application in Strip Tests and Biological Cells. New J. Chem. 2021, 45, 685–695. [Google Scholar] [CrossRef]
  29. Chiou, Y.-R.; Wan, C.-F.; Wu, A.-T. A Selective Colorimetric and Turn-on Fluorescent Chemosensor for Hg2+ in Aqueous Solution. J. Fluoresc. 2017, 27, 317–322. [Google Scholar] [CrossRef]
  30. Fu, Z.-H.; Yan, L.-B.; Zhang, X.; Zhu, F.-F.; Han, X.-L.; Fang, J.; Wang, Y.-W.; Peng, Y. A Fluorescein-Based Chemosensor for Relay Fluorescence Recognition of Cu (II) Ions and Biothiols in Water and Its Applications to a Molecular Logic Gate and Living Cell Imaging. Org. Biomol. Chem. 2017, 15, 4115–4121. [Google Scholar] [CrossRef]
  31. Sivakumar, R.; Lee, N.Y. Paper-Based Fluorescence Chemosensors for Metal Ion Detection in Biological and Environmental Samples. BioChip J. 2021, 15, 216–232. [Google Scholar] [CrossRef]
  32. Jeong, Y.; Yoon, J. Recent Progress on Fluorescent Chemosensors for Metal Ions. Inorganica Chim. Acta 2012, 381, 2–14. [Google Scholar] [CrossRef]
  33. Nakahara, R.; Fujimoto, T.; Doi, M.; Morita, K.; Yamaguchi, T.; Fujita, Y. Fluorophotometric Determination of Hydrogen Peroxide and Other Reactive Oxygen Species with Fluorescein Hydrazide (FH) and Its Crystal Structure. Chem. Pharm. Bull. 2008, 56, 977–981. [Google Scholar] [CrossRef] [PubMed]
  34. Chen, X.; Ma, H. A Selective Fluorescence-on Reaction of Spiro Form Fluorescein Hydrazide with Cu(II). Anal. Chim. Acta 2006, 575, 217–222. [Google Scholar] [CrossRef] [PubMed]
  35. Mahajan, P.G.; Dige, N.C.; Vanjare, B.D.; Eo, S.-H.; Kim, S.J.; Lee, K.H. A Nano Sensor for Sensitive and Selective Detection of Cu2+ Based on Fluorescein: Cell Imaging and Drinking Water Analysis. Spectrochim. Acta. A. Mol. Biomol. Spectrosc. 2019, 216, 105–116. [Google Scholar] [CrossRef] [PubMed]
  36. Bai, Y.; Zhang, H.; Yang, B.; Leng, X. Development of a Fluorescein-Based Probe with an “Off–On” Mechanism for Selective Detection of Copper (II) Ions and Its Application in Imaging of Living Cells. Biosensors 2023, 13, 301. [Google Scholar] [CrossRef] [PubMed]
  37. Wang, X.; Shao, J.; Hu, Y. An Efficient Chemodosimeter for Cu(II) Ions Based on Hydrolysis of Fluorescein and Its Utility in Live Cell Imaging. Dye. Pigment. 2019, 171, 107680. [Google Scholar] [CrossRef]
  38. Yang, G.; Meng, X.; Fang, S.; Wang, L.; Wang, Z.; Wang, F.; Duan, H.; Hao, A. Two Novel Pyrazole-Based Chemosensors: “Naked-Eye” Colorimetric Recognition of Ni2+ and Al3+ in Alcohol and Aqueous DMF Media. New J. Chem. 2018, 42, 14630–14641. [Google Scholar] [CrossRef]
  39. An, J.; Yan, M.; Yang, Z.; Li, T.; Zhou, Q. A Turn-on Fluorescent Sensor for Zn(II) Based on Fluorescein-Coumarin Conjugate. Dye. Pigment. 2013, 99, 1–5. [Google Scholar] [CrossRef]
  40. Li, G.; Liu, G.; Zhang, D.-B.; Pu, S.-Z. A New Fluorescence Probe Based on Fluorescein-Diarylethene Fluorescence Resonance Energy Transfer System for Rapid Detection of Cd2+. Tetrahedron 2016, 72, 6390–6396. [Google Scholar] [CrossRef]
  41. Yarullin, D.N.; Zavalishin, M.N.; Gamov, G.A.; Lukanov, M.M.; Ksenofontov, A.A.; Bumagina, N.A.; Antina, E.V. Prediction of Sensor Ability Based on Chemical Formula: Possible Approaches and Pitfalls. Inorganics 2023, 11, 158. [Google Scholar] [CrossRef]
  42. Kalidas, C.; Hefter, G.; Marcus, Y. Gibbs Energies of Transfer of Cations from Water to Mixed Aqueous Organic Solvents. Chem. Rev. 2000, 100, 819–852. [Google Scholar] [CrossRef]
  43. Keerthana, S.; Bincy, S.; Louis, G.; Sudhakar, N.Y.; Anitha, V. Fluorescein Based Fluorescence Sensors for the Selective Sensing of Various Analytes. J. Fluoresc. 2021, 31, 1251–1276. [Google Scholar] [CrossRef]
  44. Rajasekar, M. Recent Development in Fluorescein Derivatives. J. Mol. Struct. 2021, 1224, 129085. [Google Scholar] [CrossRef]
  45. Griffiths, T.R.; Anderson, R.A. Effect of Ionic Strength on Stability Constants. A Study of the Electronic Absorption Spectra of the Mercuric Halides HgX+, HgX2, HgX3 and HgX2−4 in Water. J. Chem. Soc. Faraday Trans. 1 Phys. Chem. Condens. Phases 1984, 80, 2361. [Google Scholar] [CrossRef]
  46. Nagypál, I.; Beck, M.T. Diagrams for Complete Representation of Binary Mononuclear Complex Systems. Talanta 1982, 29, 473–477. [Google Scholar] [CrossRef]
  47. Powell, K.J.; Brown, P.L.; Byrne, R.H.; Gajda, T.; Hefter, G.; Sjöberg, S.; Wanner, H. Chemical Speciation of Environmentally Significant Heavy Metals with Inorganic Ligands. Part 1: The Hg2+– Cl–, OH–, CO32–, SO42–, and PO43– Aqueous Systems (IUPAC Technical Report). Pure Appl. Chem. 2005, 77, 739–800. [Google Scholar] [CrossRef]
  48. Chen, X.; Pradhan, T.; Wang, F.; Kim, J.S.; Yoon, J. Fluorescent Chemosensors Based on Spiroring-Opening of Xanthenes and Related Derivatives. Chem. Rev. 2012, 112, 1910–1956. [Google Scholar] [CrossRef] [PubMed]
  49. Yan, F.; Fan, K.; Bai, Z.; Zhang, R.; Zu, F.; Xu, J.; Li, X. Fluorescein Applications as Fluorescent Probes for the Detection of Analytes. TrAC Trends Anal. Chem. 2017, 97, 15–35. [Google Scholar] [CrossRef]
  50. Meshkov, A.N.; Gamov, G.A. KEV: A Free Software for Calculating the Equilibrium Composition and Determining the Equilibrium Constants Using UV–Vis and Potentiometric Data. Talanta 2019, 198, 200–205. [Google Scholar] [CrossRef]
  51. Frisch, M.J.; Trucks, G.W.; Schlegel, H.B.; Scuseria, G.E.; Robb, M.A.; Cheeseman, J.R.; Scalmani, G.; Barone, V.; Petersson, G.A.; Nakatsuji, H.; et al. (Eds.) Gaussian 09, Revision D.01; Gaussian, Inc.: Wallingford, CT, USA, 2016. [Google Scholar]
  52. Grimme, S. Semiempirical GGA-type Density Functional Constructed with a Long-range Dispersion Correction. J. Comput. Chem. 2006, 27, 1787–1799. [Google Scholar] [CrossRef]
  53. Weigend, F.; Ahlrichs, R. Balanced Basis Sets of Split Valence, Triple Zeta Valence and Quadruple Zeta Valence Quality for H to Rn: Design and Assessment of Accuracy. Phys. Chem. Chem. Phys. 2005, 7, 3297. [Google Scholar] [CrossRef]
  54. Pritchard, B.P.; Altarawy, D.; Didier, B.; Gibson, T.D.; Windus, T.L. New Basis Set Exchange: An Open, Up-to-Date Resource for the Molecular Sciences Community. J. Chem. Inf. Model. 2019, 59, 4814–4820. [Google Scholar] [CrossRef] [PubMed]
  55. Feller, D. The Role of Databases in Support of Computational Chemistry Calculations. J. Comput. Chem. 1996, 17, 1571–1586. [Google Scholar] [CrossRef]
  56. Schuchardt, K.L.; Didier, B.T.; Elsethagen, T.; Sun, L.; Gurumoorthi, V.; Chase, J.; Li, J.; Windus, T.L. Basis Set Exchange: A Community Database for Computational Sciences. J. Chem. Inf. Model. 2007, 47, 1045–1052. [Google Scholar] [CrossRef] [PubMed]
  57. Rappoport, D.; Furche, F. Property-Optimized Gaussian Basis Sets for Molecular Response Calculations. J. Chem. Phys. 2010, 133, 134105. [Google Scholar] [CrossRef]
  58. Kang, H.; Xu, H.; Fan, C.; Liu, G.; Pu, S. A New Sensitive Symmetric Fluorescein-Linked Diarylethene Chemosensor for Hg2+ Detection. J. Photochem. Photobiol. A Chem. 2018, 367, 465–470. [Google Scholar] [CrossRef]
  59. Huang, L.; Sun, Y.; Zhao, G.; Wang, L.; Meng, X.; Zhou, J.; Duan, H. A Novel Fluorescein-Based Fluorescent Probe for Detection Hg2+ and Bioimaging Applications. J. Mol. Struct. 2022, 1255, 132427. [Google Scholar] [CrossRef]
  60. Erdemir, S. Fluorometric Dual Sensing of Hg2+ and Al3+ by Novel Triphenylamine Appended Rhodamine Derivative in Aqueous Media. Sens. Actuators B: Chem. 2019, 290, 558–564. [Google Scholar] [CrossRef]
  61. Wang, S.; Ding, H.; Wang, Y.; Fan, C.; Liu, G.; Pu, S. Novel Multi-Responsive Fluorescence Switch for Hg2+ and UV/Vis Lights Based on Diarylethene-Rhodamine Derivative. Tetrahedron 2019, 75, 1517–1524. [Google Scholar] [CrossRef]
  62. Rathod, R.V.; Bera, S.; Maity, P.; Mondal, D. Mechanochemical Synthesis of a Fluorescein-Based Sensor for the Selective Detection and Removal of Hg2+ Ions in Industrial Effluents. ACS Omega 2020, 5, 4982–4990. [Google Scholar] [CrossRef]
Figure 1. Fluorescence spectra of the mixture of chemosensor 1 (50 µM) and Hg2+ (250 µM) in H2O/DMSO mixtures with different water fractions (a); The dependence of the fluorescence intensity at the emission maximum of 520 nm for a mixture of chemosensor 1 (50 µM) and Hg2+ (250 µM) in H2O/DMSO mixtures (b).
Ijms 25 03186 g001
Figure 2. Solution color (a), naked-eye visible luminescence at λex = 365 nm (b), UV-Vis spectra (c), and fluorescence spectra (d) of chemosensor 1 (50 μM) and its mixtures with different cations (250 μM) in H2O-DMSO (8:2 v/v).
Ijms 25 03186 g002
Figure 3. Fluorescence intensity at λem = 520 nm of 1 + cations and 1-Hg2+ + cations mixtures (a); emission spectra of 1-Hg2+ + anions mixtures (b). The solvent is H2O-DMSO (8:2 v/v).
Ijms 25 03186 g003
Figure 4. Spectrofluorimetric titration of chemosensor 1 (50 µM) by 0.01103 M Hg2+ ions solution (a); dependence of fluorescence intensity at λem = 520 nm on the total concentration of mercury(II) ions (b). The solvent is H2O-DMSO (8:2 v/v). The error bars indicate the random inaccuracy for the three experiments.
Ijms 25 03186 g004
Figure 5. Absorption change at λem = 335 nm of chemosensor 1 (50 µM) at 335 nm during 8 days (a); fluorescence intensity change at λem = 520 nm of mixture 1 (50 µM) + (500 µM) Hg2+ during 160 min (b). Solvent is H2O-DMSO (8:2 v/v). The error bars indicate the random inaccuracy for the three experiments.
Ijms 25 03186 g005
Figure 6. Potential energy surface profile of the thiazole ring rotation; θ is N-C5-C6-C4 torsion angle.
Ijms 25 03186 g006
Figure 7. Calculated (solid lines) and experimental (dashed line) electronic absorption spectra of 1.
Ijms 25 03186 g007
Figure 8. Shapes of frontier orbitals of 1.
Ijms 25 03186 g008
Figure 9. Measurements of cytotoxicity of 1 compound (green) and Hg2+ salt (black), as well as their complex (blue), to human colon carcinoma cells (HCT116) and non-tumor human embryonal kidney cells (HEK293T) after 72 h of incubation. Doxorubicin (red) was taken as a standard for the comparison.
Ijms 25 03186 g009
Figure 10. Accumulation of 1:Hg2+ complex in HCT116 cells at various concentrations and incubation times (A), as well as of compound 1 alone followed by the addition of Hg2+ ions (B).
Ijms 25 03186 g010
Figure 11. Confocal microscopy of HCT116 cells after 4 h of incubation with compound 1 (50 μM) or 1:Hg2+ complex (25 and 50 μM): dark field (left), BF—bright field (middle), and overlay (right).
Ijms 25 03186 g011
Figure 12. Scheme for synthesizing chemosensor 1.
Ijms 25 03186 g012
Figure 13. Contour map λex–λem chemosensor 1-Hg2+ mixture (50:250 µM).
Ijms 25 03186 g013
Table 1. Determination of Hg2+ ions in various water samples.
SampleAdded, µMFound, µMRecovery, %
Uvod river30.0028.74 ± 2.1295.80
40.0037.55 ± 2.9193.88
60.0054.93 ± 3.6391.55
Uhtokhma river30.0029.01 ± 1.8496.70
40.0037.18 ± 2.5492.95
60.0057.43 ± 2.3295.72
Table 2. Half-maximal inhibitory concentrations (IC50) of 1, Hg2+ salt and 1:Hg2+ complex.
11:Hg2+Hg2+
HCT11620.9614.6825.91
HEK293T20.3815.7457.17
Disclaimer/Publisher’s Note: The statements, opinions and data contained in all publications are solely those of the individual author(s) and contributor(s) and not of MDPI and/or the editor(s). MDPI and/or the editor(s) disclaim responsibility for any injury to people or property resulting from any ideas, methods, instructions or products referred to in the content.

