
Integrative Metabolomic and Transcriptomic Analyses Reveal the Mechanism of Petal Blotch Formation in Rosa persica

 and
and 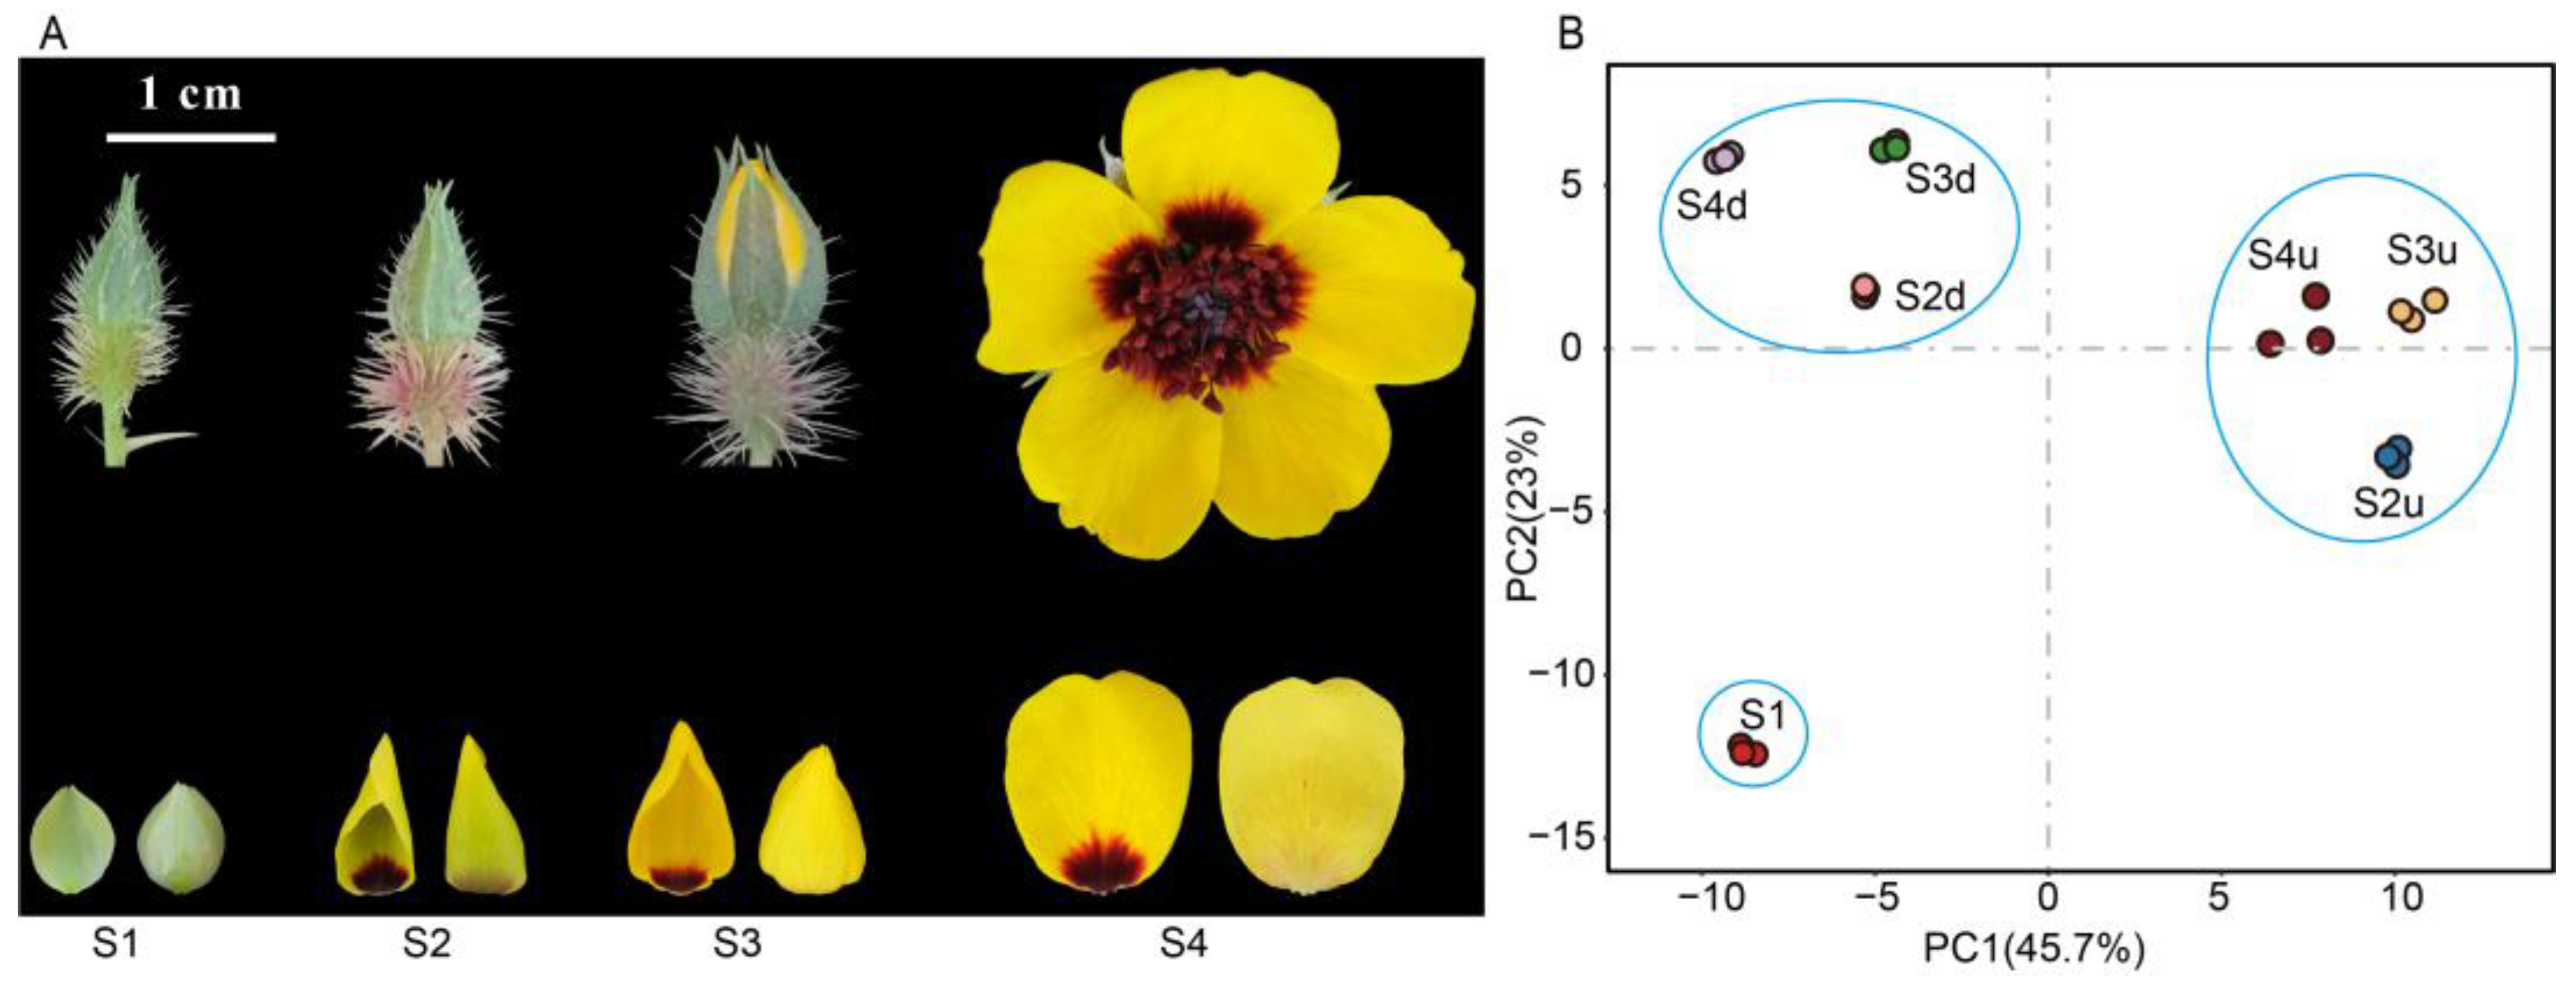
Abstract
1. Introduction
2. Results
2.1. Metabolomic Differences among R. persica Petals
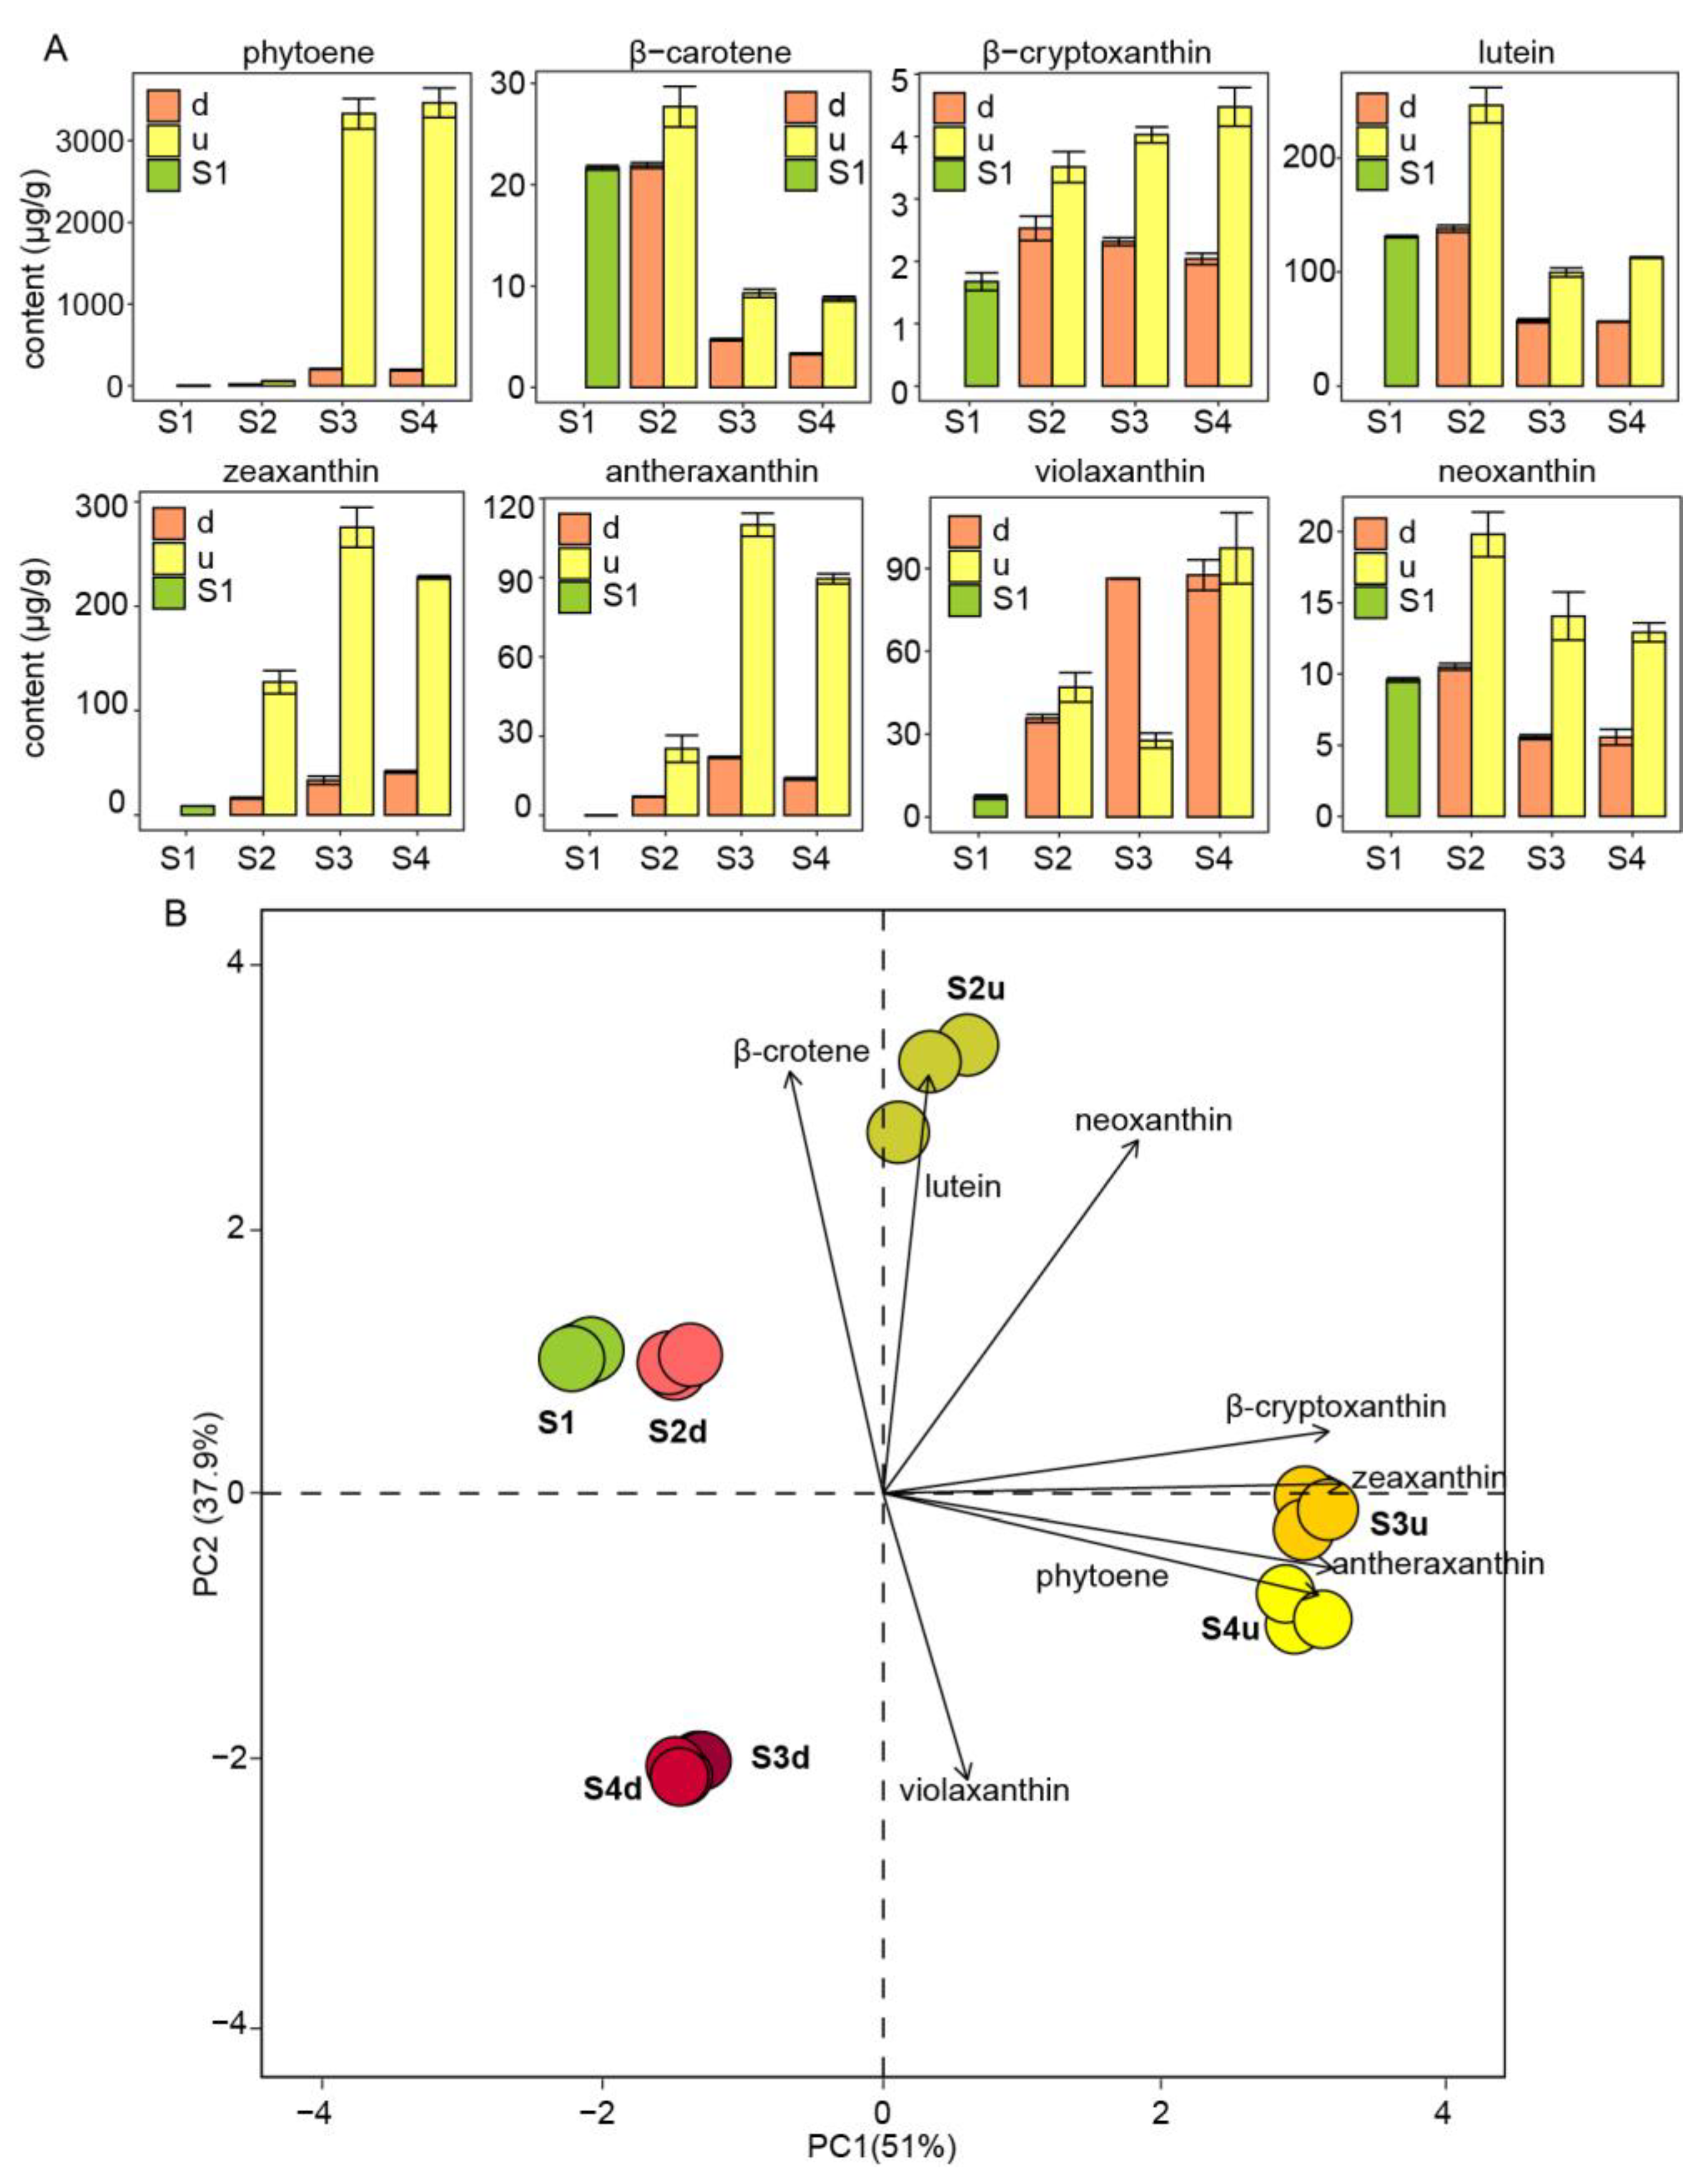
2.2. Differential Accumulation of Carotenoids in the Petals of R. persica
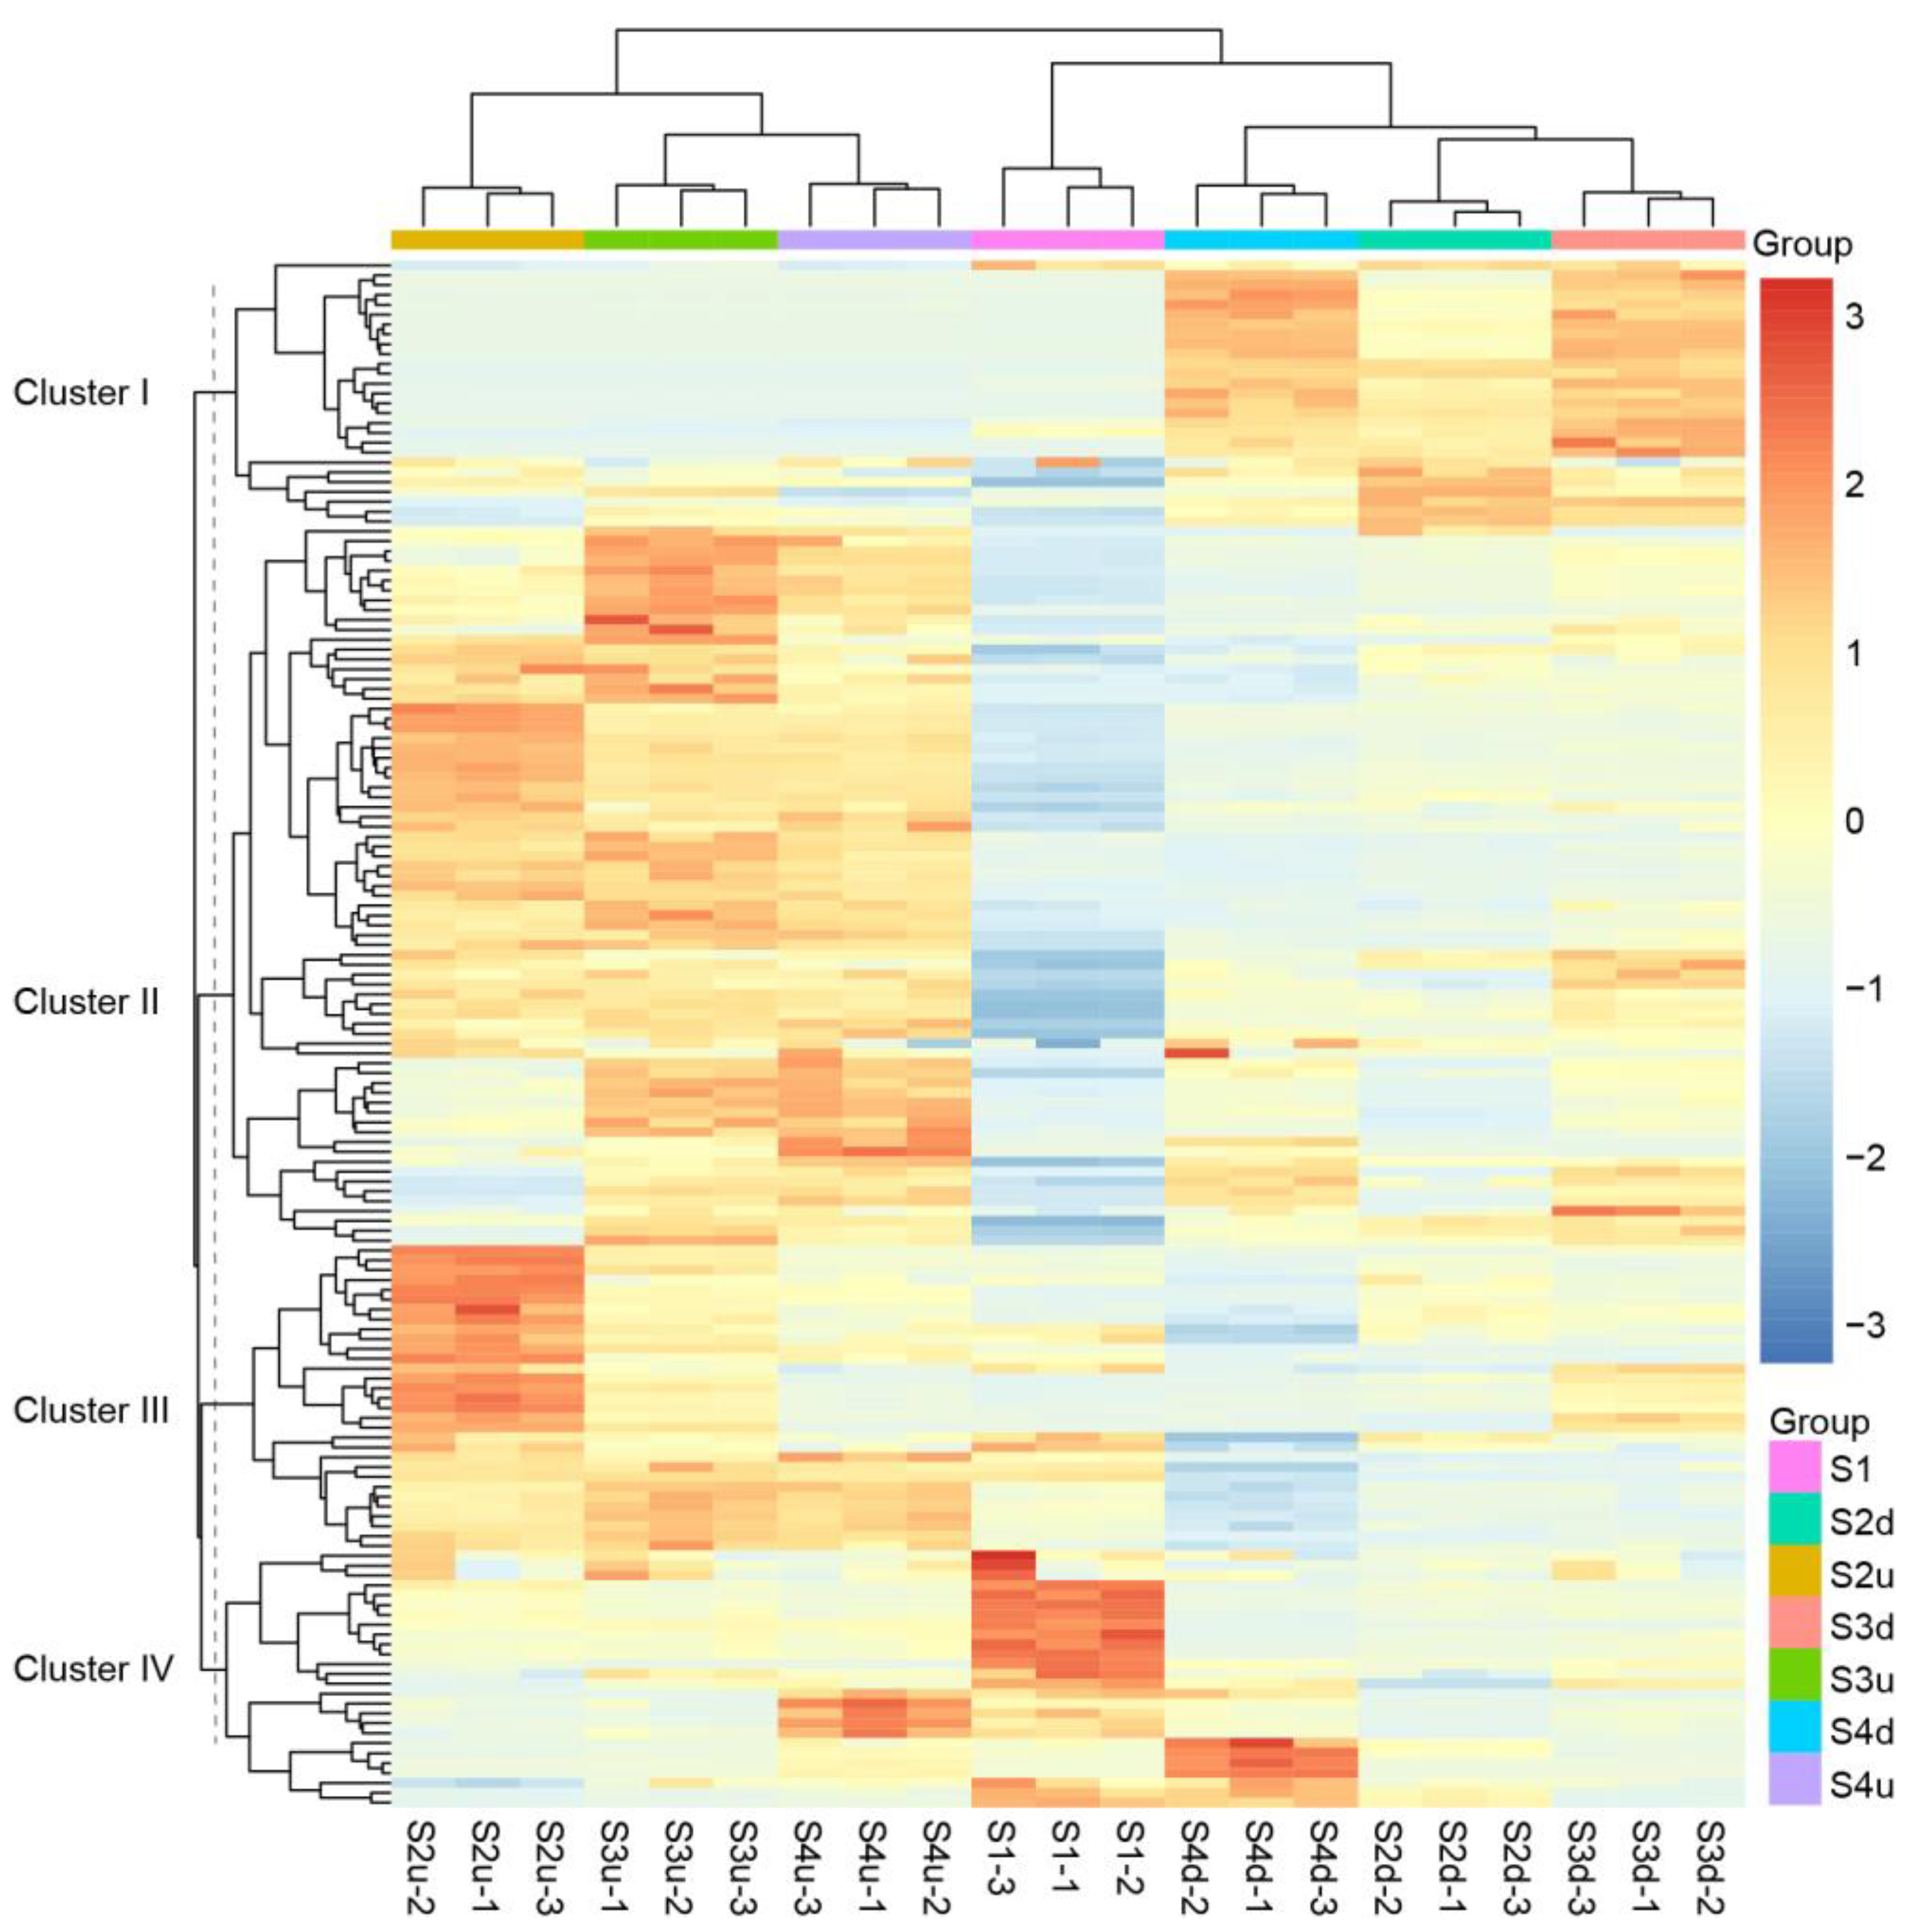
2.3. Transcriptomic Analysis of R. persica
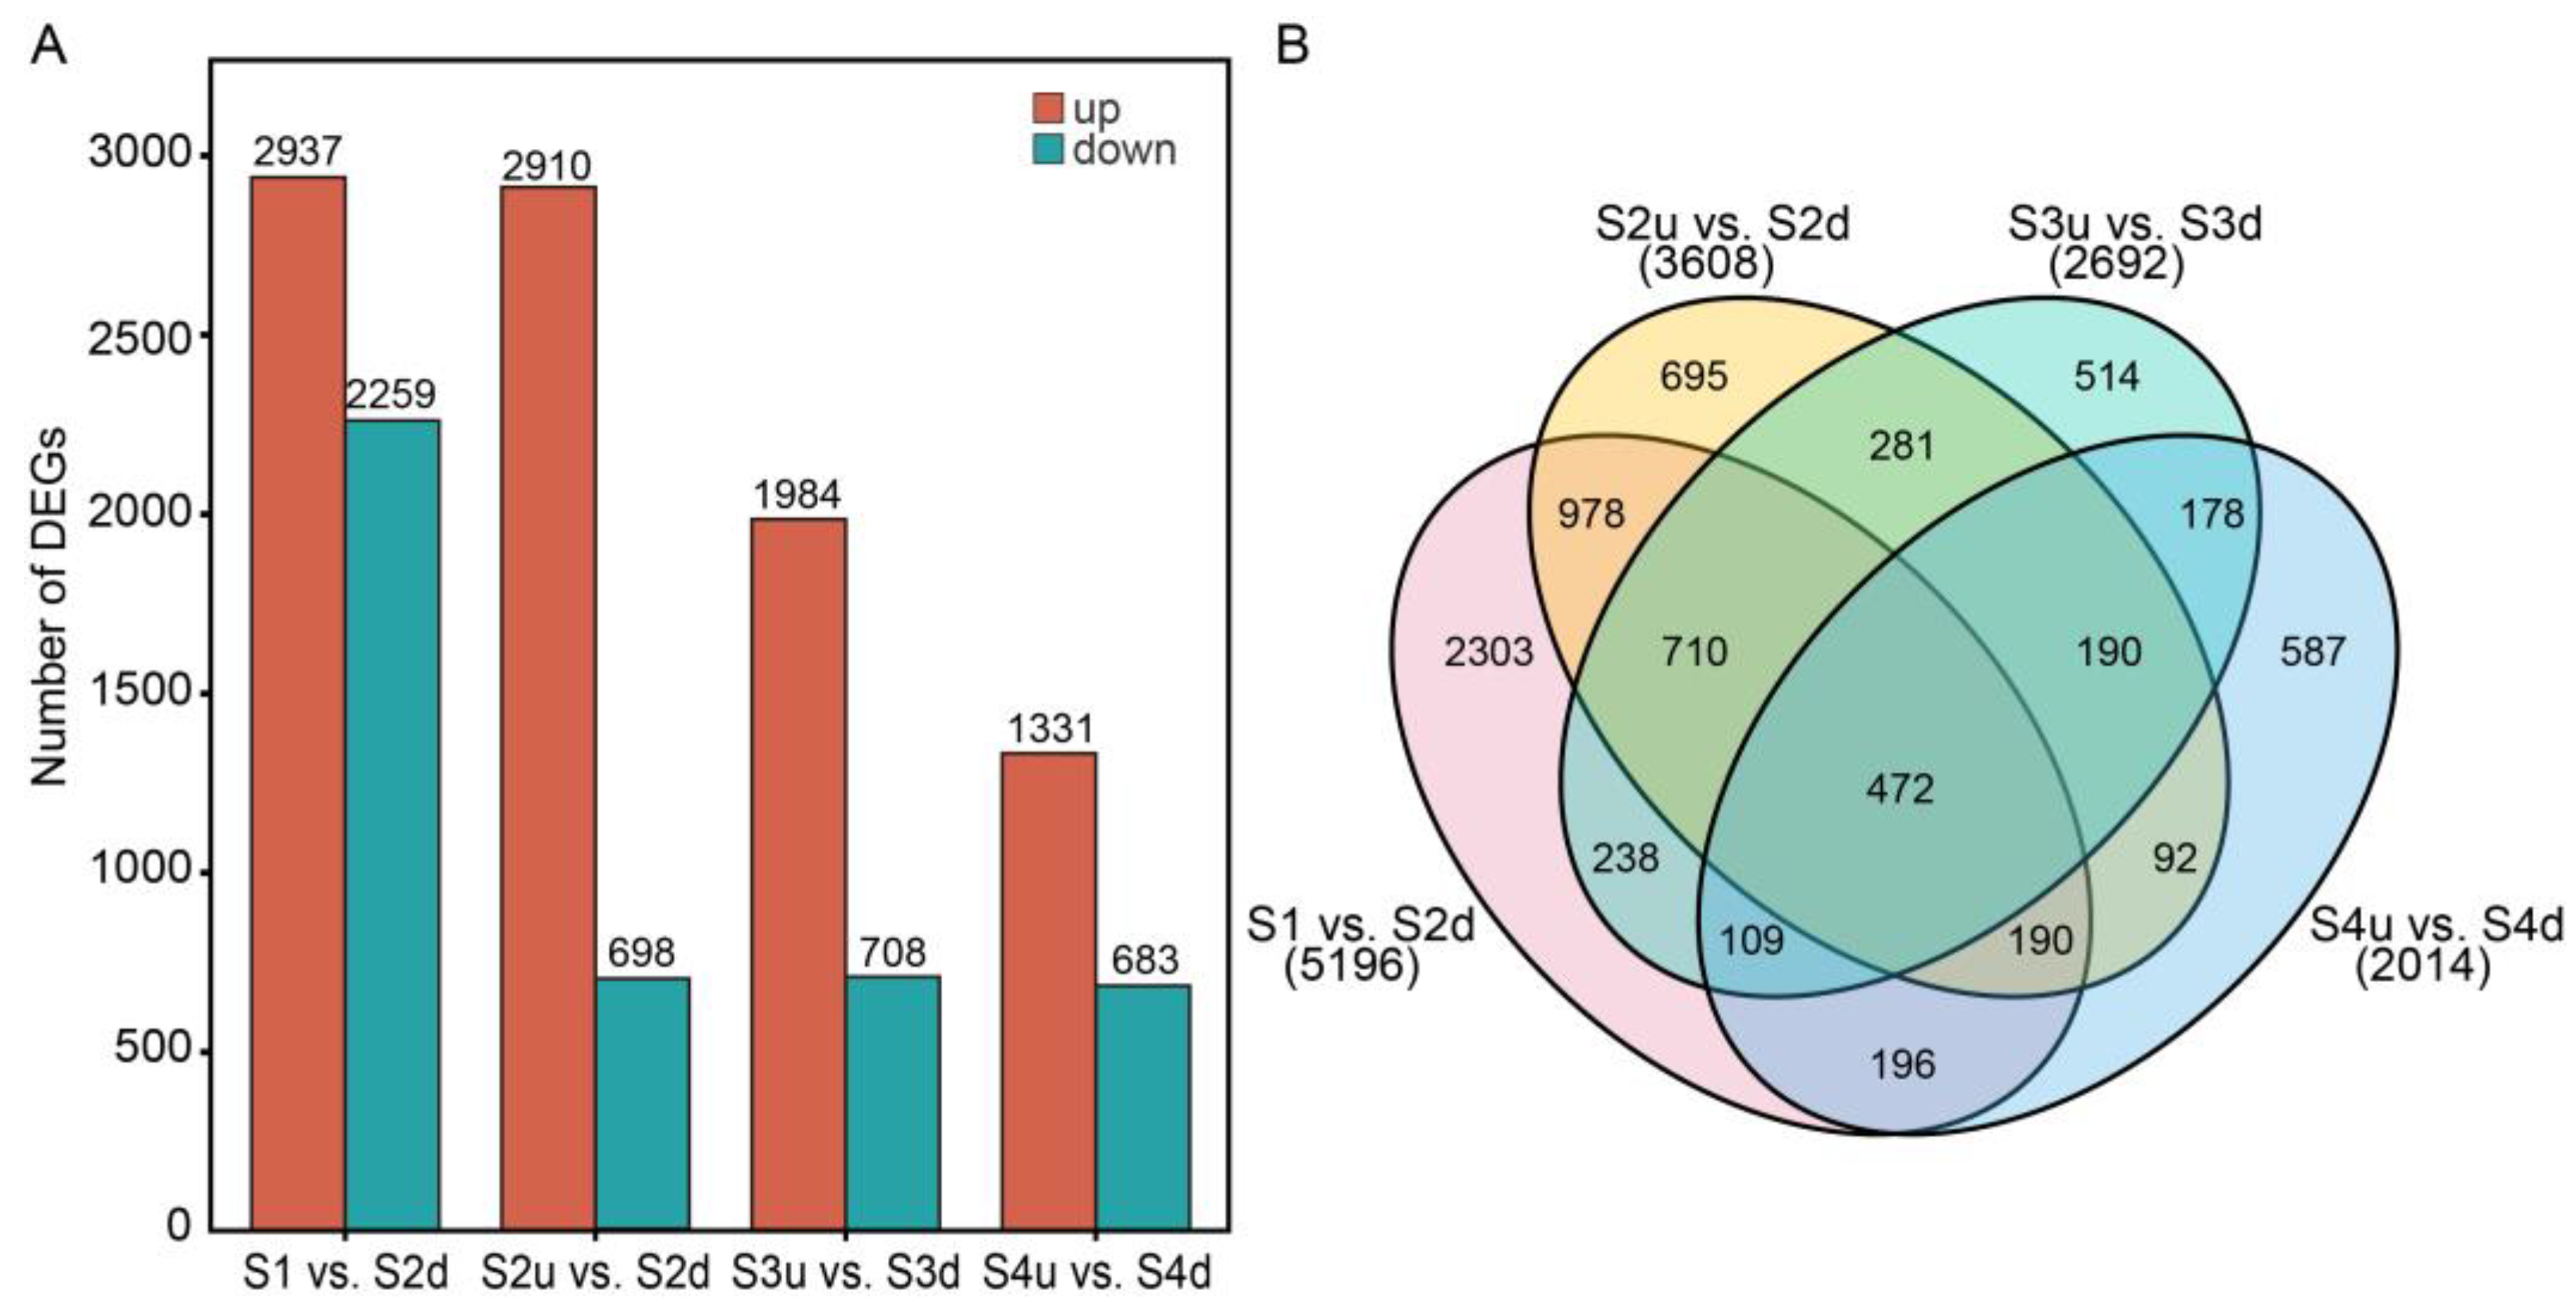
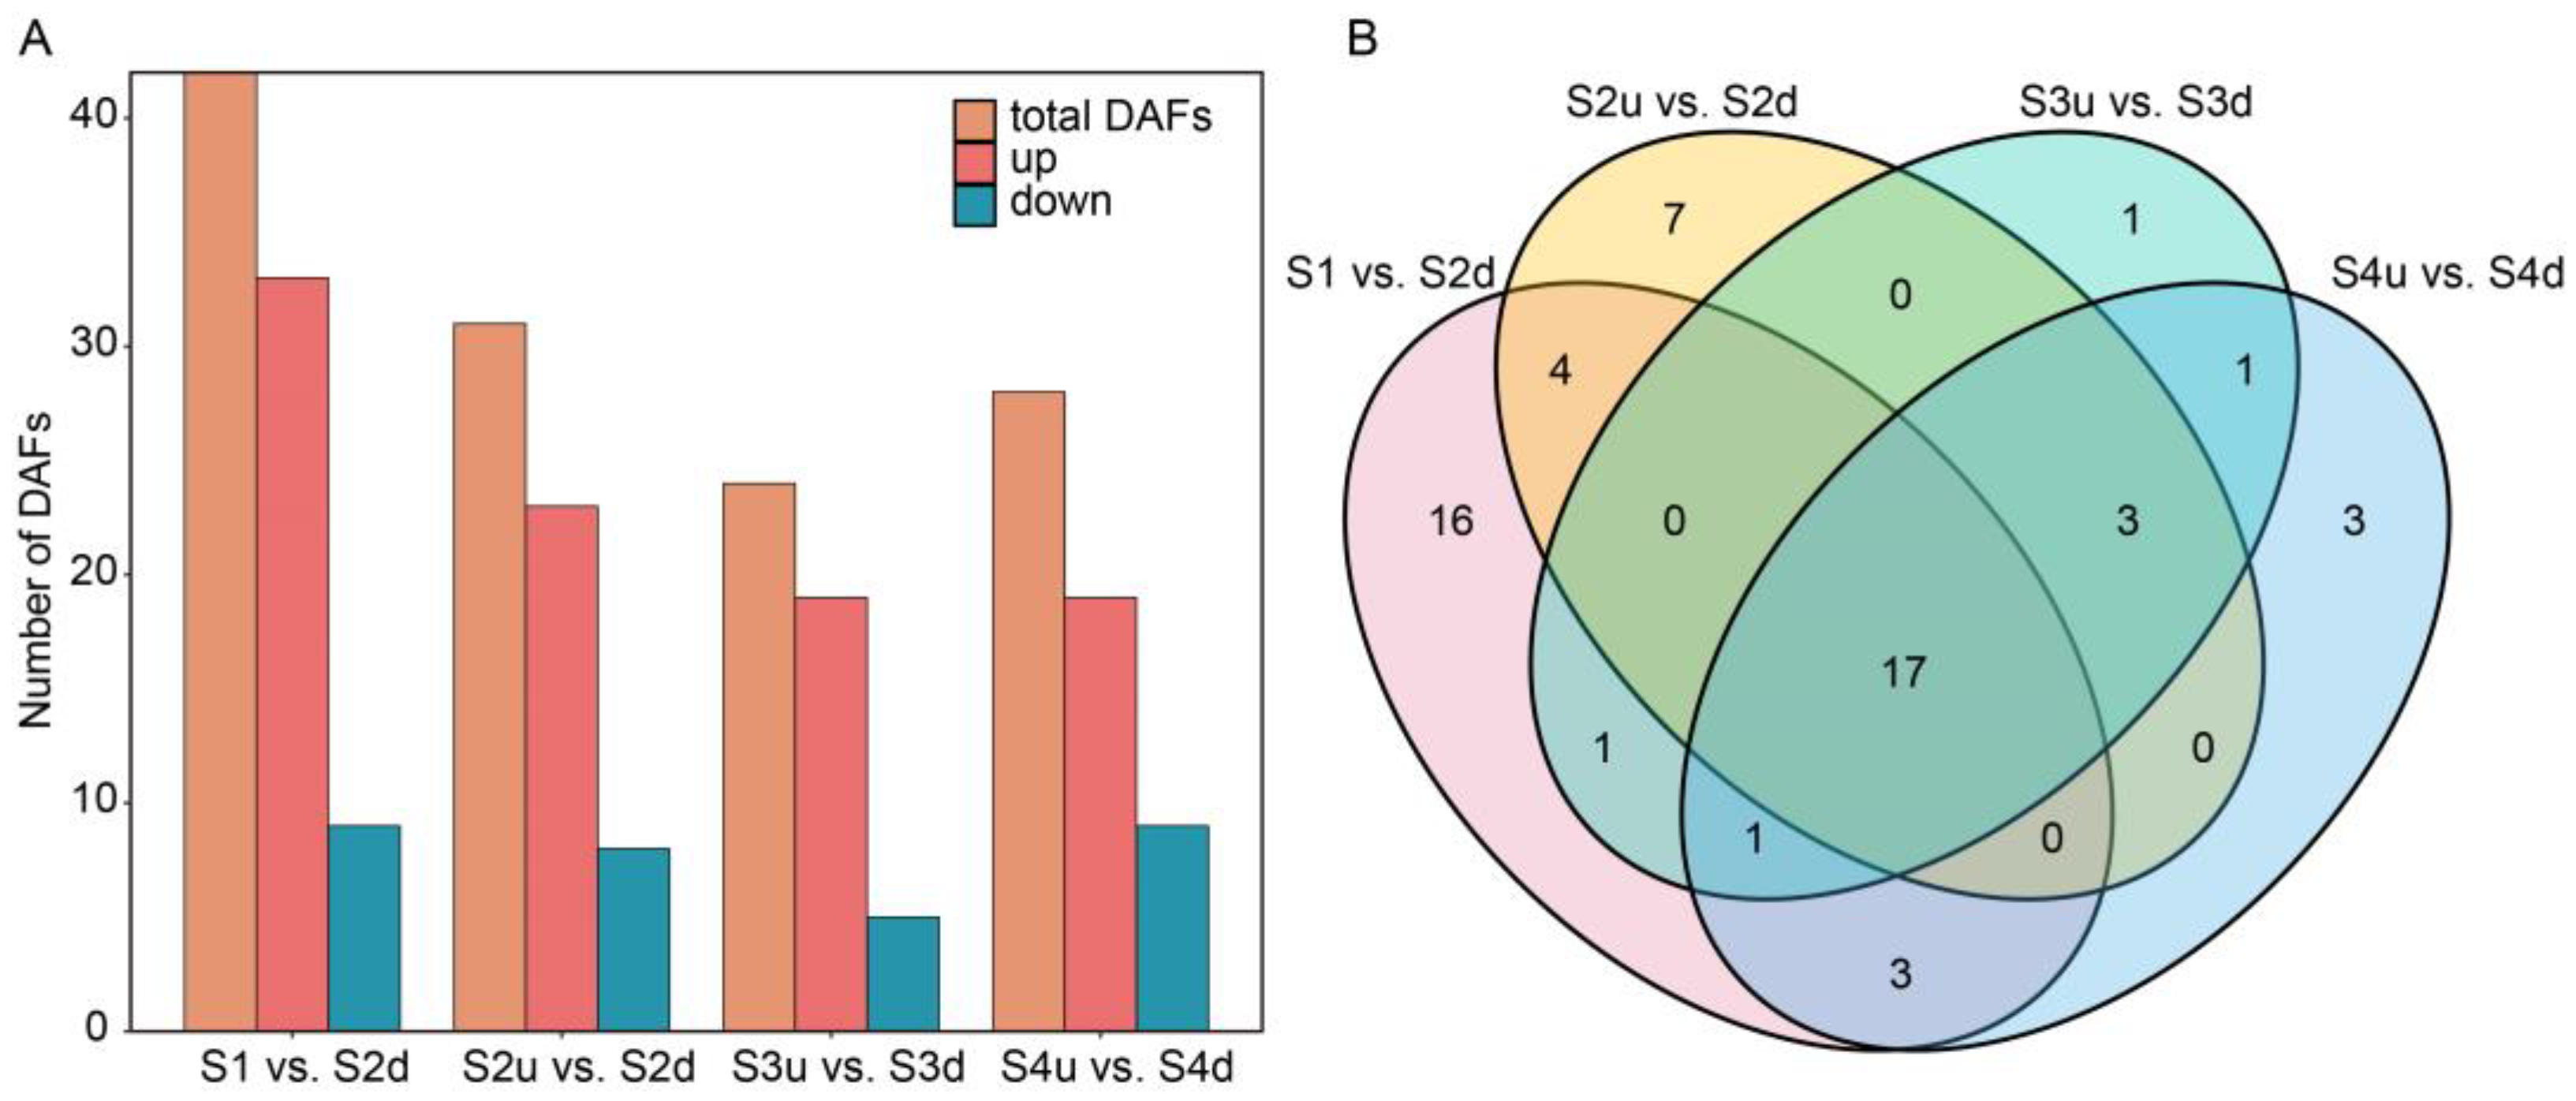
2.4. Differentially Expressed Gene (DEG) Analysis of Petal Blotch and Non-Blotch Parts at Four Stages
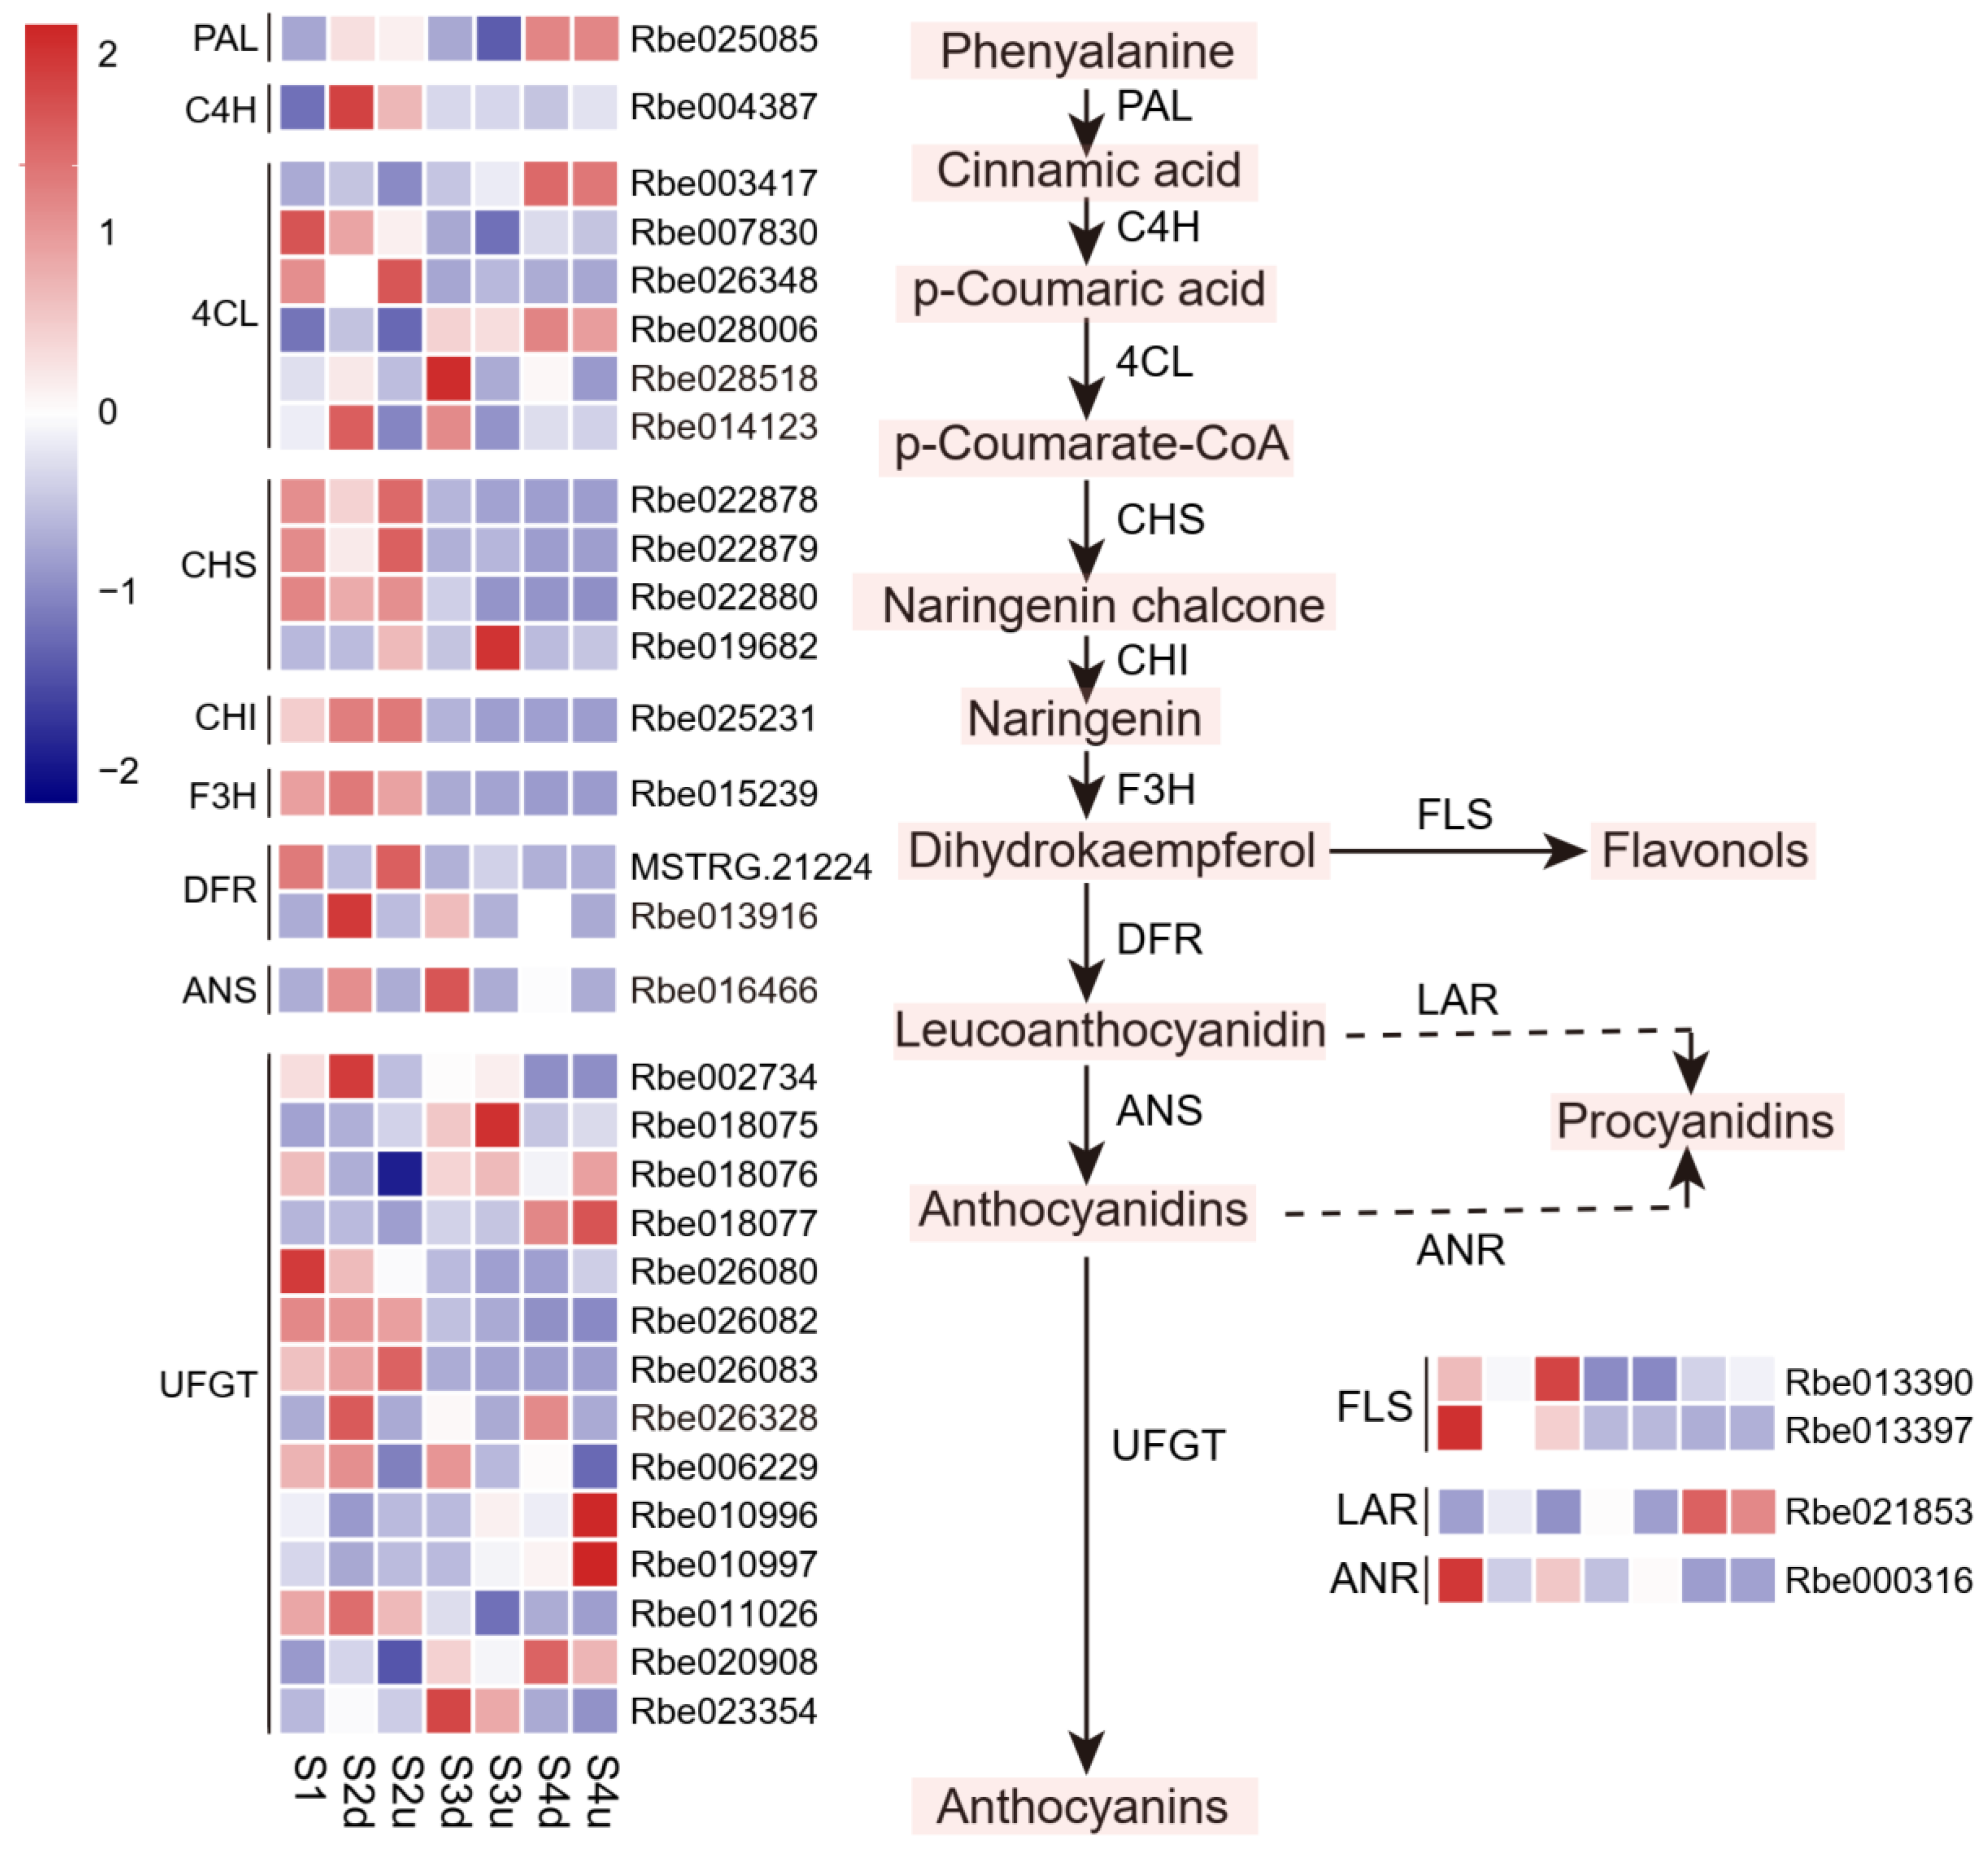
2.5. Expression Profiles of Genes Related to Anthocyanin Biosynthesis Involved in Blotch Formation
2.6. Identification of TFs Involved in Blotch Formation
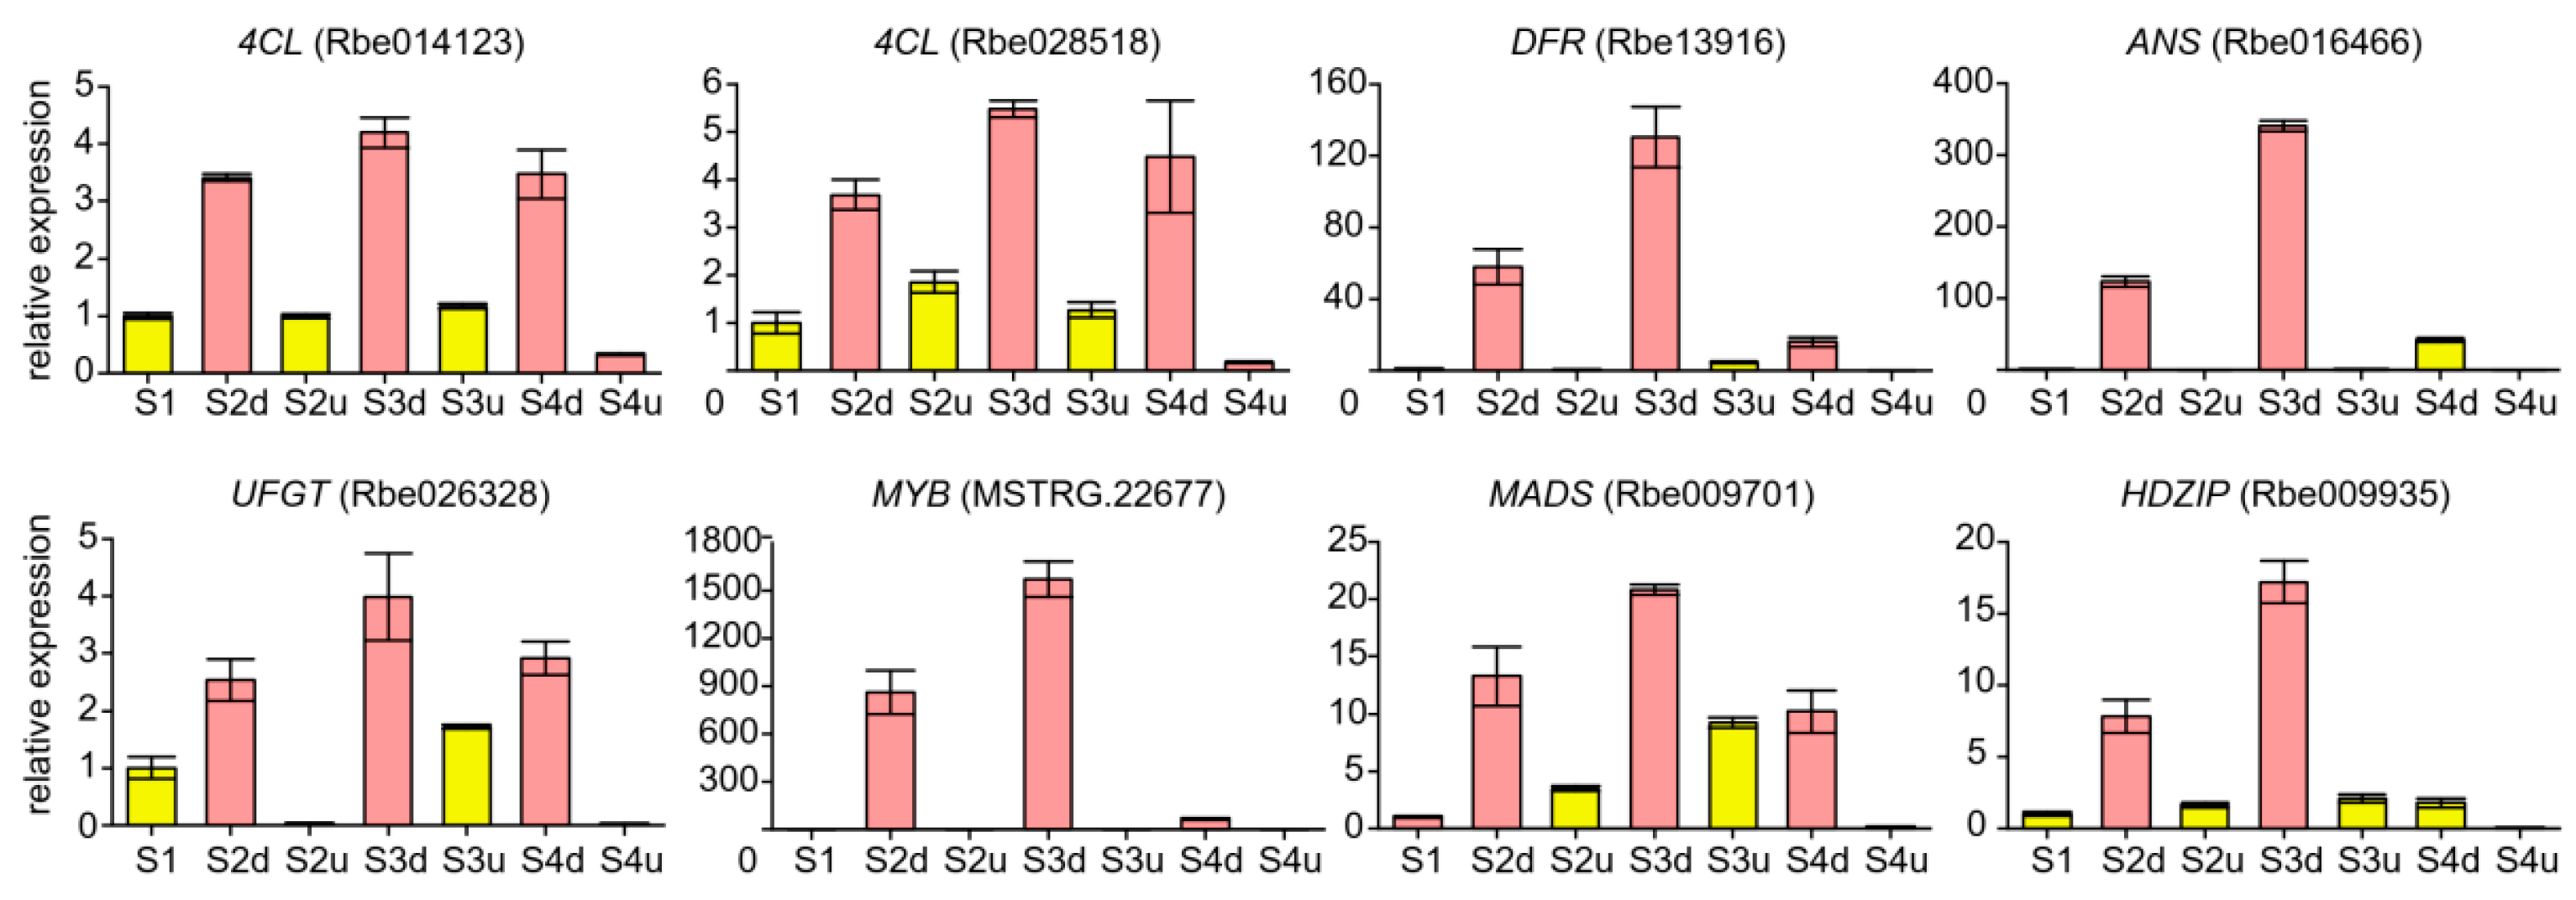
2.7. qRT-PCR Validation of DEGs
3. Discussion
4. Materials and Methods
4.1. Plant Materials
4.2. Metabolomic Analysis of Flavonoids and Carotenoids
4.3. Transcriptome Sequencing and Analyses
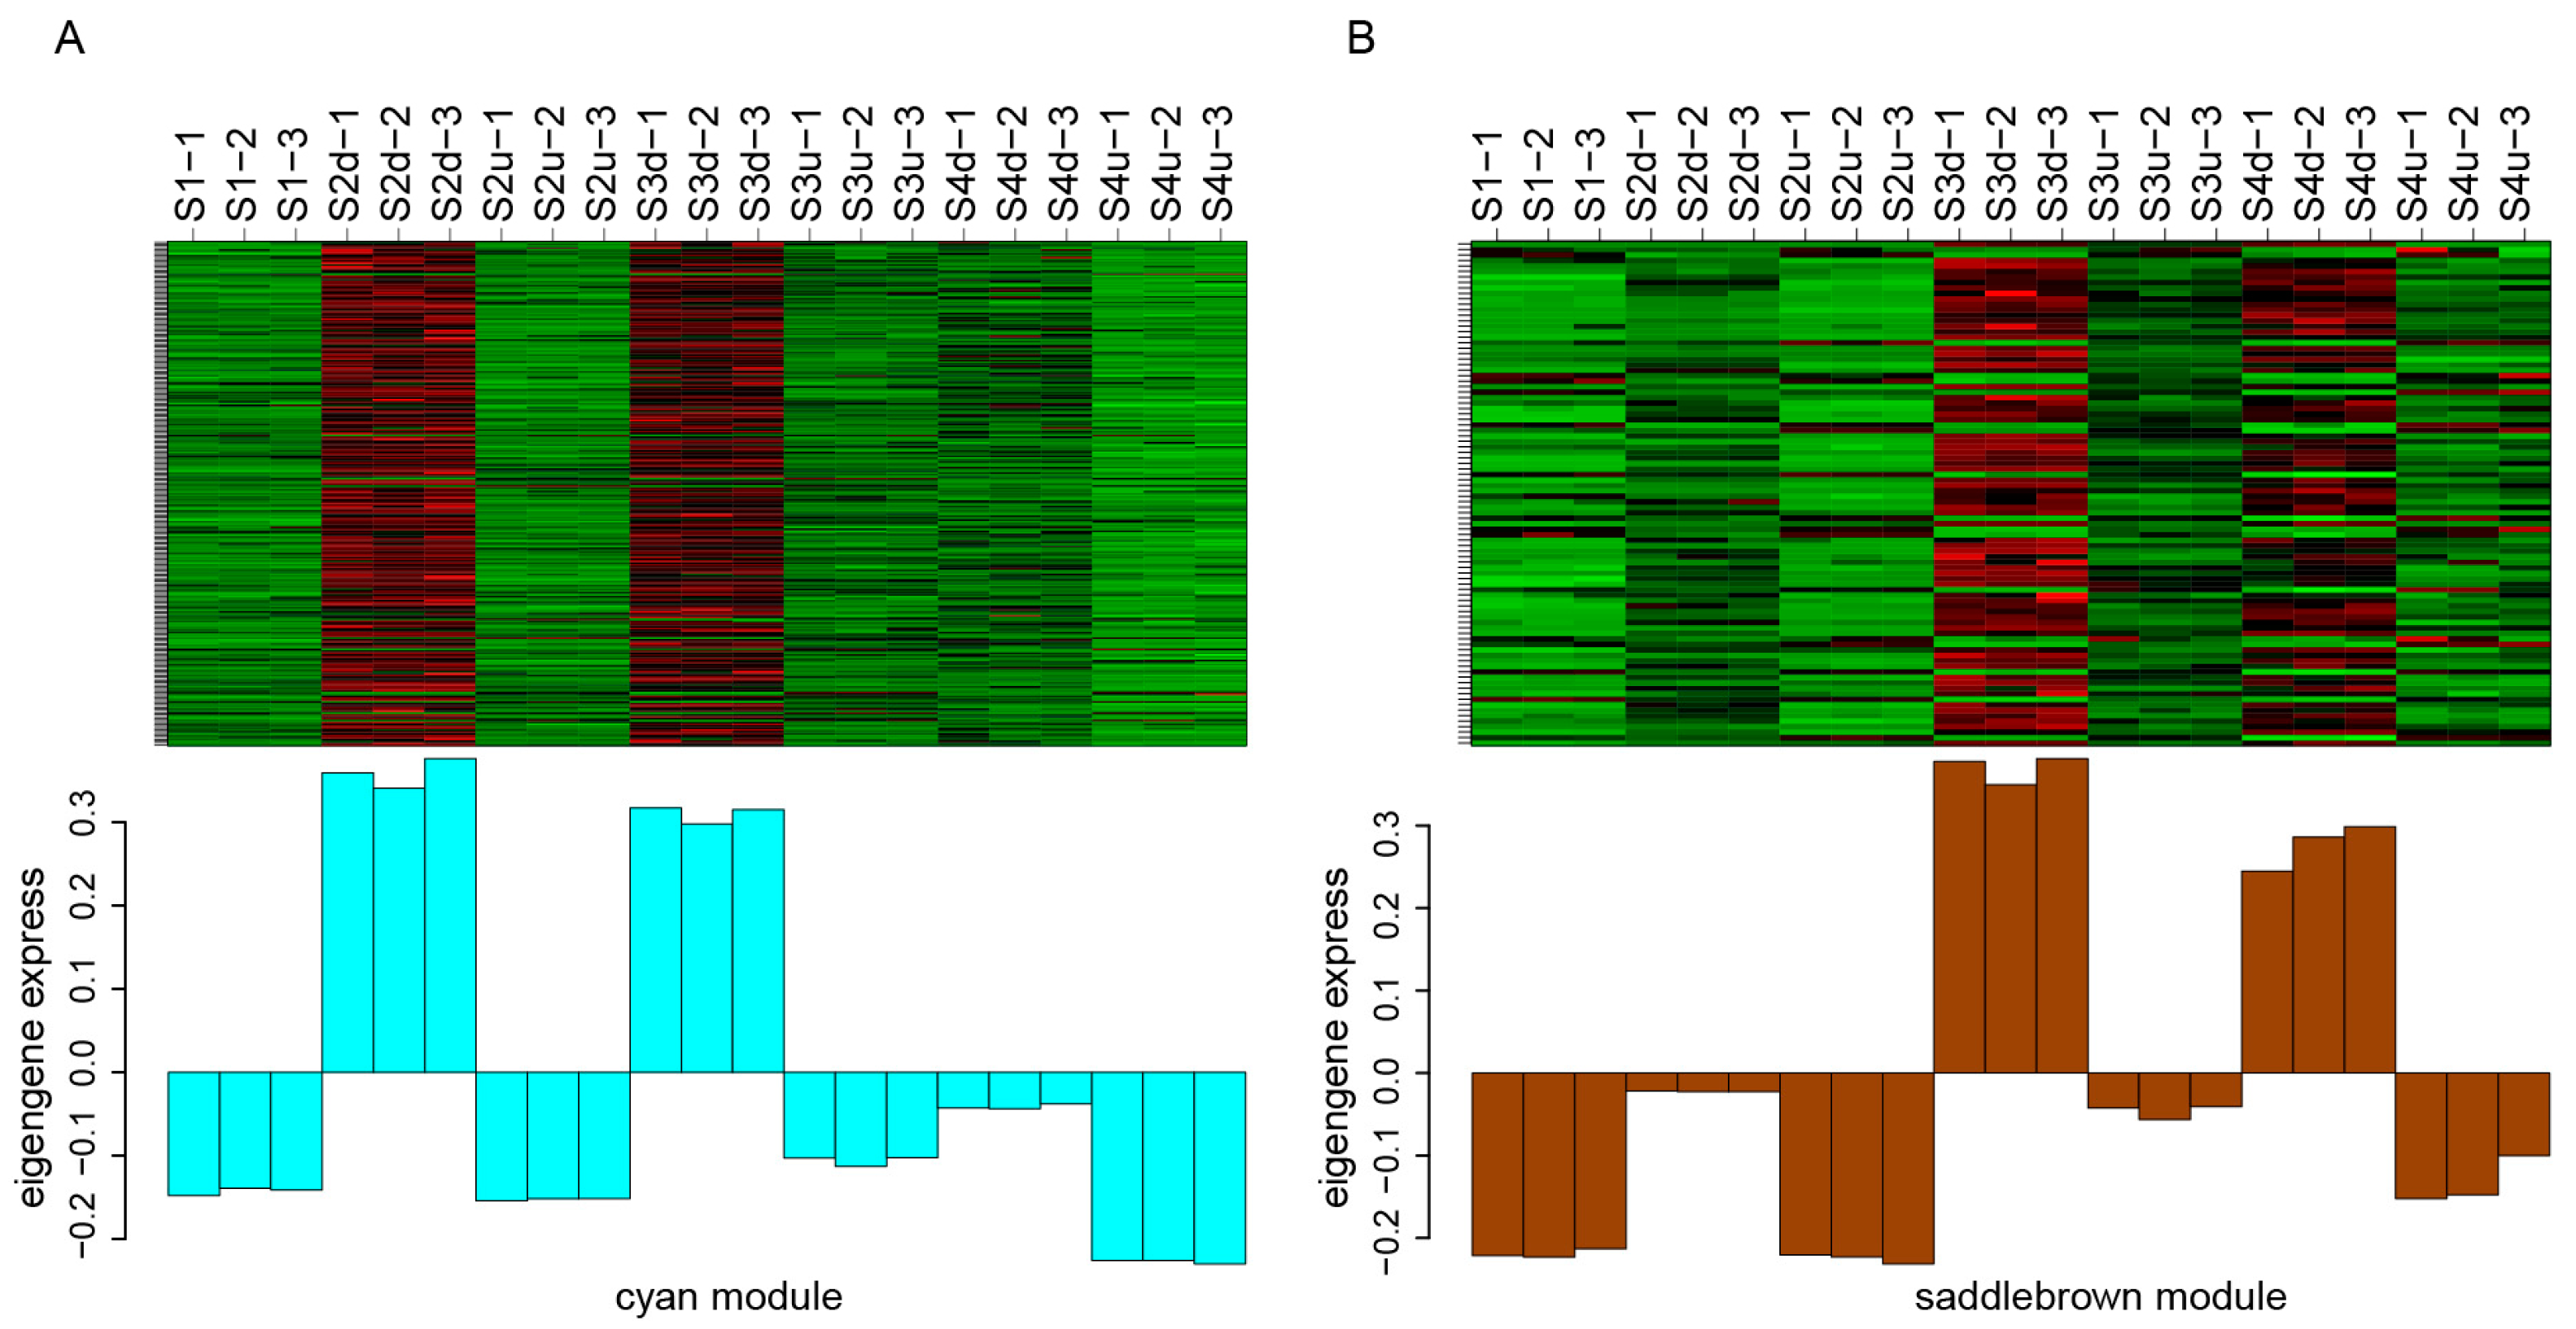
4.4. Weighted Gene Co-Expression Network Analysis
4.5. Real-Time Quantitative Reverse Transcription PCR (qRT-PCR) Analysis
4.6. Statistical Analysis
5. Conclusions
Supplementary Materials
Author Contributions
Funding
Institutional Review Board Statement
Informed Consent Statement
Data Availability Statement
Conflicts of Interest
References
- Davies, K.M.; Albert, N.W.; Schwinn, K.E. From landing lights to mimicry: The molecular regulation of flower colouration and mechanisms for pigmentation patterning. Funct. Plant Biol. 2012, 39, 619–638. [Google Scholar] [CrossRef]
- Glover, B.J.; Walker, R.H.; Moyroud, E.; Brockington, S.F. How to spot a flower. New Phytol. 2013, 197, 687–689. [Google Scholar] [CrossRef]
- Ding, B. The roles of R2R3-MYBs in regulating complex pigmentation patterns in flowers. Hortic. Plant J. 2023, 9, 1067–1078. [Google Scholar] [CrossRef]
- LaFountain, A.M.; Yuan, Y.W. Repressors of anthocyanin biosynthesis. New Phytol. 2021, 231, 933–949. [Google Scholar] [CrossRef]
- Raymond, O.; Gouzy, J.; Just, J.; Badouin, H.; Verdenaud, M.; Lemainque, A.; Vergne, P.; Moja, S.; Choisne, N.; Pont, C.; et al. The Rosa genome provides new insights into the domestication of modern roses. Nat. Genet. 2018, 50, 772–777. [Google Scholar] [CrossRef]
- Ji, N.; Wang, Q.; Li, S.; Wen, J.; Wang, L.; Ding, X.; Zhao, S.; Feng, H. Metabolic profile and transcriptome reveal the mystery of petal blotch formation in rose. BMC Plant Biol. 2023, 23, 46. [Google Scholar] [CrossRef]
- Tanaka, Y.; Sasaki, N.; Ohmiya, A. Biosynthesis of plant pigments: Anthocyanins, betalains and carotenoids. Plant J. 2008, 54, 733–749. [Google Scholar] [CrossRef]
- Zhao, D.; Tao, J. Recent advances on the development and regulation of flower color in ornamental plants. Front. Plant Sci. 2015, 6, 261. [Google Scholar] [CrossRef]
- Koes, R.; Verweij, W.; Quattrocchio, F. Flavonoids: A colorful model for the regulation and evolution of biochemical pathways. Trends Plant Sci. 2005, 10, 236–242. [Google Scholar] [CrossRef]
- Rausher, M.D.; Miller, R.E.; Tiffin, P. Patterns of evolutionary rate variation among genes of the anthocyanin biosynthetic pathway. Mol. Biol. Evol. 1999, 16, 266–274. [Google Scholar] [CrossRef]
- Benny, J.; Marra, F.P.; Giovino, A.; Balan, B.; Caruso, T.; Martinelli, F.; Marchese, A. Transcriptome analysis of Pistacia vera inflorescence buds in bearing and non-bearing shoots reveal the molecular mechanism causing premature flower bud abscission. Genes 2020, 11, 851. [Google Scholar] [CrossRef]
- Ding, B.; Patterson, E.L.; Holalu, S.V.; Li, J.; Johnson, G.A.; Stanley, L.E.; Greenlee, A.B.; Peng, F.; Bradshaw, H., Jr.; Blinov, M.L. Two MYB proteins in a self-organizing activator-inhibitor system produce spotted pigmentation patterns. Curr. Biol. 2020, 30, 802–814. [Google Scholar] [CrossRef]
- Spelt, C.; Quattrocchio, F.; Mol, J.N.; Koes, R. anthocyanin1 of petunia encodes a basic helix-loop-helix protein that directly activates transcription of structural anthocyanin genes. Plant Cell 2000, 12, 1619–1631. [Google Scholar] [CrossRef]
- Schwinn, K.; Venail, J.; Shang, Y.; Mackay, S.; Alm, V.; Butelli, E.; Oyama, R.; Bailey, P.; Davies, K.; Martin, C. A small family of MYB-regulatory genes controls floral pigmentation intensity and patterning in the genus Antirrhinum. Plant Cell 2006, 18, 831–851. [Google Scholar] [CrossRef]
- Albert, N.W.; Davies, K.M.; Lewis, D.H.; Zhang, H.; Montefiori, M.; Brendolise, C.; Boase, M.R.; Ngo, H.; Jameson, P.E.; Schwinn, K.E. A conserved network of transcriptional activators and repressors regulates anthocyanin pigmentation in Eudicots. Plant Cell 2014, 26, 962–980. [Google Scholar] [CrossRef]
- Kato, M.; Ikoma, Y.; Matsumoto, H.; Sugiura, M.; Hyodo, H.; Yano, M. Accumulation of carotenoids and expression of carotenoid biosynthetic genes during maturation in citrus fruit. Plant Physiol. 2004, 134, 824–837. [Google Scholar] [CrossRef]
- Stanley, L.; Yuan, Y.-W. Transcriptional regulation of carotenoid biosynthesis in plants: So many regulators, so little consensus. Front. Plant Sci. 2019, 10, 1017. [Google Scholar] [CrossRef]
- Yuan, Y.W.; Sagawa, J.M.; Frost, L.; Vela, J.P.; Bradshaw, H.D., Jr. Transcriptional control of floral anthocyanin pigmentation in monkeyflowers (Mimulus). New Phytol. 2014, 204, 1013–1027. [Google Scholar] [CrossRef]
- Yamagishi, M. Involvement of a LhMYB18 transcription factor in large anthocyanin spot formation on the flower tepals of the Asiatic hybrid lily (Lilium spp.) cultivar “Grand Cru”. Mol. Breed. 2018, 38, 60. [Google Scholar] [CrossRef]
- Yamagishi, M.; Uchiyama, H.; Handa, T. Floral pigmentation pattern in Oriental hybrid lily (Lilium spp.) cultivar ‘Dizzy’ is caused by transcriptional regulation of anthocyanin biosynthesis genes. J. Plant Physiol. 2018, 228, 85–91. [Google Scholar] [CrossRef]
- Yamagishi, M.; Shimoyamada, Y.; Nakatsuka, T.; Masuda, K. Two R2R3-MYB genes, homologs of petunia AN2, regulate anthocyanin biosyntheses in flower tepals, tepal spots and leaves of Asiatic hybrid lily. Plant Cell Physiol. 2010, 51, 463–474. [Google Scholar] [CrossRef]
- Li, B.J.; Zheng, B.Q.; Wang, J.Y.; Tsai, W.C.; Lu, H.C.; Zou, L.H.; Wan, X.; Zhang, D.Y.; Qiao, H.J.; Liu, Z.J. New insight into the molecular mechanism of colour differentiation among floral segments in orchids. Commun. Biol. 2020, 3, 89. [Google Scholar] [CrossRef] [PubMed]
- Lin, R.-C.; Rausher, M.D. R2R3-MYB genes control petal pigmentation patterning in Clarkia gracilis ssp. sonomensis (Onagraceae). New Phytol. 2021, 229, 1147–1162. [Google Scholar] [CrossRef]
- Martins, T.R.; Jiang, P.; Rausher, M.D. How petals change their spots: Cis-regulatory re-wiring in Clarkia (Onagraceae). New Phytol. 2017, 216, 510–518. [Google Scholar] [CrossRef] [PubMed]
- Hsu, C.-C.; Chen, Y.-Y.; Tsai, W.-C.; Chen, W.-H.; Chen, H.-H. Three R2R3-MYB transcription factors regulate distinct floral pigmentation patterning in Phalaenopsis spp. Plant Physiol. 2015, 168, 175–191. [Google Scholar] [CrossRef] [PubMed]
- Gu, Z.; Zhu, J.; Hao, Q.; Yuan, Y.-W.; Duan, Y.-W.; Men, S.; Wang, Q.; Hou, Q.; Liu, Z.-A.; Shu, Q. A novel R2R3-MYB transcription factor contributes to petal blotch formation by regulating organ-specific expression of PsCHS in tree peony (Paeonia suffruticosa). Plant Cell Physiol. 2019, 60, 599–611. [Google Scholar] [CrossRef]
- Zhang, X.; Xu, Z.; Yu, X.; Zhao, L.; Zhao, M.; Han, X.; Qi, S. Identification of two novel R2R3-MYB transcription factors, PsMYB114L and PsMYB12L, related to anthocyanin biosynthesis in Paeonia suffruticosa. Int. J. Mol. Sci. 2019, 20, 1055. [Google Scholar] [CrossRef]
- Luan, Y.; Tang, Y.; Wang, X.; Xu, C.; Tao, J.; Zhao, D. Tree Peony R2R3-MYB transcription factor PsMYB30 promotes petal blotch formation by activating the transcription of the anthocyanin synthase gene. Plant Cell Physiol. 2022, 63, 1101–1116. [Google Scholar] [CrossRef]
- Yuan, Y.; Li, X.; Yao, X.; Fu, X.; Cheng, J.; Shan, H.; Yin, X.; Kong, H. Mechanisms underlying the formation of complex color patterns on Nigella orientalis (Ranunculaceae) petals. New Phytol. 2023, 237, 2450–2466. [Google Scholar] [CrossRef]
- Qi, F.; Liu, Y.; Luo, Y.; Cui, Y.; Lu, C.; Li, H.; Huang, H.; Dai, S. Functional analysis of the ScAG and ScAGL11 MADS-box transcription factors for anthocyanin biosynthesis and bicolour pattern formation in Senecio cruentus ray florets. Hortic. Res. 2022, 9, uhac071. [Google Scholar] [CrossRef]
- Harkness, J. Breeding with Hulthemia persica (Rosa persica). In American Rose Annual; American Rose Society: Shreveport, LA, USA, 1977. [Google Scholar]
- Smulders, M.J.; Arens, P.; Bourke, P.M.; Debener, T.; Linde, M.; De Riek, J.; Leus, L.; Ruttink, T.; Baudino, S.; Saint-Oyant, L.H. In the name of the rose: A roadmap for rose research in the genome era. Hortic. Res. 2019, 6, 65. [Google Scholar] [CrossRef] [PubMed]
- Nabavi, S.M.; Samec, D.; Tomczyk, M.; Milella, L.; Russo, D.; Habtemariam, S.; Suntar, I.; Rastrelli, L.; Daglia, M.; Xiao, J.; et al. Flavonoid biosynthetic pathways in plants: Versatile targets for metabolic engineering. Biotechnol. Adv. 2020, 38, 107316. [Google Scholar] [CrossRef] [PubMed]
- Yamagishi, M.; Toda, S.; Tasaki, K. The novel allele of the LhMYB12 gene is involved in splatter-type spot formation on the flower tepals of Asiatic hybrid lilies (Lilium spp.). New Phytol. 2014, 201, 1009–1020. [Google Scholar] [CrossRef]
- Zhang, J.; Wang, L.; Shu, Q.; Liu, Z.A.; Li, C.; Zhang, J.; Wei, X.; Tian, D. Comparison of anthocyanins in non-blotches and blotches of the petals of Xibei tree peony. Sci. Hortic. 2007, 114, 104–111. [Google Scholar] [CrossRef]
- Zhao, A.; Cui, Z.; Li, T.; Pei, H.; Sheng, Y.; Li, X.; Zhao, Y.; Zhou, Y.; Huang, W.; Song, X. mRNA and miRNA expression analysis reveal the regulation for flower spot patterning in Phalaenopsis ‘Panda’. Int. J. Mol. Sci. 2019, 20, 4250. [Google Scholar] [CrossRef]
- Liu, Y.; Lv, J.; Liu, Z.; Wang, J.; Yang, B.; Chen, W.; Ou, L.; Dai, X.; Zhang, Z.; Zou, X. Integrative analysis of metabolome and transcriptome reveals the mechanism of color formation in pepper fruit (Capsicum annuum L.). Food Chem. 2020, 306, 125629. [Google Scholar] [CrossRef] [PubMed]
- Zhu, J.; Wang, Y.; Wang, Q.; Li, B.; Wang, X.; Zhou, X.; Zhang, H.; Xu, W.; Li, S.; Wang, L. The combination of DNA methylation and positive regulation of anthocyanin biosynthesis by MYB and bHLH transcription factors contributes to the petal blotch formation in Xibei tree peony. Hortic. Res. 2023, 10, uhad100. [Google Scholar] [CrossRef] [PubMed]
- Wang, Y.; Guo, L.; Zhao, Y.; Zhao, X.; Yuan, Z. Systematic analysis and expression profiles of the 4-Coumarate: CoA Ligase (4CL) gene family in pomegranate (Punica granatum L.). Int. J. Mol. Sci. 2022, 23, 3509. [Google Scholar] [CrossRef]
- Fu, M.; Yang, X.; Zheng, J.; Wang, L.; Yang, X.; Tu, Y.; Ye, J.; Zhang, W.; Liao, Y.; Cheng, S.; et al. Unraveling the regulatory mechanism of color diversity in Camellia japonica petals by integrative transcriptome and metabolome analysis. Front. Plant Sci. 2021, 12, 685136. [Google Scholar] [CrossRef] [PubMed]
- Maritim, T.K.; Masand, M.; Seth, R.; Sharma, R.K. Transcriptional analysis reveals key insights into seasonal induced anthocyanin degradation and leaf color transition in purple tea (Camellia sinensis (L.) O. Kuntze). Sci. Rep. 2021, 11, 1244. [Google Scholar] [CrossRef] [PubMed]
- Zhang, Y.; Cheng, Y.; Ya, H.; Xu, S.; Han, J. Transcriptome sequencing of purple petal spot region in tree peony reveals differentially expressed anthocyanin structural genes. Front. Plant Sci. 2015, 6, 964. [Google Scholar] [CrossRef]
- Li, Y.; Kong, F.; Liu, Z.A.; Peng, L.; Shu, Q. PhUGT78A22, a novel glycosyltransferase in Paeonia ‘He Xie’, can catalyze the transfer of glucose to glucosylated anthocyanins during petal blotch formation. BMC Plant Biol. 2022, 22, 405. [Google Scholar] [CrossRef] [PubMed]
- Shi, Q.; Yuan, M.; Wang, S.; Luo, X.; Luo, S.; Fu, Y.; Li, X.; Zhang, Y.; Li, L. PrMYB5 activates anthocyanin biosynthetic PrDFR to promote the distinct pigmentation pattern in the petal of Paeonia rockii. Front. Plant Sci. 2022, 13, 955590. [Google Scholar] [CrossRef] [PubMed]
- Chen, L.; Hu, B.; Qin, Y.; Hu, G.; Zhao, J. Advance of the negative regulation of anthocyanin biosynthesis by MYB transcription factors. Plant Physiol. Biochem. 2019, 136, 178–187. [Google Scholar] [CrossRef]
- Li, Y.; Shan, X.; Gao, R.; Han, T.; Zhang, J.; Wang, Y.; Kimani, S.; Wang, L.; Gao, X. MYB repressors and MBW activation complex collaborate to fine-tune flower coloration in Freesia hybrida. Commun. Biol. 2020, 3, 396. [Google Scholar] [CrossRef] [PubMed]
- Zhang, L.; Wang, Y.; Yue, M.; Jiang, L.; Zhang, N.; Luo, Y.; Chen, Q.; Zhang, Y.; Wang, Y.; Li, M.; et al. FaMYB5 Interacts with FaBBX24 to regulate anthocyanin and proanthocyanidin biosynthesis in strawberry (Fragaria × ananassa). Int. J. Mol. Sci. 2023, 24, 12185. [Google Scholar] [CrossRef] [PubMed]
- Ma, S.; Zhou, H.; Ren, T.; Yu, E.R.; Feng, B.; Wang, J.Y.; Zhang, C.S.; Zhou, C.; Li, Y.Q. Integrated transcriptome and metabolome analysis revealed that HaMYB1 modulates anthocyanin accumulation to deepen sunflower flower color. Plant Cell Rep. 2024, 43, 74. [Google Scholar] [CrossRef] [PubMed]
- He, G.; Zhang, R.; Jiang, S.; Wang, H.; Ming, F. The MYB transcription factor RcMYB1 plays a central role in rose anthocyanin biosynthesis. Hortic. Res. 2023, 10, uhad080. [Google Scholar] [CrossRef] [PubMed]
- Yan, Y.; Zhao, J.; Lin, S.; Li, M.; Liu, J.; Raymond, O.; Vergne, P.; Kong, W.; Wu, Q.; Zhang, X.; et al. Light-mediated anthocyanin biosynthesis in rose petals involves a balanced regulatory module comprising transcription factors RhHY5, RhMYB114a, and RhMYB3b. J. Exp. Bot. 2023, 74, 5783–5804. [Google Scholar] [CrossRef] [PubMed]
- Li, M.; Zhang, H.; Yang, Y.; Wang, H.; Xue, Z.; Fan, Y.; Sun, P.; Zhang, H.; Zhang, X.; Jin, W. Rosa1, a transposable element-like insertion, produces red petal coloration in rose through altering RcMYB114 transcription. Front. Plant Sci. 2022, 13, 857684. [Google Scholar] [CrossRef]
- Naik, J.; Misra, P.; Trivedi, P.K.; Pandey, A. Molecular components associated with the regulation of flavonoid biosynthesis. Plant Sci. 2022, 317, 111196. [Google Scholar] [CrossRef]
- Hsu, H.F.; Chen, W.H.; Shen, Y.H.; Hsu, W.H.; Mao, W.T.; Yang, C.H. Multifunctional evolution of B and AGL6 MADS box genes in orchids. Nat. Commun. 2021, 12, 902. [Google Scholar] [CrossRef] [PubMed]
- Albert, N.W.; Lewis, D.H.; Zhang, H.; Schwinn, K.E.; Jameson, P.E.; Davies, K.M. Members of an R2R3-MYB transcription factor family in Petunia are developmentally and environmentally regulated to control complex floral and vegetative pigmentation patterning. Plant J. 2011, 65, 771–784. [Google Scholar] [CrossRef] [PubMed]
- Wang, D.R.; Yang, K.; Wang, X.; Lin, X.L.; Rui, L.; Liu, H.F.; Liu, D.D.; You, C.X. Overexpression of MdZAT5, an C2H2-type zinc finger protein, regulates anthocyanin accumulation and salt stress response in apple calli and Arabidopsis. Int. J. Mol. Sci. 2022, 23, 1897. [Google Scholar] [CrossRef] [PubMed]
- Chen, W.; Gong, L.; Guo, Z.; Wang, W.; Zhang, H.; Liu, X.; Yu, S.; Xiong, L.; Luo, J. A novel integrated method for large-scale detection, identification, and quantification of widely targeted metabolites: Application in the study of rice metabolomics. Mol. Plant 2013, 6, 1769–1780. [Google Scholar] [CrossRef] [PubMed]
- Kim, D.; Langmead, B.; Salzberg, S.L. HISAT: A fast spliced aligner with low memory requirements. Nat. Methods 2015, 12, 357–360. [Google Scholar] [CrossRef]
- Li, B.; Dewey, C.N. RSEM: Accurate transcript quantification from RNA-Seq data with or without a reference genome. BMC Bioinform. 2011, 12, 323. [Google Scholar] [CrossRef] [PubMed]
- Love, M.I.; Huber, W.; Anders, S. Moderated estimation of fold change and dispersion for RNA-seq data with DESeq2. Genome Biol. 2014, 15, 550. [Google Scholar] [CrossRef]
- Livak, K.J.; Schmittgen, T.D. Analysis of relative gene expression data using real-time quantitative PCR and the 2−ΔΔCT method. Methods 2001, 25, 402–408. [Google Scholar] [CrossRef]


Disclaimer/Publisher’s Note: The statements, opinions and data contained in all publications are solely those of the individual author(s) and contributor(s) and not of MDPI and/or the editor(s). MDPI and/or the editor(s) disclaim responsibility for any injury to people or property resulting from any ideas, methods, instructions or products referred to in the content. |
© 2024 by the authors. Licensee MDPI, Basel, Switzerland. This article is an open access article distributed under the terms and conditions of the Creative Commons Attribution (CC BY) license (https://creativecommons.org/licenses/by/4.0/).
Share and Cite
Wang, H.; Kong, Y.; Dou, X.; Yang, Y.; Chi, X.; Lang, L.; Zhang, Q.; Pan, H.; Bai, J. Integrative Metabolomic and Transcriptomic Analyses Reveal the Mechanism of Petal Blotch Formation in Rosa persica. Int. J. Mol. Sci. 2024, 25, 4030. https://doi.org/10.3390/ijms25074030
Wang H, Kong Y, Dou X, Yang Y, Chi X, Lang L, Zhang Q, Pan H, Bai J. Integrative Metabolomic and Transcriptomic Analyses Reveal the Mechanism of Petal Blotch Formation in Rosa persica. International Journal of Molecular Sciences. 2024; 25(7):4030. https://doi.org/10.3390/ijms25074030
Chicago/Turabian StyleWang, Huan, Ying Kong, Xiaoying Dou, Yi Yang, Xiufeng Chi, Lixin Lang, Qixiang Zhang, Huitang Pan, and Jinrong Bai. 2024. "Integrative Metabolomic and Transcriptomic Analyses Reveal the Mechanism of Petal Blotch Formation in Rosa persica" International Journal of Molecular Sciences 25, no. 7: 4030. https://doi.org/10.3390/ijms25074030
APA StyleWang, H., Kong, Y., Dou, X., Yang, Y., Chi, X., Lang, L., Zhang, Q., Pan, H., & Bai, J. (2024). Integrative Metabolomic and Transcriptomic Analyses Reveal the Mechanism of Petal Blotch Formation in Rosa persica. International Journal of Molecular Sciences, 25(7), 4030. https://doi.org/10.3390/ijms25074030