
Plant-Assisted Green Synthesis of MgO Nanoparticles as a Sustainable Material for Bone Regeneration: Spectroscopic Properties
 , ,
, ,
Abstract
:1. Introduction
2. Results and Discussion
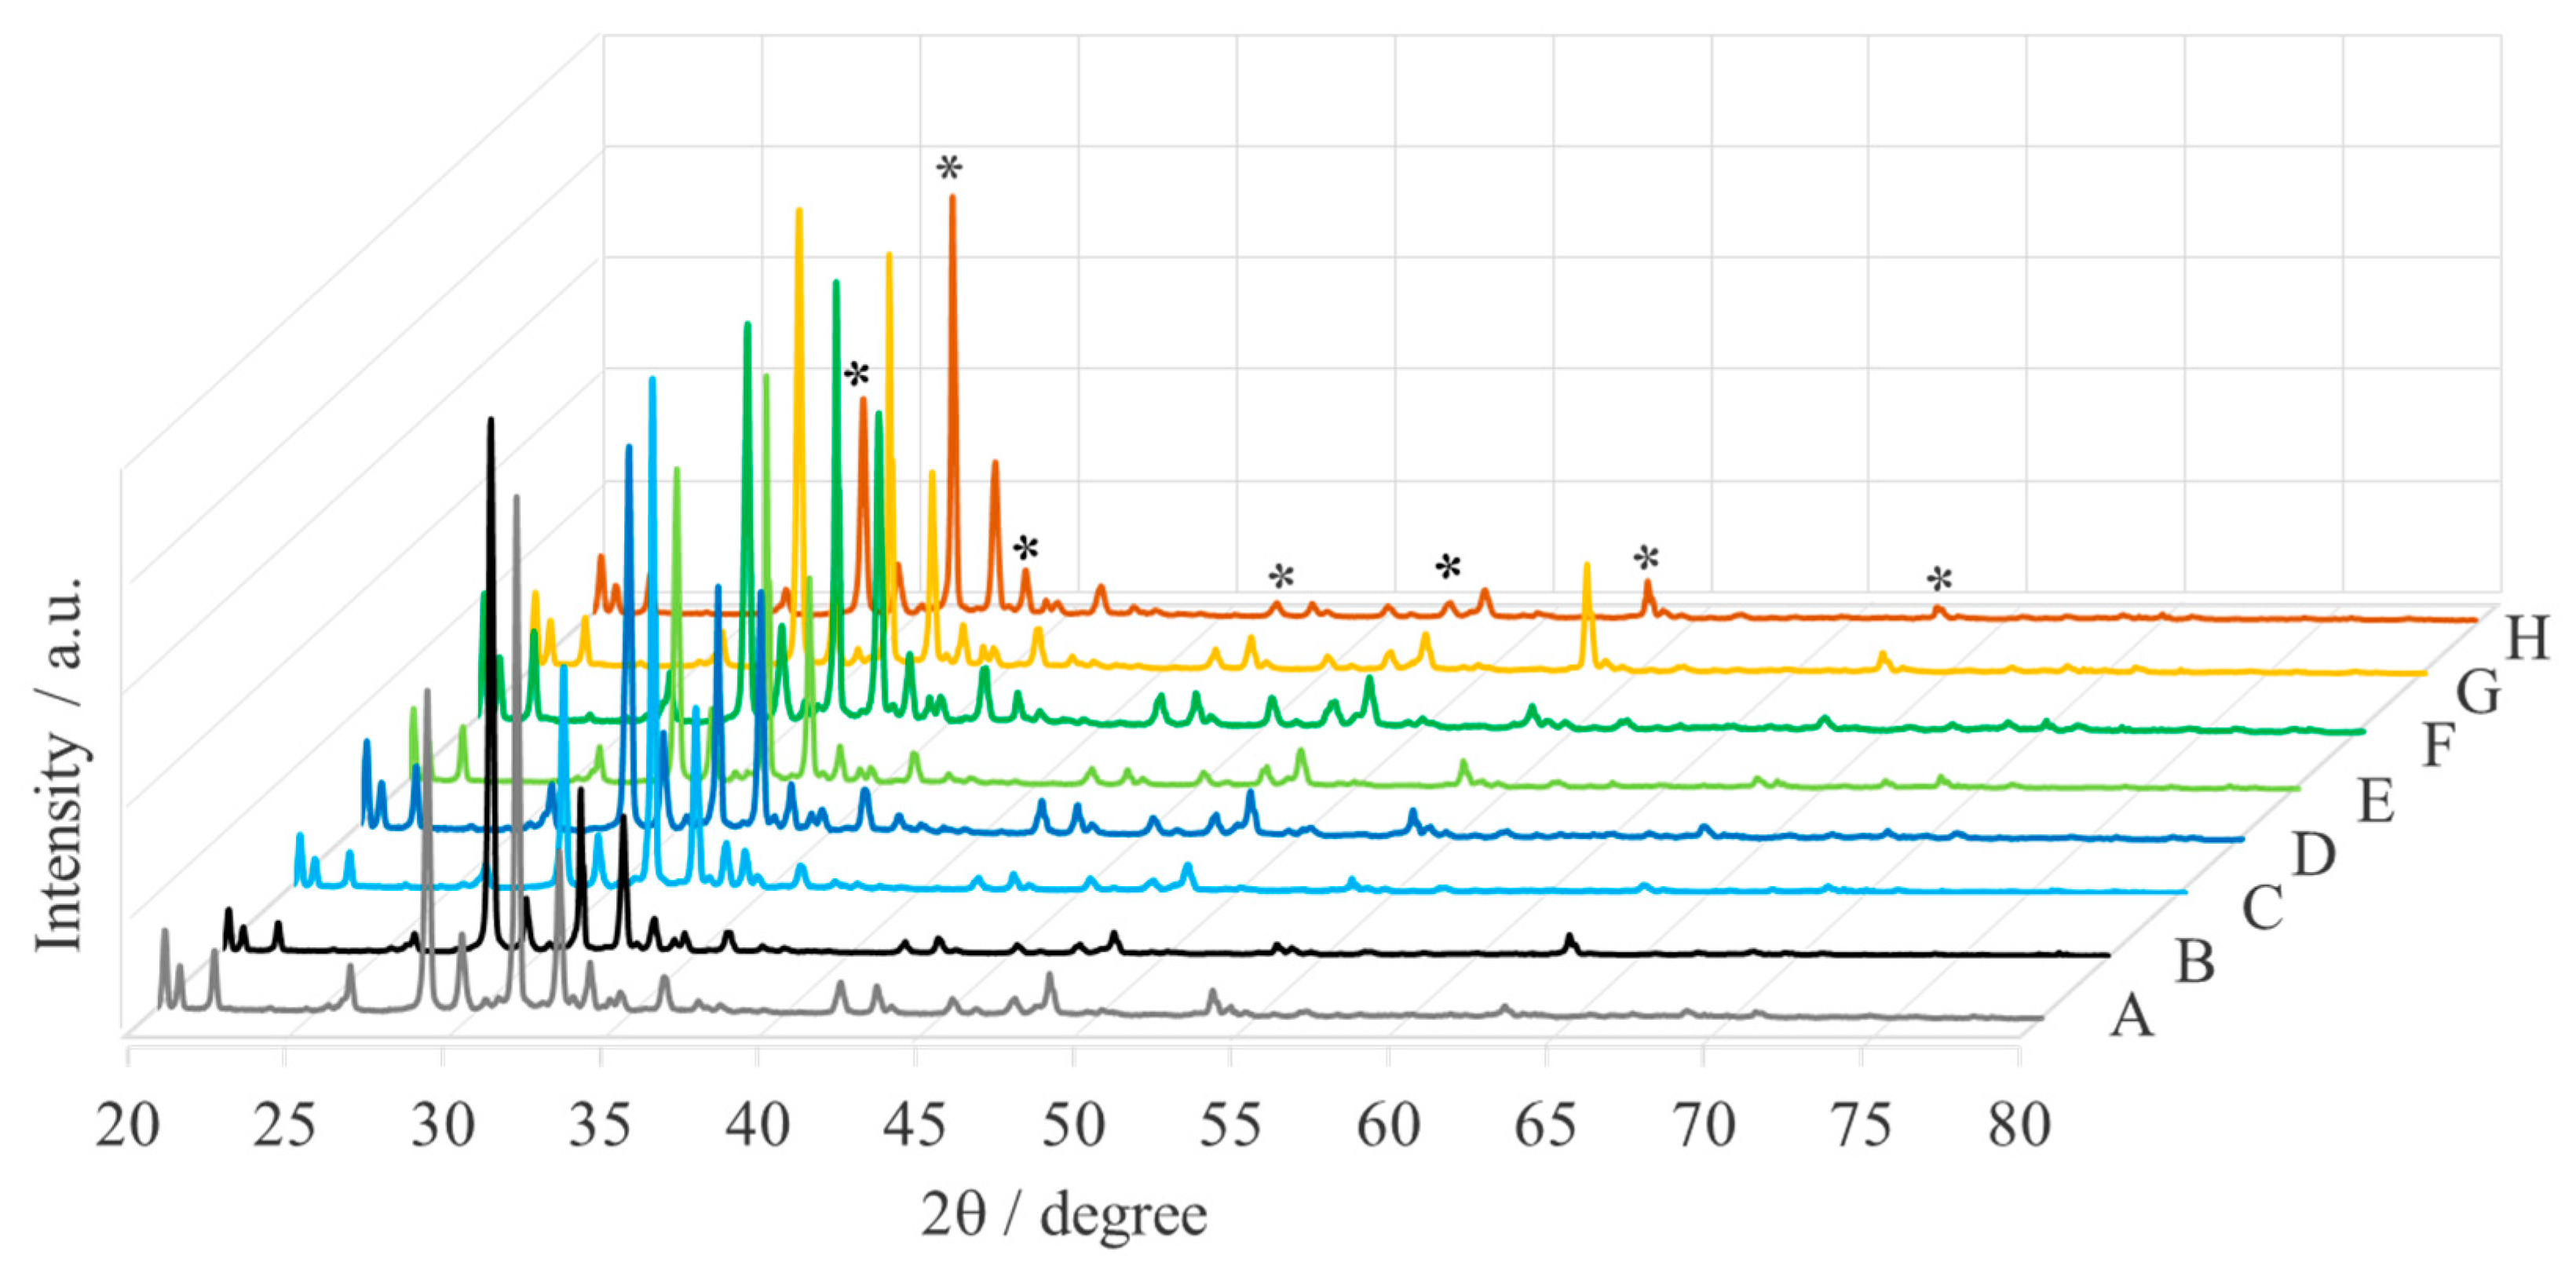
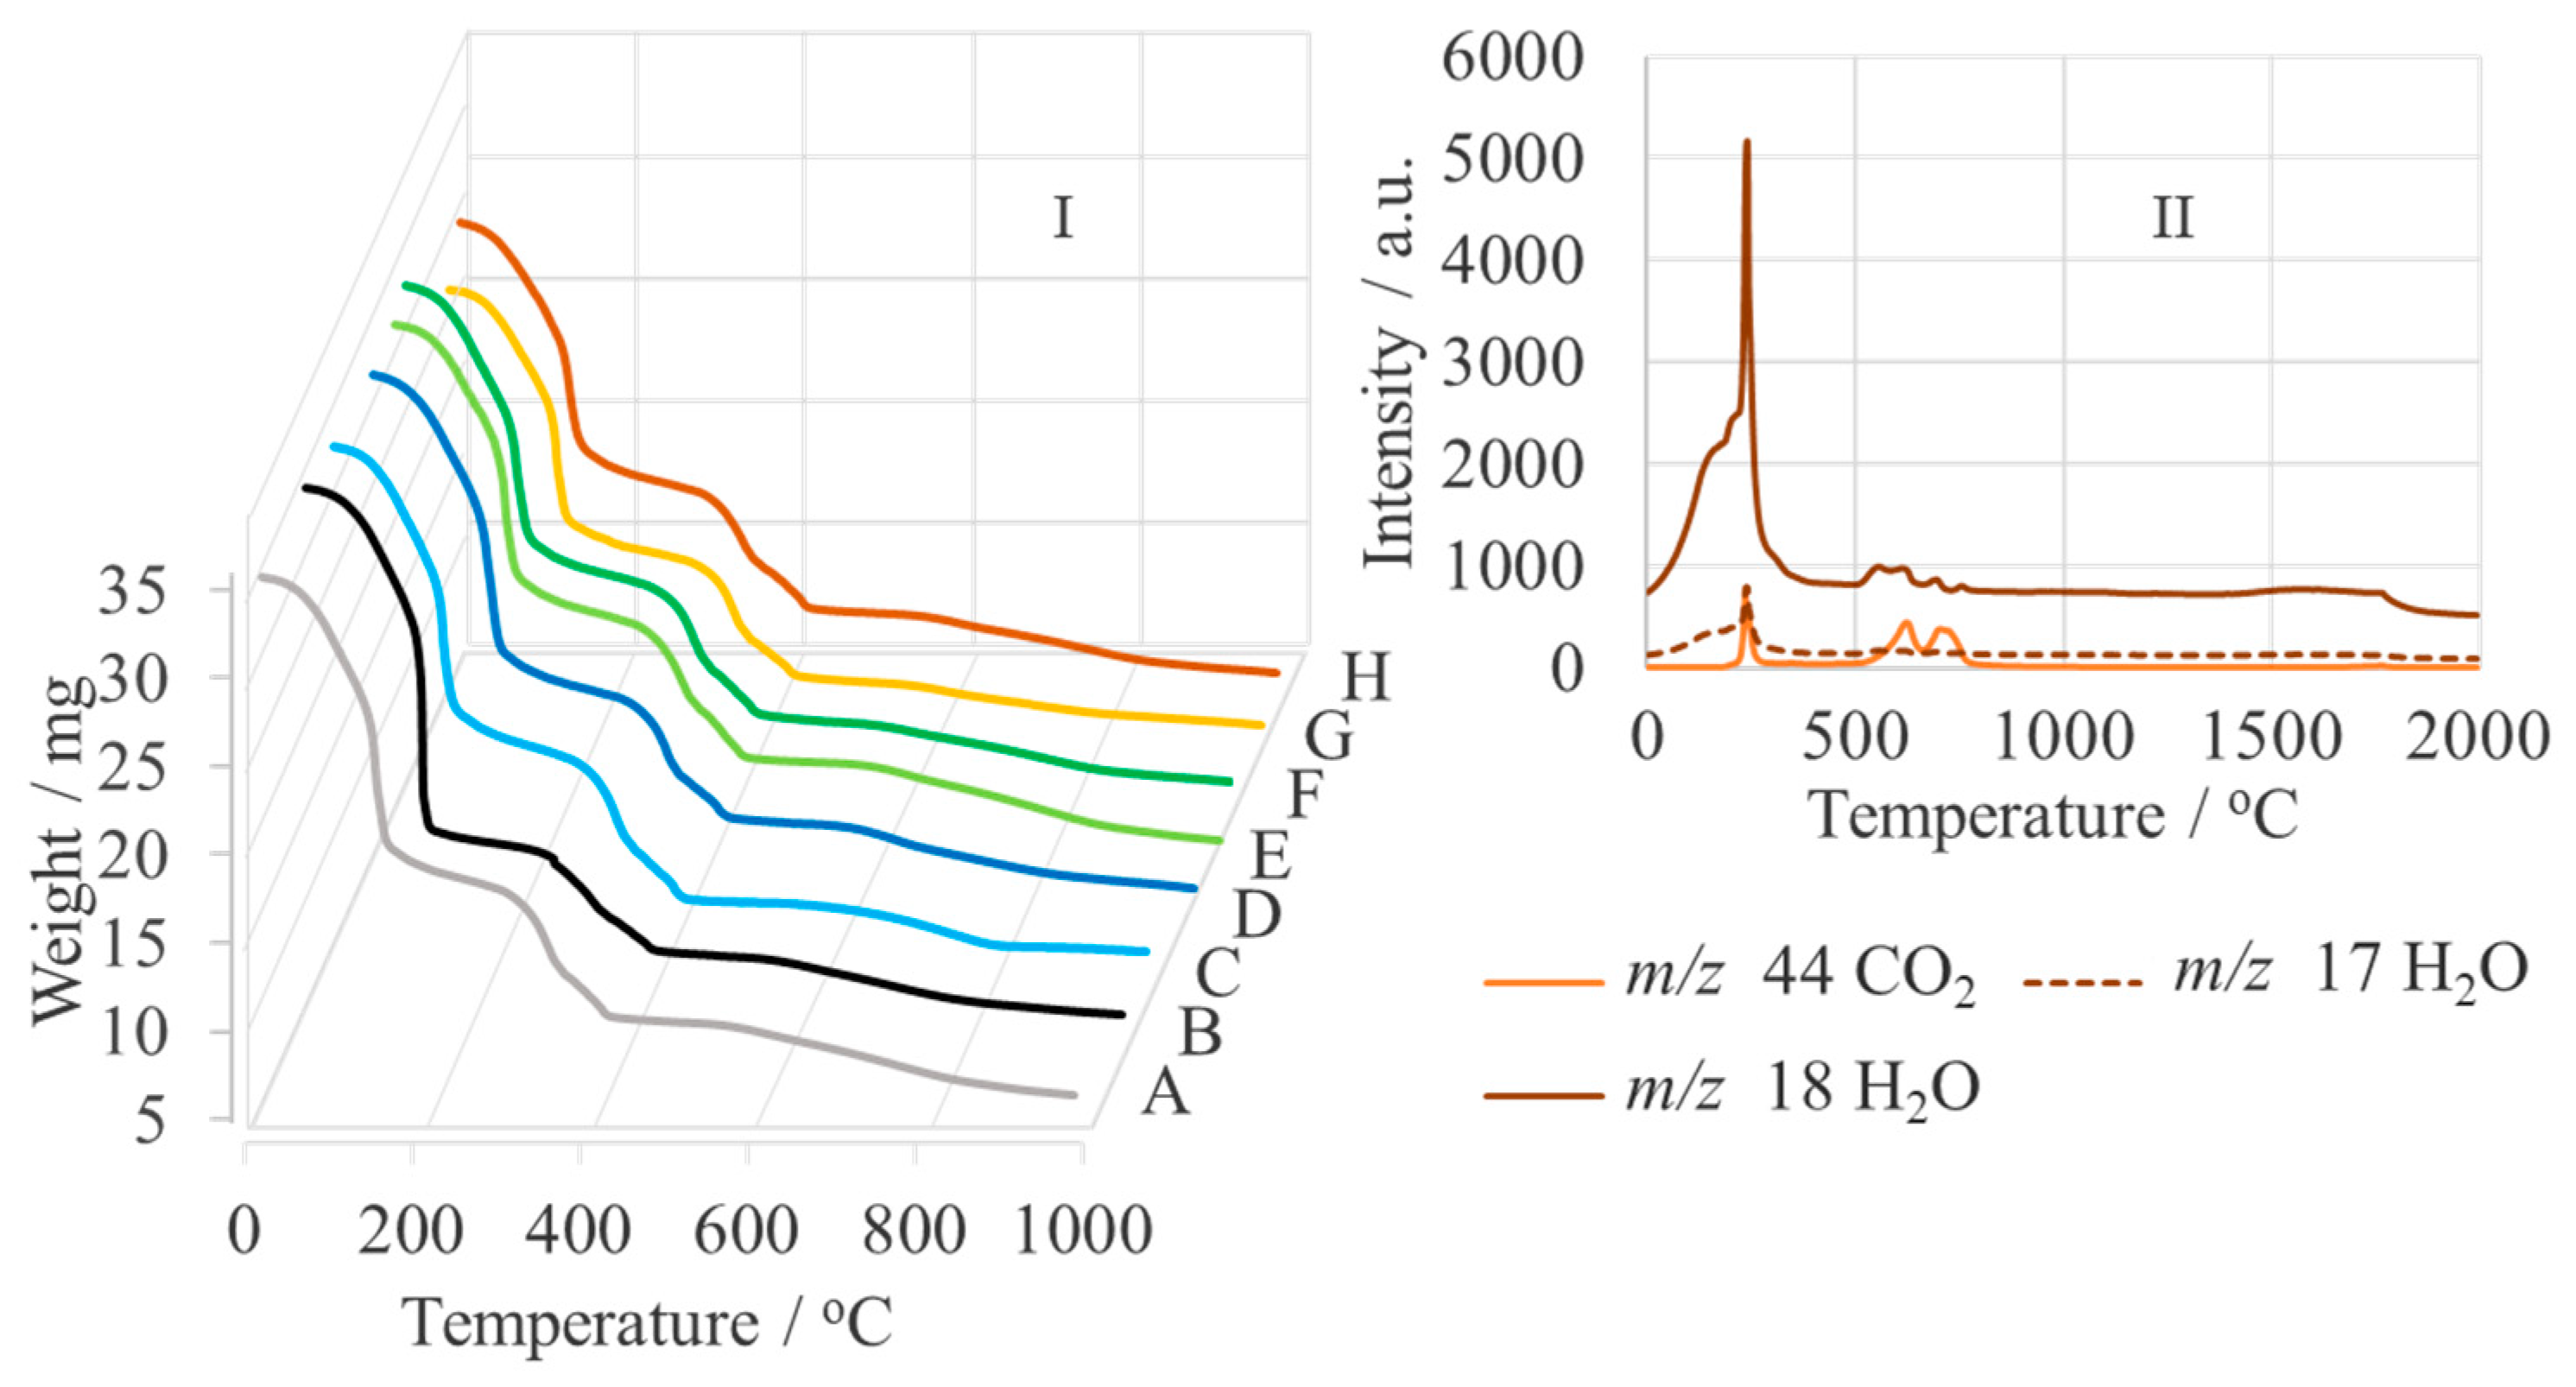
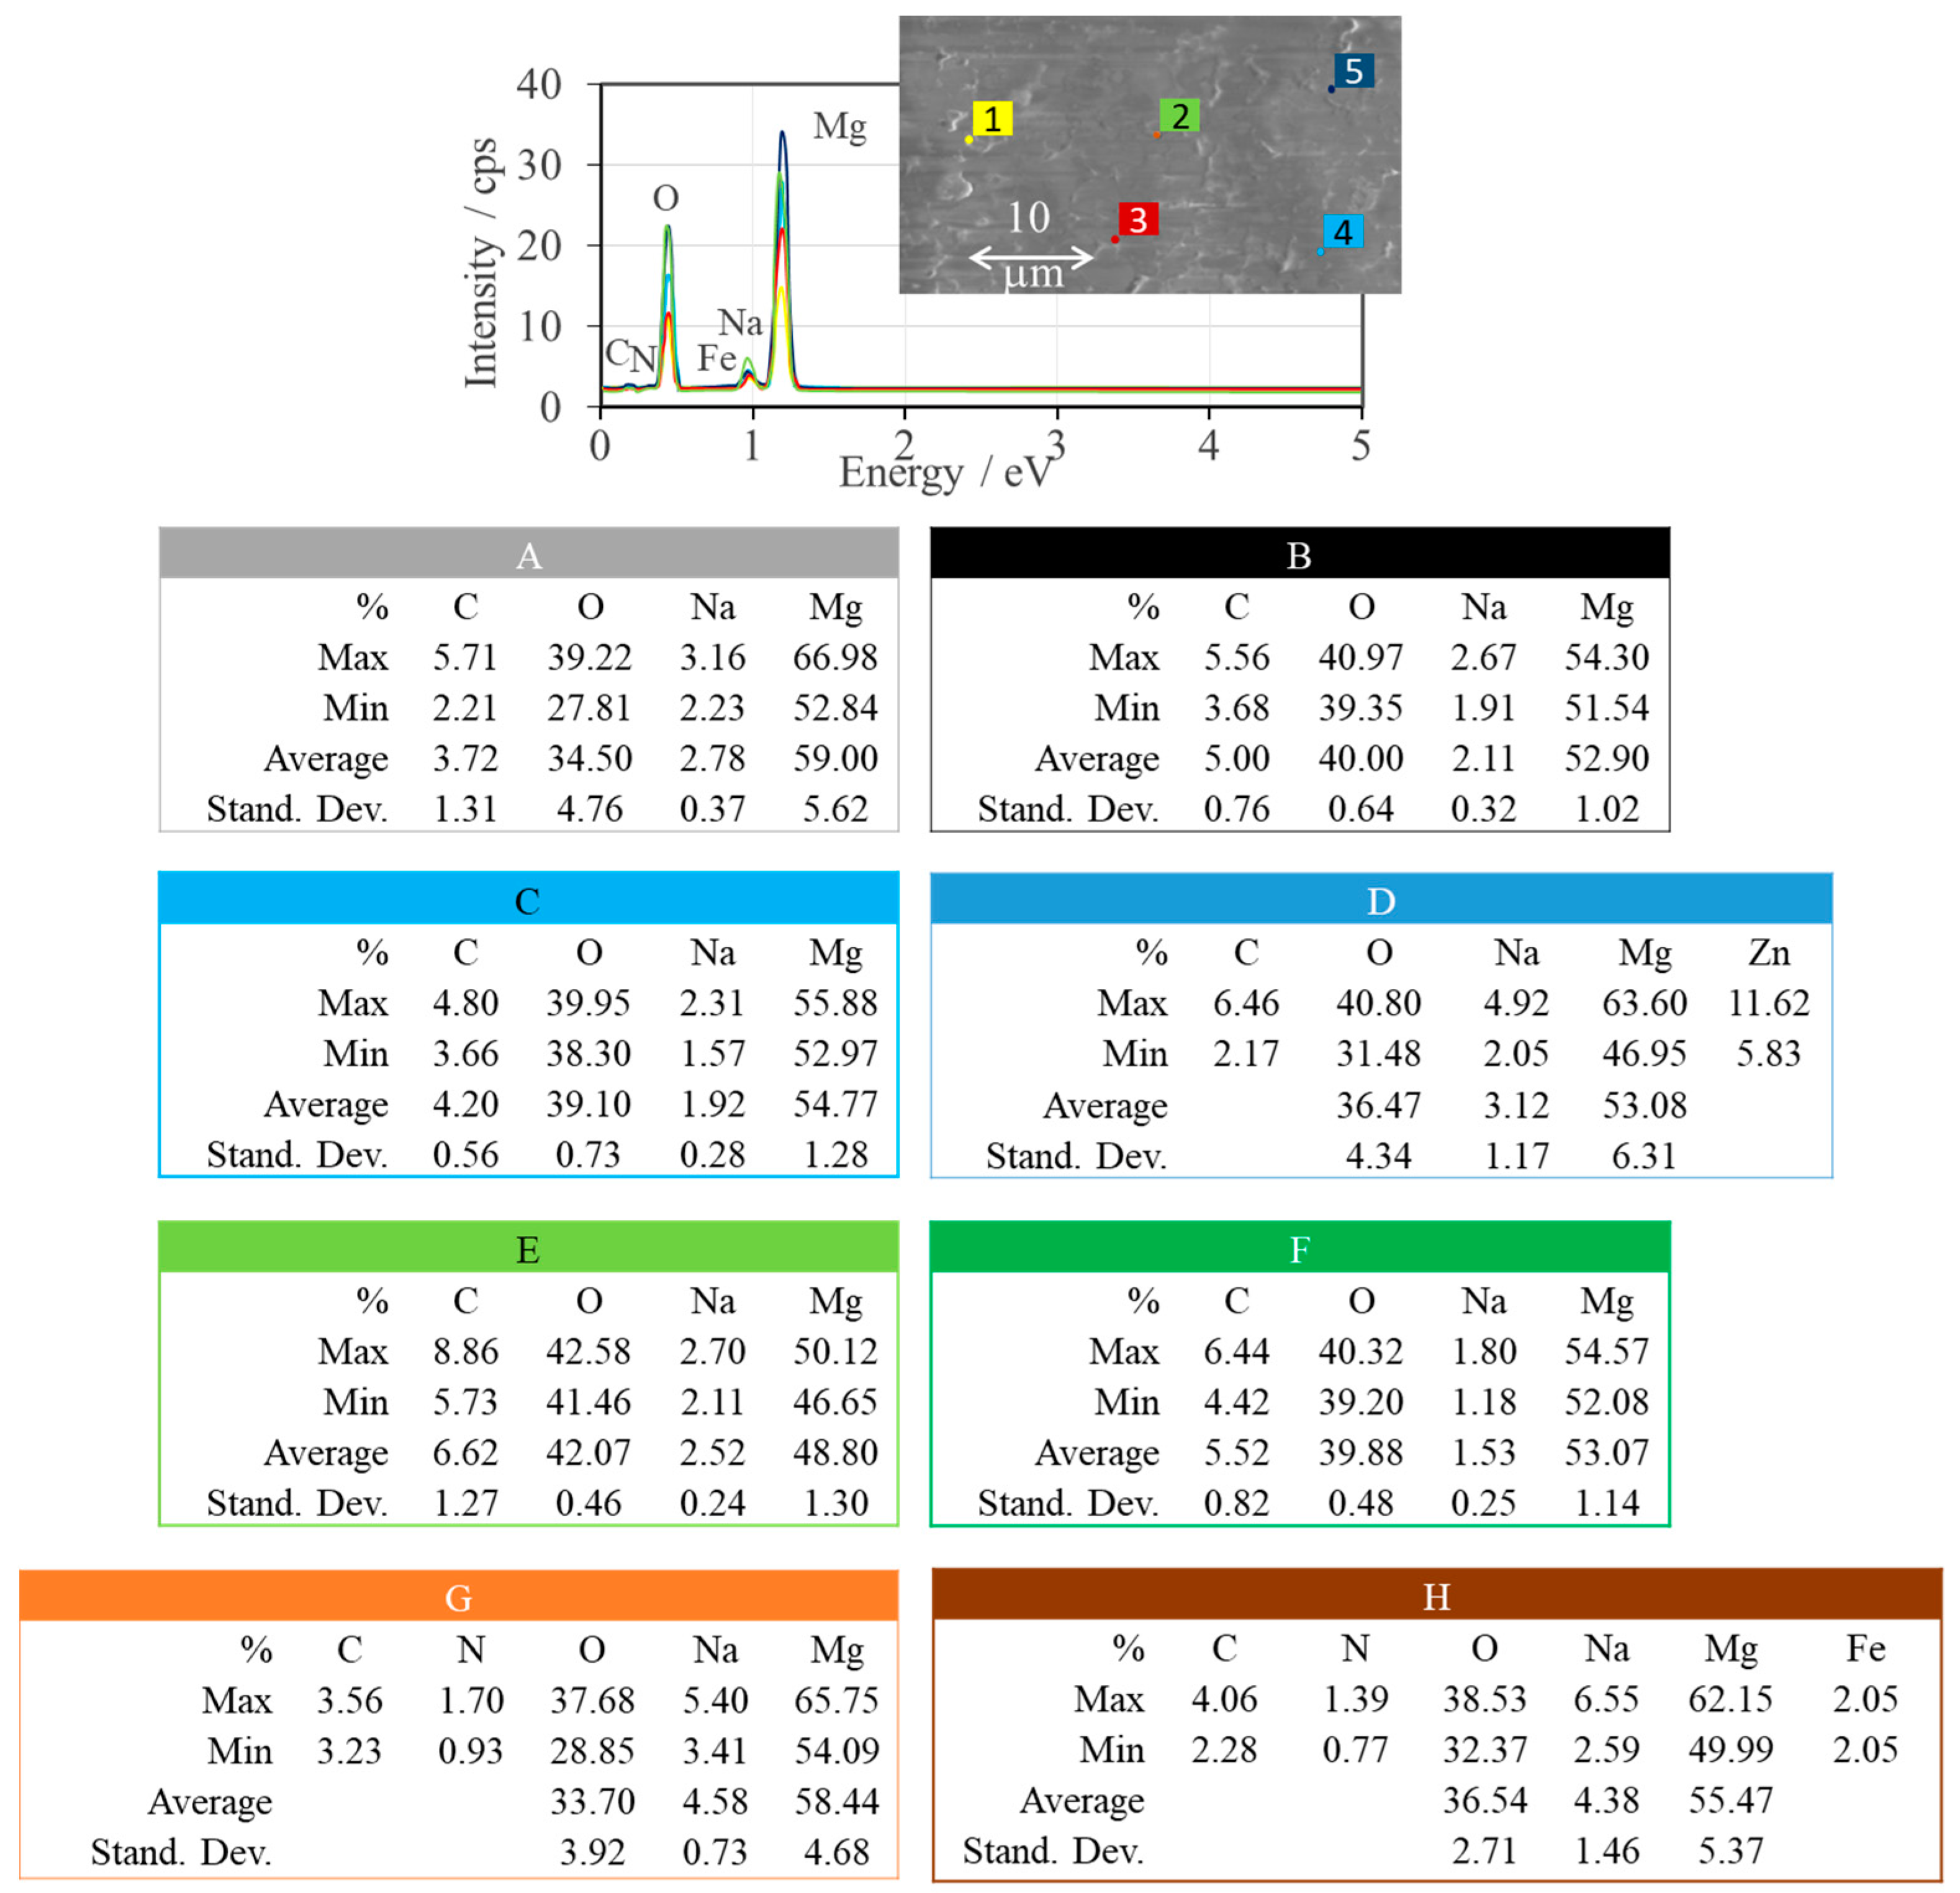
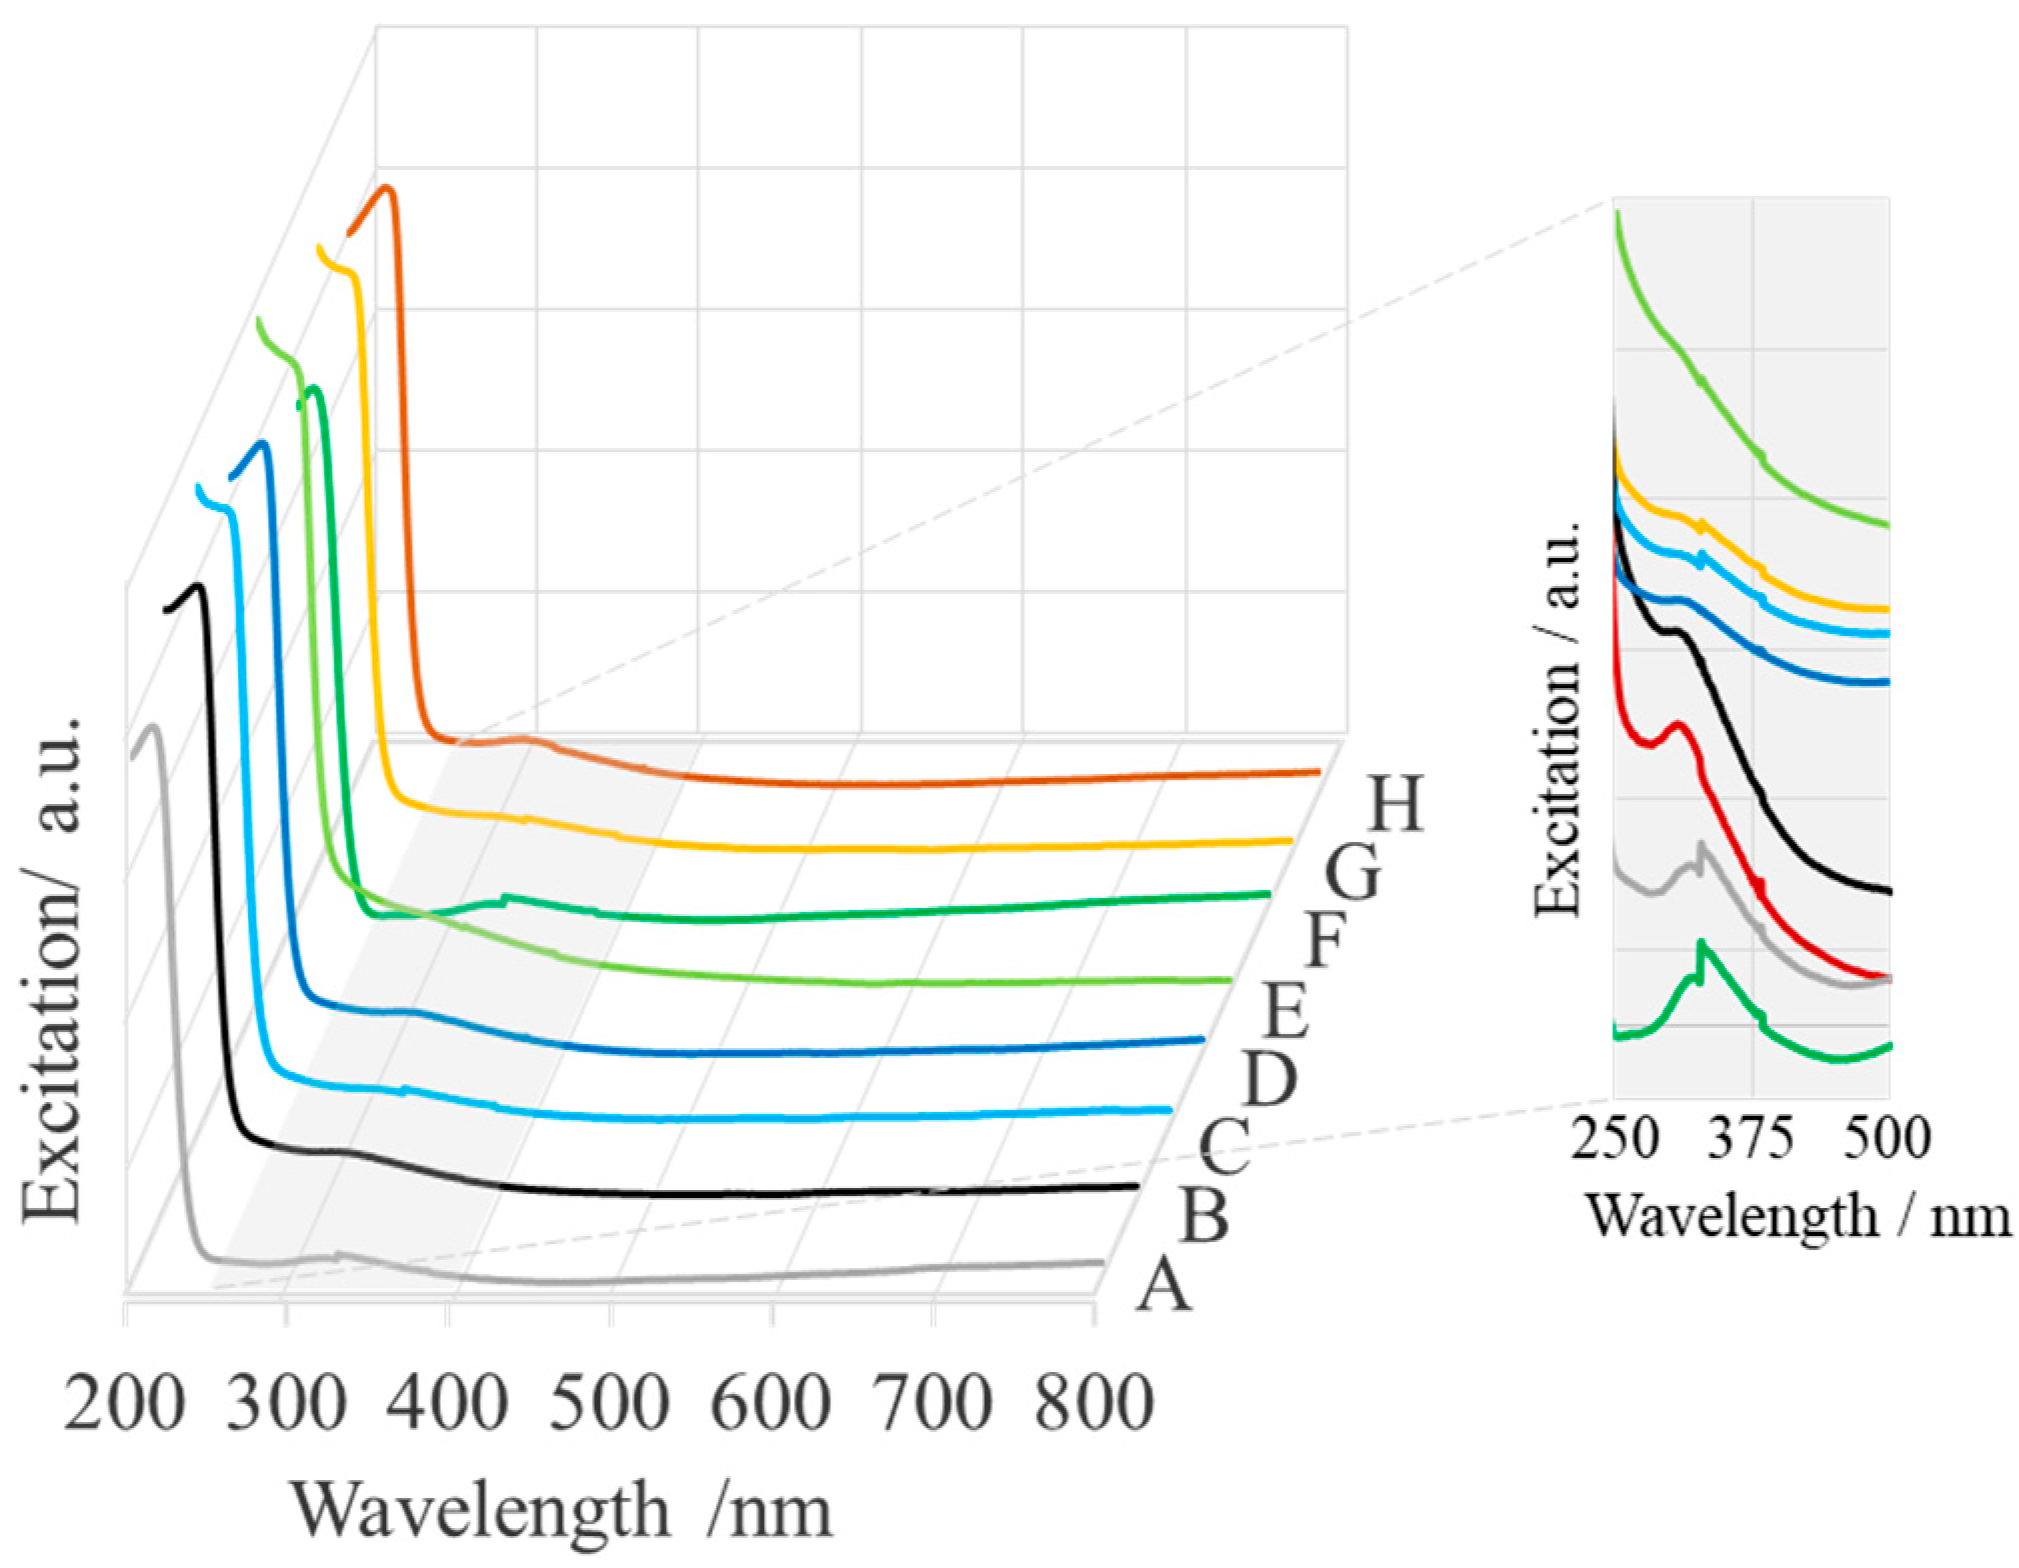
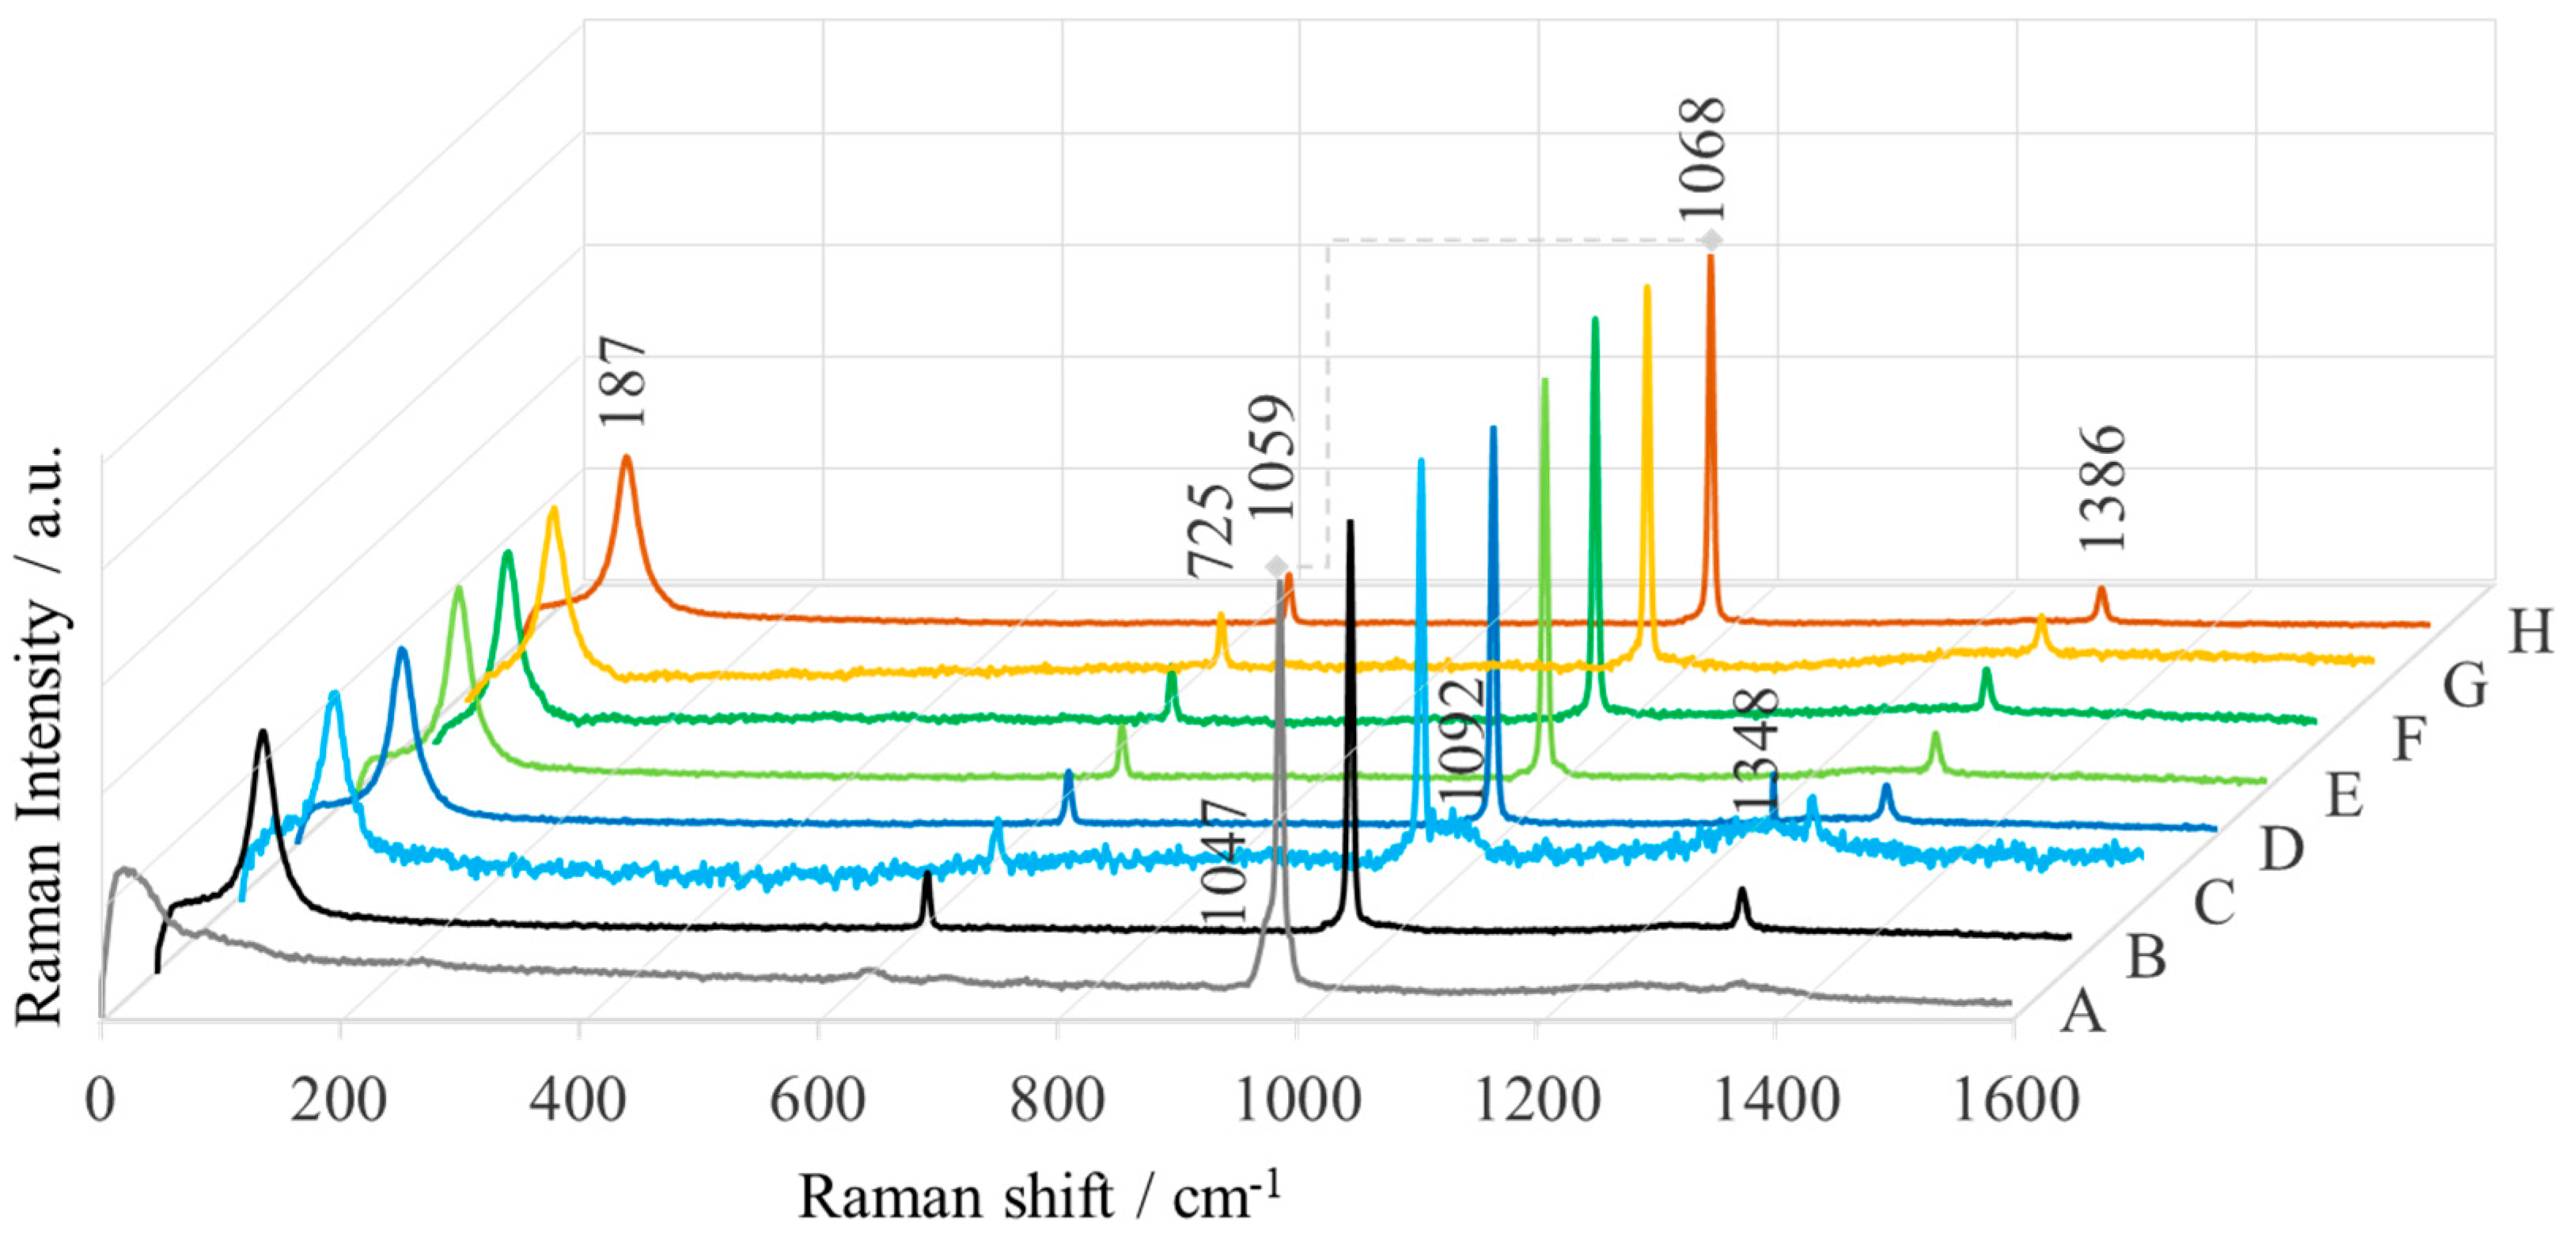
2.1. Spectroscopic Characterization
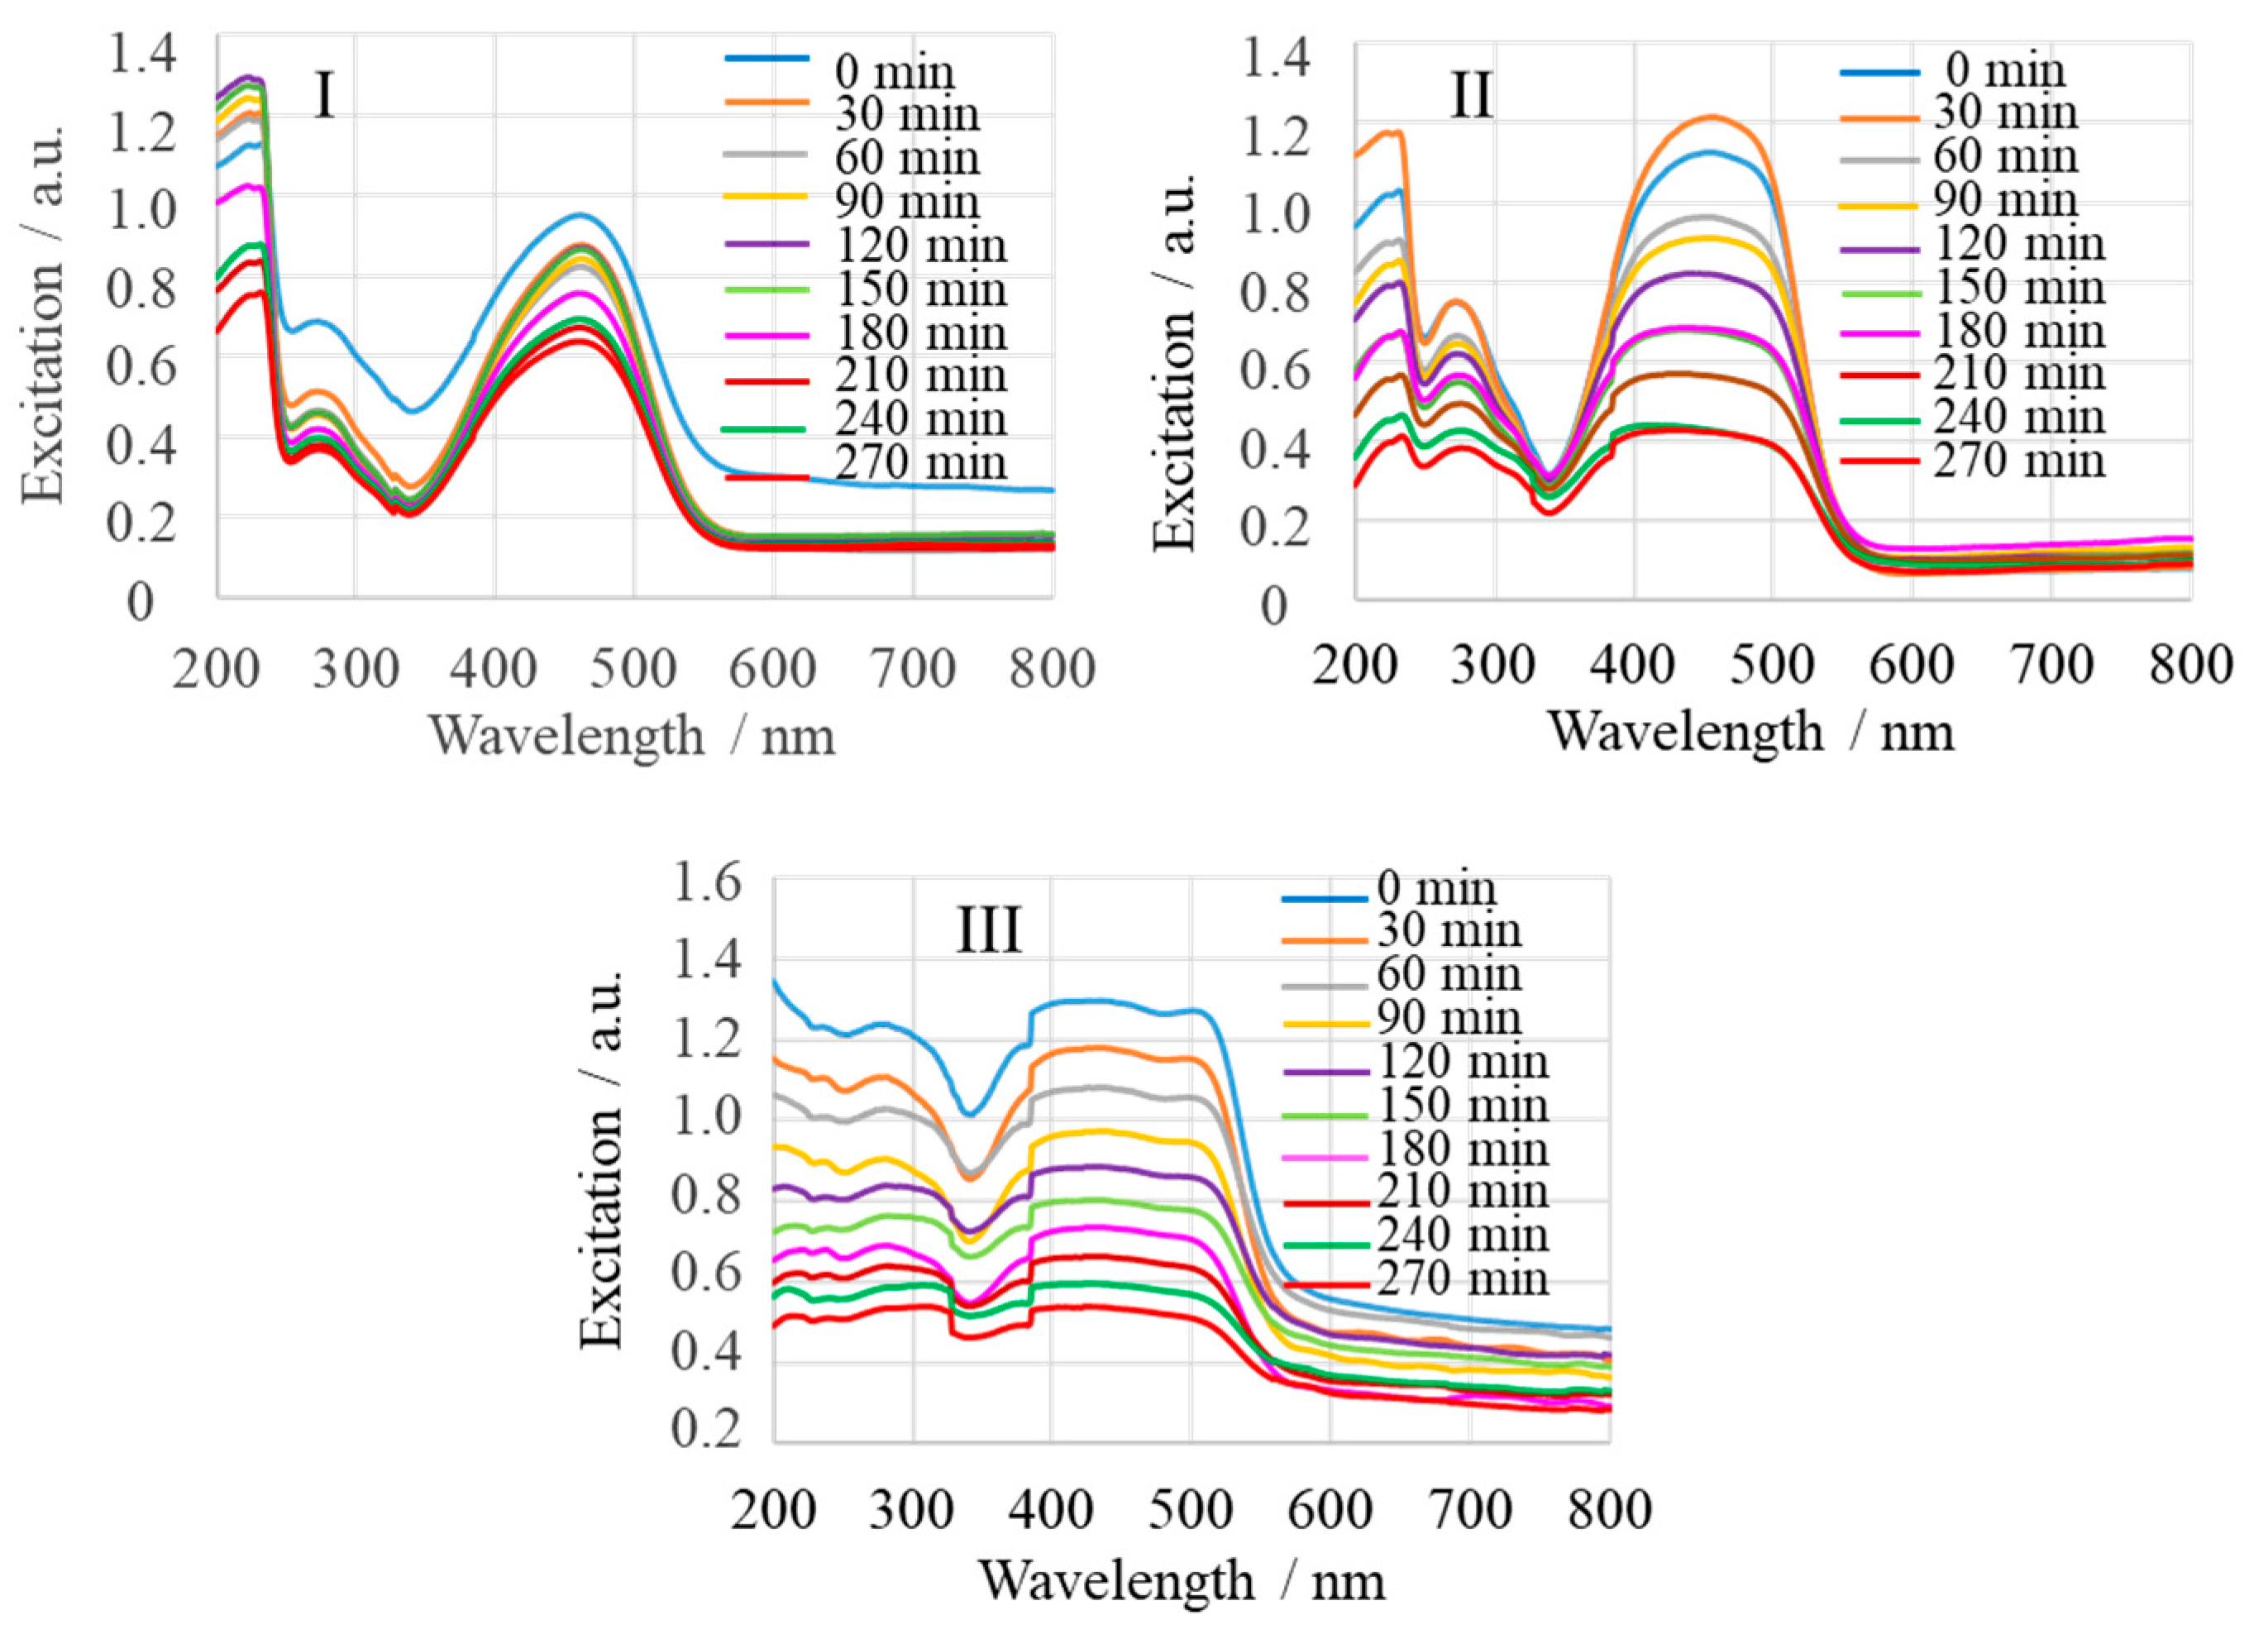
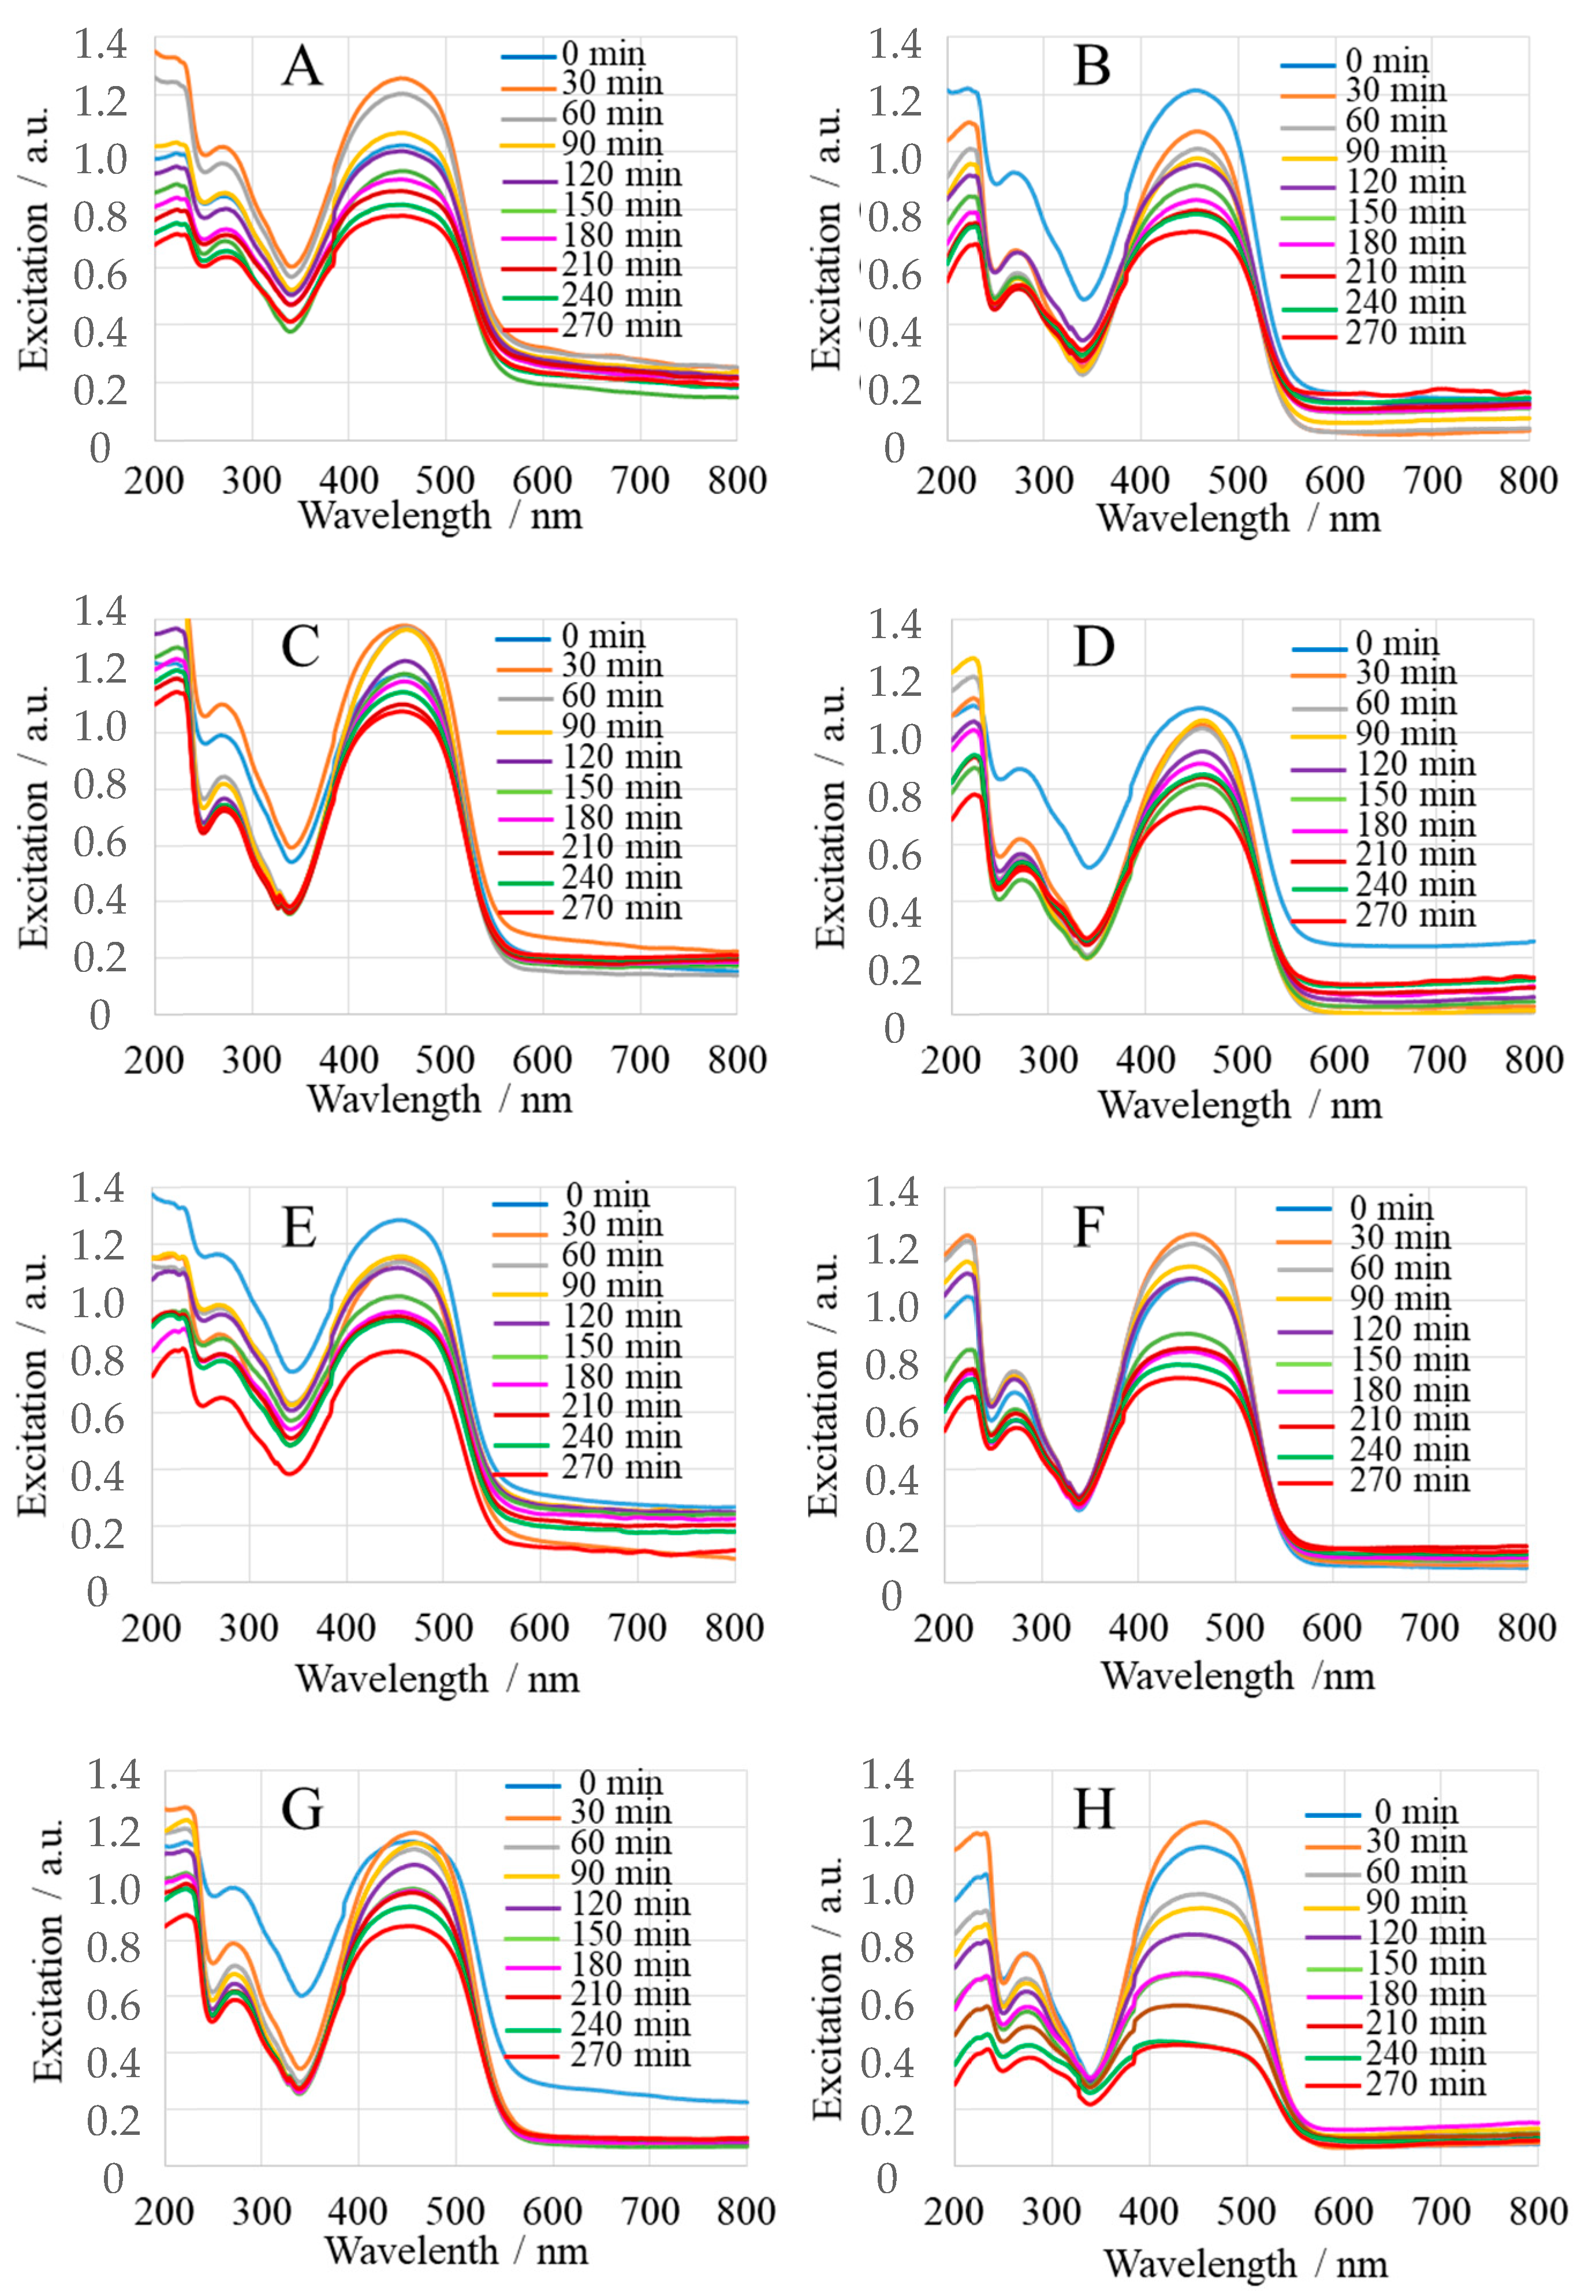
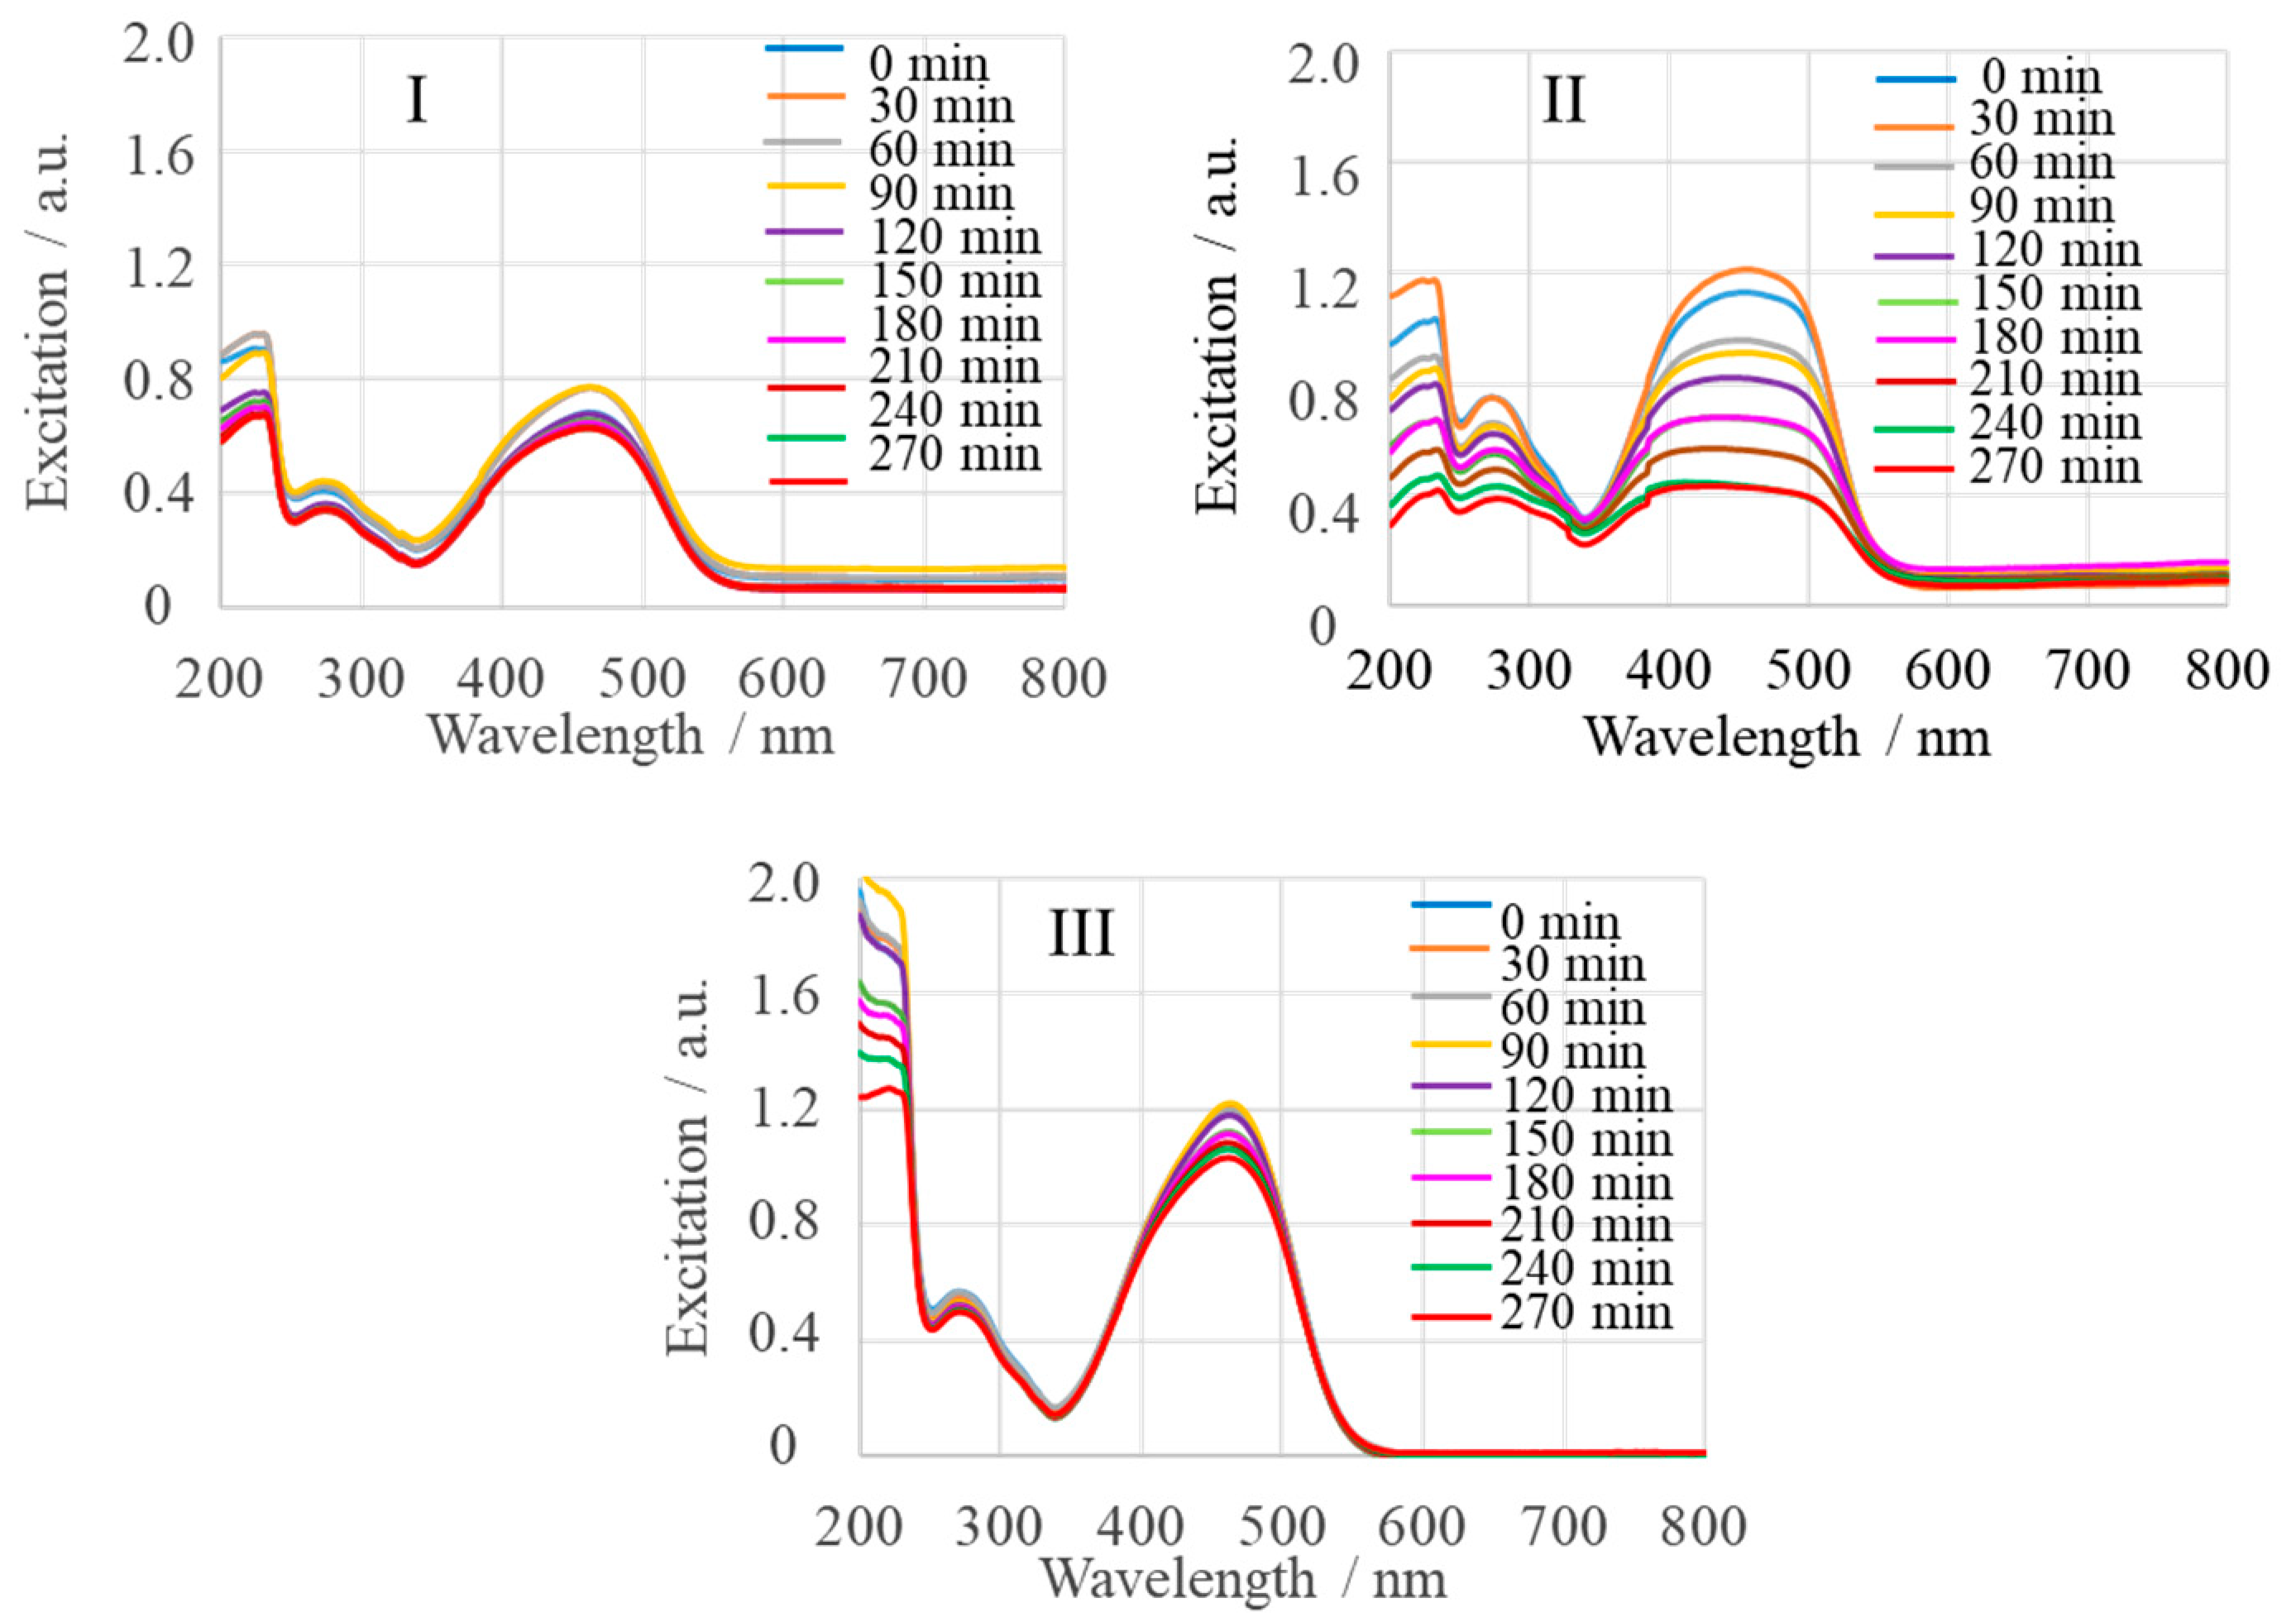
2.2. Photocatalytic Activity
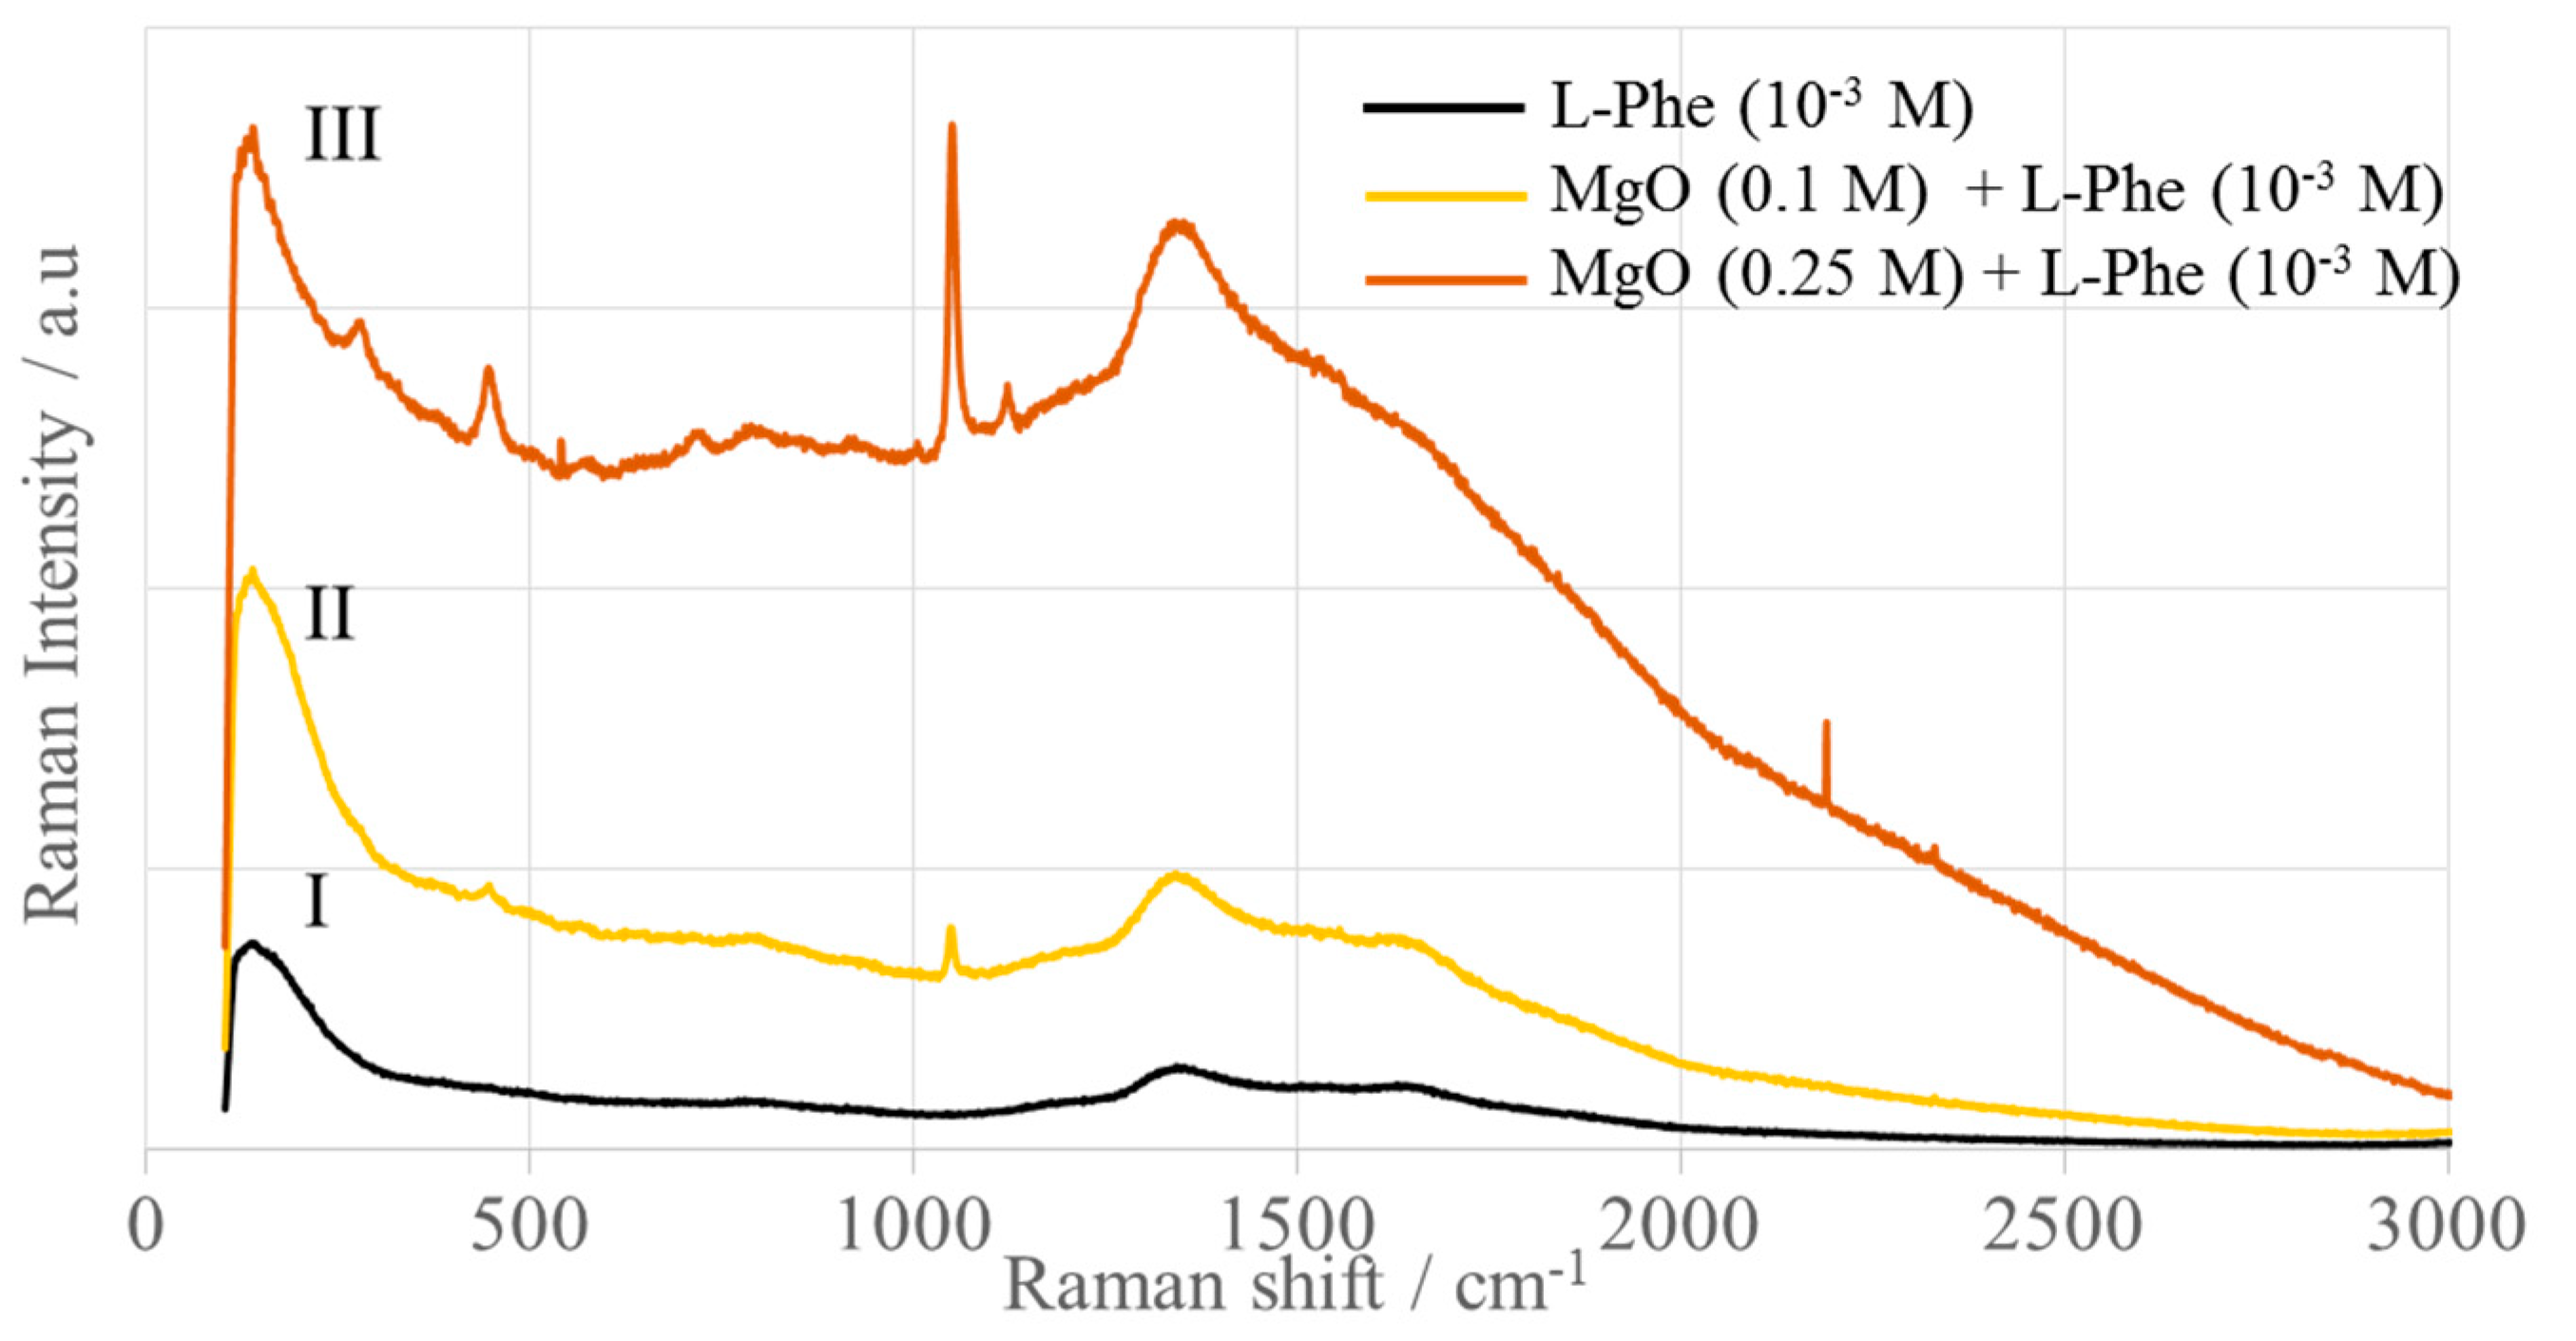
2.3. Adsorption Monitored by SERS
3. Materials and Methods
3.1. Materials
3.2. MgO Nanoparticle Synthesis
3.3. Structure Characterization of MgO Nanoparticles
3.4. Photoactivity of MgO Nanoparticles
3.5. Raman and Surface-Enhanced Raman Scattering (SERS) Measurements
3.6. Spectral Analysis
4. Conclusions
Author Contributions
Funding
Institutional Review Board Statement
Informed Consent Statement
Data Availability Statement
Acknowledgments
Conflicts of Interest
References
- Hornak, J. Synthesis, Properties, and Selected Technical Applications of Magnesium Oxide Nanoparticles: A Review. Int. J. Mol. Sci. 2021, 22, 12752. [Google Scholar] [CrossRef] [PubMed]
- Aabinaya, S.; Kavitha, H.P.; Prakash, M.; Muthukrishnaraj, A. Green synthesis of magnesium oxide nanoparticles and Its applications: A review. Sustain. Chem. Pharm. 2021, 19, 100368. [Google Scholar] [CrossRef]
- Fernandes, M.; RB Singh, K.; Sarkar, T.; Singh, P.; Pratap Singh, R. Recent applications of magnesium oxide (MgO) nanoparticles in various domains. Adv. Mater. Lett. 2020, 11, 1–10. [Google Scholar] [CrossRef]
- Hickey, D.J.; Ercan, B.; Sun, L.; Webster, T.J. Adding MgO nanoparticles to hydroxyapatite–PLLA nanocomposites for improved bone tissue engineering applications. Acta Biomater. 2015, 14, 175–184. [Google Scholar] [CrossRef]
- Di, D.R.; He, Z.Z.; Sun, Z.Q.; Liu, J. A new nano-cryosurgical modality for tumor treatment using biodegradable MgO nanoparticles. Nanomed. NBM 2012, 8, 1233–1241. [Google Scholar] [CrossRef] [PubMed]
- Agarwal, S.; Curtin, J.; Duffy, B.; Jaiswal, S. Biodegradable magnesium alloys for orthopaedic applications: A review on corrosion, biocompatibility and surface modifications. Mater. Sci. Eng. C 2016, 68, 948–963. [Google Scholar] [CrossRef] [PubMed]
- Staiger, M.P.; Pietak, A.M.; Huadmai, J.; Dias, G. Magnesium and Its Alloys as Orthopedic Biomaterials: A Review. Biomaterials 2006, 27, 1728–1734. [Google Scholar] [CrossRef] [PubMed]
- Krishnamoorthy, K.; Moon, J.Y.; Hyun, H.B.; Cho, S.K.; Kim, S.J. Mechanistic investigation on the toxicity of MgO nanoparticles toward cancer cells. J. Mater. Chem 2012, 22, 24610–24617. [Google Scholar] [CrossRef]
- Behzadi, E.; Sarsharzadeh, R.; Nouri, M.; Attar, F.; Akhtari, K.; Shahpasand, K.; Falahati, M. Albumin binding and anticancer effect of magnesium oxide nanoparticles. Int. J. Nanomed. 2019, 14, 257–270. [Google Scholar] [CrossRef] [PubMed]
- Liu, H. The Effects of Surface and Biomolecules on Magnesium Degradation and Mesenchymal Stem Cell Adhesion. J. Biomed. Mater. Res. A 2011, 99, 249–260. [Google Scholar] [CrossRef]
- Suryavanshi, A.; Khanna, K.; Sindhu, K.R.; Bellare, J.; Srivastava, R. Magnesium oxide nanoparticle-loaded polycaprolactone composite electrospun fiber scaffolds for bone-soft tissue engineering applications: In-vitro and in-vivo evaluation. Biomed. Mater. 2017, 12, 055011. [Google Scholar] [CrossRef] [PubMed]
- Wetteland, C.L.; Nguyen, N.Y.T.; Liu, H. Concentration-dependent behaviors of bone marrow derived mesenchymal stem cells and infectious bacteria toward magnesium oxide nanoparticles. Acta Biomater. 2016, 35, 341–356. [Google Scholar] [CrossRef] [PubMed]
- Coelho, C.C.; Araújo, R.; Quadros, P.A.; Sousa, S.R.; Monteiro, F.J. Antibacterial bone substitute of hydroxyapatite and magnesium oxide to prevent dental and orthopaedic infections. Mater. Sci. Eng. C 2019, 97, 529–538. [Google Scholar] [CrossRef]
- Sengupta, J.; Ghosh, S.; Datta, P.; Gomes, A.; Gomes, A. Physiologically important metal nanoparticles and their toxicity. J. Nanosci. Nanotechnol. 2014, 14, 990–1006. [Google Scholar] [CrossRef] [PubMed]
- Raliya, R.; Tarafdar, J.C.; Choudhary, K.; Mal, P.; Raturi, A.; Gautam, R.; Singh, S.K. Synthesis of MgO nanoparticles using Aspergillus tubingensis TFR-3. J. Bionanosci. 2014, 8, 34–38. [Google Scholar] [CrossRef]
- García-Gareta, E.; Coathup, M.J.; Blunn, G.W. Osteoinduction of bone grafting materials for bone repair and regeneration. Bone 2015, 81, 112–121. [Google Scholar] [CrossRef]
- Fahmy, H.; El-Hakim, M.; Nady, D.; Mostafa, Y.; Mohamed, F.; Yasien, A.; Yousef, H. Review on MgO nanoparticles multifunctional role in the biomedical field: Properties and applications. Nanomed. J. 2022, 9, 1–14. [Google Scholar] [CrossRef]
- Wahab, R.; Ansari, S.G.; Dar, M.A.; Kim, Y.S.; Shin, H.S. Synthesis of magnesium oxide nanoparticles by sol-gel process. Mater. Sci. Forum 2007, 558, 983–986. [Google Scholar] [CrossRef]
- Tang, Z.X.; Lv, B.F. MgO nanoparticles as antibacterial agent: Preparation and activity. Braz. J. Chem. Eng. 2014, 31, 591–601. [Google Scholar] [CrossRef]
- Makhluf, S.; Dror, R.; Nitzan, Y.; Abramovich, Y.; Jelinek, R.; Gedanken, A. Microwave-assisted synthesis of nanocrystalline MgO and its use as a bacteriocide. Adv. Funct. Mater. 2005, 15, 1708–1715. [Google Scholar] [CrossRef]
- Mulvihill, M.J.; Beach, E.S.; Zimmerman, J.B.; Anastas, P.T. Green chemistry and green engineering: A framework for sustainable technology development. Annu. Rev. Environ. Resour. 2011, 36, 271–293. [Google Scholar] [CrossRef]
- Venkatachalam, A.; Jesuraj, J.P.; Sivaperuman, K. Moringa oleifera leaf extract-mediated green synthesis of nanostructured alkaline earth oxide (MgO) and its physicochemical properties. J. Chem. 2021, 2021, 4301504. [Google Scholar] [CrossRef]
- Sushma, N.J.; Prathyusha, D.; Swathi, G.; Madhavi, T.; Deva Prasad Raju, B.; Mallikarjuna, K.; Kim, H.S. Facile approach to synthesize magnesium oxide nanoparticles by using Clitoria ternatea-characterization and in vitro antioxidant studies. Appl. Nanosci. 2016, 6, 437–444. [Google Scholar] [CrossRef]
- Somanathan, T.; Krishna, V.M.; Saravanan, V.; Kumar, R.; Kumar, R. MgO nanoparticles for effective uptake and release of doxorubicin drug: pH sensitive controlled drug release. J. Nanosci. Nanotechnol. 2016, 16, 9421–9431. [Google Scholar] [CrossRef]
- Amaregouda, Y.; Kamanna, K.; Gasti, T. Biodegradable Polyvinyl Alcohol/Carboxymethyl Cellulose Composite Incorporated with l-Alanine Functionalized MgO Nanoplates: Physico—Chemical and Food Packaging Features. J. Inorg. Organomet. Polym. Mater. 2022, 32, 2040–2055. [Google Scholar] [CrossRef]
- Akram, M.W.; Fakhar-E-Alam, M.; Atif, M.; Butt, A.R.; Asghar, A.; Jamil, Y.; Alimgeer, K.S.; Wang, Z.M. In Vitro Evaluation of the Toxic Effects of MgO Nanostructure in Hela Cell Line. Sci. Rep. 2018, 8, 4576. [Google Scholar] [CrossRef] [PubMed]
- Eubank, W.R. Calcination studies of magnesium oxides. J. Am. Ceram. Soc. 1951, 34, 225–229. [Google Scholar] [CrossRef]
- Green, J. Calcination of precipitated Mg(OH)2 to active MgO in the production of refractory and chemical grade MgO. J. Mater. Sci. 1983, 18, 637–651. [Google Scholar] [CrossRef]
- Faisal, S.; Abdullah; Jan, H.; Shah, S.; Shah, S.; Rizwan, M.; Zaman, N.; Hussain, Z.; Uddin, M.N.; Bibi, N.; et al. Bio-catalytic activity of novel Mentha arvensis intervened biocompatible magnesium oxide nanomaterials. Catalysts 2021, 11, 780. [Google Scholar] [CrossRef]
- Sackey, J.; Bashir, A.K.H.; Ameh, A.E.; Nkosi, M.; Kaonga, C.; Maaza, M. Date Pits Extracts Assisted Synthesis of Magnesium Oxides Nanoparticles and Its Application towards the Photocatalytic Degradation of Methylene Blue. J. King Saud Univ. Sci. 2020, 32, 2767–2776. [Google Scholar] [CrossRef]
- Fathy, R.M.; Mahfouz, A.Y. Eco-Friendly Graphene Oxide-Based Magnesium Oxide Nanocomposite Synthesis Using Fungal Fermented by- Products and Gamma Rays for Outstanding Antimicrobial, Antioxidant, and Anticancer Activities. J. Nanostruct. Chem. 2021, 11, 301–321. [Google Scholar] [CrossRef]
- Proniewicz, E.; Tąta, A.; Wójcik, A.; Starowicz, M.; Pacek, J.; Molenda, M. SERS Activity and Spectroscopic Properties of Zn and ZnO Nanostructures Obtained by Electrochemical and Green Chemistry Methods for Applications in Biology and Medicine. Phys. Chem. Chem. Phys. 2020, 22, 28100–28114. [Google Scholar] [CrossRef] [PubMed]
- Wong, C.W.; Chan, Y.S.; Jeevanandam, J.; Pal, K.; Bechelany, M.; Abd Elkodous, M.; El-Sayyad, G.S. Response Surface Methodology Optimization of Mono-Dispersed MgO Nanoparticles Fabricated by Ultrasonic-Assisted Sol–Gel Method for Outstanding Antimicrobial and Antibiofilm Activities. J. Clust. Sci. 2020, 31, 367–389. [Google Scholar] [CrossRef]
- Gajengi, A.L.; Sasaki, T.; Bhanage, B.M. Mechanistic Aspects of Formation of MgO Nanoparticles under Microwave Irradiation and Its Catalytic Application. Adv. Powder Technol. 2017, 28, 1185–1192. [Google Scholar] [CrossRef]
- Kumar, N.A.; Mahendra, B.; Sirajudeeen, J.; Kumar, M.A.; Nagaswarupa, H.P.; Kumar, C.R.; Umesh, B. Green mediated synthesis of MgO nano-flakes and its electro-chemical applications. Mater. Today Proc. 2018, 5, 22275–22282. [Google Scholar] [CrossRef]
- Suresh, S.; Arivuoli, D. Synthesis and characterization of Pb+ doped MgO nanocrystalline particles. Dig. J. Nanomater. Biostruct. 2011, 6, 1597–1603. [Google Scholar]
- Gu, F.; Li, C.; Cao, H.; Shao, W.; Hu, Y.; Chen, J.; Chen, A. Crystallinity of Li-Doped MgO: Dy3+ Nanocrystals via Combustion Process and Their Photoluminescence Properties. J. Alloys Compd. 2008, 453, 361–365. [Google Scholar] [CrossRef]
- Bdewi, S.F.; Abdullah, O.G.; Aziz, B.K.; Mutar, A.A.R. Synthesis, Structural and Optical Characterization of MgO Nanocrystalline Embedded in PVA Matrix. J. Inorg. Organomet. Polym. Mater. 2016, 26, 326–334. [Google Scholar] [CrossRef]
- Pathak, N.; Ghosh, P.S.; Gupta, S.K.; Kadam, R.M.; Arya, A. Defects Induced Changes in the Electronic Structures of MgO and Their Correlation with the Optical Properties: A Special Case of Electron-Hole Recombination from the Conduction Band. RSC Adv. 2016, 6, 96398–96415. [Google Scholar] [CrossRef]
- Amina, M.; Al Musayeib, N.M.; Alarfaj, N.A.; El-Tohamy, M.F.; Oraby, H.F.; Al Hamoud, G.A.; Bukhari, S.I.; Moubayed, N.M.S. Biogenic green synthesis of MgO anoparticles using Saussurea costus iomasses for a comprehensive detection of their antimicrobial, cytotoxicity against MCF-7 breast cancer cells and photocatalysis potentials. PLoS ONE 2020, 15, e0237567. [Google Scholar] [CrossRef] [PubMed]
- Jeevanandam, J.; San Chan, Y.; Danquah, M.K. Biosynthesis and characterization of MgO nanoparticles from plant extracts via induced molecular nucleation. New J. Chem. 2017, 41, 2800–2814. [Google Scholar] [CrossRef]
- Khan, M.I.; Akhtar, M.N.; Ashraf, N.; Najeeb, J.; Munir, H.; Awan, T.I.; Tahir, M.B.; Kabli, M.R. Green Synthesis of Magnesium Oxide Nanoparticles Using Dalbergia Sissoo Extract for Photocatalytic Activity and Antibacterial Efficacy. Appl. Nanosci. 2020, 10, 2351–2364. [Google Scholar] [CrossRef]
- Berger, T.; Sterrer, M.; Stankic, S.; Bernardi, J.; Diwald, O.; Knözinger, E. Trapping of Photogenerated Charges in Oxide Nanoparticles. Mater. Sci. Eng. C 2005, 25, 664–668. [Google Scholar] [CrossRef]
- Hao, Y.J.; Liu, B.; Tian, L.G.; Li, F.T.; Ren, J.; Liu, S.J.; Liu, Y.; Zhao, J.; Wang, X.J. Synthesis of {111} Facet-Exposed MgO with Surface Oxygen Vacancies for Reactive Oxygen Species Generation in the Dark. ACS Appl. Mater. Interfaces 2017, 9, 12687–12693. [Google Scholar] [CrossRef] [PubMed]
- Rodrigues, J.E.; Bezerra, D.M.; Hernandes, A.C. Calculation of the Optical Phonons in Ordered Ba 2 MgWO 6 Perovskite Using Short-Range Force Field Model. J. Raman Spectrosc. 2018, 49, 1822–1829. [Google Scholar] [CrossRef]
- İskenderoğlu, D.; Güney, H. Effect of Annealing on the Structural, Morphological and Optical Properties of MgO Nanowall Structures Grown by SILAR Method. J. Electron. Mater. 2019, 48, 5850–5856. [Google Scholar] [CrossRef]
- Ishikawa, K.; Fujima, N.; Komura, H. First-order Raman scattering in MgO microcrystals. J. Appl. Phys. 1985, 57, 973–975. [Google Scholar] [CrossRef]
- Hassnain Jaffari, G.; Tahir, A.; Bah, M.; Ali, A.; Bhatti, A.S.; Shah, S.I. Study of Surface-Active Modes and Defects in Single-Phase Li-Incorporated MgO Nanoparticles. J. Phys. Chem. C 2015, 119, 28182–28189. [Google Scholar] [CrossRef]
- Desai, P.; Darji, V.; Deshpande, M.P.; Chaki, S.H.; Sutariya, P.G.; Soni, H.; Solanki, P.; Shah, N.A.; Hirpara, B. High Yield Synthesis and Study of Cu Substitution on Characteristics and Dielectric Properties of MgO Nanostructures. Mater. Chem. Phys. 2023, 299, 127499. [Google Scholar] [CrossRef]
- Demirci, S.; Yildirim, B.K.; Tünçay, M.M.; Kaya, N.; Güllüoğlu, A.N. Synthesis, Characterization, Thermal, and Antibacterial Activity Studies on MgO Powders. J. Sol-Gel Sci. Technol. 2021, 99, 576–588. [Google Scholar] [CrossRef]
- Chinthala, M.; Balakrishnan, A.; Venkataraman, P.; Manaswini Gowtham, V.; Polagani, R.K. Synthesis and Applications of Nano-MgO and Composites for Medicine, Energy, and Environmental Remediation: A Review. Environ. Chem. Lett. 2021, 19, 4415–4454. [Google Scholar] [CrossRef]
- Iizuka, T. The formation of adsorbed anion radical of dipyridyl on magnesium oxide and the electron transfer to oxygen molecule from adsorbed anion radical. Chem. Lett. 1973, 2, 891–892. [Google Scholar] [CrossRef]
- Sutradhar, N.; Sinhamahapatra, A.; Pahari, S.K.; Pal, P.; Bajaj, H.C.; Mukhopadhyay, I.; Panda, A.B. Controlled Synthesis of Different Morphologies of MgO and Their Use as Solid Base Catalysts. J. Phys. Chem. C 2011, 115, 12308–12316. [Google Scholar] [CrossRef]
- Villaseñor, M.J.; Ríos, Á. Nanomaterials for Water Cleaning and Desalination, Energy Production, Disinfection, Agriculture and Green Chemistry. Environ. Chem. Lett. 2018, 16, 11–34. [Google Scholar] [CrossRef]
- Gatou, M.A.; Skylla, E.; Dourou, P.; Pippa, N.; Gazouli, M.; Lagopati, N.; Pavlatou, E.A. Magnesium Oxide (MgO) Nanoparticles: Synthetic Strategies and Biomedical Applications. Crystals 2024, 14, 215. [Google Scholar] [CrossRef]
- Sharmin, S.; Rahaman, M.M.; Sarkar, C.; Atolani, O.; Islam, M.T.; Adeyemi, O.S. Nanoparticles as antimicrobial and antiviral agents: A literature-based perspective study. Heliyon 2021, 7, 06456. [Google Scholar] [CrossRef] [PubMed]
- Costa, D.; Chizallet, C.; Ealet, B.; Goniakowski, J.; Finocchi, F. Water on extended and point defects at MgO surfaces. J. Chem. Phys. 2006, 125, 054702. [Google Scholar] [CrossRef] [PubMed]
- Scamehorn, C.A.; Harrison, N.M.; McCarthy, M.I. Water chemistry on surface defect sites: Chemidissociation versus physisorption on MgO(001). J. Chem. Phys. 1994, 101, 1547–1554. [Google Scholar] [CrossRef]
- Finocchi, F.; Goniakowski, J. Interaction of a water molecule with the oxygen vacancy on the MgO(100) surface. Phys. Rev. B 2001, 64, 125426. [Google Scholar] [CrossRef]
- El-Mekkawi, D.M.; Selim, M.M.; Hamdi, N.; Hassan, S.A.; Ezzat, A. Studies on the Influence of the Physicochemical Characteristics of Nanostructured Copper, Zinc and magnesium Oxides on Their Antibacterial Activities. J. Environ. Chem. Eng. 2018, 6, 5608–5615. [Google Scholar] [CrossRef]
- Proniewicz, E.; Gralec, B.; Ozaki, Y. Homogeneous Pt Nanostructures Surface Functionalized with Phenylboronic Acid Phosphonic Acid Derivatives as Potential Biochemical Nanosensors and Drugs: SERS and TERS Studies. J. Biomed. Mater. Res. B Appl. Biomater. 2023, 111, 1197–1206. [Google Scholar] [CrossRef] [PubMed]
- Proniewicz, E.; Burnat, G.; Domin, H.; Iłowska, E.; Roman, A.; Prahl, A. Spectroscopic Characterization and in Vitro Studies of Biological Activity of Bradykinin Derivatives. Sci. Rep. 2022, 12, 19015. [Google Scholar] [CrossRef]
- Itoh, T.; Yamamoto, Y.S.; Ozaki, Y. Plasmon-Enhanced Spectroscopy of Absorption and Spontaneous Emissions Explained Using Cavity Quantum Optics. Chem. Soc. Rev. 2017, 46, 3904–3921. [Google Scholar] [CrossRef] [PubMed]
- Shi, X.; Coca-López, N.; Janik, J.; Hartschuh, A. Advances in Tip-Enhanced Near-Field Raman Microscopy Using Nanoantennas. Chem. Rev. 2017, 117, 4945–4960. [Google Scholar] [CrossRef] [PubMed]
- Proniewicza, E.; Tąta, A.; Starowicz, M.; Wójcik, A.; Pacek, J.; Molenda, M. Is the Electrochemical or the Green Chemistry Method the Optimal Method for the Synthesis of ZnO Nanoparticles for Applications to Biological Material? Characterization and SERS on ZnO. Colloids Surf. A 2021, 609, 125771. [Google Scholar] [CrossRef]
- Proniewicz, E.; Tąta, A.; Szkudlarek, A.; Świder, J.; Molenda, M.; Starowicz, M.; Ozaki, Y. Electrochemically Synthesized γ-Fe2O3 Nanoparticles as Peptide Carriers and Sensitive and Reproducible SERS Biosensors. Comparison of Adsorption on γ-Fe2O3 versus Fe. Appl. Surf. Sci. 2019, 495, 143578. [Google Scholar] [CrossRef]
- Roguska, A.; Kudelski, A.; Pisarek, M.; Opara, M.; Janik-Czachor, M. Surface-Enhanced Raman Scattering (SERS) Activity of Ag, Au and Cu Nanoclusters on TiO2-Nanotubes/Ti Substrate. Appl. Surf. Sci. 2011, 257, 8182–8189. [Google Scholar] [CrossRef]
- Ze, H.; Chen, X.; Wang, X.-T.; Wang, Y.-H.; Chen, Q.-Q.; Lin, J.-S.; Zhang, Y.-J.; Zhang, X.-G.; Tian, Z.-Q.; Li, J.-F. Molecular Insight of the Critical Role of Ni in Pt-Based Nanocatalysts for Improving the Oxygen Reduction Reaction Probed Using an In Situ SERS Borrowing Strategy. J. Am. Chem. Soc. 2021, 143, 1318–1322. [Google Scholar] [CrossRef] [PubMed]
- Chen, Y.; Fang, Y. Surface Enhanced Raman Scattering (SERS) Activity Studies of Si, Fe, Ti, Al and Ag Films Prepared by Magnetron Sputtering. Spectrochim. Acta Part A 2008, 69, 733–737. [Google Scholar] [CrossRef] [PubMed]
- Das, R.; Soni, R.K. Synthesis and Surface-Enhanced Raman Scattering of Indium Nanotriangles and Nanowires. RSC Adv. 2017, 7, 32255–32263. [Google Scholar] [CrossRef]
- Al-Otaibi, J.S.; Mary, Y.S.; Mary, Y.S.; Acharjee, N.; Churchill, D.G. Theoretical Study of Glycoluril by Highly Symmetrical Magnesium Oxide Mg12O12 Nanostructure: Adsorption, Detection, SERS Enhancement, and Electrical Conductivity Study. J. Mol. Model. 2022, 28, 332. [Google Scholar] [CrossRef]
- Zhang, K.; Li, G.; Hu, Y. In Situ Loading of Well-Dispersed Silver Nanoparticles on Nanocrystalline Magnesium Oxide for Real-Time Monitoring of Catalytic Reactions by Surface Enhanced Raman Spectroscopy. Nanoscale 2015, 7, 16952–16959. [Google Scholar] [CrossRef] [PubMed]
- Xu, J.; Shi, X.; Yi, M.; Chi, Y.; Guo, S.; Mao, Z.; Zhao, B.; Jung, Y.M. Improved Charge-Transfer Enhancement by Codoping Mg/Zn into ZrO2 for Quinolone Antibiotic Drug Determination. Appl. Surf. Sci. 2023, 639, 158256. [Google Scholar] [CrossRef]
- Pradeev Raj, K.; Sadaiyandi, K.; Kennedy, A.; Sagadevan, S.; Chowdhury, Z.Z.; Johan, M.R.B.; Aziz, F.A.; Rafique, R.F.; Thamiz Selvi, R.; Rathina Bala, R. Influence of Mg Doping on ZnO Nanoparticles for Enhanced Photocatalytic Evaluation and Antibacterial Analysis. Nanoscale Res. Lett. 2018, 229, 1–13. [Google Scholar]
- Zhang, J.; Jia, T.; Li, X.; Yang, J.; Li, Z.; Shi, G.; Zhang, X.; Wang, Z. Fabrication of nano/microstructures for SERS substrates using an electrochemical method. Beilstein J. Nanotechnol. 2020, 11, 1568–1576. [Google Scholar] [CrossRef] [PubMed]
- Meyer, M.W.; Smith, E.A. Optimization of silver nanoparticles for surface enhanced Raman spectroscopy of structurally diverse analytes using visible and near-infrared excitation. Analyst 2011, 136, 3542–3549. [Google Scholar] [CrossRef] [PubMed]
- Podstawka, E.; Ozaki, Y.; Proniewicz, L.M. Part I: Surface-Enhanced Raman Spectroscopy Investigation of Amino Acids and Their Homodipeptides Adsorbed on Colloidal Silver. Appl. Spectrosc. 2004, 58, 570–580. [Google Scholar] [CrossRef] [PubMed]
- Podstawka, E.; Kudelski, A.; Proniewicz, L.M. Adsorption Mechanism of Physiologically Active L-Phenylalanine Phosphonodipeptide Analogues: Comparison of Colloidal Silver and Macroscopic Silver Substrates. Surf. Sci. 2007, 601, 4971–4983. [Google Scholar] [CrossRef]
- Podstawka, E.; Borszowska, R.; Grabowska, M.; Drąg, M.; Kafarski, P.; Proniewicz, L.M. Investigation of Molecular Structures and Adsorption Mechanisms of Phosphonodipeptides by Surface-Enhanced Raman, Raman, and Infrared Spectroscopies. Surf. Sci. 2005, 599, 207–220. [Google Scholar] [CrossRef]
- Podstawka, E.; Ozaki, Y.; Proniewicz, L.M. Part III: Surface-Enhanced Raman Scattering of Amino Acids and Their Homodipeptide Monolayers Deposited onto Colloidal Gold Surface. Appl. Spectrosc. 2005, 59, 1516–1526. [Google Scholar] [CrossRef] [PubMed]
- Proniewicz, E. Metallic nanoparticles as effective sensors of bio-molecules. Spectrochim. Acta A 2023, 288, 122207. [Google Scholar] [CrossRef] [PubMed]
- Foster, H.A.; Ditta, I.B.; Varghese, S.; Steele, A. Photocatalytic Disinfection Using Titanium Dioxide: Spectrum and Mechanism of Antimicrobial Activity. Appl. Microbiol. Biotechnol. 2011, 90, 1847–1868. [Google Scholar] [CrossRef] [PubMed]
- Kumaran, R.S.; Choi, Y.K.; Singh, V.; Song, H.J.; Song, K.G.; Kim, K.J.; Kim, H.J. In Vitro Cytotoxic Evaluation of MgO Nanoparticles and Their Effect on the Expression of ROS Genes. Int. J. Mol. Sci. 2015, 16, 7551–7564. [Google Scholar] [CrossRef] [PubMed]


| Sample | Name | Crude MgONPs | MgONPs Calcined at 400 °C | ||
|---|---|---|---|---|---|
| Crystallite Size (nm) | 2θ Angle | Crystallite Size (nm) | 2θ Angle | ||
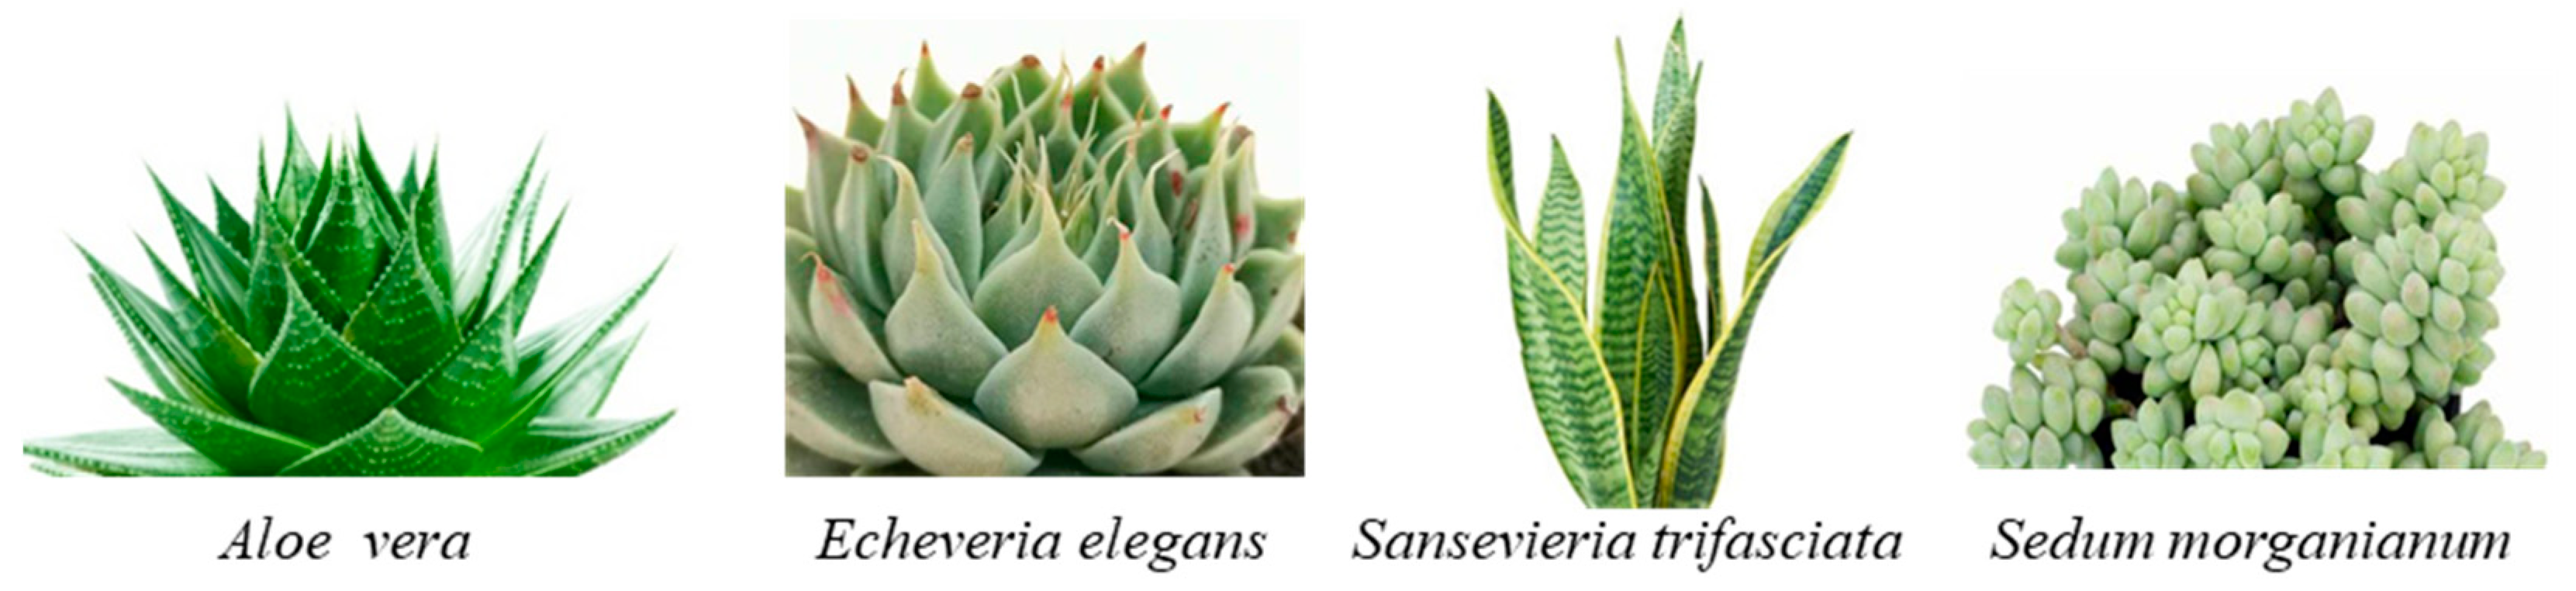
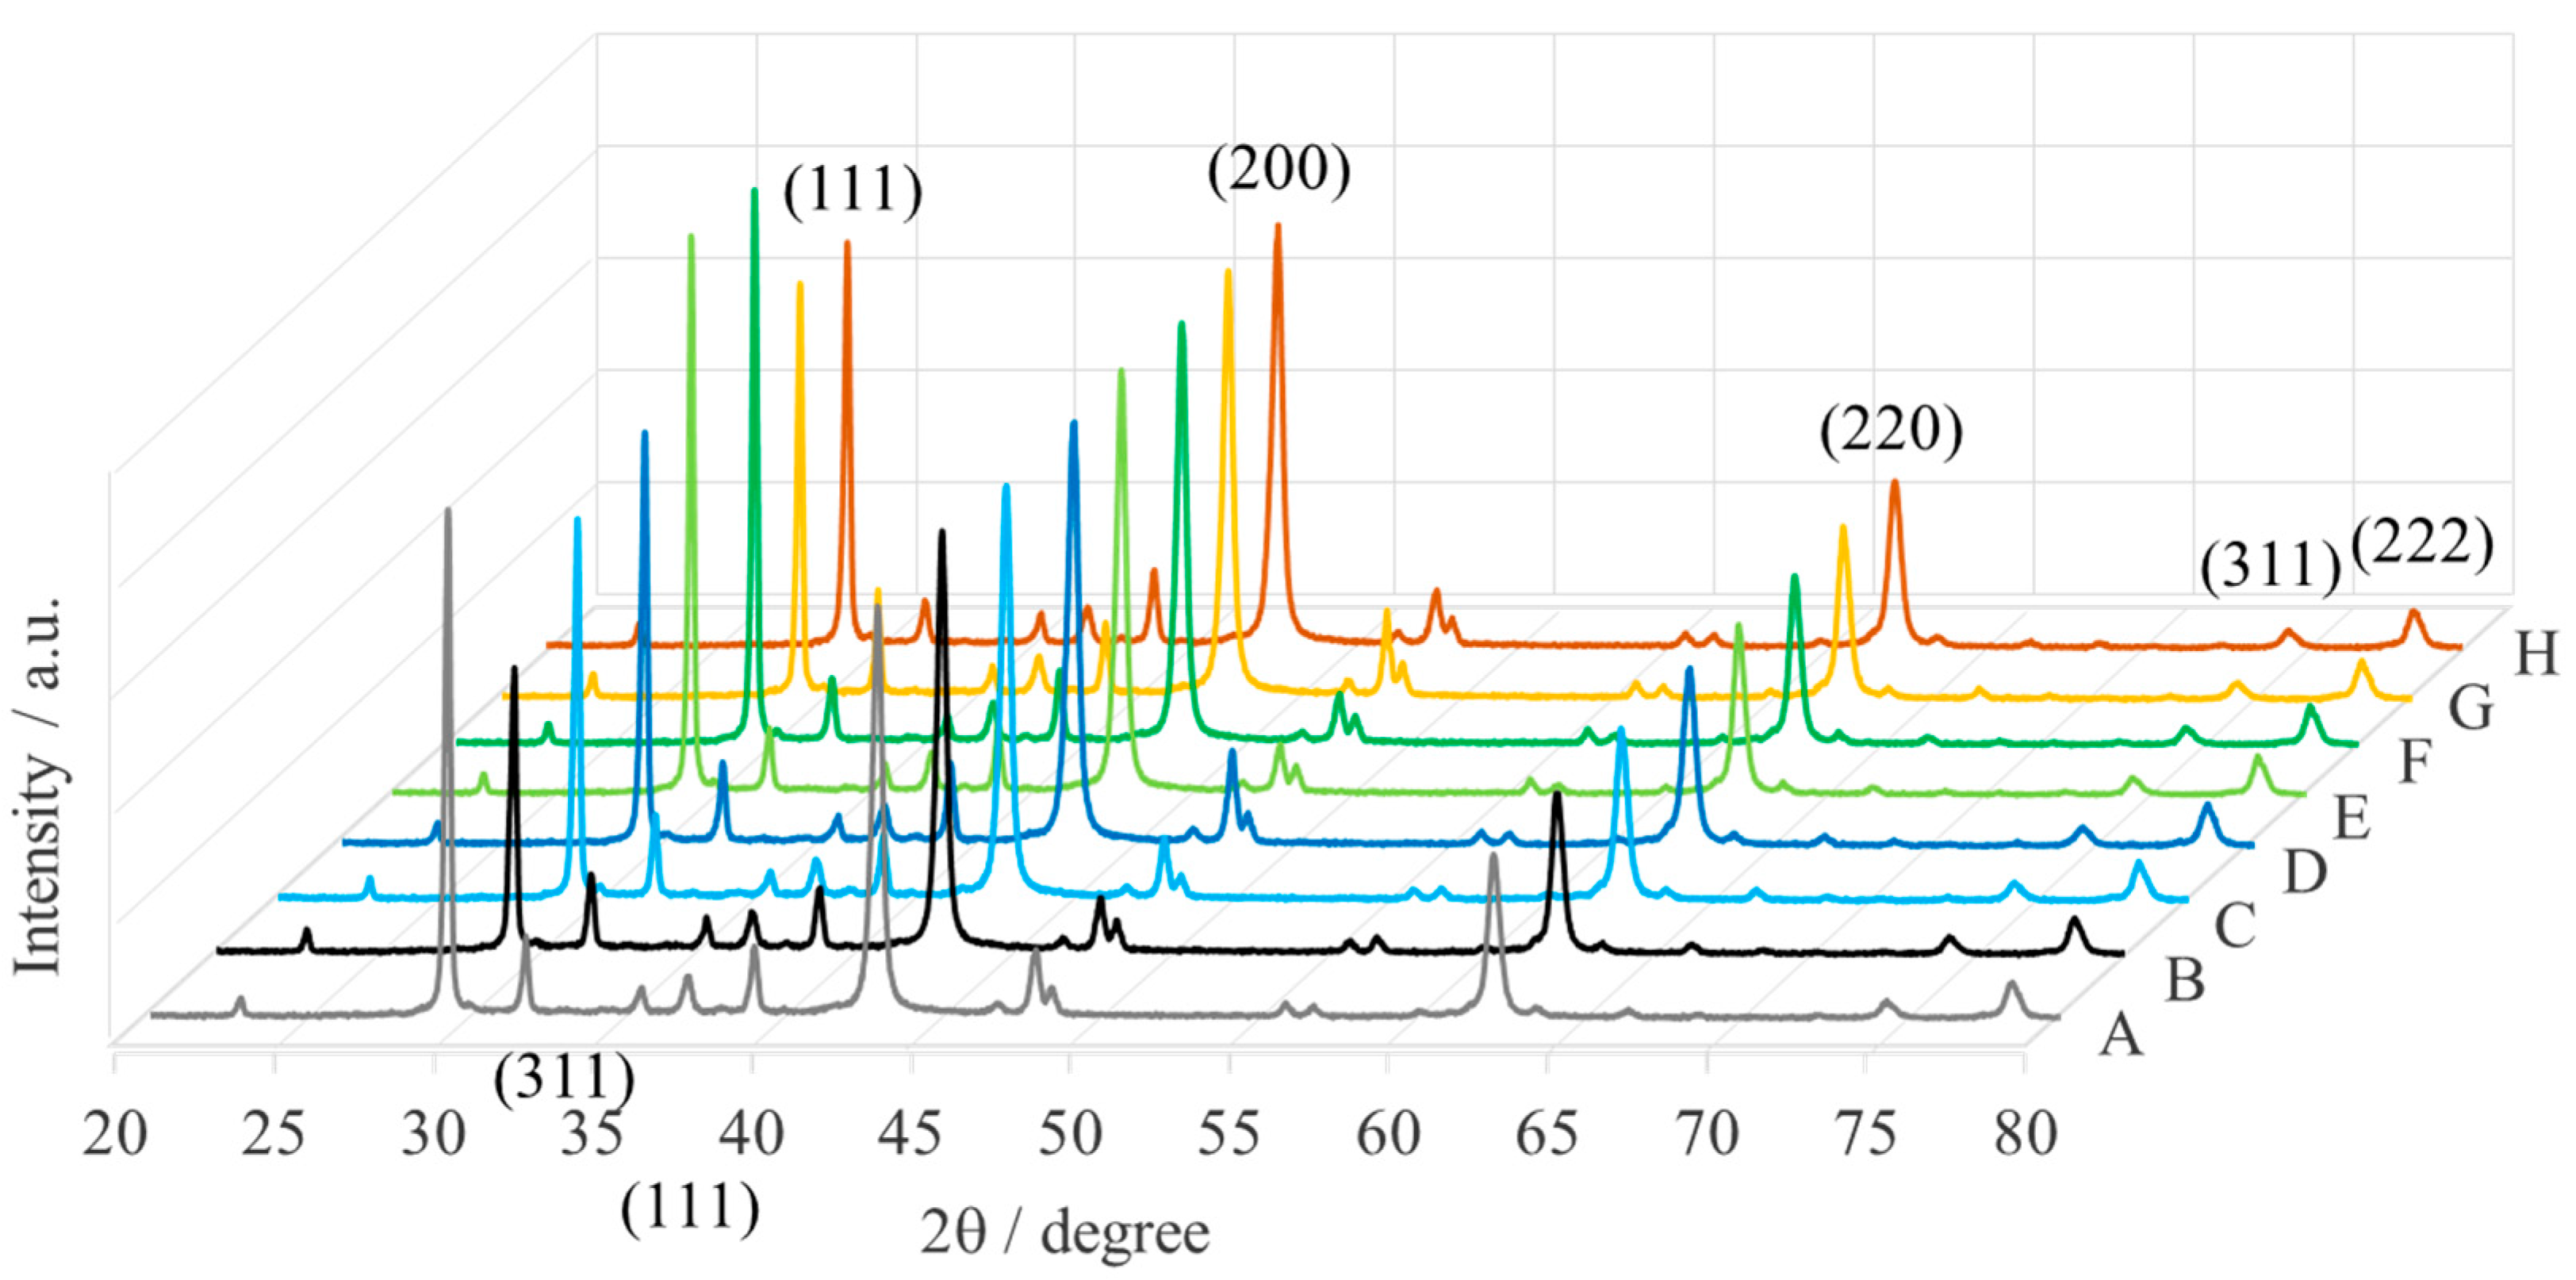
| A | Aloe vera-1 | 65 | 42.71 | 49 | 42.87 |
| B | Aloe vera-2 | 73 | 42.68 | 52 | 42.80 |
| C | Echeveria elegans-1 | 62 | 42.65 | 49 | 42.87 |
| D | Echeveria elegans-2 | 72 | 42.68 | 46 | 42.93 |
| E | Sansevieria trifasciata-1 | 68 | 42.66 | 47 | 42.83 |
| F | Sansevieria trifasciata-2 | 72 | 42.67 | 52 | 42.87 |
| G | Sedum morganianum-1 | 71 | 42.67 | 50 | 42.82 |
| H | Sedum morganianum-2 | 64 | 42.73 | 49 | 42.91 |
| Sample | Name | MgONPs Calcined at 400 °C | ||||||
|---|---|---|---|---|---|---|---|---|
| Particle Size (nm) | Average Particle Size (nm) | Plasmon Resonance (nm) | Band Gap Energy (eV) | Photodegradation Efficiency (%) | ||||
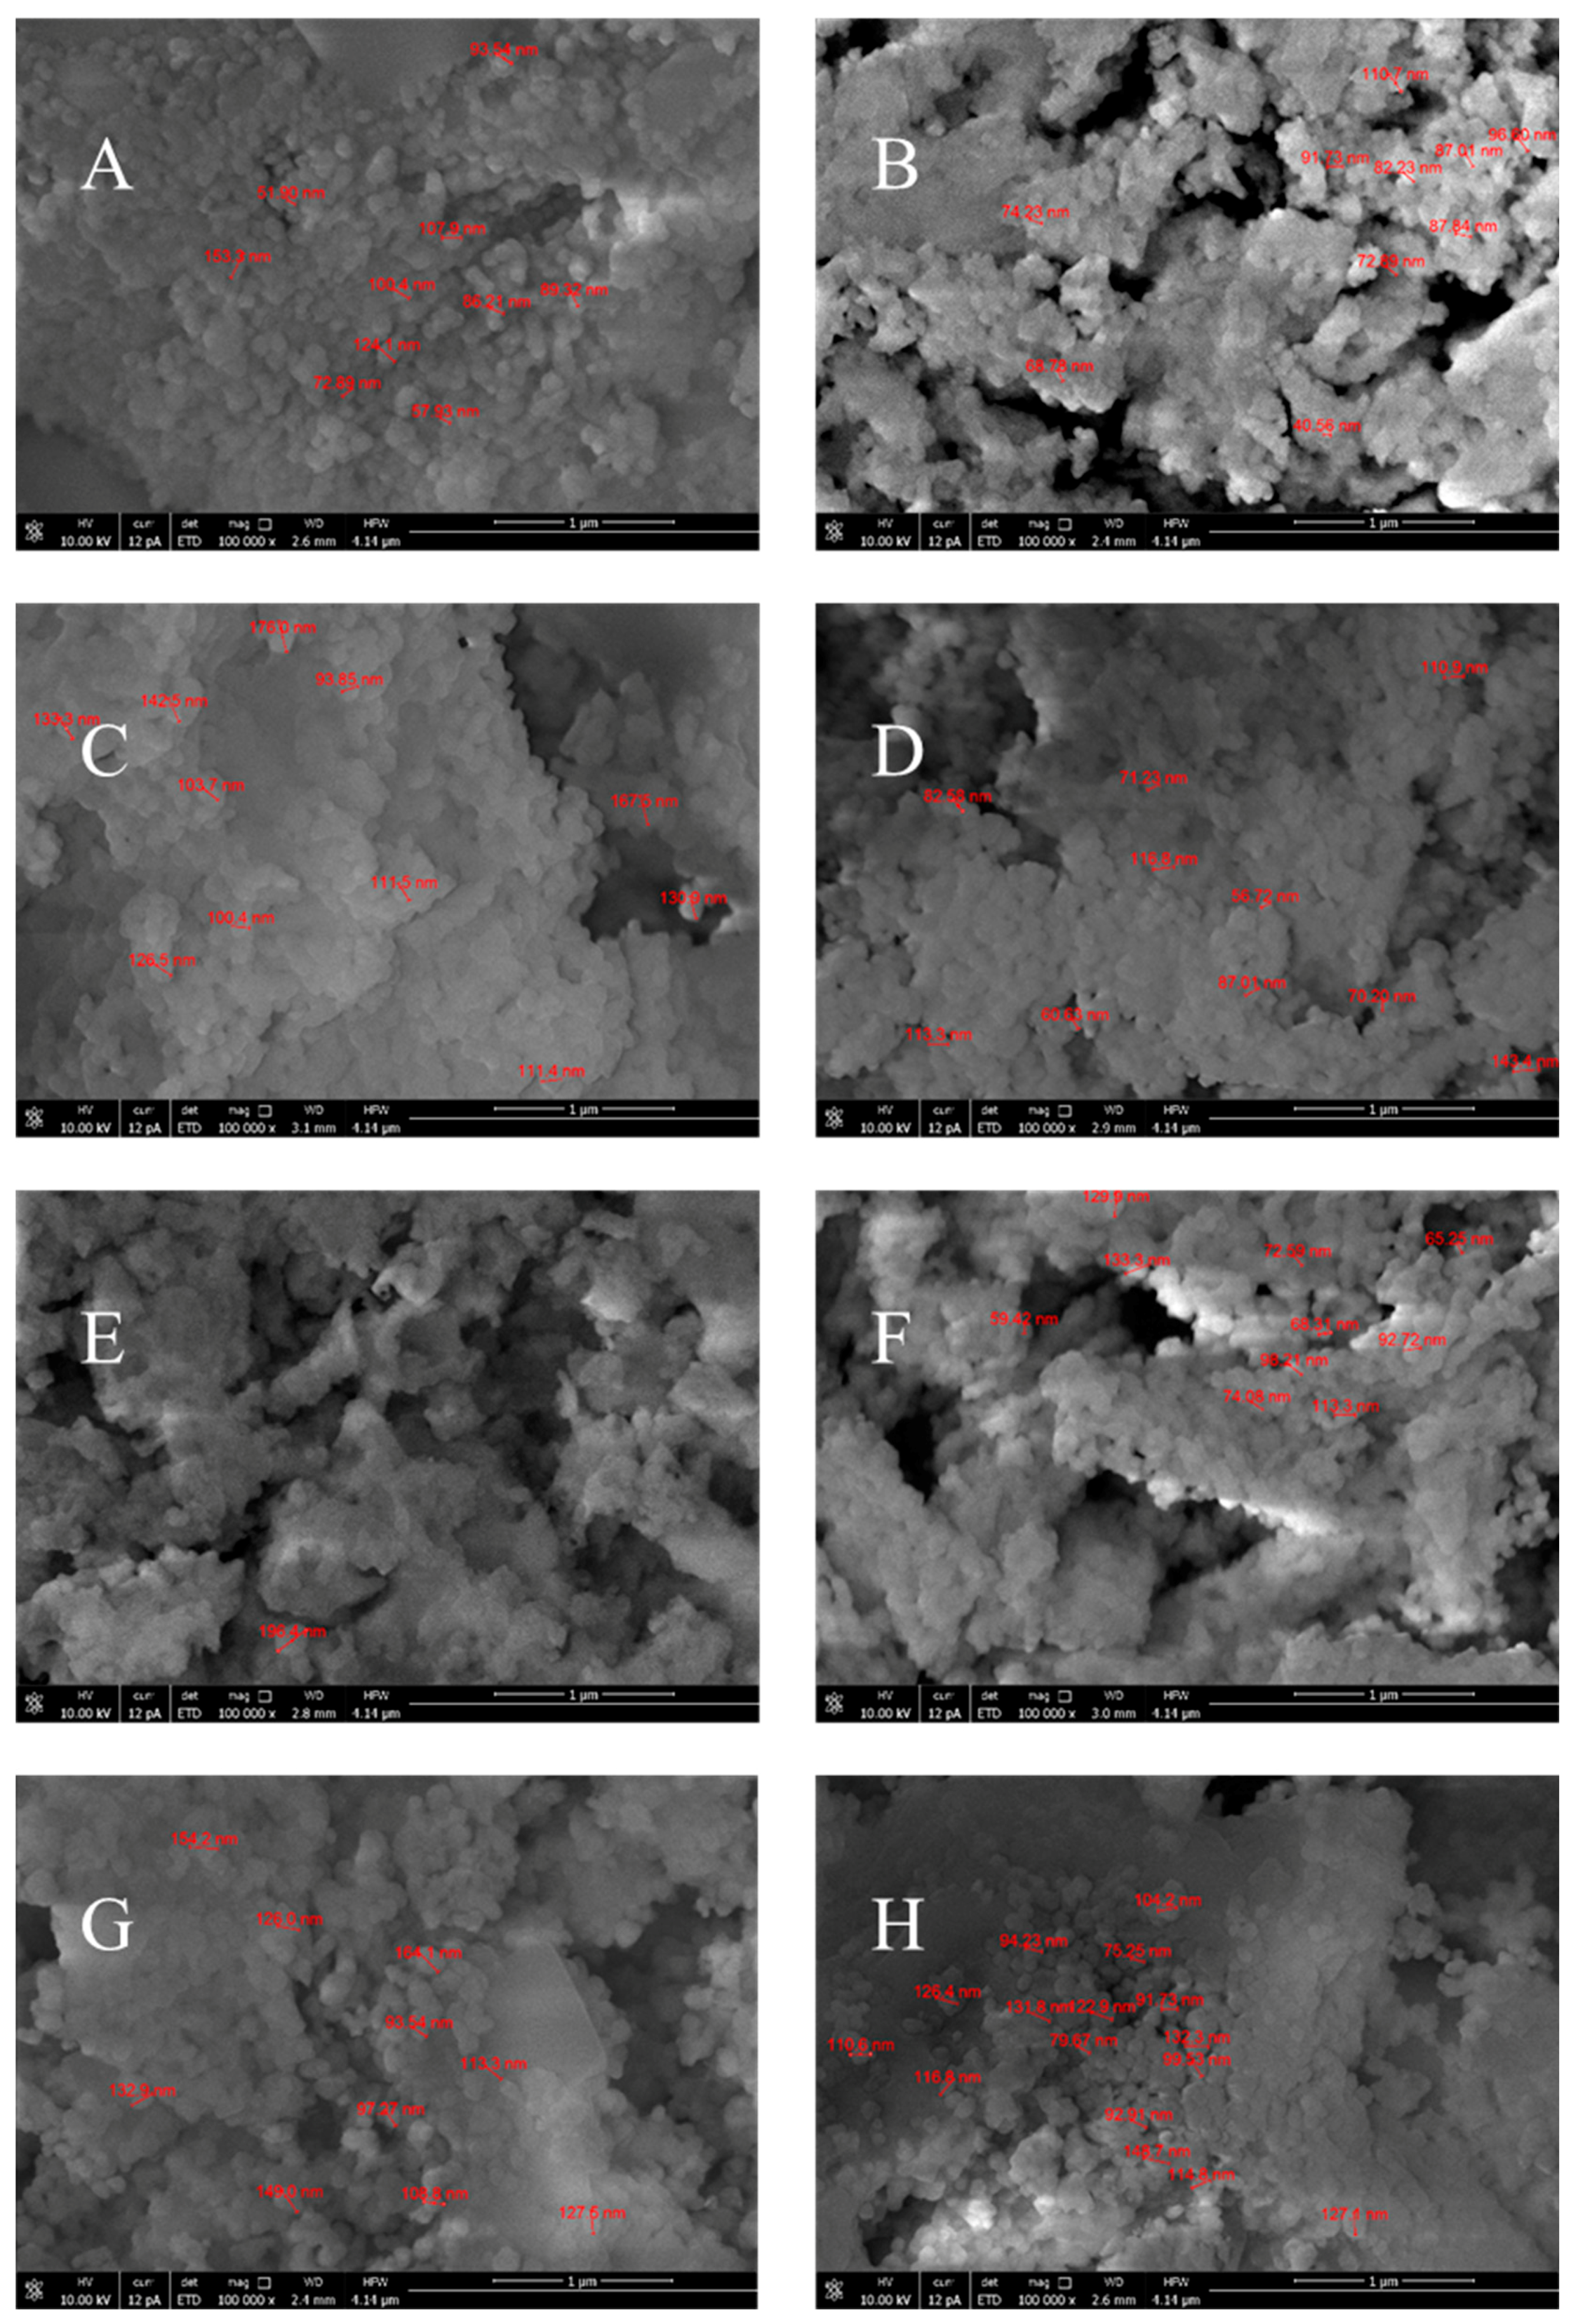
| A | Aloe vera-1 | 52–153 | 94 | 219 | 326 | 5.66 | 3.80 | 38 |
| B | Aloe vera-2 | 41–111 | 81 | 225 | 322 | 5.51 | 3.85 | 36 |
| C | Echeveria elegans-1 | 94–176 | 135 | 222 | 319 | 5.58 | 3.89 | 23 |
| D | Echeveria elegans-2 | 57–143 | 91 | 224 | 318 | 5.54 | 3.90 | 33 |
| E | Sansevieria trifasciata-1 | 128–196 | 154 | 217 | 328 | 5.71 | 3.78 | 36 |
| F | Sansevieria trifasciata-2 | 59–133 | 90 | 227 | 327 | 5.46 | 3.79 | 42 |
| G | Sedum morganianum-1 | 94–164 | 126 | 225 | 319 | 5.51 | 3.89 | 30 |
| H | Sedum morganianum-2 | 75–149 | 110 | 230 | 313 | 5.39 | 3.96 | 80 |
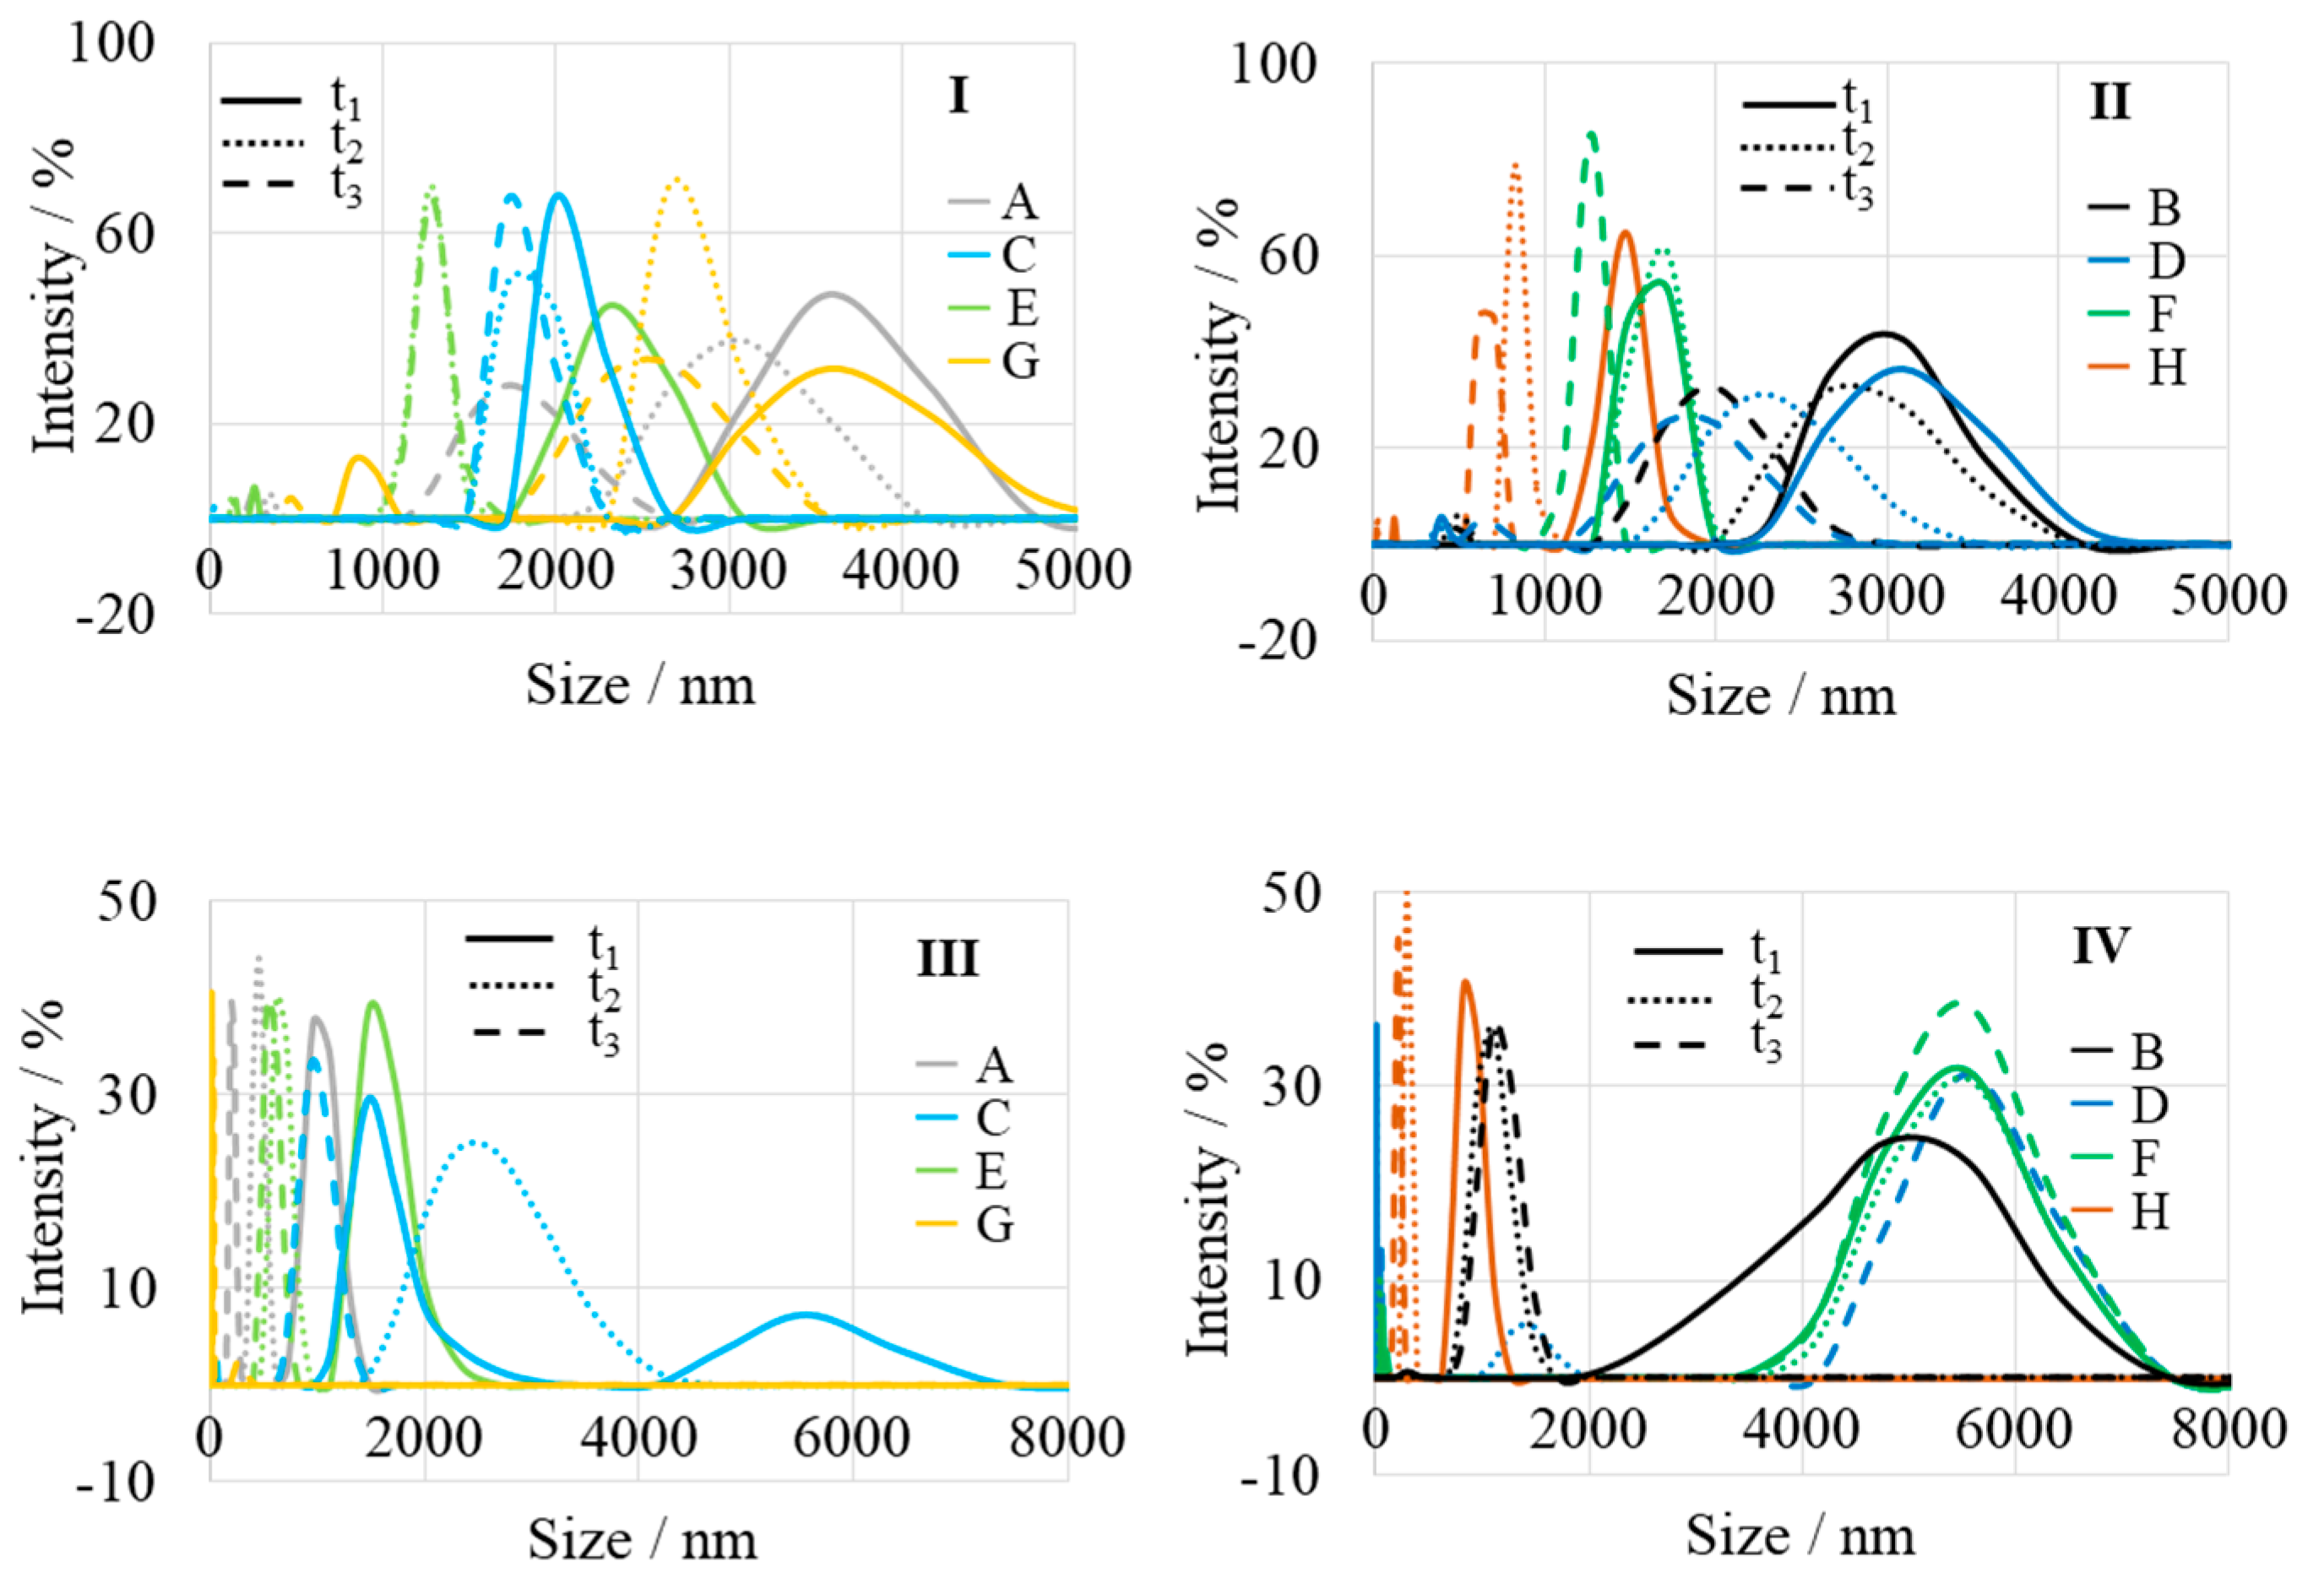
| Sample | Name | Crude MgONPs | MgONPs Calcined at 400 °C | ||||
|---|---|---|---|---|---|---|---|
| t1 | t2 | t3 | t1 | t2 | t3 | ||
| A | Aloe vera-1 | 3620 | 3060 | 1750 | 1000 | 455 | 200 |
| B | Aloe vera-2 | 2980 | 2800 | 1970 | 5080 | 1150 | 1080 |
| C | Echeveria elegans-1 | 2020 | 1810 | 1740 | 1480, 5575 | 2475 | 970 |
| D | Echeveria elegans-2 | 3080 | 2285 | 1850 | 56, 5540 | 1400 | |
| E | Sansevieria trifasciata-1 | 2330 | 1280 | 1275 | 1520 | 640 | 550 |
| F | Sansevieria trifasciata-2 | 1700 | 1650 | 1280 | 5480 | 5470 | 5420 |
| G | Sedum morganianum-1 | 3610 | 2700 | 2520 | 280 | ||
| H | Sedum morganianum-2 | 1480 | 825 | 665 | 860 | 295 | 220 |
Disclaimer/Publisher’s Note: The statements, opinions and data contained in all publications are solely those of the individual author(s) and contributor(s) and not of MDPI and/or the editor(s). MDPI and/or the editor(s) disclaim responsibility for any injury to people or property resulting from any ideas, methods, instructions or products referred to in the content. |
© 2024 by the authors. Licensee MDPI, Basel, Switzerland. This article is an open access article distributed under the terms and conditions of the Creative Commons Attribution (CC BY) license (https://creativecommons.org/licenses/by/4.0/).
Share and Cite
Proniewicz, E.; Vijayan, A.M.; Surma, O.; Szkudlarek, A.; Molenda, M. Plant-Assisted Green Synthesis of MgO Nanoparticles as a Sustainable Material for Bone Regeneration: Spectroscopic Properties. Int. J. Mol. Sci. 2024, 25, 4242. https://doi.org/10.3390/ijms25084242
Proniewicz E, Vijayan AM, Surma O, Szkudlarek A, Molenda M. Plant-Assisted Green Synthesis of MgO Nanoparticles as a Sustainable Material for Bone Regeneration: Spectroscopic Properties. International Journal of Molecular Sciences. 2024; 25(8):4242. https://doi.org/10.3390/ijms25084242
Chicago/Turabian StyleProniewicz, Edyta, Ajith Mohanavilasam Vijayan, Olga Surma, Aleksandra Szkudlarek, and Marcin Molenda. 2024. "Plant-Assisted Green Synthesis of MgO Nanoparticles as a Sustainable Material for Bone Regeneration: Spectroscopic Properties" International Journal of Molecular Sciences 25, no. 8: 4242. https://doi.org/10.3390/ijms25084242