Abstract
Phagocytosis (and endocytosis) is an unusual cellular process that results in the formation of a novel subcellular organelle, the phagosome. This phagosome contains not only the internalised target of phagocytosis but also the external medium, creating a new border between extracellular and intracellular environments. The boundary at the plasma membrane is, of course, tightly controlled and exploited in ionic cell signalling events. Although there has been much work on the control of phagocytosis by ions, notably, Ca2+ ions influxing across the plasma membrane, increasing our understanding of the mechanism enormously, very little work has been done exploring the phagosome/cytosol boundary. In this paper, we explored the changes in the intra-phagosomal Ca2+ ion content that occur during phagocytosis and phagosome formation in human neutrophils. Measuring Ca2+ ion concentration in the phagosome is potentially prone to artefacts as the intra-phagosomal environment experiences changes in pH and oxidation. However, by excluding such artefacts, we conclude that there are open Ca2+ channels on the phagosome that allow Ca2+ ions to “drain” into the surrounding cytosol. This conclusion was confirmed by monitoring the translocation of the intracellularly expressed YFP-tagged C2 domain of PKC-γ. This approach marked regions of membrane at which Ca2+ influx occurred, the earliest being the phagocytic cup, and then the whole cell. This paper therefore presents data that have novel implications for understanding phagocytic Ca2+ signalling events, such as peri-phagosomal Ca2+ hotspots, and other phenomena.
1. Introduction
Phagocytosis, the process whereby an extracellular object is internalised by a cell (phagocyte), is a complex process involving the extension of small pseudopodia that attach to the extracellular target, initially immobilising the particle within a “phagocytic cup”, and then, after a large cytosolic Ca2+ signal, a rapid extension of the pseudopodia fully encloses the target and draws it into the cell interior [1,2,3]. This results in the formation of an intracellular vesicle, the phagosome [4,5], whose membrane originates from the plasma membrane. The relationship between cytosolic Ca2+ signalling and phagocytosis is complex, with the cytosolic Ca2+ signal that occurs during phagocytosis by neutrophils regulating both the rate of extension of pseudopodia around the target [1,2,3] and the activation of the bactericidal oxidase system in the phagosomal membrane [6,7]. Ca2+ signalling within these cells involves both Ca2+ influx from the extracellular environment and the release from stored Ca2+ from within the cell [8]. Hotspots of Ca2+ in the cytosol near the closed phagosome have also been reported in some phagocytic cells such as mouse embryonic fibroblasts and dHL60 cells [9] and RAW 264.7 cells [10]. It is suggested that these Ca2+ microdomains (hotspots) arise from “leaky” interactions of STIM-1 on the endoplasmic reticulum (ER), the Ca2+ storage organelle with channels on the phagosomal membrane [9]. These STIM-1-mediated Ca2+ hotspots are necessary for efficient phagocytosis and oxidase activation [11,12]. In addition, the phagosome itself may contribute to the increase in peri-phagosome Ca2+. However, very little is known about the intra-phagosomal Ca2+ concentration and how it changes during phagocytosis. Pioneering work by Dahlgren’s group more than 20 years ago [13] using fura2 as a Ca2+ indicator showed that intra-phagosomal Ca2+ rapidly decreased during phagocytosis. However, the kinetics and relationship to the process of phagocytosis were not investigated. The Ca2+ probe used, fura 2, was susceptible to “bleaching effects” [14], making measurements within the phagosome difficult [13]. However, advances in imaging and Ca2-sensing fluor design have enabled these early observations to be extended and to further investigate intra-phagosomal Ca2+ changes. In this paper, we used a Ca2+-sensor, fluo4, which has the more robust fluorescein-like component, covalently coupled to a phagocytic target. When phagocytosed by neutrophils, this indicator dynamically reported the intra-phagosomal Ca2+ concentration and enabled a correlate of changes in phagosomal Ca2+ with binding, uptake, and phagosomal closure. Using this approach, we report here that there was an initially high Ca2+ concentration within the phagosome, which was reduced to the cytosolic concentration within 200 s of phagosomal closure. This is consistent with the incorporation into the phagosomal membrane of opened plasma membrane Ca2+ channel, which, in the open phagocytic cup acts as a conduit for local Ca2+ elevation, but once the phagosome is closed, “drains” phagosomal Ca2+ into the cytosol.
2. Results
2.1. Fluo4-Zymosan Targets Report Ca2+ Concentration
In order to monitor intra-phagosomal Ca2+, the Ca2+-sensitive fluorescent probe, fluo4, was coupled to C3bi-opsonised zymosan particles as a phagocytic target. The sensitivity of the fluo4-zymosan particles to Ca2+ concentration was established in vitro by measuring the fluo4 intensity at various Ca2+ concentrations (Figure 1). There were two micro-anatomical zones of the zymosan particle [15], the outer zone and the central core, with the central core having a brighter fluorescence signal as a result of the fluo4 plus a strong auto-fluorescent signal. The fluorescence intensity of the outer zone acted as a true Ca2+ indicator, with little autofluorescence. The central fluorescent signal was, however, useful for identifying the location of the target during phagocytosis. Each zone also had a different apparent kd for Ca2+ (Figure 1), with the fluo4 in the core zone having an apparent kd of approximately 300 nM, similar to that reported for free fluo4, i.e., 345 nM at pH 7.2, [16], whereas the fluo4 in the outer zone had a higher apparent kd of approx. 1 μM Ca2+ (Figure 1). However, in both zones of the zymosan particle, fluo4 reached maximum intensity at 1.3 mM Ca2+ (i.e., the extracellular Ca2+ concentration) and near-zero intensity at 100 nM (i.e., the cytosol-free Ca2+ concentration) (Figure 1). The difference in apparent Kds, fortuitously, also provided the opportunity for a double estimation of intra-phagosomal Ca2+ to be carried out from the same zymosan particle within the same phagosome. It should be noted that the fluo4 at both locations was almost totally saturated with Ca2+ above 10 μM, so the effective measurement range was thus below 10 μM Ca2+.
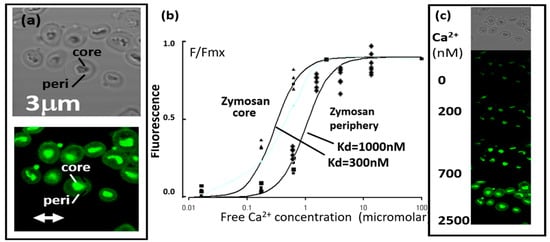
Figure 1.
Properties of fluo4-zymosan particles. (a) The phase contrast (upper) and fluorescent (lower) appearance of zymosan particles in 1.3 mM Ca2+, with the dense “core” and the transparent periphery indicated. (b) The relationship between free Ca2+ concentration and fluorescence intensity from the core and peripheral regions of individual zymosan particles. Individual experimental data are shown as F/Fmax (with separate symbols), together with the theoretical relationship (lines) shown for two dissociation constants (kd). (c) A sample experiment showing the same microscopic field; top = phase contrast; then florescence images in the same field at the Ca2+ concentrations indicated.
2.2. Phagosomal Fluo4 Signal Is Decreased
Having established that the fluo4-zymosan particles reported Ca2+ concentration, the effect of phagocytosis was examined. The fluorescence of zymosan particles within phagosomes was significantly reduced after internalisation compared with non-phagocytosed particles in the same microscopic field (Figure 2a,c). It is unlikely that this was an optical effect caused by the interference from the cytoplasm surrounding the phagocytic target because, (i) during the process of internalisation, no partial or zonal reduction in the fluorescent signal from the zymosan was observed, as would be expected from optical obstruction by the encroaching pseudopodia, and (ii) although there is an effect of light scattering through the cytoplasm that attenuates the detected fluorescent signals from intracellular fluors [17], this would be very small. The light-scattering effect of cytoplasmic projections covering the phagosome depends on the number of cytosolic granules per unit volume (density), the granule refractive index, and their size [18,19]. The engulfing pseudopodia were thin and excluded light-scattering granules, and the cytosolic fluorescence at these locations often has increased excitation efficiency and appears brighter [17]. In a worst-case scenario, taking the published values for bulk cytosolic granules (density, refractive index, and size), Mie scattering calculations provided an estimate of the attenuation coefficient for 488 nm laser light through a neutrophil cytoplasm of about 700 mm−1. As the approximate thickness of the cytoplasm covering the zymosan particle within the phagosome was less than 0.5 mm, less than 30% of the laser light entering the pseudopodia would have been scattered and thus would have been unavailable for excitation of fluo4, i.e., the intensity would have been a minimum of 70% of its maximum. This is insufficient to account for the reduction in intensity of the internalised fluo4-zymosan, which was less than about 5% of the non-internalised particles (Figure 2c). Thus, such a decrease in intensity in the phagosomal signal (>95%) cannot be accounted for by an optical effect caused by the attenuation of light-scattering effects of the pseudopodal cytoplasm. On the contrary, the efficiency of excitation and emission of fluors in pseudopodia and near the forming phagosome was increased [17]. The elimination of the possibility that an optical effect decreased the fluo4 signal was confirmed by the use of a non-Ca2+ sensitive fluor (fluorescein) conjugated to zymosan, and unlike fluo4-zymosan, the intensity of the fluorescein was not significantly reduced when internalised (Figure 2b,c).
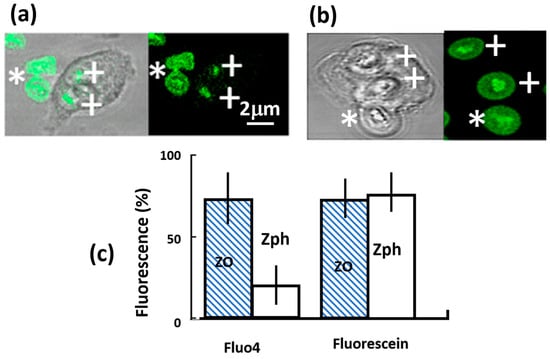
Figure 2.
Comparison of fluorescein and fluo4-coupled zymosan particles. In (a,b), the phase contrast and corresponding fluorescent images are shown for (a) fluo4-coupled zymosan and (b) fluorescein-coupled zymosan. Both sets of images show the internalised particles, marked by a “+” and external particles by a “*”. (c) The quantitation of fluorescence from fluo4 and fluorescein particles either outside the cell (ZO) or inside a phagosome (Zph). The fluorescence units were arbitrary but were comparable, as measurements were taken from the same microscopic fields with the same excitation strength and detection sensitivity. The bars show the mean and the vertical line shows the range for at least 50 determinations.
Other possible causes of the reduced emission of phagosomal fluo4 were also excluded (Figure 3b). Changes in the phagosomal pH caused by activation of the oxidase/proton pump system [20] have been shown to cause a small reduction (approx. 10%) in the fluorescence of non-Ca2+-sensing but pH-sensitive probe FITC-zymosan at the time when the fluo4-zymosan fluorescence is almost zero. At longer times, when the intra-phagosomal pH falls significantly, a similar reduction in fluorescence of intra-phagosomal fluo4-zymosan has also been observed. This, however, has only been evident at longer times after internalisation (5–10 min), when the intra-phagosomal pH decreased significantly, stabilising at about pH 5 after 15–20 min [19]. Interestingly, the intensity of the fluo4-zymosan core was often seen to increase at low pH (Figure 3b). Thus, these effects of pH cannot account for the decrease in fluo4 fluorescence observed within 0–30 s after internalisation. It was thus concluded that pH changes could not explain the decrease in intra-phagosomal fluo4 signal.
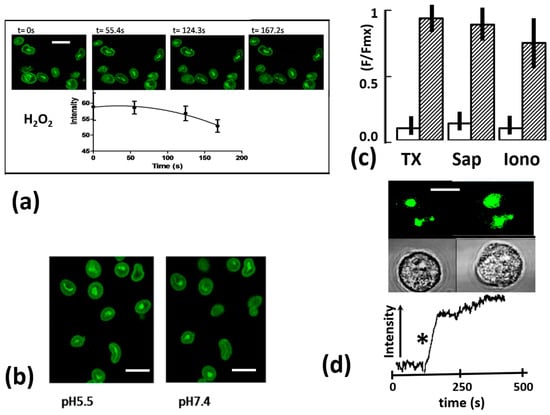
Figure 3.
The effect of experimental manipulations on fluo4-zymosan fluorescence. (a) The effect of H2O2 on fluo4-zymosan fluorescence incubated for the lengths of time shown. The top panel shows a typical experiment and the graph below shows the combined data from 3 separate experiments (n = 100 particles). The bars show the S.E.M. for the 3 experiments. (b) A typical experiment demonstrating the effect of acidification on fluo4-zymosan-fluorescence at the pH shown. In repeat experiments, fluo4 intensity in the zymosan periphery was reduced by 8.5 ± 0.7% and the core increased by 2.2 ± 1.9% when the pH was reduced from 7.5 to 5.5 (mean ± sem., n = 25). (c) The intensity of fluo4-zymosan within the phagosome (open bars) and after treatment (cross-hatched bars). The pair marked “TX” is before and after TritonX-100 (0.1%) treatment; the pair marked “Sap” is before and after saponin (10% w/v) treatment; the pair marked “Iono” is for the same zymosan particles before and after the addition of ionomycin (1 μM). In each case, the bars show the mean and the vertical lines the range of replicate experiments for 5 experiments. (d) The time course of the change in fluo4-zymosan intensity after the addition of ionomycin, with the asterisk indicating the time point at which ionomycin was added and the images above the same cell depicting two fluo4-zymosan particles before and after ionomycin treatment. The scales bars on each image represents 2 μm.
2.3. Phagosomal Fluo4 Signal Decrease Not Due to Oxidants
In addition to pH changes, the intra-phagosome environment is exposure to oxidants, notably short-lived superoxide which forms semi-stable hydrogen peroxide. These are generated by activation of the phagosomal oxidase at the phagosomal membrane [21]. The oxidative effect of H2O2 produced is enhanced by myeloperoxidase, a lysosomal enzyme in azurophilic granules of the neutrophil which are released into the phagosome by fusion with the phagosome. We have previously used zymosan-conjugated dichlorodihydrofluorescein (DCDHF) as an indicator of intraphagosomal oxidants [22], and have shown that the oxidation within the phagosome begins after phagosomal closure and continues with similar kinetics to those of the fluo4 intensity decreased reported here. However, no immediate in vitro effect of H2O2 and myeloperoxidase was observed and fluo4 zymosan intensity was not significantly reduced before approx. 100 s of contact (Figure 3a). Even by 100 s, the intensity was reduced only be approx. 15%. It was thus concluded that intra-phagosomal oxidation could not account for the decrease in fluo4-zymosan intensity observed during phagocytosis. It should also be noted that fluorescein (a chemically related molecule) was also resistant to the bleaching effect of the intra-phagosomal environment as it remained at the same brightness whether outside or inside the phagosome (Figure 2b).
2.4. Phagosomal Fluo4 Zymosan Remained Responsive to Ca2+ Changes
In order to test whether fluo4 attached to zymosan remained responsive to Ca2+ after contact with the intra-phagosomal environment, three approaches were adopted. The first approach was simply to liberate the zymosan particle from within the phagosome by lysis of the cells with Triton X-100 in order to allow contact of the released particles with the extracellular high Ca2+ (1.3 mM). This procedure significantly increased the fluorescent signal, consistent with retained Ca2+ sensitivity (Figure 3c). As Triton X-100 destroyed the cell morphology, this approach could not be undertaken during single cell imaging. Instead, cell populations were mixed with zymosan particles and centrifuged to bring the particles and cells in close contact, and then, after 5 min at 37 °C, they were resuspended and three cycles of sedimentation at 1 g were used to separate free zymosan particles from cell-associated zymosan. The resultant cell pellet was sampled for imaging to confirm that all zymosan particles were within phagosomes and their fluorescence intensities were measured. Triton X-100 was then added to a portion of the cell pellet and sampled for imaging to confirm that no zymosan particles were within phagosomes and their fluorescence intensity was measured. There was a highly significant increase in the fluorescence intensity of the zymosan after Triton X-100 treatment (Figure 3c). These data are consistent with retention of Ca2+ sensitivity by the phagosomal fluo4-zymosan particles, and when released into the high-Ca2+ extracellular environment, their fluorescence increased. The second approach was to use saponin (digitonin), a plant detergent-like molecule that selectively permeabilizes the cell membranes [23] and collapses the transmembrane Ca2+ gradient, to saturate the intracellular fluorescent Ca2+ indicators with Ca2+ [24] but leave the cell morphology recognisable [23]. Saponin permeabilisation significantly increased the fluorescent signal from fluo4-zymosan within phagosomes (Figure 3c), confirming that after phagocytosis, fluo4-zymosan retained its Ca2+ sensitivity. However, in both the previous approaches, the intra-phagosomal fluo4 zymosan particles were exposed to high concentrations of Ca2+. A third approach was therefore also adopted to exclude the possibility of fluo4 remaining only weakly sensitive to Ca2+ and responding to only high Ca2+. The third approach was to artificially elevate cytosolic Ca2+ using a Ca2+ ionophore, ionomycin. Elevation of cytosolic Ca2+ by ionomycin caused a significant increase in fluo-4 fluorescence from particles within the phagosomes (Figure 3c,d). This was consistent with the increase in intra-phagosomal Ca2+ detected by the functional Ca2+ probe whilst within the phagosome. The kinetics of the intra-phagosomal Ca2+ increase also suggest that the Ca2+ channels on the phagosomal membrane were open. However, it cannot be excluded that ionomycin partitioned across all intracellular membranes and that Ca2+ entered the phagosome via this route. Whatever the mechanism for the increase in intra-phagosomal Ca2+, the effect show that the intra-phagosomal fluo4 remained sensitive to physiological changes in Ca2+ concentration. It was thus concluded that the decrease in fluo4 intensity during phagocytosis was the result of a decrease in intra-phagosomal Ca2+ concentration from an initially saturating concentration of Ca2+ (probably the extracellular concentration of 1.3 mM) to the cytosolic Ca2+ concentration (approx. 100 nM).
2.5. Kinetics of Intra-Phagosomal Ca2+ Decrease
By monitoring the intensity of fluo4-zymosan particles during internalisation by the phagocyte, the relationship of the decrease in intra-phagosomal Ca2+ with the stages of phagocytosis were established. On engaging the zymosan particle, the cells form a “phagocytic cup” at the base of the zymosan, and the “cup” then extends until the particle is enclosed within the phagosome [1,25]. Although the time of contact of the particle with the cell could be determined, the exact time of complete phagosome closure was more difficult to establish but could be estimated within a few frames (about 0.2–0.5 s) from phase contrast imaging. At the time of phagosome closure, the intensity of fluo4-zymosan was unchanged and equal to free zymosan particles in high Ca2+ (1.3 mM). However, within 5–10 s of closure (6.3 ± 1.7 s: mean ± sd; n = 14), the intensity of the internalised fluo4-zymosan particles abruptly decreased, reaching its low equilibrium level within 20 s (Figure 4 and Movie S1). Presumably, the high (millimolar) phagosomal Ca2+ at the time of phagosome closure leaked out of the phagosome into the cytosol during this time. Based on knowledge of the phagosome water volume, it can be estimated that the phagosome initially contained about 2 × 10⁷ Ca2+ ions, and thus that it was lost at an average rate of about 106 ions/s over 20 s to reduce this to the cytosolic concentration of c.100 nM. From the time when phagosomal Ca2+ was reduced to below the fluo4 saturation level (10 μM), there was an approximately linear decrease in fluo4 intensity equivalent to a decrease in intra-phagosomal Ca2+ of from 10 μM to 0.1 μM over 5 s, with an approximate half time (t1/2) of 2.6 s ± 0.3 s S (mean ± sd; n = 14). This was slower that the initial rate of loss expected if the outward leak had been driven by the Ca2+ concentration gradient across the phagosomal membrane. In this phase, Ca2+ ions would have crossed the phagosomal membrane at a rate of about 0.2 × 10⁴ Ca2+ ions/s. Although which Ca2+ leak pathways were responsible for the decrease in intraphagosomal Ca2+ was not established here, TRPM2 Ca2+ channels are found on phagosomes [26] and carry currents of about 1 pA in neutrophils [27] or about 107 ions/s, suggesting that only a few of these channels need to be open on the phagosome membrane to lower the intraphagosomal Ca2+ concentration at the rates observed (e.g., 5 channels each open for 0.2 s would drain the phagosomal Ca2+ from 1.3 mM to 10 μM in 2 s). It is thus possible that that plasma membrane Ca2+ channels opened by the phagocytic stimulus, which gives rise to the well-documented large phagocytic cytosolic Ca2+ signal [1,2,22,25], remain open in the phagosomal membrane and thus “drain” the enclosed phagosome of its Ca2+.
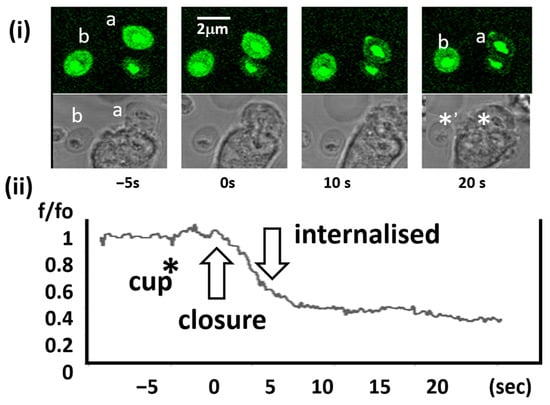
Figure 4.
Changes in fluo4-zymosan intensity during phagocytosis. (i) Fluorescence and phase contrast images of the time sequence of a neutrophil as it internalises a zymosan particle. The particle that is internalised is labelled (a) and (b) is the “control” particle, which remains external. Each image shows the progress of phagocytosis at the times indicated. The location of particles a.b are indicated on the phase contrast image as * and *’ respectively. (ii) The lower graph shows the complete time sequence of the decrease in fluo4-zymosan intensity with key events (cup formation, closure of the phagosome, and internalisation) marked. The sequence is typical of at least 14 other phagocytotic events. The movie in the Supplementary Materials (Movie S1) shows a different experiment, in which a similar complete process of phagocytosis and the accompanying decrease in fluo4-zymosan fluorescence can be seen.
2.6. Subcellular Location of Ca2+ Leakage Pathways
In order to test the conclusion that a Ca2+ leak occurred across the phagosomal membrane, the translocation of the YFP-tagged C2 domain of PKC-γ (YFP–C2-γ) from the cytosol to the plasma membrane was used as a real-time spatial marker of Ca2+ influx [28,29]. However, as human neutrophils cannot be transfected, a phagocytic cell line, RAW 264.7 macrophages, were used. Although it is not entirely satisfactory to extrapolate results from a mouse macrophage cell line to human neutrophils, RAW cells are phagocytic and also show the same decrease in intraphagosomal Ca2+ as demonstrated in neutrophils. These cells thus provided a useful model on which to test the previous conclusion. In this cell line, the translocation of YFP–C2-γ to the plasma membrane has been shown to be driven by an influx of Ca2+ ions from the extracellular medium [30]. This was achieved by opening store-operated Ca2+ channels (using thapsigargin) and then correlating YFP–C2-γ translocation with pulses of extracellular Ca2+ applied experimentally [31]. When presented with mouse C3bi-opsonised-zymosan (without fluorescence tags), translocation of YFP–C2-γ to the plasma membrane was observed after phagocytic cup formation, reflecting the large cytosolic Ca2+ signal expected to accompany phagocytosis. There was also an initial localised translocation of YFP–C2-γ to the phagocytic cup, indicating that Ca2+ leakage pathways were open in this membrane (Figure 5a—1 s). Within the next second (labelled “2 s” in Figure 5a), translocation of YFP–C2-γ was observed at all plasma membrane locations (Figure 5a—2 s). Translocation of YFP–C2-γ to the plasma membrane was observed in all cells undergoing phagocytosis, and localised translocation to the phagocytic cup was observed before the global translocation in 4 out of 15 cells. The rapid opening of Ca2+ channels remote from the phagocytic site explains the difficulty in observing localised cytosolic Ca2+ increases during phagocytosis, as the global open Ca2+ channels overwhelmed the effect of a localised influx of Ca2+ [22]. Clearly, Ca2+ leakage occurs on the forming phagosome after phagosome closure. In the example shown, the cell also contained a previously formed phagosome (Figure 5b, marked “x”) that initially had no YFP–C2-γ on its surface, indicating the absence of a Ca2+ flux from the phagosome. However, when the cytosolic Ca2+ signal was triggered by the second phagocytotic event, it was seen that YFP–C2-γ also translocated to the membrane of the previous phagosome (especially obvious at 20 s, in Figure 5c). This can be explained by either (i) the Ca2+ leakage pathways on the previously formed phagosome remaining open, so that the elevated cytosolic Ca2+ began to refill the previously drained phagosome that began leaking out (detected by YFP–C2-γ translocation), or (ii) closed physiological Ca2+ channels being re-opened as result of diffusible Ca2+ channel-opening stimuli (e.g., IP3). Thus, the use of YFP–C2-γ demonstrates that Ca2+ leakage pathways from the forming phagosome were open during phagosome formation and remained open (or, for physiological Ca2+ channels, remained operational) after phagosome closure.

Figure 5.
Sites of Ca2+ influx marked by YFP-tagged C2 domain of PKC-γ. (a) A sequence of images of a RAW 264.7 cell expressing YFP–C2-γ. The phagocytic target is indicated by the crosshatched circle. At time zero (as indicated), a phagocytic cup formed at the base of the zymosan without translocation of YFP–C2-γ from the cytosol. After 1 s, translocation of YFP–C2-γ from the cytosol to the plasma membrane of the phagocytic cup is seen. This is also shown in the enlarged image (b). At 2 s, translocation of YFP–C2-γ to the phagocytic cup and the rest of the plasma membrane is obvious, as can also be seen in the image marked “3 s”. (b) Enlarged images showing a previous old phagosome marked by an “X”, which has no translocated YFP–C2-γ on its membrane at 1 s, but in the lower image at 2 s, some translation had occurred. In image (c) at 20 s, translocation of YFP–C2-γ had remained globally on the plasma membrane and can also be seen more clearly on the previously internalised phagosome. (d) The time course of the relative intensity changes measured at time t (It) as a fraction of the intensity at time zero (I0), measured within the measurements zones indicated at the plasma membrane (PM) and cytosol (within the box) indicated in (e).
3. Discussion
The results presented in this paper show that an open phagosome entraps extracellular Ca2+ that “empties” into the cytosol once the phagosome has closed. The concentration of phagosomal Ca2+ within the phagocyte equilibrates with the cytosolic Ca2+ within 20 s of phagosome closure. This sequence is shown as a cartoon (Figure 6). Thus, the phagosome cannot act as a long-term store of Ca2+ for later signalling events. Also, it cannot act as a reservoir for loading lysosomes with Ca2+ for other signalling events [30]. The rapid decrease in intra-phagosomal Ca2+ was reported over 20 years ago by Dahlgren’s group, who monitored Ca2+ in a similar way to that described here but using fura2 as the Ca2+ reporter. Although fura2 was bleached during the experiments (both 340 and 380 nm decreasing), the group found that the intra-phagosomal Ca2+ level dropped rapidly. Little notice has been given to this early observation, which is confirmed (and extended) here. However, Anke et al. [26] more recently showed that in phagosomes from phagocytes taken from Trpm2−/− mice, i.e., lacking the TRPM2 Ca2+ channel, intra-phagosomal Ca2+ increased slowly (over a 10 min time period) compared to the intra-phagosomal Ca2+ in phagosomes expressing TRPM2. They suggested that the phagosomes devoid of TRPM2 lacked a leakage channel and thus Ca2+ accumulated within the phagosome, presumably as a result of plasma membrane Ca2+ pumps. The conclusion that open Ca2+ channels on the phagosomal membrane are responsible for the loss of intraphagosomal Ca2+ cellular is similar to that which was drawn from the data shown here.
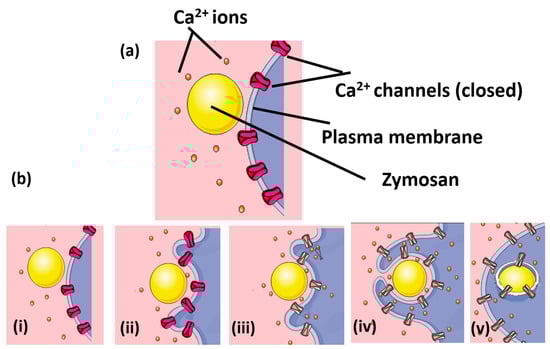
Figure 6.
Proposed sequence of Ca2+ channel opening on the phagosomal membrane. (a) A “cartoon” of some of the components of the proposed model system. The phagocyte plasma membrane with Ca2+ ion channels (closed) before contact with the phagocytic target (zymosan particle) and Ca2+ ions is labelled. (b) The proposed sequence of events during phagocytosis are shown as follows. (i) Before contact between the phagocyte and the target, where the cytosolic free Ca2+ ion concentration is low. (ii) Contact between the particle and the phagocyte, resulting in the formation of a phagocytic cup, with the Ca2+ ion channels remaining closed and the cytosolic free Ca2+ ion concentration still low. (iii) A critical number of receptors are engaged, the Ca2+ channels remain open, and the cytosolic free Ca2+ ion concentration begins to rise. Note that the location of the open Ca2+ channels includes the portion of plasma membrane that forms the base of the forming phagosome and thus provides a mechanism for preferentially elevating Ca2+ near the forming phagosome. (iv) In response to the elevated cytosolic free Ca2+ ion concentration, the pseudopodia around the target nearly enclose it, trapping Ca2+ ions in the forming phagosome. (v) Phagocytosis is complete but Ca2+ channels remain open on the phagosomal membrane, such that intra-phagosomal Ca2+ leaks out into the surrounding cytosol. Once “drained” of Ca2+, the phagosome plays no further role in Ca2+ signalling.
From the work presented here, it seems unlikely that Ca2+ events could be driven by phagosomal Ca2+ close to the time of completion of phagocytosis. However, if the Ca2+ channels closed slowly (over minutes rather than seconds) and the phagosomal membrane contained functional plasma membrane Ca2+ pumps, it is expected that the phagosome would re-load with Ca2+ over a longer time period. The equilibrium generated across the plasma membrane would thus also be generated across the phagosomal membrane. Under these circumstances, phagosomal Ca2+ could be important for driving peri-phagosomal Ca2+ events. The earliest report of such a Ca2+ cloud localised to near the phagosome [32] is usually dismissed as almost certainly an optical artefact caused by the thinner cytoplasm around the pseudopodia that increased the excitation and efficiency in that area [17]. However, the phagosome itself may be a source of Ca2+ that adds to or generates peri-phagosomal Ca2+ events such as Ca2+ hotspots [9,10].
4. Materials and Methods
4.1. Cell Preparation
Human neutrophils, isolated from the blood of healthy volunteers who had given informed consent, as described previously [10], were suspended in Krebs medium (NaCl 120 mM, KCl, 4.9 mM KH2PO4, 1.2 mM MgSO4, 1.2 mM CaCl2, 1.3 mM, HEPES 25 mM, and bovine serum albumin 0.1% adjusted to pH 7.4 with NaOH).
4.2. Properties of the Phagocytic Target
Zymosan particles (killed yeast cells) of approximately ellipsoid shape, having radii in the x, y, and z planes (or semi-axes) of 1:1.5 and 1 μm, were opsonised with iC3b by incubation with human or mouse serum as previously described [11]. The particles have a cell wall enclosing an outer space and a dense central core [12]. The water space in the zymosan-containing phagosome is approximately 50% of the total volume [12], and thus each would contain 6.3 μm3 of extracellular medium (1.3 mM Ca2+). A cadaverine derivative of the fluorescent Ca2+ indicator fluo4 (fluo4 cadaverine (F36201 fluo-4 cadaverine, pentapotassium salt, Molecular Probes; Thermo Scientific, Waltham, MA, USA) was linked to amines in the zymosan particles by carbodiimide linkage using (1-ethyl-3-[3-dimethylaminopropyl]carbodiimide hydrochloride, Thermo Scientific). The reagents were used at 1 mg/mL and incubated with a suspension of zymosan particles at room temperature for 4 h before separation of the reactants from the solid particles by 3 rounds of centrifugation and resuspension in fresh medium to remove the reactants. A similar procedure was used to produce non-Ca2+-sensing fluorescein-linked zymosan particles by reacting the particles with fluorescein isothiocyanate (FITC, Sigma, Livonia, MI, USA) as described previously [33].
4.3. Imaging and Intra-Phagosomal Ca2+ Monitoring
The fluo4-zymosan particles were sedimented onto a glass coverslip mounted onto a thermostatically controlled stage (37 ± 0.1 °C) in Krebs medium. The coverslip was then washed with medium to remove particles that had not made contact with the coverslip and were loosely adhered. Neutrophils were then allowed to adhere to the same glass coverslip during microscopic observation, and a microscopic field was selected in which neutrophils and particles were close and expected to undergo phagocytosis. The field was then imaged using a resonant laser scanning head of the LeicaSP5 confocal inverted microscope (Leica Microsystems, Heidelberg, Germany) and with a 63× objective. Fluorescence (excited by 488 nm laser scanning) and transmitted light (phase contrast images) were acquired simultaneously. Image analysis and presentation were achieved using Image J (v.1.38e) software (https://imagej.nih.gov/ij/, accessed on 2 February 2020).
4.4. Estimation of Intraphagosomal Ca2+ Concentration
The concentration of intra-phagosomal Ca2+ was estimated from the fluorescence intensity of the zymosan particles during the experiment (F). The intensity of zymosan particles outside the cell (Zo) in 1.3 mM Ca2+ was taken as the Ca2+ saturation maximum (Fmax), and the minimum fluorescence (Fmin) was estimated as being the autofluorescence signal from unlabelled zymosan particles, as in the in vitro calibration curves (see Figure 1). Using the kd values from the calibration curves, the intra-phagosomal Ca2+ concentration was estimated using a variant of the standard equation for single-wavelength fluors [24]: Ca2+ = Kd (α − 1)/(β − α), where α = F/Fmin and β = Fmax/Fmin.
4.5. Raw 264.7 Cell Transfection
RAW 264.7 cells were electroporated to introduce the C2-γ-YFP plasmid (3 µg plasmid DNA per 2 × 10⁶ cells) using the Cell Line Nucleofector (Lonza) as described previously [31]. Cells were incubated at 37 °C in 5% CO2 for 3–4 h to enable expression of the newly introduced DNA before imaging on a Leica SP5 confocal microscope. Fluorescent protein expression in transfected RAW 264.7 cells was detected by ~1 h post transfection, but expression was optimal at ~4 h post transfection. The plasmid encoding for C2-γ-YFP was a kind gift from Theodorus W. Gadella (Swammerdam Institute for Life Sciences, University of Amsterdam, the Netherlands).
Supplementary Materials
The following supporting information can be downloaded at: https://www.mdpi.com/article/10.3390/ijms25084254/s1.
Author Contributions
Conceptualization, M.B.H., I.L. and S.D.; methodology, I.L., J.G. and K.J.L.; software, M.B.H.; validation, I.L., M.B.H. and S.D.; formal analysis, J.G., I.L. and M.B.H.; investigation, S.D.; resources, M.B.H.; data curation, M.B.H.; writing—original draft preparation, S.D. and M.B.H.; writing—review and editing, M.B.H.; visualization, I.L., J.G. and K.J.L.; supervision, S.D. and M.B.H.; project administration, M.B.H.; funding acquisition, M.B.H. All authors have read and agreed to the published version of the manuscript.
Funding
This research received no external funding.
Institutional Review Board Statement
The study was conducted in accordance with the Declaration of Helsinki, and approved by the Ethics Committee) of Cardiff School of Medicine (protocol code SMREC10/01 and date of approval 20 January 2010).
Informed Consent Statement
Informed consent was obtained from all subjects involved in the study.
Data Availability Statement
Data are contained within the article and Supplementary Materials.
Acknowledgments
The “cartoon” was constructed using pre-made elements from Servier Medical Art (http://www.servier.fr/servier-medical-art, accessed on 13 February 2024).
Conflicts of Interest
The authors declare no conflict of interest.
References
- Dewitt, S.; Hallett, M.B. Cytosolic free Ca2+ changes and calpain activation are required for beta integrin-accelerated phagocytosis by human neutrophils. J. Cell Biol. 2002, 159, 181–189. [Google Scholar] [CrossRef]
- Nunes, P.; Demaurex, N. The role of calcium signaling in phagocytosis. J. Leuk. Biol. 2010, 88, 57–68. [Google Scholar] [CrossRef] [PubMed]
- Francis, E.A.; Heinrich, V. Single-cell investigation of the role of calcium bursts in human immune cells. Biophys. J. 2017, 112, 400A. [Google Scholar] [CrossRef]
- Jaumouillé, V.; Grinstein, S. Molecular Mechanisms of Phagosome Formation. Microbiol. Spectr. 2016, 4. [Google Scholar] [CrossRef]
- Uribe-Querol, E.; Rosales, C. Phagocytosis: Our current understanding of a universal biological process. Front. Immunol. 2020, 11, 1066. [Google Scholar] [CrossRef] [PubMed]
- Hallett, M.B.; Davies, E.V.; Campbell, A.K. Oxidase activation in individual neutrophils is dependent on the onset and magnitude of the Ca2+ signal. Cell Calcium 1990, 11, 655–663. [Google Scholar] [CrossRef]
- Bei, L.; Hu, T.; Qian, Z.M.; Shen, X. Extracellular Ca2+ regulates the respiratory burst of human neutrophils. Biochim. Biophys. Acta—Mol. Cell Res. 1998, 1404, 475–483. [Google Scholar] [CrossRef] [PubMed]
- Westman, J.; Grinstein, S.; Maxson, M.E. Revisiting the role of calcium in phagosome formation and maturation. J. Leuk. Biol. 2019, 106, 837–851. [Google Scholar] [CrossRef]
- Nunes, P.; Cornut, D.; Demaurex, N. STIM1 juxtaposes ER to phagosomes, generating Ca2+ hotspots that boost phagocytosis. Curr. Biol. 2012, 22, 1990–1997. [Google Scholar] [CrossRef]
- Roberts, R.E.; Vervliet, T.; Bultynck, G.; Parys, J.B.; Hallett, M.B. EPIC3, a novel Ca2+ indicator located at the cell cortex and in microridges, detects high Ca2+ subdomains during Ca2+ influx and phagocytosis. Cell Calcium 2020, 92, 102291. [Google Scholar] [CrossRef]
- Zhang, H.; Clemens, R.A.; Lowell, C.A. STIM1 calcium sensor is required for activation of the phagocyte oxidase during inflammation and host defense. Blood 2014, 123, 2238–2249. [Google Scholar] [CrossRef]
- Guido, D.; Demaurex, N.; Nunes, P. Junctate boosts phagocytosis by recruiting endoplasmic reticulum Ca2+ stores near phagosomes. J. Cell Sci. 2015, 128, 4074–4082. [Google Scholar] [CrossRef] [PubMed]
- Lundqvist-Gustafsson, H.; Gustafsson, M.; Dahlgren, C. Dynamic Ca2+ changes in neutrophil phagosomes. A source for intracellular Ca2+ during phagolysosome formation? Cell Calcium 2000, 27, 353–362. [Google Scholar] [CrossRef]
- Becker, P.L.; Fay, F.S. Photobleaching of fura-2 and its effect on determination of calcium concentrations. Am. J. Physiol. 1987, 253, C613–C618. [Google Scholar] [CrossRef]
- Soto, E.R.; Ostroff, G.R. Characterization of multilayered nanoparticles encapsulated in yeast cell wall particles for DNA delivery. Bioconjug. Chem. 2008, 19, 840–848. [Google Scholar] [CrossRef] [PubMed]
- Gee, K.R.; Brown, K.A.; Chen, W.N.; Bishop-Stewart, J.; Gray, D.; Johnson, I. Chemical and physiological characterization of fluo-4 Ca2+-indicator dyes. Cell Calcium 2000, 27, 97–106. [Google Scholar] [CrossRef]
- Dewitt, S.; Darley, R.L.; Hallett, M.B. Translocation or just location? Pseudopodia affect fluorescent signals. J. Cell Biol. 2009, 184, 197–203. [Google Scholar] [CrossRef] [PubMed]
- Meyer, R.A. Light-scattering from biological cells-dependence of backscatter radiation on membrane thickness and refractive index. Appl. Opt. 1979, 18, 585–588. [Google Scholar] [CrossRef] [PubMed]
- Mie, G. Articles on the optical characteristics of turbid tubes, especially colloidal metal solutions. Ann. Physik 1908, 25, 377–445. [Google Scholar] [CrossRef]
- Mantegazza, A.R.; Savina, A.; Vermeulen, M.; Pérez, L.; Geffner, J.; Hermine, O.; Rosenzweig, S.D.; Faure, F.; Amigorena, S. NADPH oxidase controls phagosomal pH and antigen cross-presentation in human dendritic cells. Blood 2008, 112, 4712–4722. [Google Scholar] [CrossRef]
- Segal, A.W. How neutrophils kill microbes. Ann. Rev. Immunol. 2005, 23, 197–223. [Google Scholar] [CrossRef] [PubMed]
- Dewitt, S.; Laffafian, I.; Hallett, M.B. Phagosomal oxidative activity during β2 integrin (CR3)-mediated phagocytosis by neutrophils is triggered by a non-restricted Ca2+ signal: Ca2+ controls time not space. J. Cell Sci. 2003, 116, 2857–2865. [Google Scholar] [CrossRef] [PubMed]
- Jacob, M.C.; Favre, M.; Bensa, J.C. Membrane cell permeabilization with Saponin and multiparametric flow cytometry. Cytometry 1991, 12, 550–558. [Google Scholar] [CrossRef]
- Hallett, M.B.; Al-Jumaa, M.; Dewitt, S. Optical methods for the measurement and manipulation of cytosolic calcium signals in neutrophils. Methods Mol. Biol. 2014, 1124, 107–120. [Google Scholar] [PubMed]
- Francis, E.A.; Heinrich, V. Mechanistic understanding of single-cell behavior is essential for transformative advances in biomedicine. Yale J. Biol. Med. 2018, 91, 279–289. [Google Scholar]
- Anke, D.; Kiya, T.; Gong, H.; Gao, X.; Malik, A.B. Role of the phagosomal redox-sensitive TRP channel TRPM2 in regulating bactericidal activity of macrophages. J. Cell Sci. 2017, 130, 735–744. [Google Scholar] [CrossRef]
- Starkus, J.G.; Fleig, A.; Reinhold, P. The calcium-permeable non-selective cation channel TRPM2 is modulated by cellular. J. Physiol. 2010, 588, 1227–1240. [Google Scholar] [CrossRef]
- Oancea, E.; Meyer, T. Protein kinase C as a molecular machine for decoding calcium and diacylglycerol signals. Cell 1998, 95, 307–318. [Google Scholar] [CrossRef] [PubMed]
- Teruel, M.N.; Meyer, T. Parallel single-cell monitoring of receptor-triggered membrane translocation of a calcium-sensing protein module. Science 2002, 295, 1910–1912. [Google Scholar] [CrossRef]
- Kilpatrick, B.S.; Eden, E.R.; Schapira, A.H.; Futter, C.F.; Patel, S. Direct mobilisation of lysosomal Ca2+ triggers complex Ca2+ signals. J. Cell Sci. 2013, 126, 60–66. [Google Scholar] [CrossRef]
- Roberts, R.E.; Martin, M.; Marion, S.; Elumalai, G.L.; Lewis, K.; Hallett, M.B. Ca2+-activated cleavage of ezrin visualised dynamically in living myeloid cells during cell surface area expansion. J. Cell Sci. 2020, 133, jcs236968. [Google Scholar] [CrossRef] [PubMed]
- Sawyer, D.W.; Sullivan, J.A.; Mandell, G.L. Intracellular free calcium localization in neutrophils during phagocytosis. Science 1985, 230, 663–666. [Google Scholar] [CrossRef] [PubMed]
- Morris, M.R.; Dewitt, S.; Laffafian, I.; Hallett, M.B. Phagocytosis by inflammatory phagocytes: Experimental strategies for stimulation and quantification. Methods Mol. Biol. 2003, 225, 35–46. [Google Scholar] [PubMed]


Disclaimer/Publisher’s Note: The statements, opinions and data contained in all publications are solely those of the individual author(s) and contributor(s) and not of MDPI and/or the editor(s). MDPI and/or the editor(s) disclaim responsibility for any injury to people or property resulting from any ideas, methods, instructions or products referred to in the content. |
© 2024 by the authors. Licensee MDPI, Basel, Switzerland. This article is an open access article distributed under the terms and conditions of the Creative Commons Attribution (CC BY) license (https://creativecommons.org/licenses/by/4.0/).