
Effects of Reduced Extracellular Sodium Concentrations on Cisplatin Treatment in Human Tumor Cells: The Role of Autophagy

 , and
, and 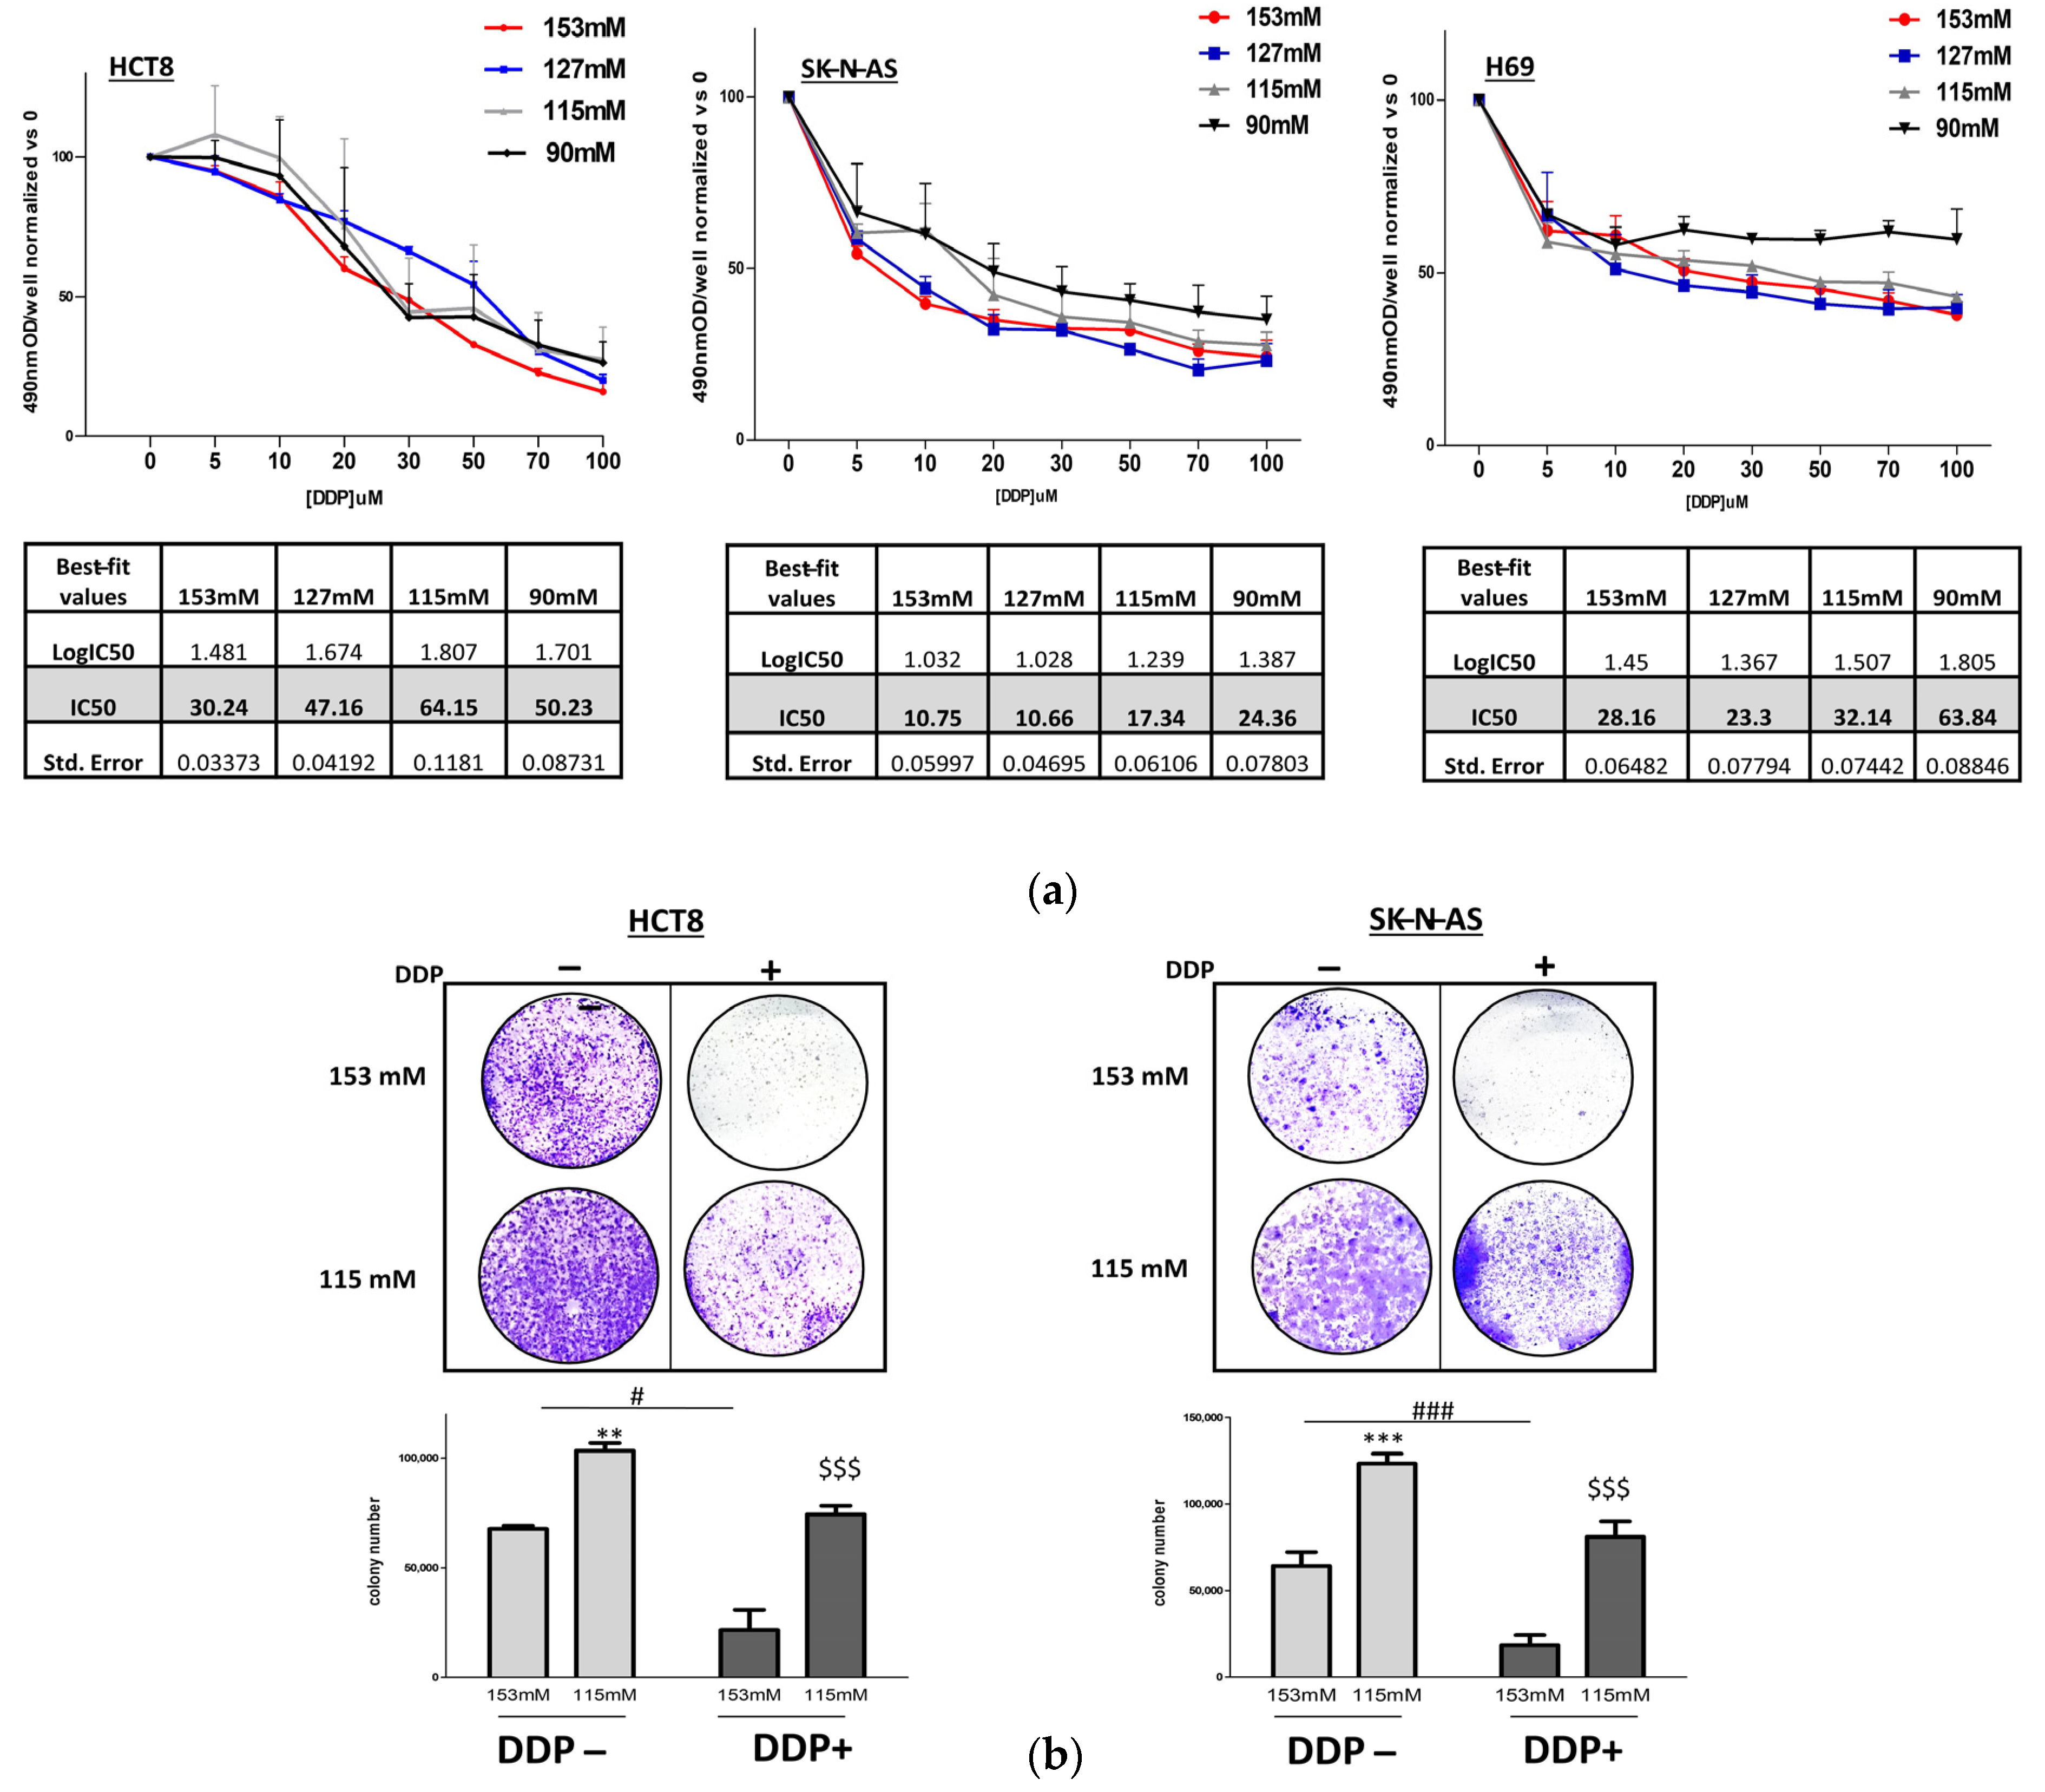
Abstract
1. Introduction
2. Results
2.1. DDP and Cancer Cell Proliferation in Low Extracellular [Na+]
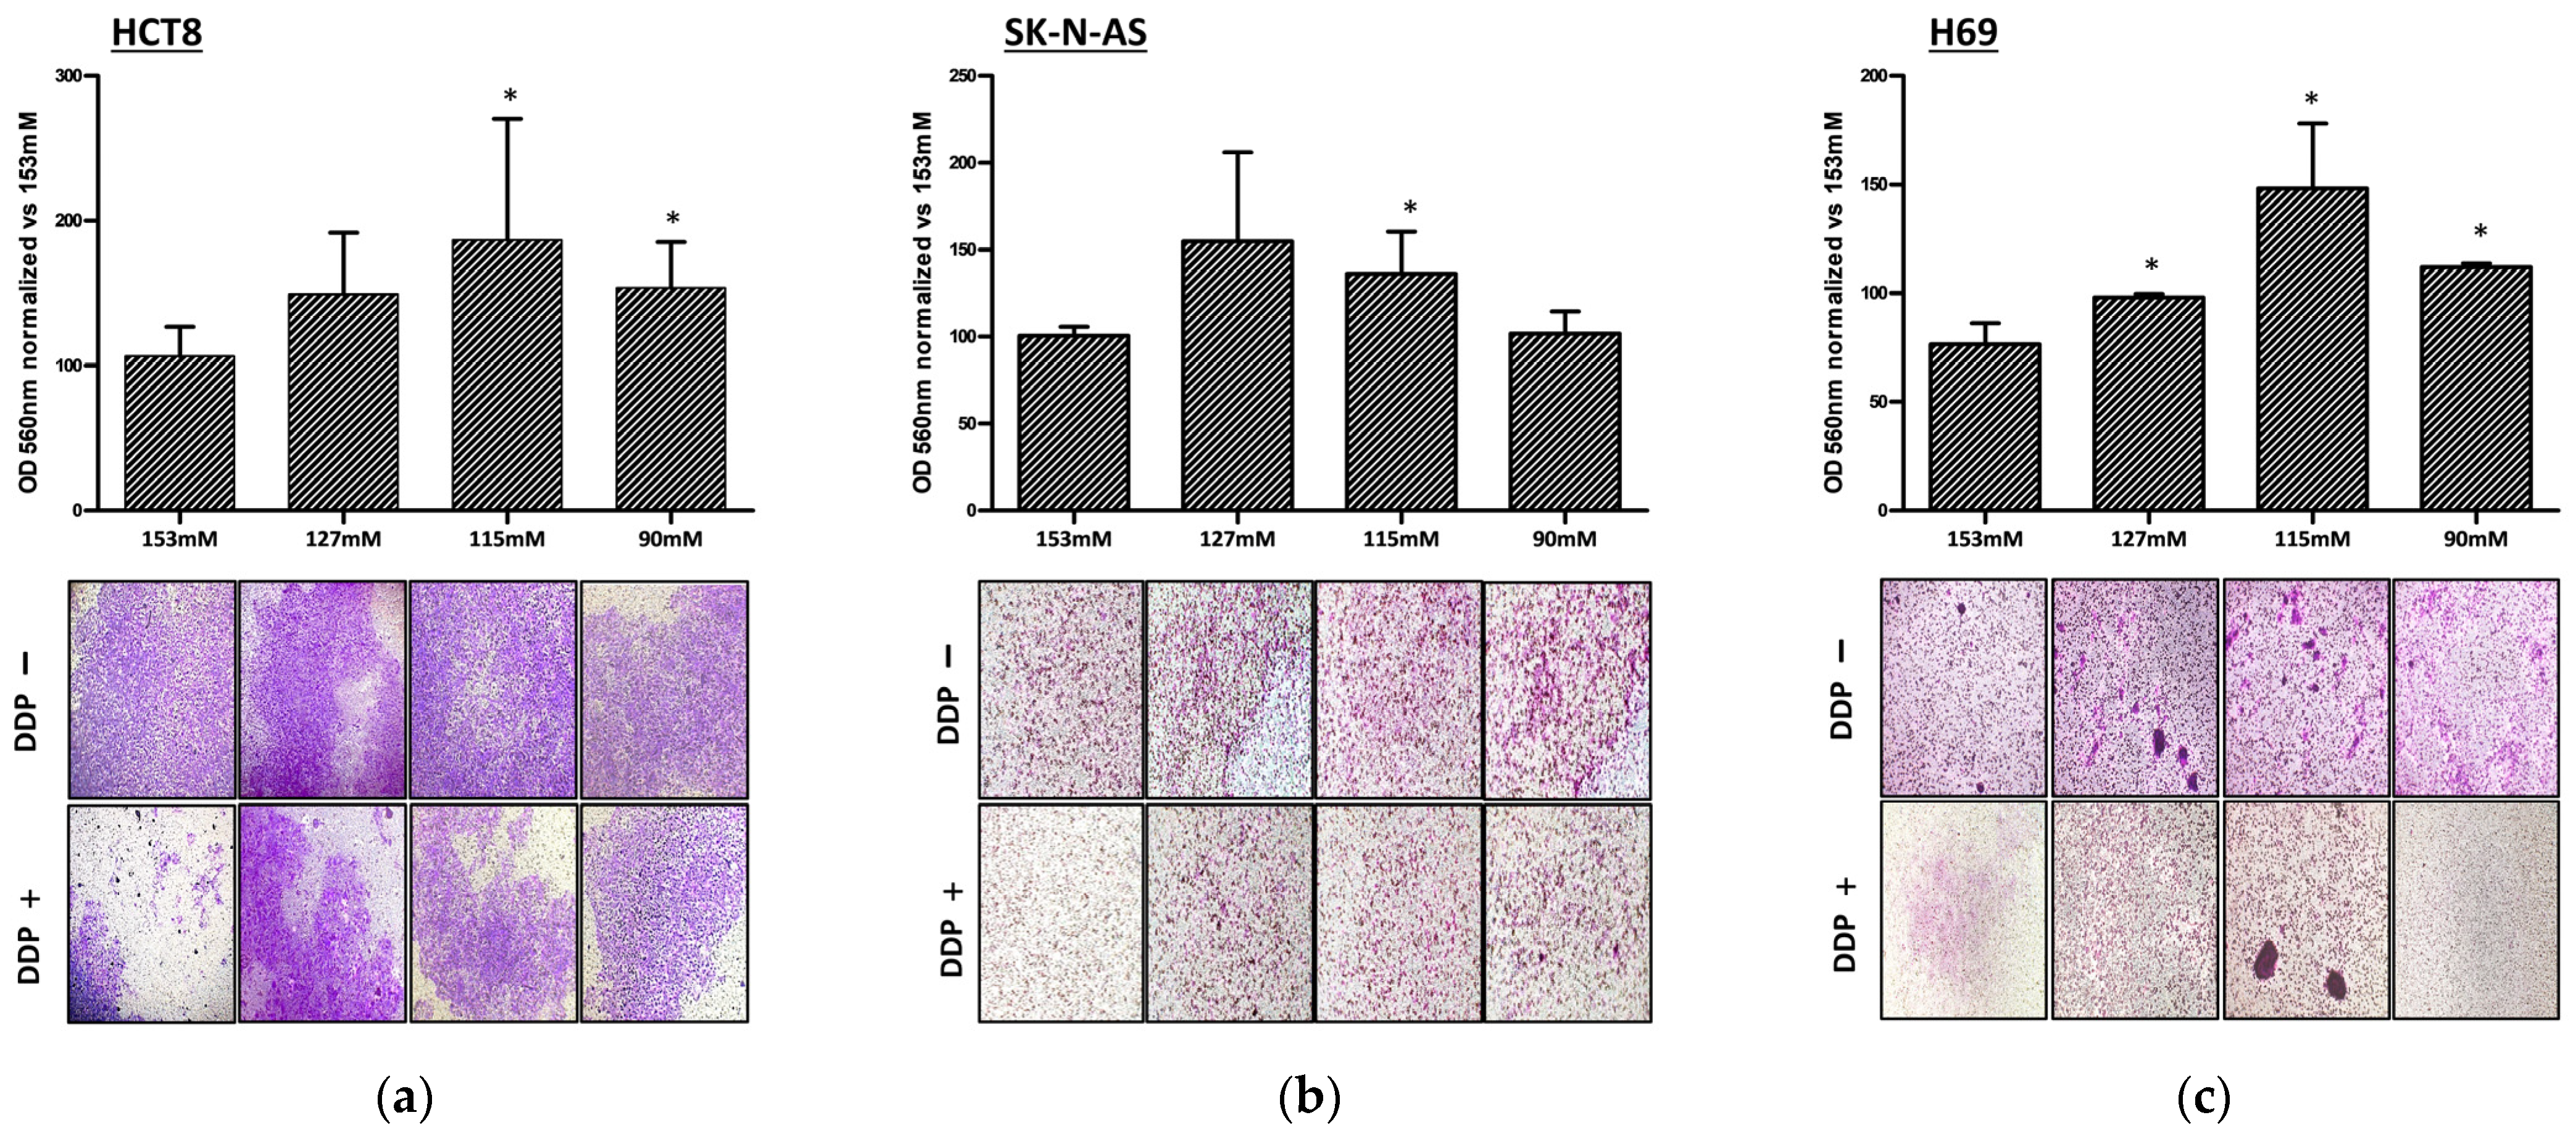
2.2. DDP and Cancer Cell Invasion in Low Extracellular [Na+]
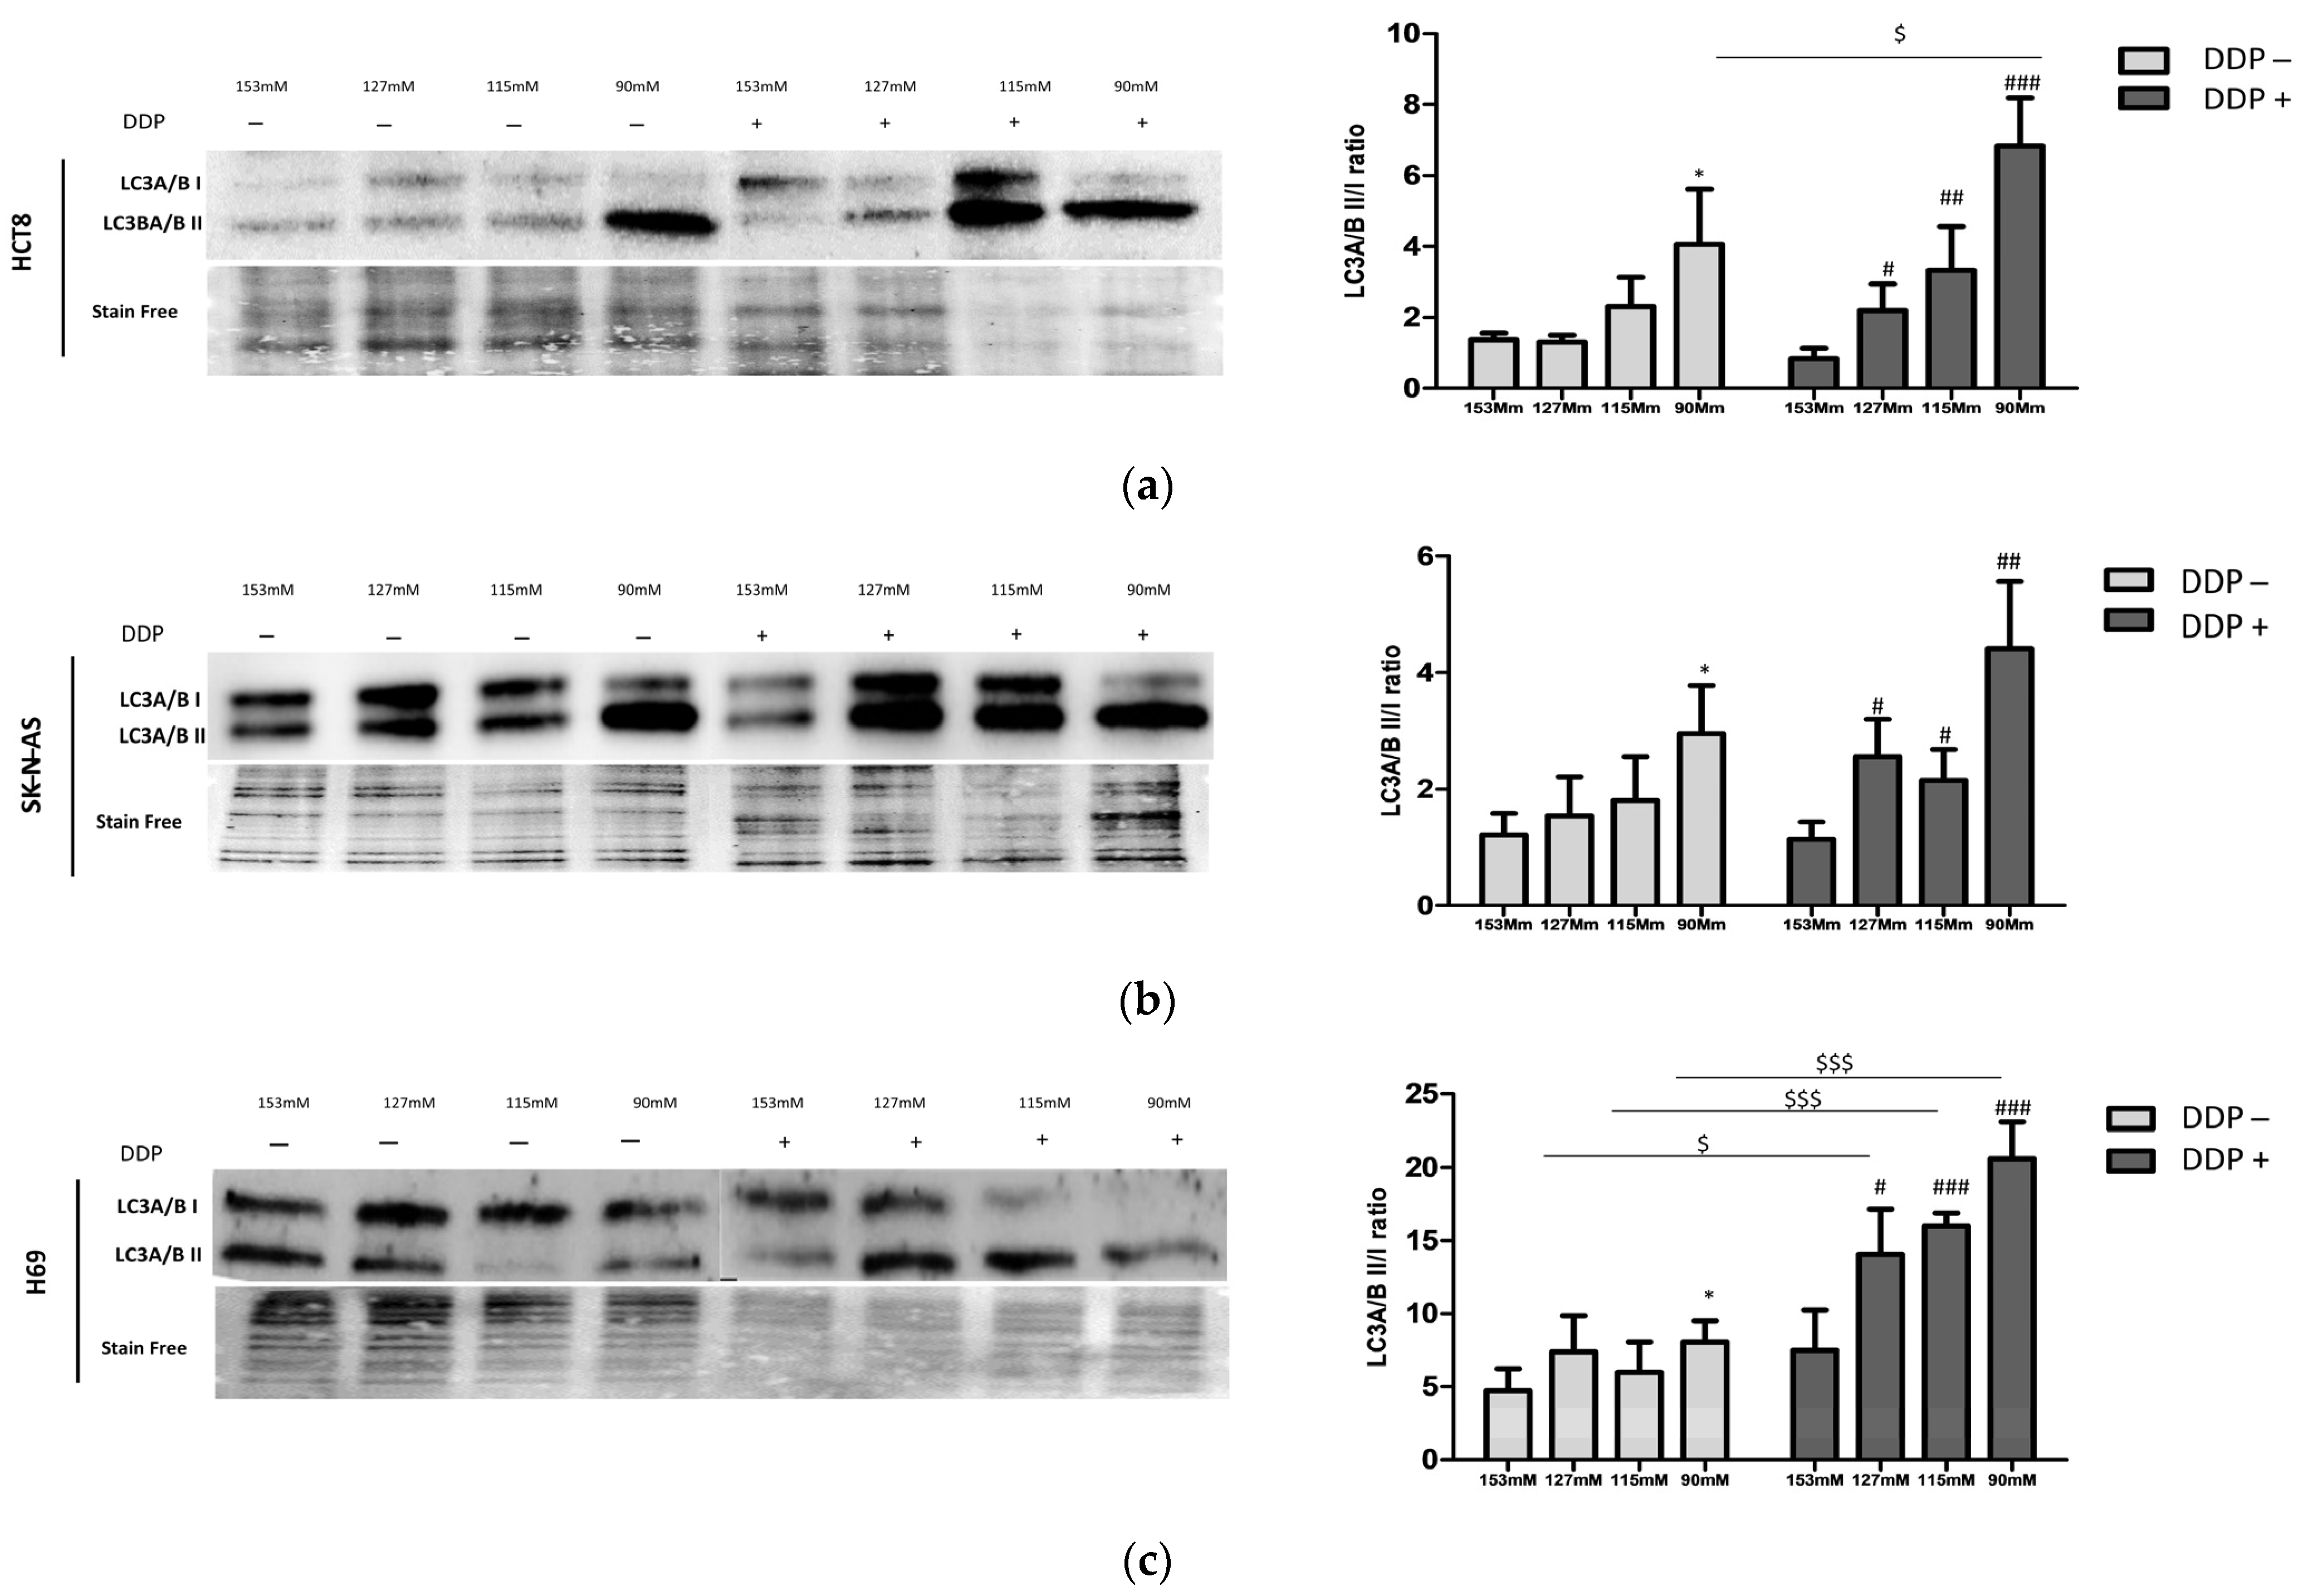
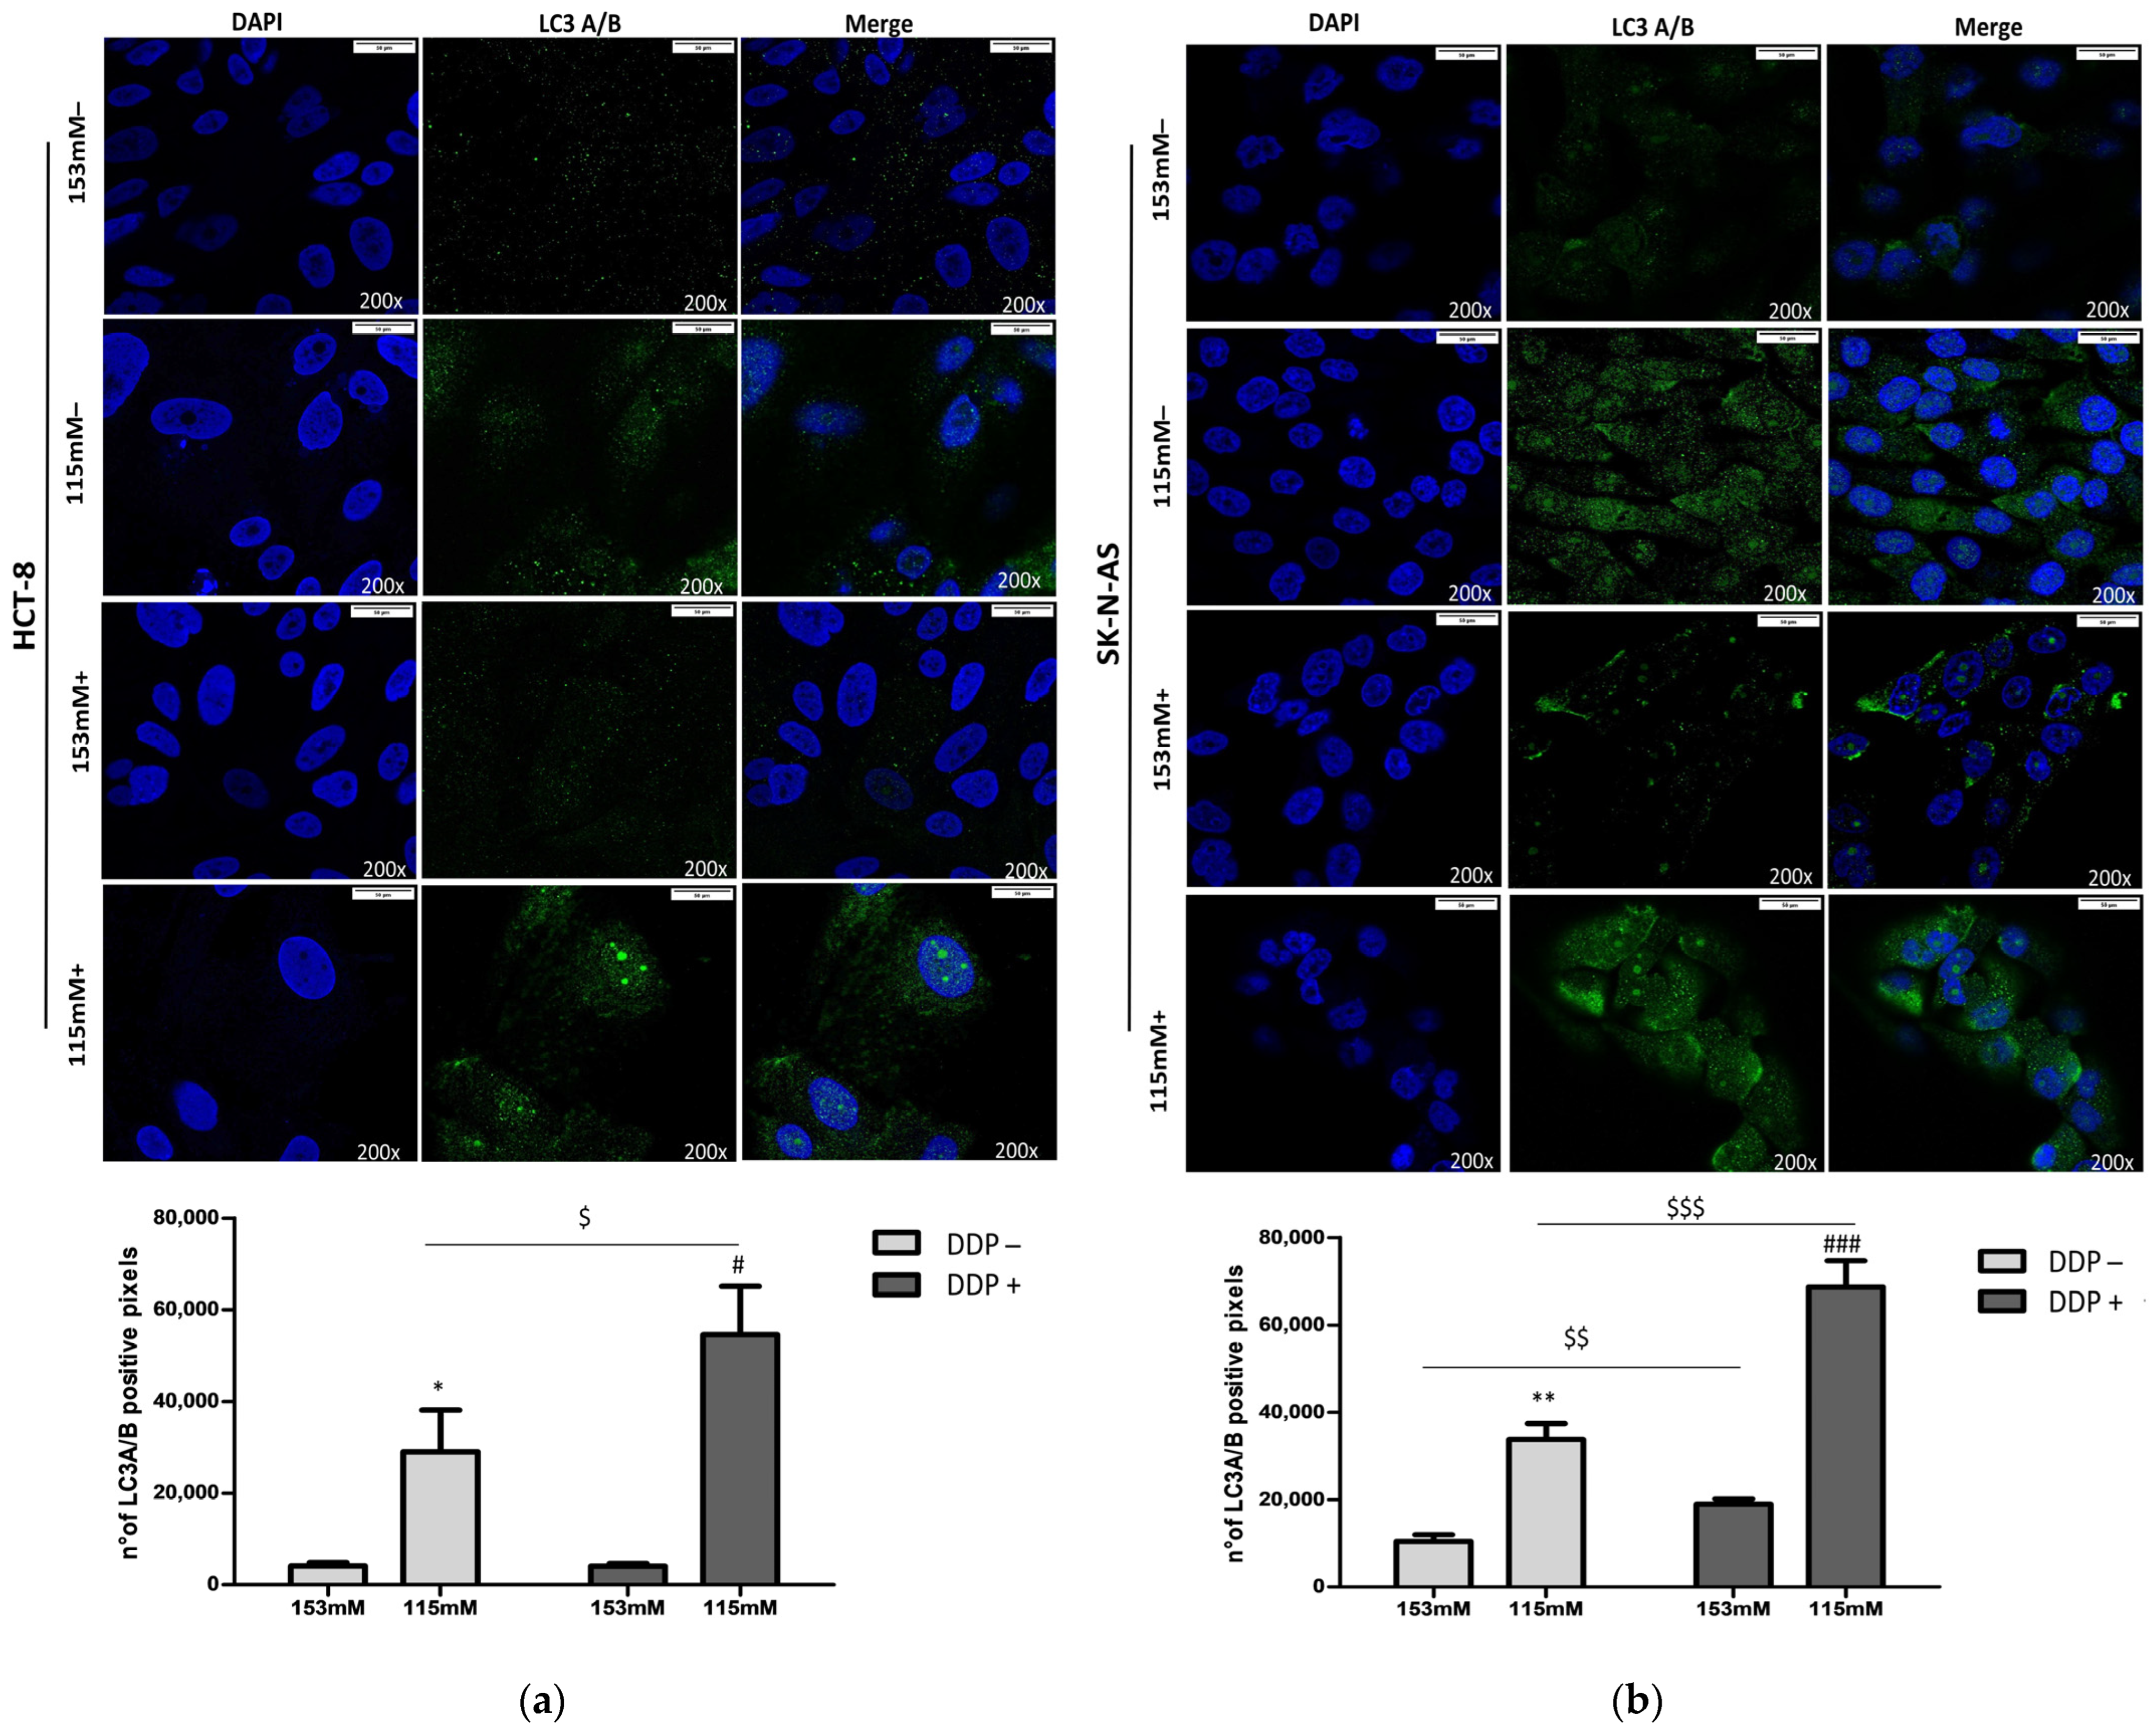
2.3. DDP and LC3 Expression in Low Extracellular [Na+]
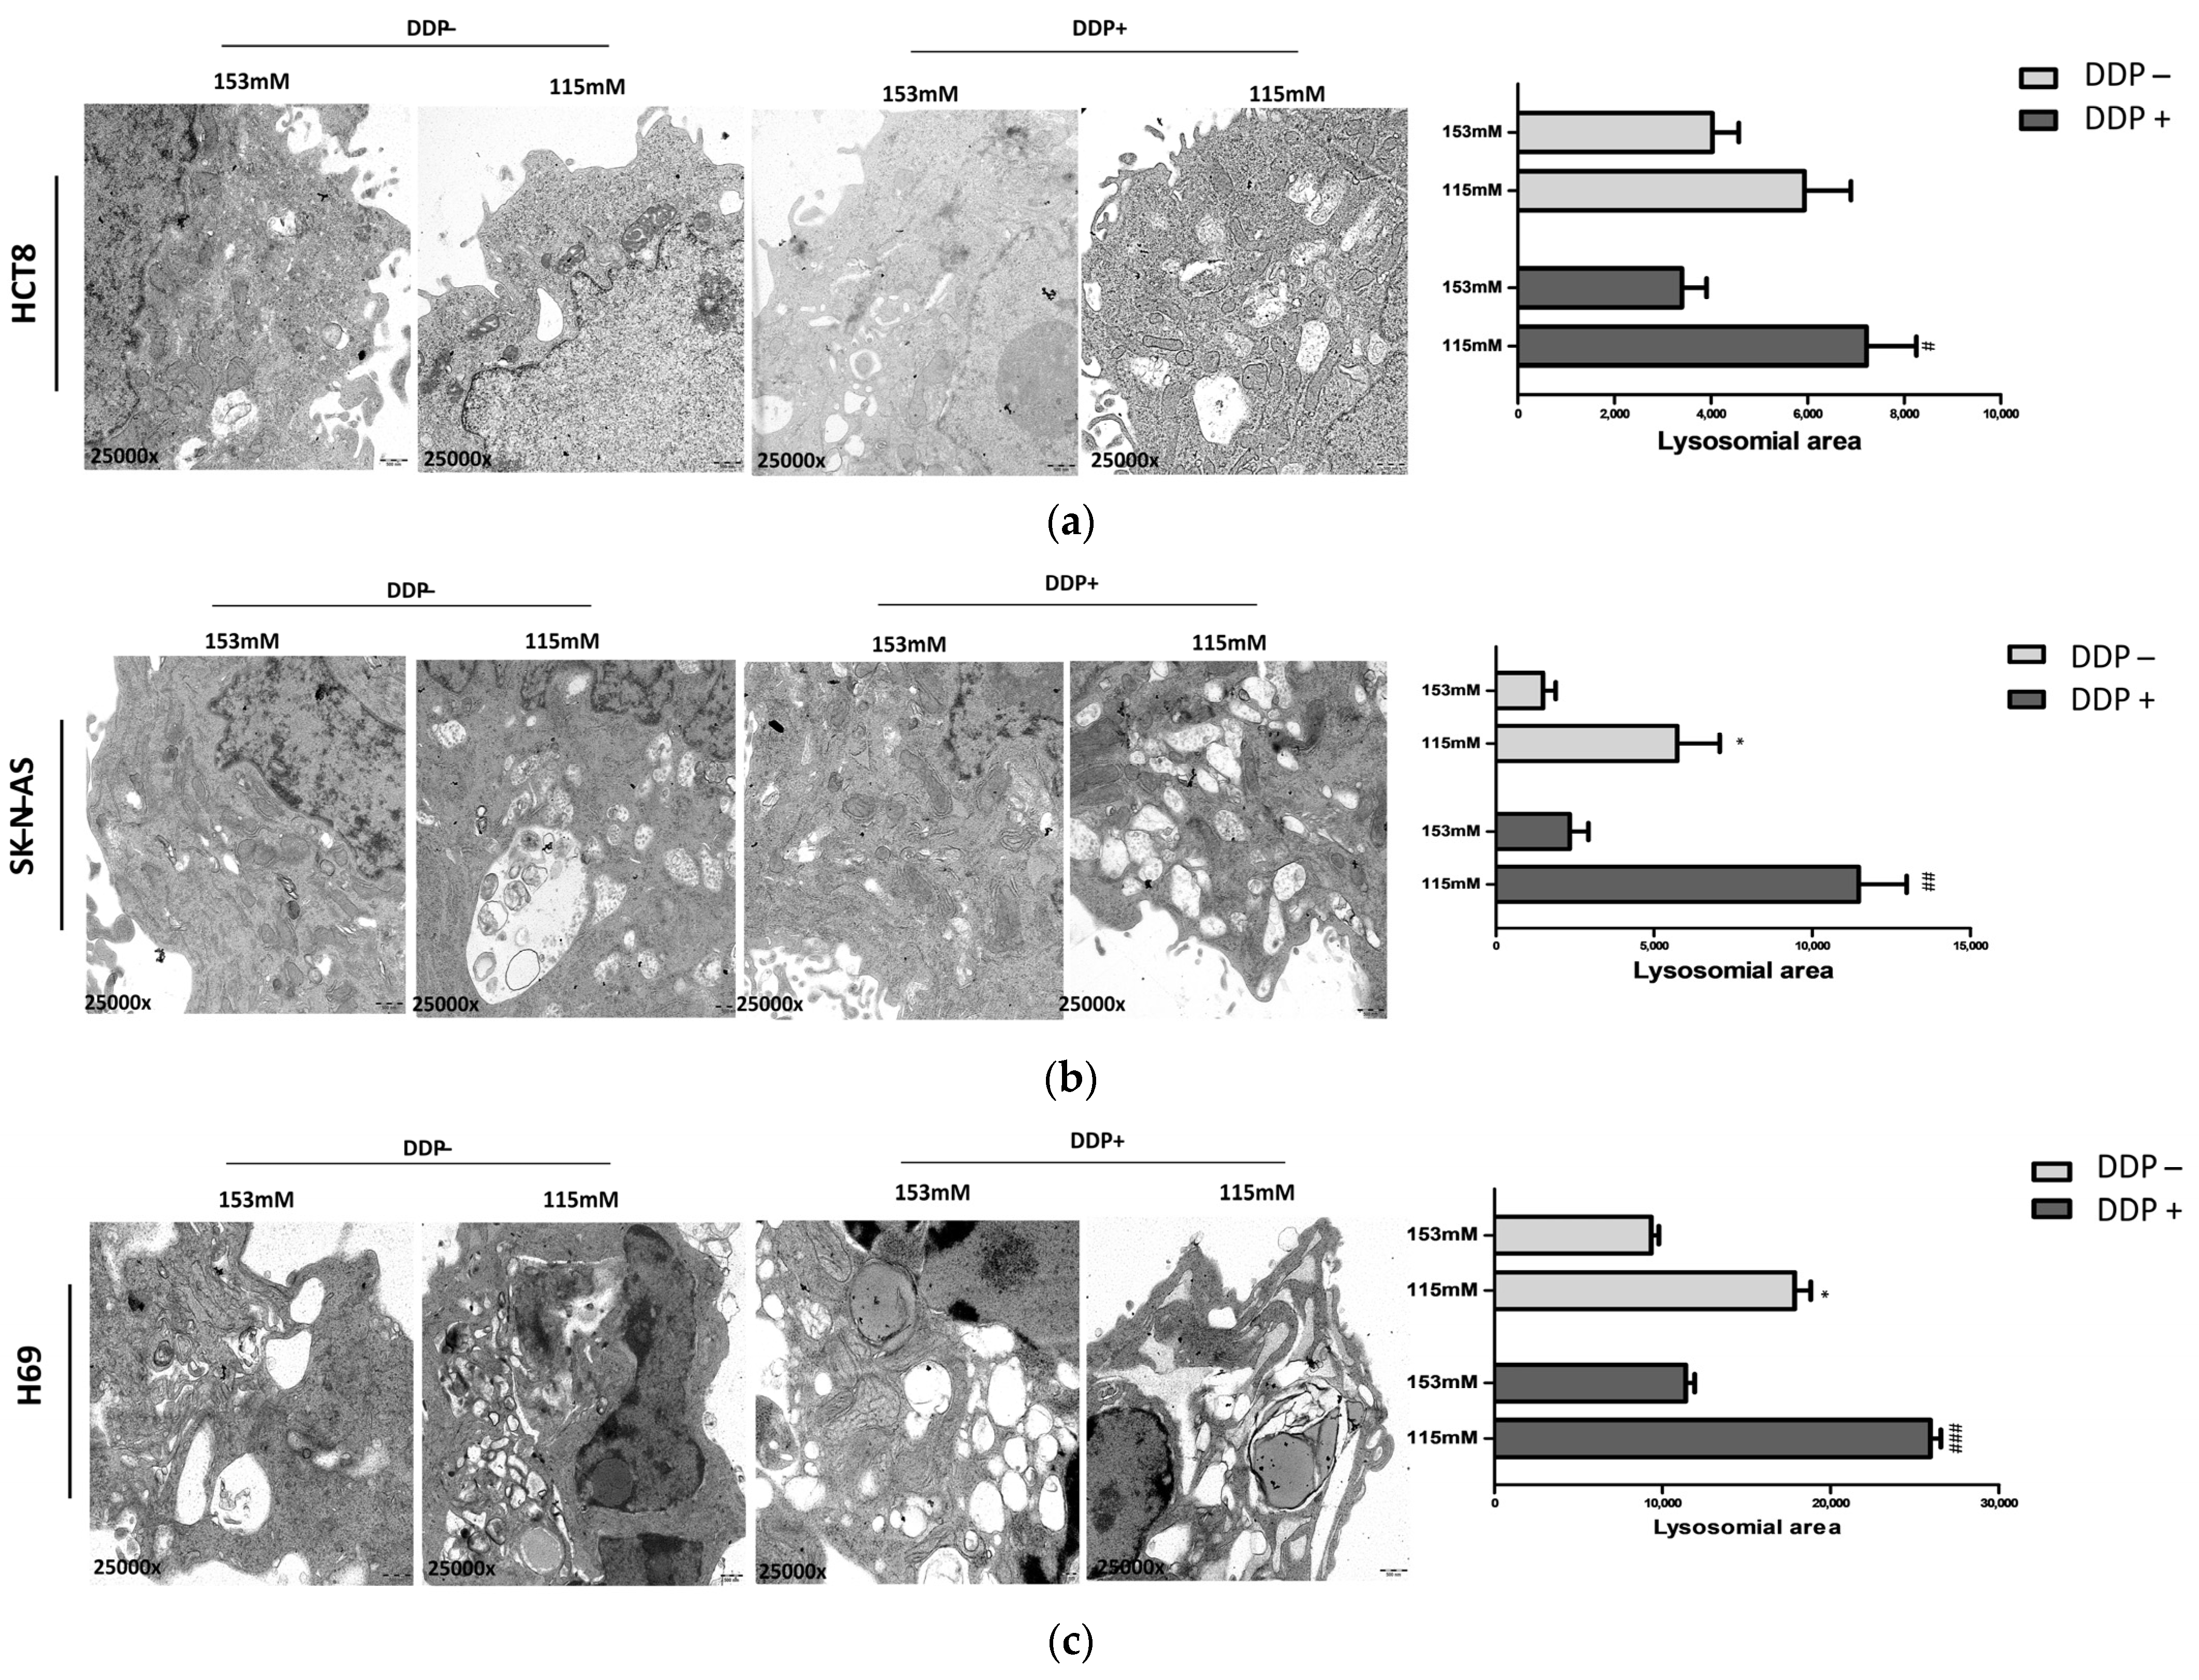
2.4. Ultrastructural Analysis of Lysosomal Vesicles
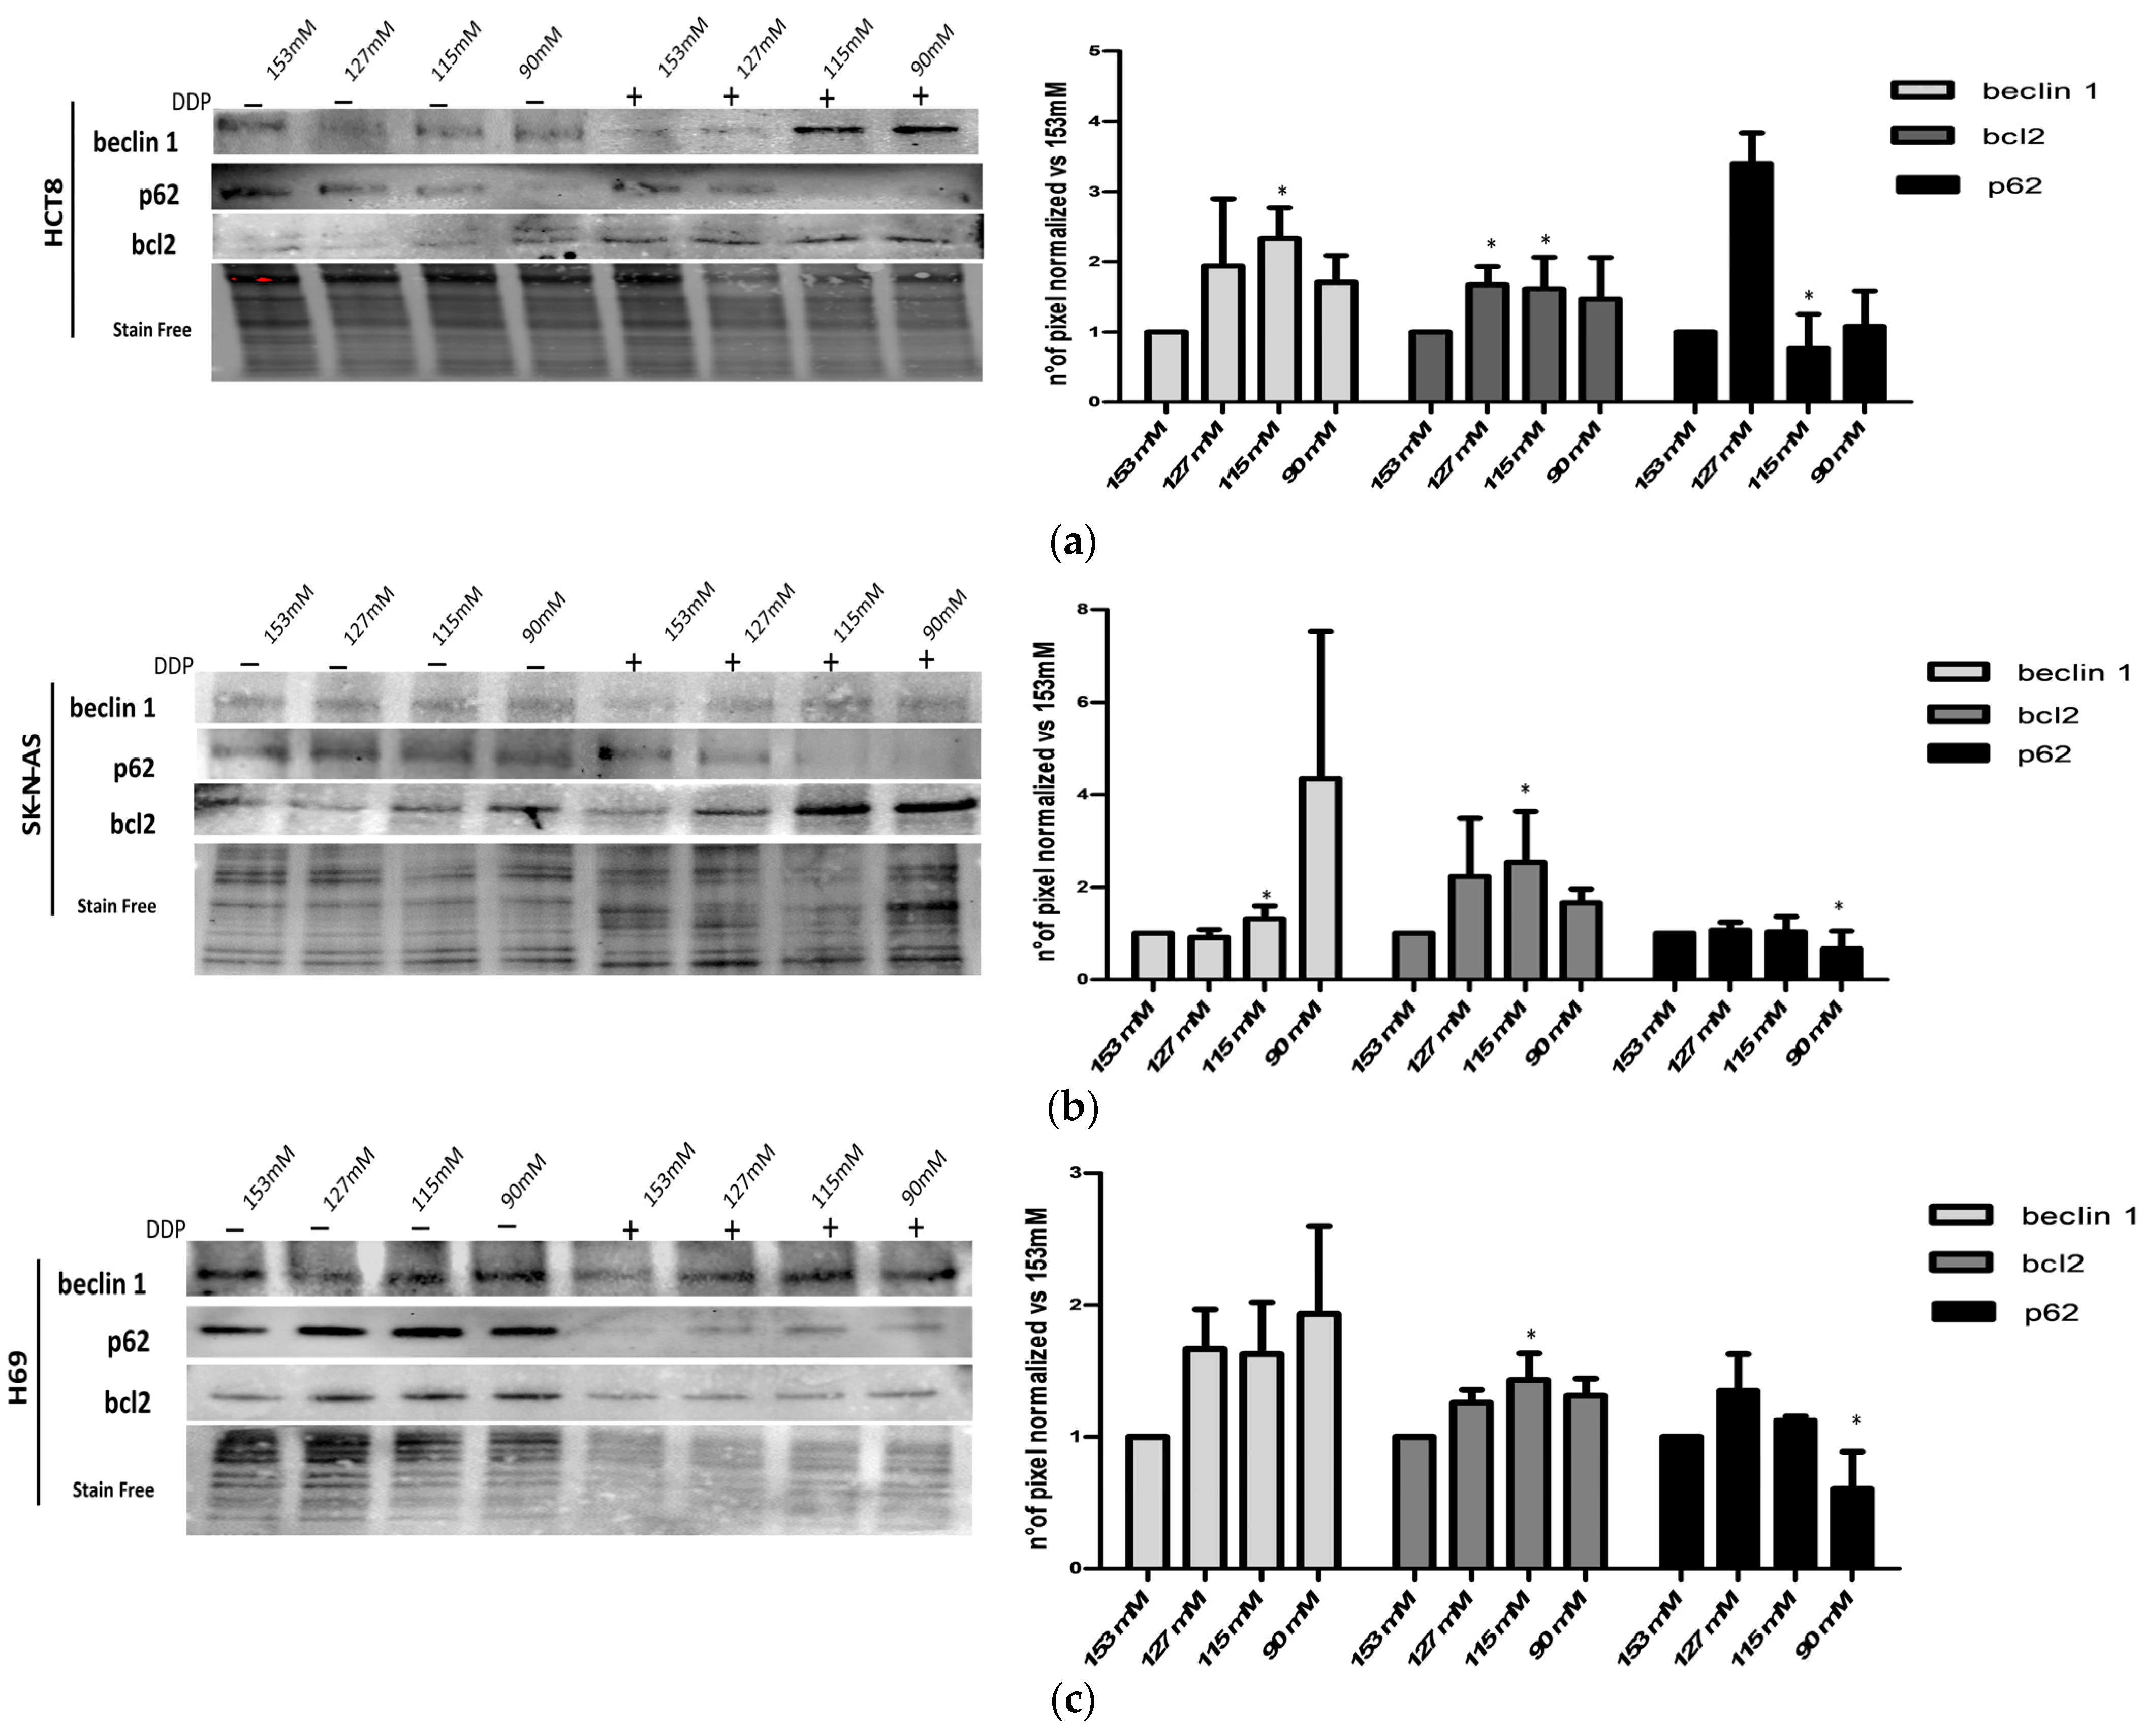
2.5. Characterization of Autophagic Proteins
3. Discussion
4. Materials and Methods
4.1. Chemicals and Reagents
4.2. Cell Cultures
4.3. Analysis of Cell Proliferation and Viability
4.4. Colony Formation Assay
4.5. Invasion Assay
4.6. Western Blot Analysis
4.7. Immunofluorescence
4.8. Transmission Electron Microscopy (TEM)
4.9. Statistical Analysis
Author Contributions
Funding
Informed Consent Statement
Data Availability Statement
Acknowledgments
Conflicts of Interest
References
- Adrogué, H.J.; Madias, N.E. Hyponatremia. N. Engl. J. Med. 2000, 342, 1581–1589. [Google Scholar] [CrossRef] [PubMed]
- Adrogué, H.J.; Madias, N.E. Hypernatremia. N. Engl. J. Med. 2000, 342, 1493–1499. [Google Scholar] [CrossRef]
- Doshi, S.M.; Shah, P.; Lei, X.; Lahoti, A.; Salahudeen, A.K. Hyponatremia in hospitalized cancer patients and its impact on clinical outcomes. Am. J. Kidney Dis. 2012, 59, 222–228. [Google Scholar] [CrossRef] [PubMed]
- Fibbi, B.; Marroncini, G.; Naldi, L.; Anceschi, C.; Errico, A.; Norello, D.; Peri, A. Hyponatremia and Cancer: From Bedside to Benchside. Cancers 2023, 15, 1197. [Google Scholar] [CrossRef]
- Sørensen, J.B.; Andersen, M.K.; Hansen, H.H. Syndrome of inappropriate secretion of antidiuretic hormone (SIADH) in malignant disease. J. Intern. Med. 1995, 238, 97–110. [Google Scholar] [CrossRef]
- Oronsky, B.; Caroen, S.; Oronsky, A.; Dobalian, V.E.; Oronsky, N.; Lybeck, M.; Reid, T.R.; Carter, C.A. Electrolyte disorders with platinum-based chemotherapy: Mechanisms, manifestations and management. Cancer Chemother. Pharmacol. 2017, 80, 895–907. [Google Scholar] [CrossRef] [PubMed]
- Berardi, R.; Santoni, M.; Rinaldi, S.; Nunzi, E.; Smerilli, A.; Caramanti, M.; Morgese, F.; Torniai, M.; Savini, A.; Fiordoliva, I.; et al. Risk of Hyponatraemia in Cancer Patients Treated with Targeted Therapies: A Systematic Review and Meta-Analysis of Clinical Trials. PLoS ONE 2016, 11, e0152079. [Google Scholar] [CrossRef]
- Uppal, N.N.; Workeneh, B.T.; Rondon-Berrios, H.; Jhaveri, K.D. Electrolyte and Acid-Base Disorders Associated with Cancer Immunotherapy. Clin. J. Am. Soc. Nephrol. 2022, 17, 922–933. [Google Scholar] [CrossRef] [PubMed]
- Sengupta, A.; Banerjee, S.N.; Biswas, N.M.; Jash, D.; Saha, K.; Maji, A.; Bandyopadhyaya, A.; Agarwal, S. The Incidence of Hyponatraemia and Its Effect on the ECOG Performance Status among Lung Cancer Patients. J. Clin. Diagn. Res. 2013, 7, 1678–1682. [Google Scholar] [CrossRef]
- Berardi, R.; Mastroianni, C.; Lo Russo, G.; Buosi, R.; Santini, D.; Montanino, A.; Carnaghi, C.; Tiseo, M.; Chiari, R.; Camerini, A.; et al. Syndrome of inappropriate anti-diuretic hormone secretion in cancer patients: Results of the first multicenter Italian study. Ther. Adv. Med. Oncol. 2019, 11, 1758835919877725. [Google Scholar] [CrossRef]
- Wald, R.; Jaber, B.L.; Price, L.L.; Upadhyay, A.; Madias, N.E. Impact of hospital-associated hyponatremia on selected outcomes. Arch. Intern. Med. 2010, 170, 294–302. [Google Scholar] [CrossRef] [PubMed]
- Berardi, R.; Caramanti, M.; Castagnani, M.; Guglielmi, S.; Marcucci, F.; Savini, A.; Morgese, F.; Rinaldi, S.; Ferrini, C.; Tiberi, M.; et al. Hyponatremia is a predictor of hospital length and cost of stay and outcome in cancer patients. Support. Care Cancer 2015, 23, 3095–3101. [Google Scholar] [CrossRef] [PubMed]
- Hansen, O.; Sørensen, P.; Hansen, K.H. The occurrence of hyponatremia in SCLC and the influence on prognosis: A retrospective study of 453 patients treated in a single institution in a 10-year period. Lung Cancer 2010, 68, 111–114. [Google Scholar] [CrossRef] [PubMed]
- Fucà, G.; Mariani, L.; Lo Vullo, S.; Galli, G.; Berardi, R.; Di Nicola, M.; Vernieri, C.; Morelli, D.; Dotti, K.; Fiordoliva, I.; et al. Weighing the prognostic role of hyponatremia in hospitalized patients with metastatic solid tumors: The HYPNOSIS study. Sci. Rep. 2019, 9, 12993. [Google Scholar] [CrossRef] [PubMed]
- Corona, G.; Giuliani, C.; Parenti, G.; Norello, D.; Verbalis, J.G.; Forti, G.; Maggi, M.; Peri, A. Moderate hyponatremia is associated with increased risk of mortality: Evidence from a meta-analysis. PLoS ONE 2013, 8, e80451. [Google Scholar] [CrossRef] [PubMed]
- Holland-Bill, L.; Christiansen, C.F.; Heide-Jørgensen, U.; Ulrichsen, S.P.; Ring, T.; Jørgensen, J.O.; Sørensen, H.T. Hyponatremia and mortality risk: A Danish cohort study of 279,508 acutely hospitalized patients. Eur. J. Endocrinol. 2015, 173, 71–81. [Google Scholar] [CrossRef] [PubMed]
- Corona, G.; Giuliani, C.; Verbalis, J.G.; Forti, G.; Maggi, M.; Peri, A. Hyponatremia improvement is associated with a reduced risk of mortality: Evidence from a meta-analysis. PLoS ONE 2015, 10, e0124105. [Google Scholar] [CrossRef] [PubMed]
- Balachandran, K.; Okines, A.; Gunapala, R.; Morganstein, D.; Popat, S. Resolution of severe hyponatraemia is associated with improved survival in patients with cancer. BMC Cancer 2015, 15, 163. [Google Scholar] [CrossRef] [PubMed]
- Kasi, P.M. Proposing the use of hyponatremia as a marker to help identify high risk individuals for lung cancer. Med. Hypotheses 2012, 79, 327–328. [Google Scholar] [CrossRef]
- Marroncini, G.; Fibbi, B.; Errico, A.; Grappone, C.; Maggi, M.; Peri, A. Effects of low extracellular sodium on proliferation and invasive activity of cancer cells in vitro. Endocrine 2020, 67, 473–484. [Google Scholar] [CrossRef]
- Marroncini, G.; Anceschi, C.; Naldi, L.; Fibbi, B.; Brogi, M.; Lanzilao, L.; Fanelli, A.; Maggi, M.; Peri, A. Hyponatremia-related liver steatofibrosis and impaired spermatogenesis: Evidence from a mouse model of the syndrome of inappropriate antidiuresis. J. Endocrinol. Investig. 2023, 46, 967–983. [Google Scholar] [CrossRef]
- Marroncini, G.; Anceschi, C.; Naldi, L.; Fibbi, B.; Baldanzi, F.; Martinelli, S.; Polvani, S.; Maggi, M.; Peri, A. Low sodium and tolvaptan have opposite effects in human small cell lung cancer cells. Mol. Cell. Endocrinol. 2021, 537, 111419. [Google Scholar] [CrossRef] [PubMed]
- Marroncini, G.; Naldi, L.; Fibbi, B.; Errico, A.; Polvani, S.; Brogi, M.; Fanelli, A.; Maggi, M.; Peri, A. Hyponatremia Promotes Cancer Growth in a Murine Xenograft Model of Neuroblastoma. Int. J. Mol. Sci. 2023, 24, 16680. [Google Scholar] [CrossRef] [PubMed]
- Fibbi, B.; Marroncini, G.; Anceschi, C.; Naldi, L.; Peri, A. Hyponatremia and Oxidative Stress. Antioxidants 2021, 10, 1768. [Google Scholar] [CrossRef]
- Penttilä, P.; Bono, P.; Peltola, K.; Donskov, F. Hyponatremia associates with poor outcome in metastatic renal cell carcinoma patients treated with everolimus: Prognostic impact. Acta Oncol. 2018, 57, 1580–1585. [Google Scholar] [CrossRef]
- Kawashima, A.; Tsujimura, A.; Takayama, H.; Arai, Y.; Nin, M.; Tanigawa, G.; Uemura, M.; Nakai, Y.; Nishimura, K.; Nonomura, N.; et al. Impact of hyponatremia on survival of patients with metastatic renal cell carcinoma treated with molecular targeted therapy. Int. J. Urol. 2012, 19, 1050–1057. [Google Scholar] [CrossRef]
- Jeppesen, A.N.; Jensen, H.K.; Donskov, F.; Marcussen, N.; von der Maase, H. Hyponatremia as a prognostic and predictive factor in metastatic renal cell carcinoma. Br. J. Cancer 2010, 102, 867–872. [Google Scholar] [CrossRef]
- Berardi, R.; Santoni, M.; Newsom-Davis, T.; Caramanti, M.; Rinaldi, S.; Tiberi, M.; Morgese, F.; Torniai, M.; Pistelli, M.; Onofri, A.; et al. Hyponatremia normalization as an independent prognostic factor in patients with advanced non-small cell lung cancer treated with first-line therapy. Oncotarget 2017, 8, 23871–23879. [Google Scholar] [CrossRef] [PubMed]
- Doshi, K.H.; Shriyan, B.; Nookala, M.K.; Kannan, S.; Joshi, A.; Noronha, V.; Gota, V.; Prabhash, K. Prognostic significance of pretreatment sodium levels in patients of nonsmall cell lung cancer treated with pemetrexed-platinum doublet chemotherapy. J. Cancer Res. Ther. 2018, 14, 1049–1053. [Google Scholar] [CrossRef]
- Fucà, G.; Galli, G.; Poggi, M.; Lo Russo, G.; Proto, C.; Imbimbo, M.; Vitali, M.; Ganzinelli, M.; Lanti, C.; Molino, G.; et al. Low Baseline Serum Sodium Concentration Is Associated with Poor Clinical Outcomes in Metastatic Non-Small Cell Lung Cancer Patients Treated with Immunotherapy. Target. Oncol. 2018, 13, 795–800. [Google Scholar] [CrossRef]
- Kegasawa, T.; Sakamori, R.; Maesaka, K.; Yamada, R.; Tahata, Y.; Urabe, A.; Kodama, T.; Hikita, H.; Imanaka, K.; Ohkawa, K.; et al. Lower Serum Sodium Levels Are Associated with the Therapeutic Effect of Sorafenib on Hepatocellular Carcinoma. Dig. Dis. Sci. 2021, 66, 1720–1729. [Google Scholar] [CrossRef] [PubMed]
- Svaton, M.; Fiala, O.; Pesek, M.; Bruha, F.; Mukensnabl, P.; Racek, J.; Minarik, M.; Bortlicek, Z. Predictive and prognostic significance of sodium levels in patients with NSCLC treated by erlotinib. Anticancer Res. 2014, 34, 7461–7465. [Google Scholar] [PubMed]
- Kleih, M.; Böpple, K.; Dong, M.; Gaißler, A.; Heine, S.; Olayioye, M.A.; Aulitzky, W.E.; Essmann, F. Direct impact of cisplatin on mitochondria induces ROS production that dictates cell fate of ovarian cancer cells. Cell Death Dis. 2019, 10, 851. [Google Scholar] [CrossRef] [PubMed]
- Levy, J.M.M.; Towers, C.G.; Thorburn, A. Targeting autophagy in cancer. Nat. Rev. Cancer 2017, 17, 528–542. [Google Scholar] [CrossRef] [PubMed]
- Camuzard, O.; Santucci-Darmanin, S.; Carle, G.F.; Pierrefite-Carle, V. Autophagy in the crosstalk between tumor and microenvironment. Cancer Lett. 2020, 490, 143–153. [Google Scholar] [CrossRef] [PubMed]
- Li, Y.J.; Lei, Y.H.; Yao, N.; Wang, C.R.; Hu, N.; Ye, W.C.; Zhang, D.M.; Chen, Z.S. Autophagy and multidrug resistance in cancer. Chin. J. Cancer 2017, 36, 52. [Google Scholar] [CrossRef] [PubMed]
- Köberle, B.; Schoch, S. Platinum Complexes in Colorectal Cancer and Other Solid Tumors. Cancers 2021, 13, 2073. [Google Scholar] [CrossRef] [PubMed]
- Wang, Y.; Zou, S.; Zhao, Z.; Liu, P.; Ke, C.; Xu, S. New insights into small-cell lung cancer development and therapy. Cell Biol. Int. 2020, 44, 1564–1576. [Google Scholar] [CrossRef]
- Hamdi, T.; Latta, S.; Jallad, B.; Kheir, F.; Alhosaini, M.N.; Patel, A. Cisplatin-induced renal salt wasting syndrome. South Med. J. 2010, 103, 793–799. [Google Scholar] [CrossRef]
- Sugiyama, Y.; Naiki, T.; Kondo, M.; Iida, K.; Kondo, Y.; Tasaki, Y.; Kataoka, T.; Hotta, A.; Yasui, T.; Kimura, K. Syndrome of Inappropriate Secretion of Antidiuretic Hormone Caused by Carboplatin after Switching from Cisplatin in a Metastatic Urethral Cancer Patient. Urol. Case Rep. 2017, 12, 17–19. [Google Scholar] [CrossRef]
- Castillo, J.J.; Glezerman, I.G.; Boklage, S.H.; Chiodo, J.; Tidwell, B.A.; Lamerato, L.E.; Schulman, K.L. The occurrence of hyponatremia and its importance as a prognostic factor in a cross-section of cancer patients. BMC Cancer 2016, 16, 564. [Google Scholar] [CrossRef] [PubMed]
- Zhang, C.; Xu, C.; Gao, X.; Yao, Q. Platinum-based drugs for cancer therapy and anti-tumor strategies. Theranostics 2022, 12, 2115–2132. [Google Scholar] [CrossRef]
- Kaluđerović, G.N.; Mijatović, S.A.; Zmejkovski, B.B.; Bulatović, M.Z.; Gómez-Ruiz, S.; Mojić, M.K.; Steinborn, D.; Miljković, D.M.; Schmidt, H.; Stošić-Grujičić, S.D.; et al. Platinum(II/IV) complexes containing ethylenediamine-N,N′-di-2/3-propionate ester ligands induced caspase-dependent apoptosis in cisplatin-resistant colon cancer cells. Metallomics 2012, 4, 979–987. [Google Scholar] [CrossRef] [PubMed]
- Whittle, S.B.; Smith, V.; Doherty, E.; Zhao, S.; McCarty, S.; Zage, P.E. Overview and recent advances in the treatment of neuroblastoma. Expert Rev. Anticancer. Ther. 2017, 17, 369–386. [Google Scholar] [CrossRef] [PubMed]
- Squecco, R.; Luciani, P.; Idrizaj, E.; Deledda, C.; Benvenuti, S.; Giuliani, C.; Fibbi, B.; Peri, A.; Francini, F. Hyponatraemia alters the biophysical properties of neuronal cells independently of osmolarity: A study on Ni(2+) -sensitive current involvement. Exp. Physiol. 2016, 101, 1086–1100. [Google Scholar] [CrossRef] [PubMed]
- Patergnani, S.; Danese, A.; Bouhamida, E.; Aguiari, G.; Previati, M.; Pinton, P.; Giorgi, C. Various Aspects of Calcium Signaling in the Regulation of Apoptosis, Autophagy, Cell Proliferation, and Cancer. Int. J. Mol. Sci. 2020, 21, 8323. [Google Scholar] [CrossRef] [PubMed]
- Fu, R.; Zhao, B.; Chen, M.; Fu, X.; Zhang, Q.; Cui, Y.; Hu, X.; Zhou, W. Moving beyond cisplatin resistance: Mechanisms, challenges, and prospects for overcoming recurrence in clinical cancer therapy. Med. Oncol. 2023, 41, 9. [Google Scholar] [CrossRef] [PubMed]
- Zhao, L.; Wu, X.; Zhang, Z.; Fang, L.; Yang, B.; Li, Y. ELF1 suppresses autophagy to reduce cisplatin resistance via the miR-152-3p/NCAM1/ERK axis in lung cancer cells. Cancer Sci. 2023, 114, 2650–2663. [Google Scholar] [CrossRef] [PubMed]
- Pan, X.; Chen, Y.; Shen, Y.; Tantai, J. Knockdown of TRIM65 inhibits autophagy and cisplatin resistance in A549/DDP cells by regulating miR-138-5p/ATG7. Cell Death Dis. 2019, 10, 429. [Google Scholar] [CrossRef]
- Grimaldi, M.; Bo, V.D.; Ferrari, B.; Roda, E.; De Luca, F.; Veneroni, P.; Barni, S.; Verri, M.; De Pascali, S.A.; Fanizzi, F.P.; et al. Long-term effects after treatment with platinum compounds, cisplatin and [Pt(O,O′-acac)(γ-acac)(DMS)]: Autophagy activation in rat B50 neuroblastoma cells. Toxicol. Appl. Pharmacol. 2019, 364, 1–11. [Google Scholar] [CrossRef]
- Wang, S.Y.; Wang, X.; Zhang, C.Y. LncRNA SNHG7 enhances chemoresistance in neuroblastoma through cisplatin-induced autophagy by regulating miR-329-3p/MYO10 axis. Eur. Rev. Med. Pharmacol. Sci. 2020, 24, 3805–3817. [Google Scholar] [CrossRef] [PubMed]
- Gao, J.; Wang, W. Knockdown of galectin-1 facilitated cisplatin sensitivity by inhibiting autophagy in neuroblastoma cells. Chem. Biol. Interact. 2019, 297, 50–56. [Google Scholar] [CrossRef] [PubMed]
- Han, Y.; Zhou, S.; Wang, X.; Mao, E.; Huang, L. SNHG14 stimulates cell autophagy to facilitate cisplatin resistance of colorectal cancer by regulating miR-186/ATG14 axis. Biomed. Pharmacother. 2020, 121, 109580. [Google Scholar] [CrossRef] [PubMed]
- Li, X.; He, S.; Ma, B. Autophagy and autophagy-related proteins in cancer. Mol. Cancer 2020, 19, 12. [Google Scholar] [CrossRef]
- Rouschop, K.M.; Wouters, B.G. Regulation of autophagy through multiple independent hypoxic signaling pathways. Curr. Mol. Med. 2009, 9, 417–424. [Google Scholar] [CrossRef] [PubMed]
- Lomonaco, S.L.; Finniss, S.; Xiang, C.; Decarvalho, A.; Umansky, F.; Kalkanis, S.N.; Mikkelsen, T.; Brodie, C. The induction of autophagy by gamma-radiation contributes to the radioresistance of glioma stem cells. Int. J. Cancer 2009, 125, 717–722. [Google Scholar] [CrossRef] [PubMed]
- Vega-Rubín-de-Celis, S.; Kinch, L.; Peña-Llopis, S. Regulation of Beclin 1-Mediated Autophagy by Oncogenic Tyrosine Kinases. Int. J. Mol. Sci. 2020, 21, 9210. [Google Scholar] [CrossRef]
- Tran, S.; Fairlie, W.D.; Lee, E.F. BECLIN1: Protein Structure, Function and Regulation. Cells 2021, 10, 1522. [Google Scholar] [CrossRef]
- Maji, S.; Panda, S.; Samal, S.K.; Shriwas, O.; Rath, R.; Pellecchia, M.; Emdad, L.; Das, S.K.; Fisher, P.B.; Dash, R. Bcl-2 Antiapoptotic Family Proteins and Chemoresistance in Cancer. Adv. Cancer Res. 2018, 137, 37–75. [Google Scholar] [CrossRef]
- Mathew, R.; Karp, C.M.; Beaudoin, B.; Vuong, N.; Chen, G.; Chen, H.Y.; Bray, K.; Reddy, A.; Bhanot, G.; Gelinas, C.; et al. Autophagy suppresses tumorigenesis through elimination of p62. Cell 2009, 137, 1062–1075. [Google Scholar] [CrossRef]
- Komatsu, M.; Kageyama, S.; Ichimura, Y. p62/SQSTM1/A170: Physiology and pathology. Pharmacol. Res. 2012, 66, 457–462. [Google Scholar] [CrossRef]
- Benvenuti, S.; Deledda, C.; Luciani, P.; Modi, G.; Bossio, A.; Giuliani, C.; Fibbi, B.; Peri, A. Low extracellular sodium causes neuronal distress independently of reduced osmolality in an experimental model of chronic hyponatremia. Neuromol. Med. 2013, 15, 493–503. [Google Scholar] [CrossRef]
- Fibbi, B.; Benvenuti, S.; Giuliani, C.; Deledda, C.; Luciani, P.; Monici, M.; Mazzanti, B.; Ballerini, C.; Peri, A. Low extracellular sodium promotes adipogenic commitment of human mesenchymal stromal cells: A novel mechanism for chronic hyponatremia-induced bone loss. Endocrine 2016, 52, 73–85. [Google Scholar] [CrossRef]
- Benvenuti, S.; Deledda, C.; Luciani, P.; Giuliani, C.; Fibbi, B.; Muratori, M.; Peri, A. Neuronal distress induced by low extracellular sodium in vitro is partially reverted by the return to normal sodium. J. Endocrinol. Investig. 2016, 39, 177–184. [Google Scholar] [CrossRef]


Disclaimer/Publisher’s Note: The statements, opinions and data contained in all publications are solely those of the individual author(s) and contributor(s) and not of MDPI and/or the editor(s). MDPI and/or the editor(s) disclaim responsibility for any injury to people or property resulting from any ideas, methods, instructions or products referred to in the content. |
© 2024 by the authors. Licensee MDPI, Basel, Switzerland. This article is an open access article distributed under the terms and conditions of the Creative Commons Attribution (CC BY) license (https://creativecommons.org/licenses/by/4.0/).
Share and Cite
Naldi, L.; Fibbi, B.; Anceschi, C.; Nardini, P.; Guasti, D.; Peri, A.; Marroncini, G. Effects of Reduced Extracellular Sodium Concentrations on Cisplatin Treatment in Human Tumor Cells: The Role of Autophagy. Int. J. Mol. Sci. 2024, 25, 4377. https://doi.org/10.3390/ijms25084377
Naldi L, Fibbi B, Anceschi C, Nardini P, Guasti D, Peri A, Marroncini G. Effects of Reduced Extracellular Sodium Concentrations on Cisplatin Treatment in Human Tumor Cells: The Role of Autophagy. International Journal of Molecular Sciences. 2024; 25(8):4377. https://doi.org/10.3390/ijms25084377
Chicago/Turabian StyleNaldi, Laura, Benedetta Fibbi, Cecilia Anceschi, Patrizia Nardini, Daniele Guasti, Alessandro Peri, and Giada Marroncini. 2024. "Effects of Reduced Extracellular Sodium Concentrations on Cisplatin Treatment in Human Tumor Cells: The Role of Autophagy" International Journal of Molecular Sciences 25, no. 8: 4377. https://doi.org/10.3390/ijms25084377
APA StyleNaldi, L., Fibbi, B., Anceschi, C., Nardini, P., Guasti, D., Peri, A., & Marroncini, G. (2024). Effects of Reduced Extracellular Sodium Concentrations on Cisplatin Treatment in Human Tumor Cells: The Role of Autophagy. International Journal of Molecular Sciences, 25(8), 4377. https://doi.org/10.3390/ijms25084377