2.1. Development of WSH-Based Regional Blood eAge Clock Models
We used five WSH metrics: MHL (Methylation Haplotype Load), PDR (Proportion of Discordant Reads), PM (Epipolymorphism), FDRP (Fraction of Discordant Read Pairs), and qFDRP (quantitative Fraction of Discordant Read Pairs) (see
Figure 1 for an explanation) [
10,
12,
20,
21]. Different WSH scores enable the assessment of distinct aspects or the biological phenomena of methylation pattern changes. Intra-molecule score PDR might be considered as a metric of DNA methylation erosion since its elevated values, which are due to stochastic demethylation, have been linked to epigenetic instability in cancer cells [
21]. Another intra-molecule score, MHL, captures the homogeneity of co-methylation patterns and serves as an additional indicator of DNA methylation erosion, as it takes on a maximum value of 1 when the region is fully methylated and it is strongly reduced when extended stretches of methylated DNA are disrupted by stochastic demethylation [
10]. Inter-molecule score as PM is used to quantify cell-type heterogeneity and describes the DNA methylation patterns in four-CpG windows [
20]. FDRP and qFDRP scores are some other metrics that are designed to capture cell-type heterogeneity that analyzes the concordance between the same CpGs within different reads [
12]. It should be noted that the basic unit of heterogeneity measurement in the MHL, PDR, FDRP, and qFDRP is a single CpG site, while for the PM, it is four contiguous CpG sites, bringing the different number of analyzed features for each metric. For simplicity, we will hereinafter refer to the listed DNA methylation heterogeneity units as heterogeneity loci regardless of the metric type.
In the first step, we evaluated the relevance of WSH scores as an instrument for epigenetic clock design. We analyzed the sequencing data of 182 bisulfite-converted blood DNA samples from donors of different ages (19–56 years, mean age 28.6 years) [
23]. We obtained WSH scores for around 2 million CpGs in the case of FDRP and qFDRP scores, well above 1 million CpGs for MHL and PDR, and around 0.7 million stretches comprising four CpGs in the case of PM (
Table 1). In order to reduce the diversity of features by age-associated variants, we identified heterogeneity loci with a monotonic relationship between the score value and age within each WSH metric type. Therefore, the scores for each loci were correlated with age using Spearman’s rank correlation coefficient, and the heterogeneity loci that showed a correlation less than |0.25| were filtered out (
Table 1). The mean score values for each metric, both positively and negatively correlated, exhibit a quadratic relationship with chronological age (
Figure 2), thereby indicating that changes in global heterogeneity occur most rapidly in youth and slow down by old age. It is noteworthy that a nonlinear change in heterogeneity during development was observed in [
22], wherein global methylation disorder was investigated in aging mice.
The resulting sets of positively and negatively correlated heterogeneity loci for each WSH score were annotated and associated with genes using ChiPseeker [
24]. The total number of genes that overlapped with age-correlated heterogeneity loci is presented in
Table S1. Functional annotation and GO term enrichment analysis revealed that genes associated with positively age-correlated heterogeneity loci were enriched in plenty of biological processes, the most significant being body systems development (GO:0048731, GO:0007275, GO:0048856, GO:0032502, GO:0032501), neural tissue development and differentiation (GO:0007399, GO:0022008, GO:0048699, GO:0030182, GO:0048666), and cellular differentiation (GO:0030154) (
Table S2). Genes associated with negatively age-correlated heterogeneity loci were significantly enriched in common terms related to organismal development (GO:0048856, GO:0032502, GO:0007275, GO:0007399, GO:0048731), signaling, and regulation of cellular communication (GO:0023051, GO:0010646) (
Table S3).
In the next step, we analyzed the heterogeneity loci, demonstrating the strongest correlation with age (|Cor| ≥ 0.5). While the number of highly correlated heterogeneity loci varies from 10 for FDRP to 48 for PDR (
Table 1), all of the loci sets are densely within a few genes, fitting into regions of no more than 300 bp in length (
Tables S4–S8). Correspondingly, for different WSH scores, the number of associated genes varied between 2 and 6 genes, which often overlapped between metrics (
Table 2). Interestingly, some of the listed genes are related to aging or associated with CpGs that are included in different epigenetic age models. For example, CpG sites near the genes
GRM2,
SCGN, and
ZIK1 are used in region-based epigenetic clocks, or they are described as age-associated CpGs [
25,
26,
27,
28].
Lin28b has been found to delay vasculature aging, and
ADRB1 beneficially impacts aging [
29,
30].
Using the corresponding highly correlated heterogeneity loci, a random forest regression model was constructed for each WSH score.
Figure 3a,b shows the variances of the models on the training set. The PDR metric shows the best performance (R
2 = 0.695, MAE = 3.43). The PM and qFDRP metrics show relatively close performance (R
2 = 0.595 and 0.510, MAE = 3.18, and 4.15, respectively), while the MHL (R
2 = 0.436, MAE = 4.540) and FDRP (R
2 = 0.346, MAE = 4.863) performed worse. Next, we evaluated the model on the test samples that were excluded from training and hyperparameter selection. The PDR metric was proven to be the most effective metric (R
2 = 0.806, MAE = 3.686) (
Table 3,
Figure 3c). Just as in the case of evaluation on the training set, the FDRP and MHL metrics showed the lowest performance on the test sample.
It is also noteworthy that the sequencing data that we used have reasonably high coverage, while the usual RRBS datasets tend to be of lower quality. To assess the applicability of the WSH scores to detect the dependencies of methylation heterogeneity change with age in RRBS-data samples, we performed a similar analysis to detect the correlations between the heterogeneity loci in RRBS-seq of mesenchymal stem cells samples (32 samples in total, age range of 0–48 years) [
31]. Despite the low number of samples and single-end reads sequencing, it can be seen that there are clear associations between age and the heterogeneity scores (
Figure S1). Unfortunately, due to the paucity of the samples, we were unable to build the model and assess MAE. However, the ground-age umbilical cord and placenta samples display lower levels of heterogeneity for all of the metrics used, and all of the WSH scores highly correlated with age (R
2 > 0.8) for both positively and negatively correlated heterogeneity loci.
2.2. Assessment of Regional Blood Epigenetic Clock Performance
To date, several approaches have been described for constructing epigenetic clock algorithms based on RRBS data, the most productive being the analysis of average methylation over genomic regions of different sizes [
13,
19]. To compare the efficacy of this regional approach with the heterogeneity-based one, we built an epigenetic clock model that is similar to a previously described method for mice blood RRBS eAge clocks [
13]. Briefly, the average methylation frequency over genomic windows of different sizes was calculated, windows containing methylation data were deduplicated, and age-correlated windows were used for further analysis (
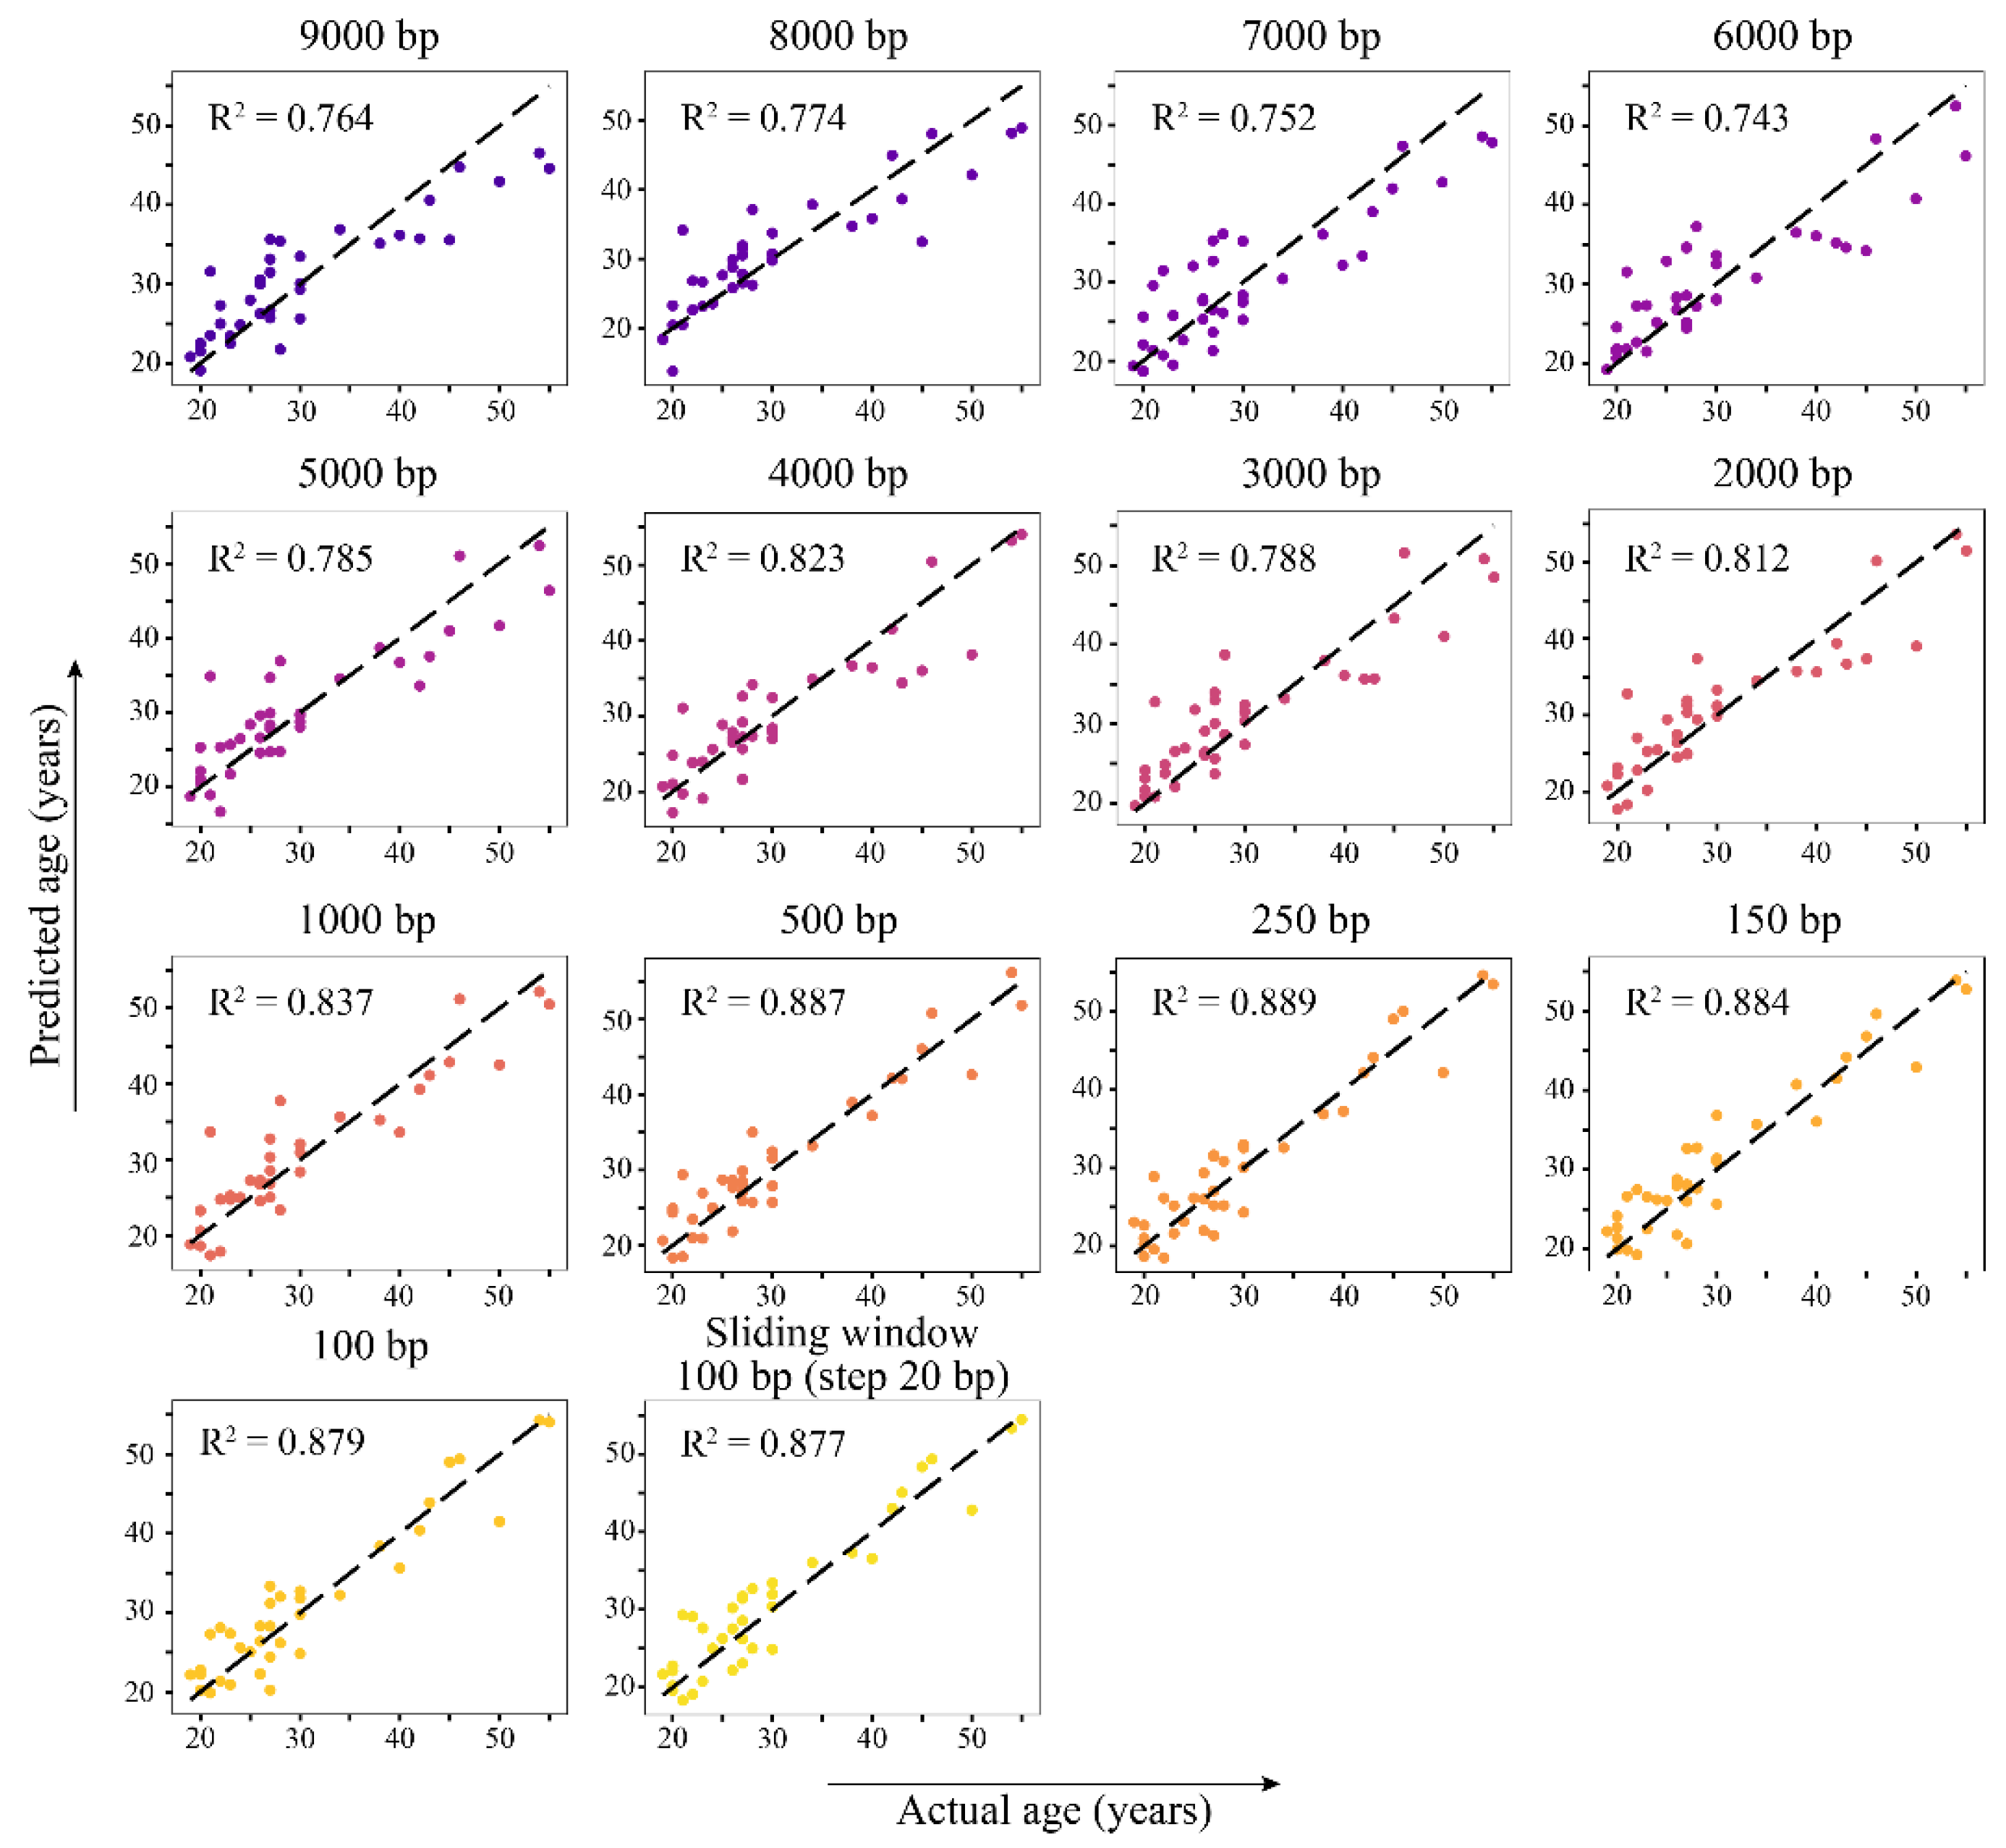
Table S9). The hyperparameters for LASSO regression were selected on the training set and estimated with the testing set. The performance of the models depending on the window size is shown in
Figure 4. It should be noted that, as the window size decreases, the model shows better R
2 value and MAE. The best prediction accuracy was achieved using a 100 bp sliding window with a 20 bp step size (100_20 in
Figure 4 with R
2 = 0.885 and MAE = 2.164). Usage of windows of smaller sizes (100–1000 bp) performed better, thereby demonstrating R
2 in the range from 0.837 to 0.874 and MAE ranging from 2.527 to 2.266 (
Figure 4,
Table 4). Models based on larger genomic intervals (2000–9000 bp) showed an R
2 that does not exceed 0.8 and an MAE of 3 or more years. The number of regions with non-zero regression coefficients increases with decreasing window size: from 14 for the 9000 bp window to 53 for the 100 bp sliding window.
The evaluation of the test dataset revealed the best performance of the 250 bp window model, although models built on 100–500 bp windows showed R
2 above 0.85 and MAE below 3 years (
Table 4,
Figure 5). Next, the associated genomic windows comprising 250 bp, 150 bp, and 100 bp/sliding windows models yielded a list of 52 genes, with 17 being common to all three genome segmentation approaches (
Tables S10–S13). The associated genes are involved in the regulation of apoptosis, control of metabolism, cell division, and differentiation, according to the DAVID database [
32].
2.3. Regional Blood and WSH-Based Models for Minimized Epigenetic Clocks Design
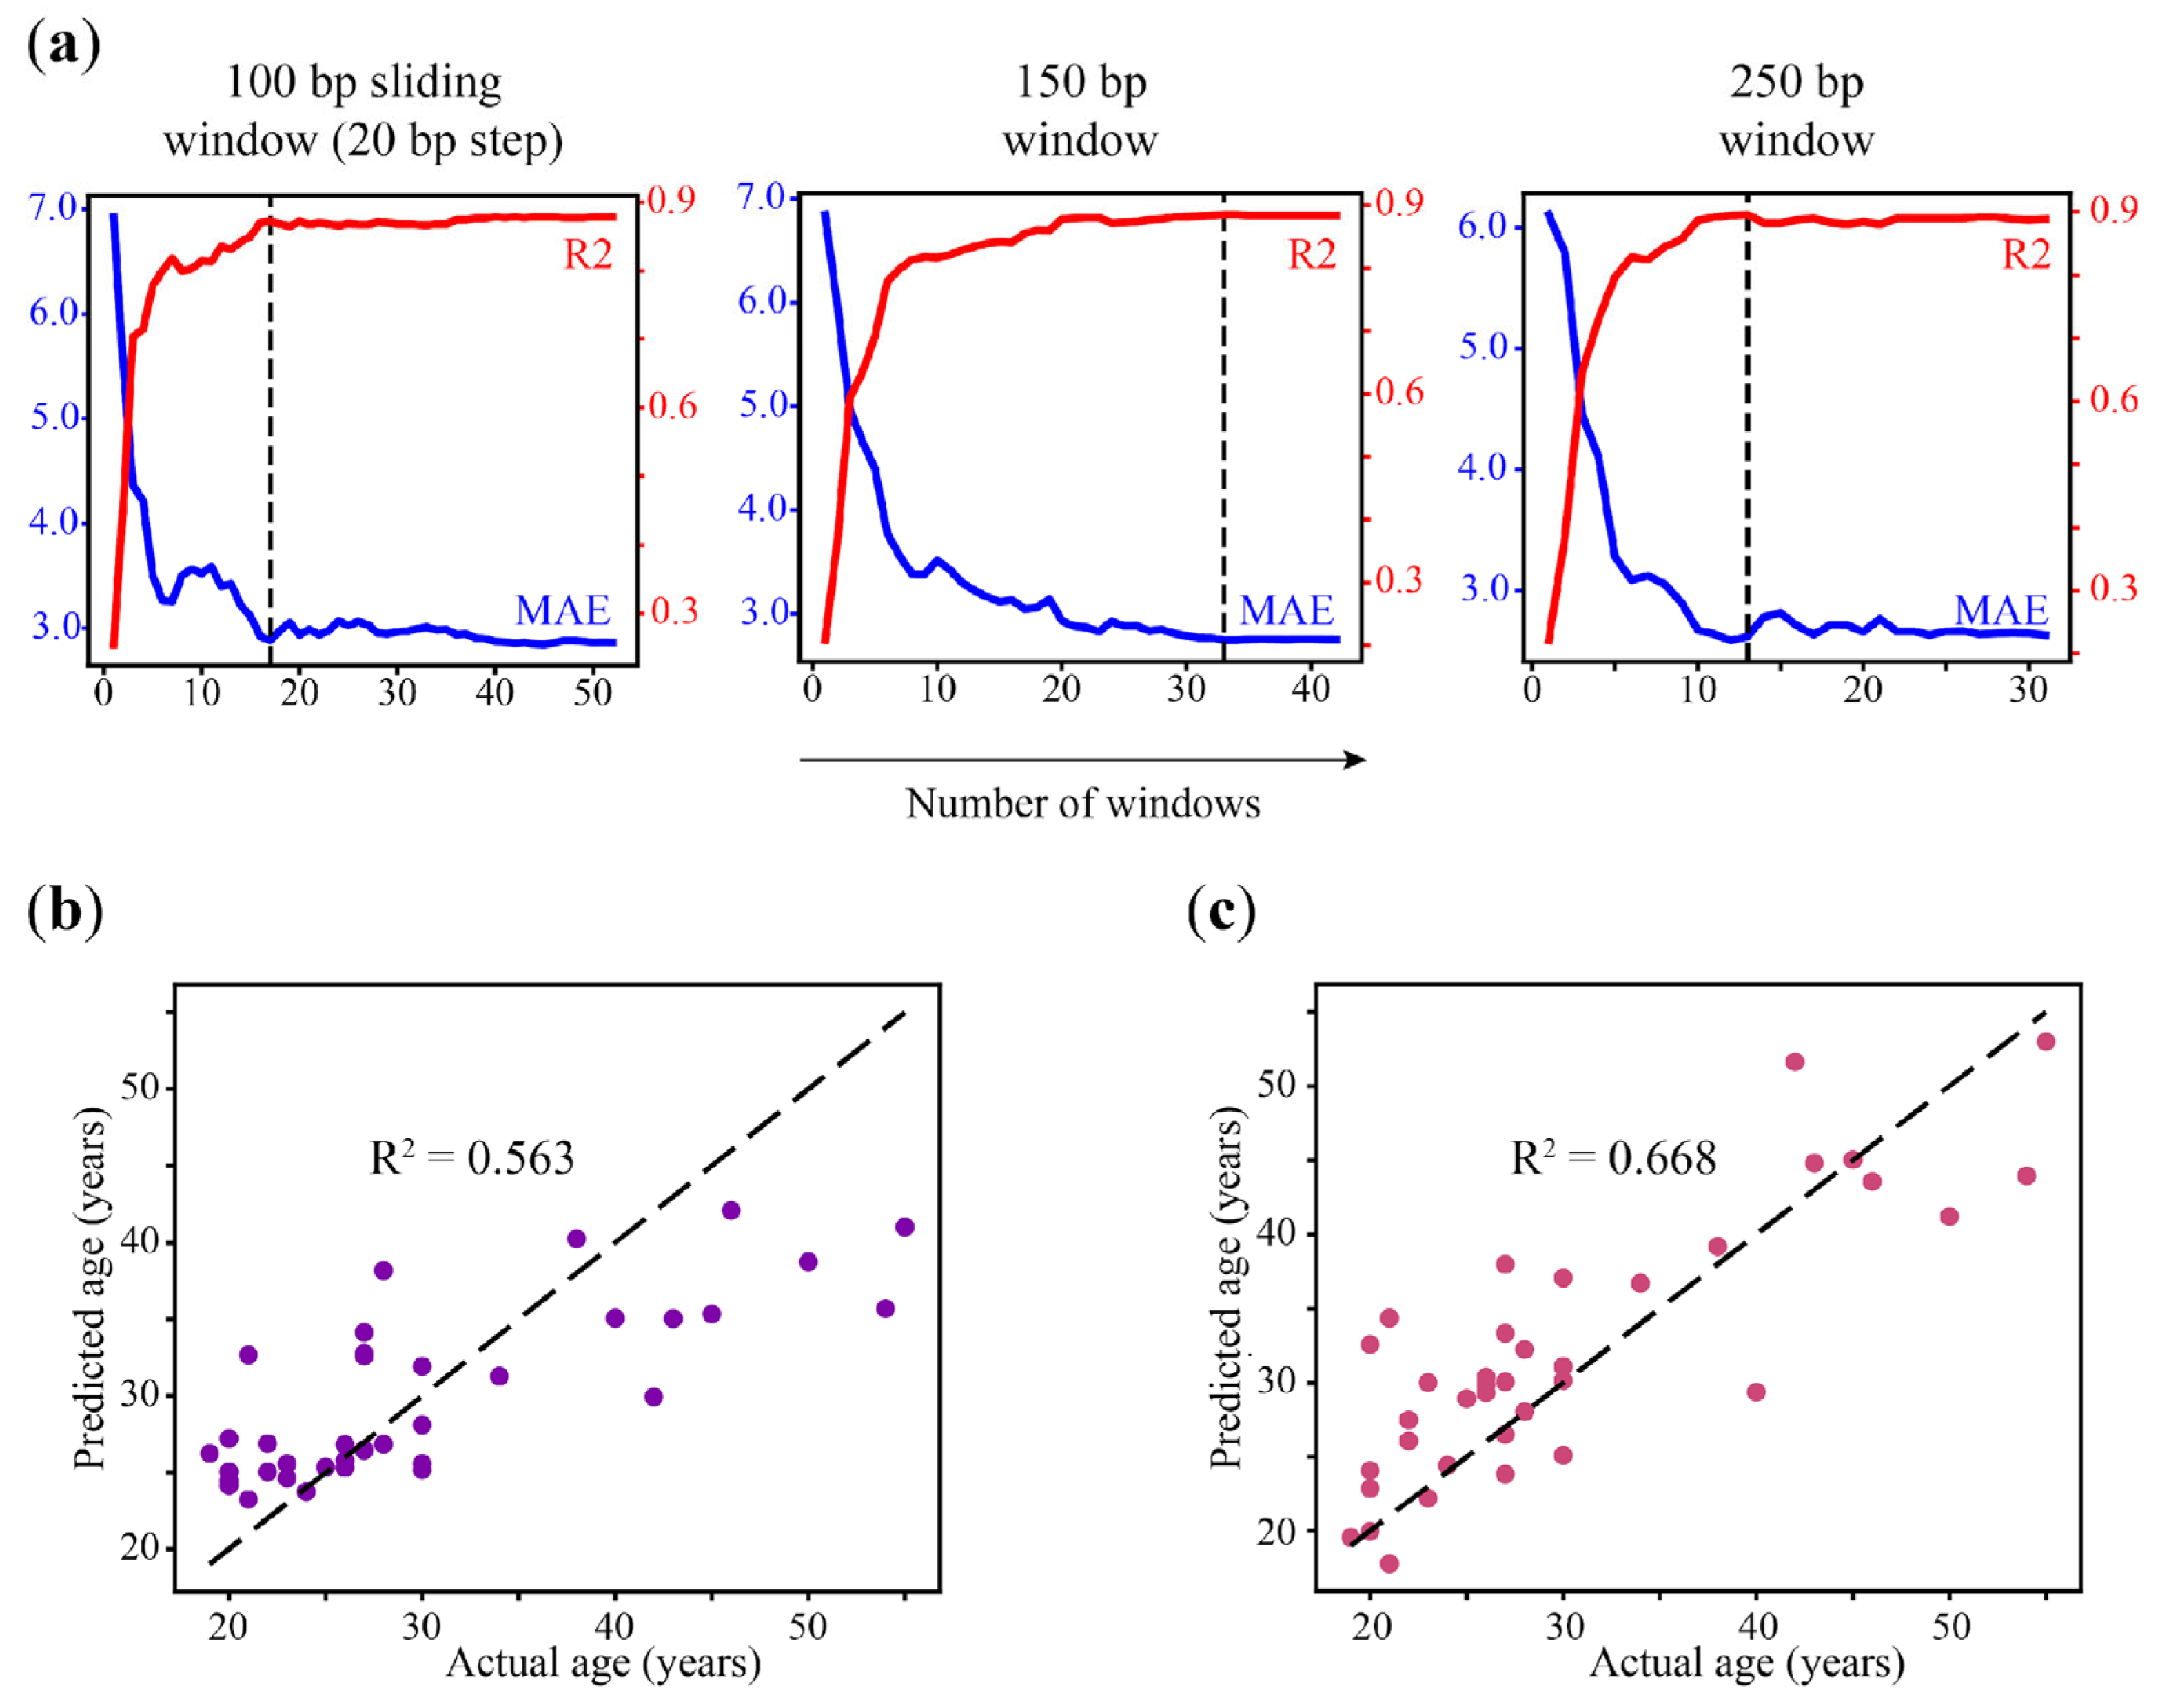
As mentioned hereinabove, WSH-based epigenetic clock models are based on heterogeneity analysis in just a few genomic regions and, therefore, they might be considered as minimized per se. To estimate the minimum number of windows that can be used to predict age by region-based model without a loss of accuracy, we applied the Recursive Feature Elimination (RFE) method that was implemented in the scikit-learn package. For this purpose, all of the genomic windows with non-zero coefficients in the LASSO regression for 250-bp (32 regions), 150-bp (43 regions), and 100 bp sliding windows (53 regions) models were extracted from each dataset and used to retrain and test the reduced models. We consecutively reduced the number of genomic windows used in each model and tested the accuracy of the resulting eAge models (
Figure 6a,
Tables S14–S16). We obtained a similar performance of the 250 bp model that was reduced from 32 to 13 windows (R
2 = 0.889, MAE = 2.633 and R
2 = 0.896, MAE = 2.618, respectively). The model based on a 150 bp window was reduced up to 33 genomic regions without substantial loss in performance (R
2 = 0.887, MAE = 2.744). The accuracy of the 100 bp (step 20) sliding window model was conserved until the set of windows was reduced to less than 17 (R
2 = 0.872, MAE = 2.884) (
Table S17). As long as the full 100 bp sliding window model showed the best performance in the initial setup, we analyzed the genes that localized closely to the regions included in the reduced model (
Table 5). A few of them were associated with age-associated differentially methylated CpG positions in the blood (
PDCD1LG2,
NRG2,
C1orf132) and with the CpGs included in other epigenetic age estimators (
C1orf132), while the others were involved in the control of apoptosis, proliferation, and metabolism [
33,
34,
35,
36,
37,
38].
Since the heterogeneity metrics are not directly related to the methylation level, but it does provide complementary information about the methylation pattern at loci, we wanted to test whether age prediction could be improved by combining WSH scores and average methylation by the reciprocal filtering of loci. Therefore, we first modeled heterogeneity-based age prediction using the loci from previously selected 100 bp (step 20 bp) age-correlated sliding windows (
Figure 6b,
Table 4). Applying heterogeneity metrics only impaired the prediction accuracy despite the fact that filtering by average methylation correlation performed best in a sliding window. We also failed to improve age prediction by generating a 100 bp step 20 sliding window region-based model on regions overlapping 48 previously selected heterogeneity loci with age-correlated PDR metrics, which demonstrated the best performance across WSH scores in the context of age prediction (
Figure 6c).
Therefore, the combined approach did not improve the performance of the original models, thereby suggesting that changes in the average methylation level and DNA methylation heterogeneity with aging are not interchangeable in terms of predicting age and might detect different aspects of DNA methylation dynamics. At the same time, it should be noted that the model based on PM and qFDRP metrics shows the best performance in regions where an age-dependent methylation pattern change is observed (
Table 6). Since these metrics are designed to capture DNA methylation disorder related to cell-type heterogeneity, this may imply that similar biological causes, at least to some extent, might underlie the heterogeneity changes detected by regional blood epigenetic clocks.

 ,
, 


