Article

Chemoresistance in Pancreatic Cancer: The Role of Adipose-Derived Mesenchymal Stem Cells and Key Resistance Genes

by
Shahram Parvaneh
1,2,†,
Vanda Miklós
3,†,
Zoltán Gábor Páhi
4,5,
Diána Szűcs
1,6,
Tamás Monostori
1,6,
Szilárd Póliska
7,
Viktória Venglovecz
8,
Tibor Pankotai
4,5,6,
Lajos Kemény
1,6,9 and
Zoltán Veréb
1,3,6,*
1
Regenerative Medicine and Cellular Pharmacology Laboratory, Department of Dermatology and Allergology, University of Szeged, H-6720 Szeged, Hungary
2
Doctoral School of Clinical Medicine, University of Szeged, H-6720 Szeged, Hungary
3
Biobank, University of Szeged, H-6725 Szeged, Hungary
4
Genome Integrity and DNA Repair Core Group, Hungarian Centre of Excellence for Molecular Medicine (HCEMM), H-6728 Szeged, Hungary
5
Department of Pathology, Albert Szent-Györgyi Medical School, University of Szeged, H-6725 Szeged, Hungary
6
Interdisciplinary Research Development and Innovation, Center of Excellence, University of Szeged, H-6720 Szeged, Hungary
7
Genomic Medicine and Bioinformatics Core Facility, Department of Biochemistry and Molecular Biology, Faculty of Medicine, University of Debrecen, H-4032 Debrecen, Hungary
8
Department of Pharmacology and Pharmacotherapy, University of Szeged, H-6720 Szeged, Hungary
9
HCEMM-SZTE Skin Research Group, University of Szeged, H-6720 Szeged, Hungary
*
Author to whom correspondence should be addressed.
These authors contributed equally to this work.
Int. J. Mol. Sci. 2025, 26(1), 390; https://doi.org/10.3390/ijms26010390
Submission received: 29 September 2024 / Revised: 21 December 2024 / Accepted: 23 December 2024 / Published: 4 January 2025
(This article belongs to the Special Issue The Roles of Mesenchymal Stem/Stromal Cells in Tumor Therapies)

Abstract

:
Drug resistance is a significant challenge in pancreatic ductal adenocarcinoma (PDAC), where stromal elements such as adipose-derived mesenchymal stem cells (ASCs) contribute to a chemoresistant tumor microenvironment (TME). This study explored the effects of oxaliplatin (OXP) and 5-fluorouracil (5-FU) on PDAC cells (Capan-1) and ASCs to investigate the mechanisms of chemoresistance. While OXP and 5-FU reduced Capan-1 viability in a dose- and time-dependent manner, ASCs demonstrated high resistance, maintaining > 90% viability even at cytotoxic doses. Transcriptomic analyses revealed OXP-induced transcriptional reprogramming in ASCs, with over 7000 differentially expressed genes, highlighting the pathways related to DNA damage response, cell cycle regulation, and stress-related signaling. In contrast, 5-FU elicited limited transcriptional changes, affecting only 192 genes. Cytokine proteome profiling revealed that OXP-treated ASCs significantly influenced the tumor microenvironment by promoting immune evasion (via IL-4, GM-CSF, IP-10, and GROα) and driving extracellular matrix remodeling (through EMMPRIN and DPPIV). In contrast, 5-FU induced comparatively weaker effects, primarily limited to hypoxia-related pathways. Although OXP reduced angiogenic factors, it paradoxically activated pro-survival pathways, thereby enhancing ASC-mediated tumor support. These findings underscore ASCs as modulators of chemoresistance via secretome alterations and stress adaptation. Therefore, future strategies should prioritize the precise targeting of tumor cells while also focusing on the development of personalized treatments to achieve durable therapeutic responses in PDAC.

1. Introduction

Pancreatic cancer is recognized as a highly aggressive human malignancy, often called a silent threat, because it typically shows no noticeable symptoms until advanced stages, making early diagnosis challenging and leading to poor patient outcomes [1,2]. Over the years, the incidence of pancreatic cancer has increased steadily [3]. The fatality rate within the first year of diagnosis is approximately 75%, with less than 10% survival rate over five years [3,4]. Pancreatic ductal adenocarcinoma (PDAC) represents 90% of all pancreatic tumors, and around 50% of PDAC patients have no clear symptoms in the early stages [5]. As a result, many patients are diagnosed at advanced stages, limiting the potential for radical surgery [5,6]. Consequently, patients must rely on chemotherapy and radiotherapy during later stages of treatment. This shift in the treatment strategies is influenced by the unique challenges posed by the tumor microenvironment (TME) in pancreatic cancer along with the intrinsic resistance of cancer cells to chemotherapy [7]. This resistance, in turn, allows specific malignant cells to survive, complicating treatment approaches even further [8]. Moreover, approximately 40% of patients with PDAC experience tumor recurrence even after surgical resection and die within a year [9]. Despite advancements in diagnostic techniques and the growing range of therapeutic options, the main challenge emerging after the latent phase of the disease stems from the tumor’s intrinsic resistance to chemotherapy [10]. However, most anticancer therapies are designed to target cancer cells, often neglecting the non-cancerous cells in the TME, which can profoundly influence the tumor’s response [11,12]. The TME consists of several components, including the extracellular matrix, endothelial cells, immune cells, cancer-associated fibroblasts (CAFs), and mesenchymal stromal cells (MSCs) [13]. Cancer cells secrete chemotactic signals that recruit adipose-derived stem cells (ASCs) from local tissues and MSCs from the bone marrow [14]. These recruited cells can differentiate into tumor-associated MSCs (TAMSCs) or CAFs [15]. These stromal cells play an essential role in constructing the connective tissue and extracellular matrix within the tumor, and their contribution to chemotherapy resistance is a crucial area of investigation [15,16]. Numerous studies have demonstrated that interactions between MSCs and tumor cells shape the TME and influence cancer progression in various malignancies, including breast, gastric, pancreatic, and colorectal cancers [17,18,19,20]. A key mechanism under investigation is ASC-mediated mitochondrial transfer, which supports cancer cell survival and metabolic adaptation, contributing to the emergence of resistance to therapies [21,22]. In PDAC, MSC recruitment to the TME is linked with disease progression and therapy resistance [23]. Bone marrow-derived MSCs, for example, differentiate into CAFs or TAMSCs in PDAC tumors, contributing to the CAF population [24]. Adipose tissue is another critical source of CAFs in PDAC due to the pancreas’s retroperitoneal location near adipose deposits [25,26]. ASCs can differentiate into two distinct CAF subpopulations: myoblastic CAFs (myCAFs) or inflammatory CAFs (iCAFs), depending on their proximity to PDAC cells in vitro [27]. The interaction between stromal cells and tumor cells is regulated by extracellular vesicles, cytokines, chemokines, and direct cell-to-cell communication, all promoting CAF activation and tumor growth [28]. MSCs are known to secrete a wide array of cytokines that play key roles in angiogenesis, ECM remodeling, and immune modulation, all crucial in supporting cancer progression and metastasis [29]. Several intracellular pathways, including JAK/STAT, mTOR, and NF-κB, mediate the stromal–tumor crosstalk [30,31,32]. Furthermore, MSCs have been investigated as potential carriers for anticancer therapies because of their homing ability into tumor sites [33]. While their well-known properties such as self-renewal, immune regulation, and differentiation capacity are well established, their role in contributing to tumor chemoresistance is still not fully understood [34]. For example, bone marrow-derived MSCs have been shown to enhance the chemoresistance of CD133-expressing gastric cancer cells via activation of the PI3K/Akt pathway, increasing Bcl-2 expression and decreasing BAX levels [35]. Oxaliplatin (OXP) and 5-fluorouracil (5-FU) are two chemotherapy agents commonly used, either alone or in combination with other regimens, for PDAC treatment [36,37]. 5-FU inhibits thymidylate synthase (TS) and incorporates its metabolites into RNA and DNA, while OXP, a platinum-based drug, interferes with DNA replication by forming DNA adducts, leading to cell death [38,39,40].
This study investigates the effects of the chemotherapeutic agents 5-FU and OXP on the PDAC cell line (Capan-1) and ASCs. We aim to evaluate the cytotoxic impact of these drugs on both cancerous and stromal cells. Furthermore, we perform transcriptomic and protein array analyses of ASCs following chemotherapy treatment to uncover changes in the gene expression and cytokine secretion profile that may illuminate the interactions between stromal cells and the mechanisms underlying chemoresistance. These findings provide valuable insights into the molecular alterations in ASCs induced by 5-FU and OXP, advancing our understanding of the role of stromal cells in chemoresistance in PDAC.

2. Results

2.1. Analysis of OXP and 5-FU Cytotoxicity on Capan-1 Cells and ASCs

Using the MTT assay, the cytotoxicity effects of OXP and 5-FU were evaluated on the Capan-1 cell line at 24 and 48 h (Figure S1) and on ASCs at 48 h. The results showed a significant decrease in cell viability as the concentration of the anticancer drugs increased (ranging from 6.25 to 1000 μM), indicating a dose- and time-dependent pattern in response. Higher concentrations led to more severe effects on cell viability. For both Capan-1 and ASCs, OXP exhibited the highest cytotoxicity effects (Figure 1a,b, and Table S1).
The half-maximal inhibitory concentration (IC50) values, representing the concentration at which 50% of cell growth is inhibited, are reported in Table S1. The effects of OXP and 5-FU on Capan-1 cells at 24 and 48 h were statistically significant compared with untreated controls at concentrations of 50 µM or higher. While the IC50 for 5-FU was not reached at 24 h, even at the highest concentration of 1000 μM (Figure S1), the IC50 for OXP was successfully achieved within this treatment time.
The MTT assay results evaluating the cytotoxic effects of anticancer treatments on ASCs revealed an IC50 value for OXP only at concentrations of 250 μM and higher (Figure 1a,b and Table S1). Remarkably, at a concentration of 50 μM, equivalent to the IC50 for Capan-1 cells, the viability of ASCs remained above 90% at 48 h post-treatment. Moreover, even 48 h after treatment with 1000 μM of 5-FU, the viability of ASCs consistently remained above 90% (Figure 1a,b and Table S1). The comparison of the antiproliferative effects of 5-FU (Accord), administered to patients in the hospital, on Capan-1 and ASC cells after 48 h of treatment revealed a similar pattern to that we used (Sigma) in all our experiments (Figure S1D). Even after 48 h of treatment at concentrations of 50 µM or higher of OXP and 5-FU, ASCs exhibited more resistance to these anticancer drugs than Capan-1 cells. Notably, for the mitomycin (Mito), which was used as the positive control, the IC50 was reached in Capan-1 cells at 24 h post-treatment (Figure S1). In contrast, even after 48 h of treatment with Mito in ASCs, the IC50 was not reached, highlighting the high resistance of ASCs to cytotoxic treatment (Figure 1a,b).

2.2. OXP Treatment-Induced Pronounced Gene Expression Changes Compared with 5-FU Treatment and Untreated Controls in ASCs

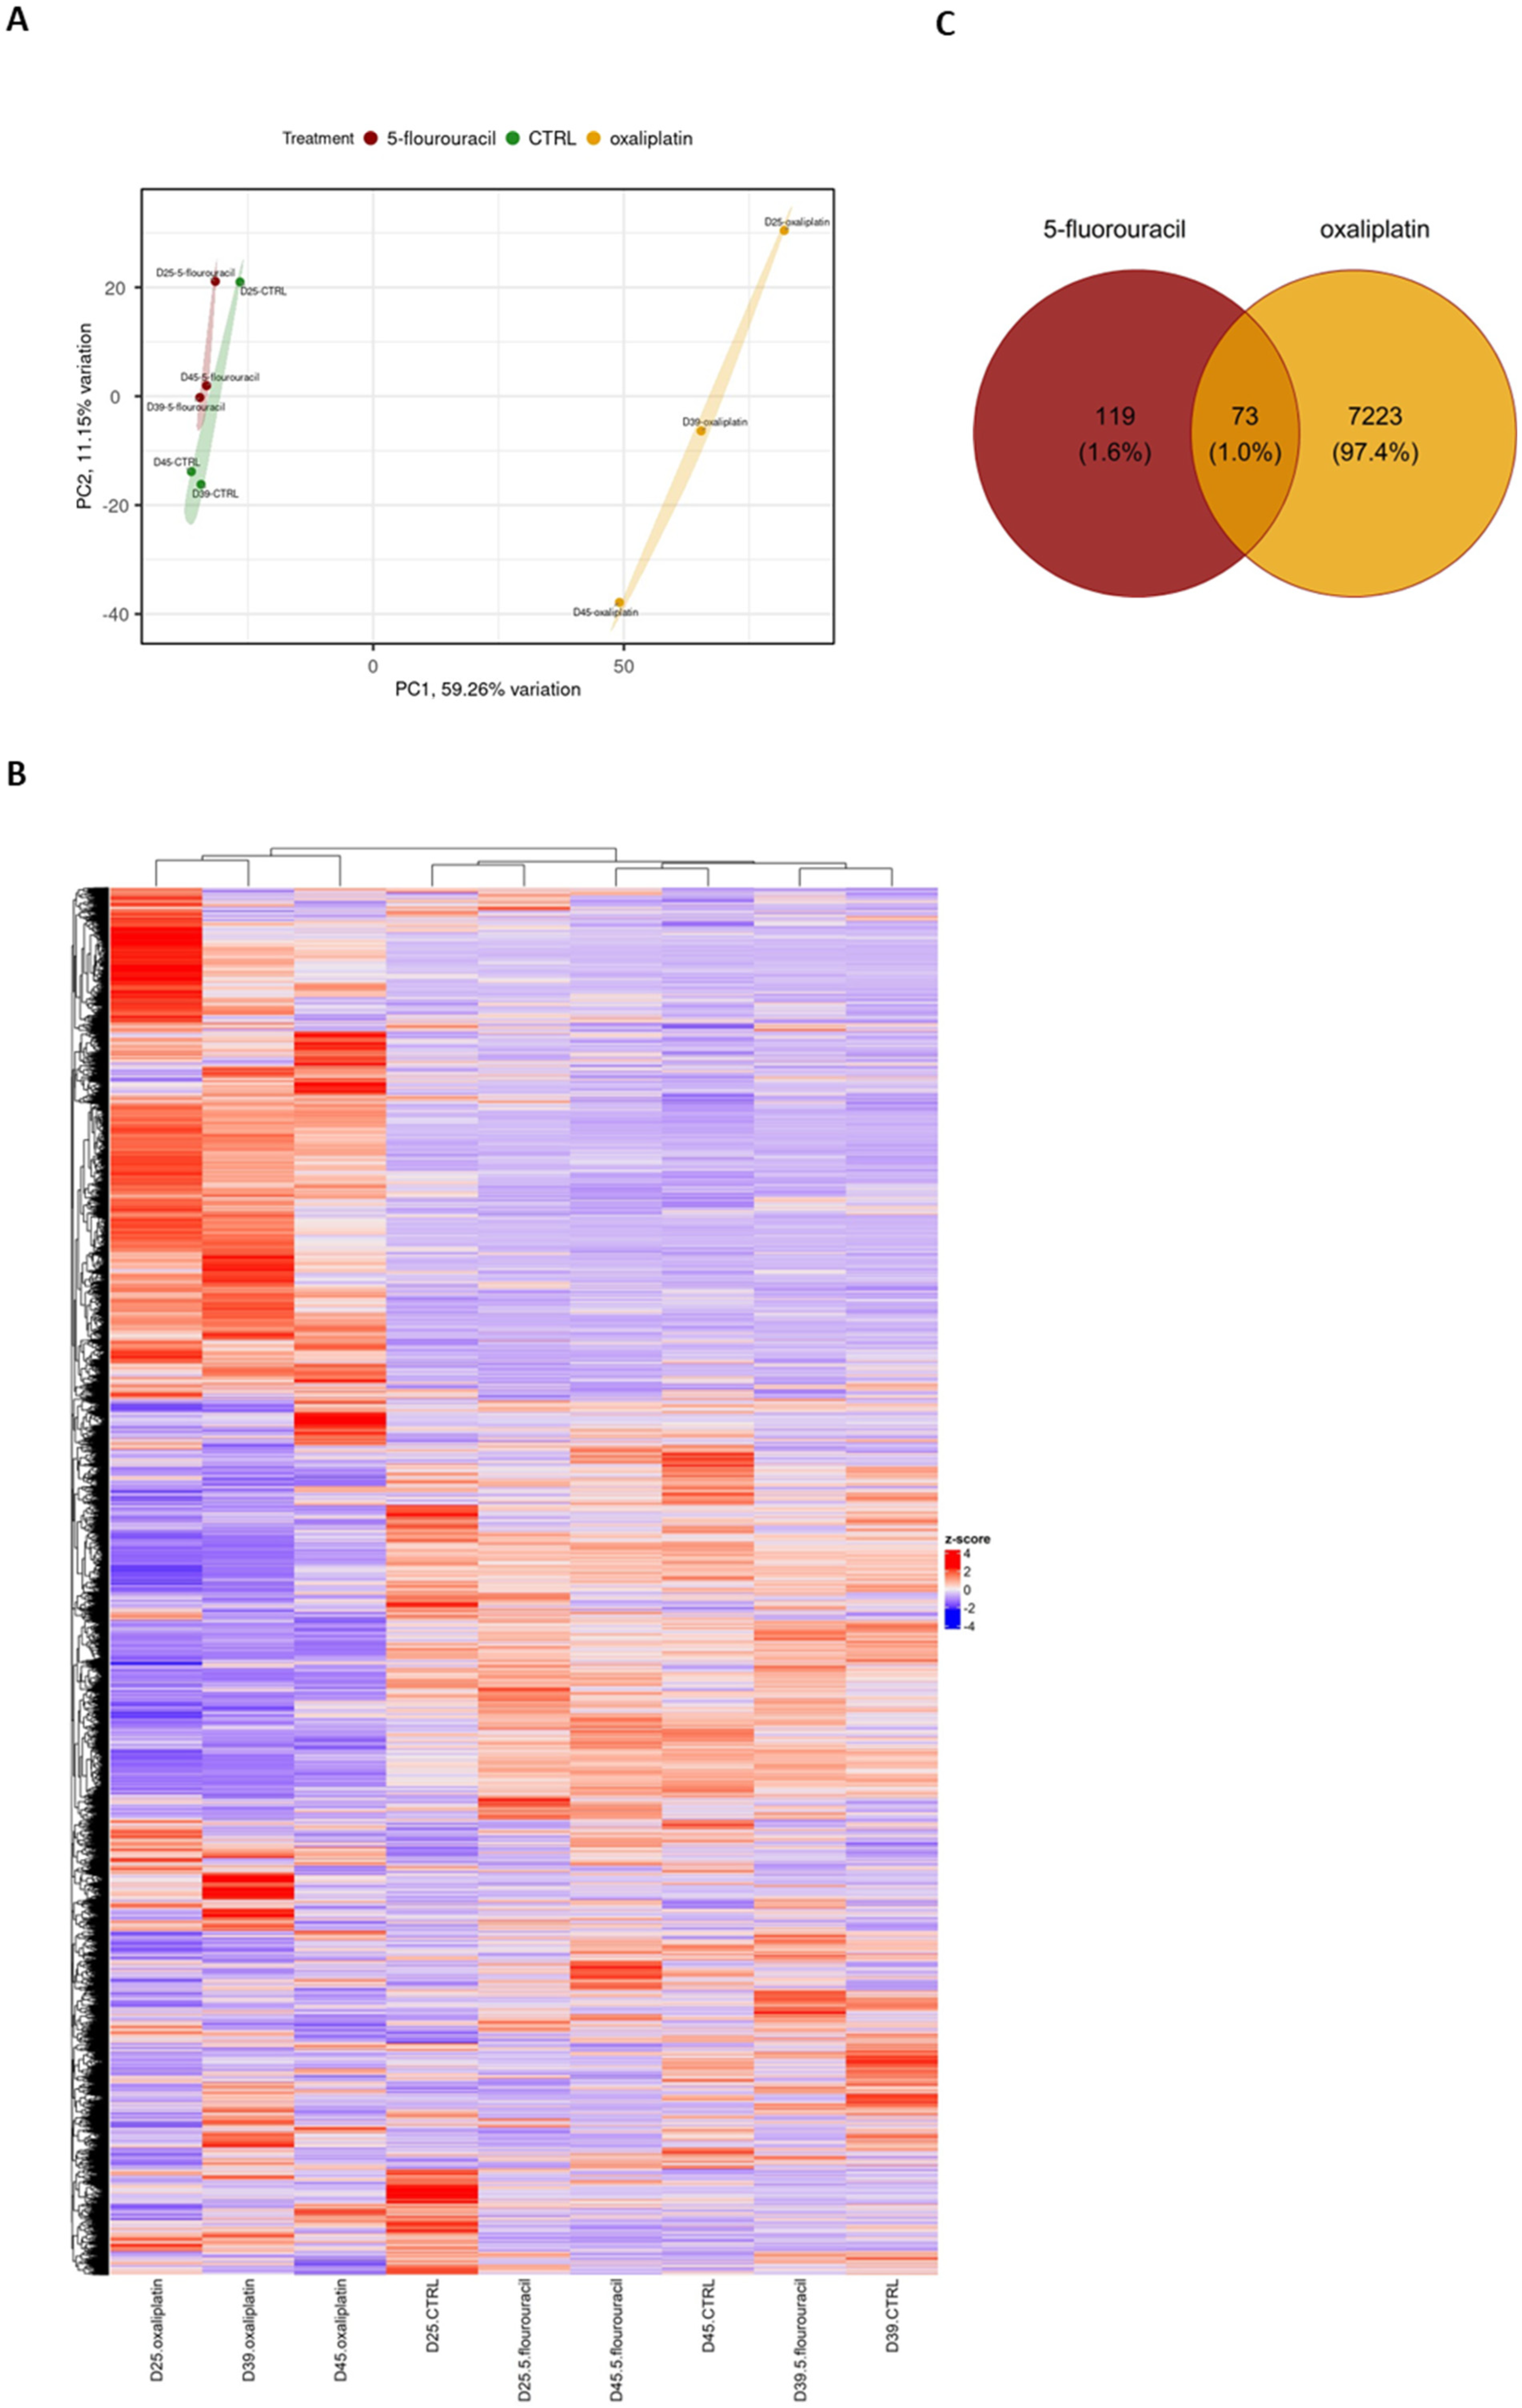
RNA sequencing of ASCs treated with OXP and 5-FU revealed significant differences between the OXP-treated samples compared with the 5-FU-treated and untreated samples. Interestingly, while there were no significant differences between the untreated controls and the 5-FU-treated samples, the OXP treatment induced substantial alterations in gene expression. In the principal component analysis (PCA), ASC samples treated with 5-FU treatments were clustered with the untreated controls, indicating similar gene expression patterns. In contrast, the OXP-treated samples formed a distinct cluster, suggesting a unique transcriptional response (Figure 2A). Specifically, the analysis showed that 7296 genes were differentially expressed in response to OXP treatment compared with the untreated controls, whereas only 192 differentially expressed genes (DEGs) were found in response to 5-FU treatment. Moreover, 73 DEGs were identified to be commonly altered by both treatments. In the OXP treatment group, among the DEGs, 4043 genes were upregulated, and 3253 were downregulated compared with the untreated controls (Figure 2C).
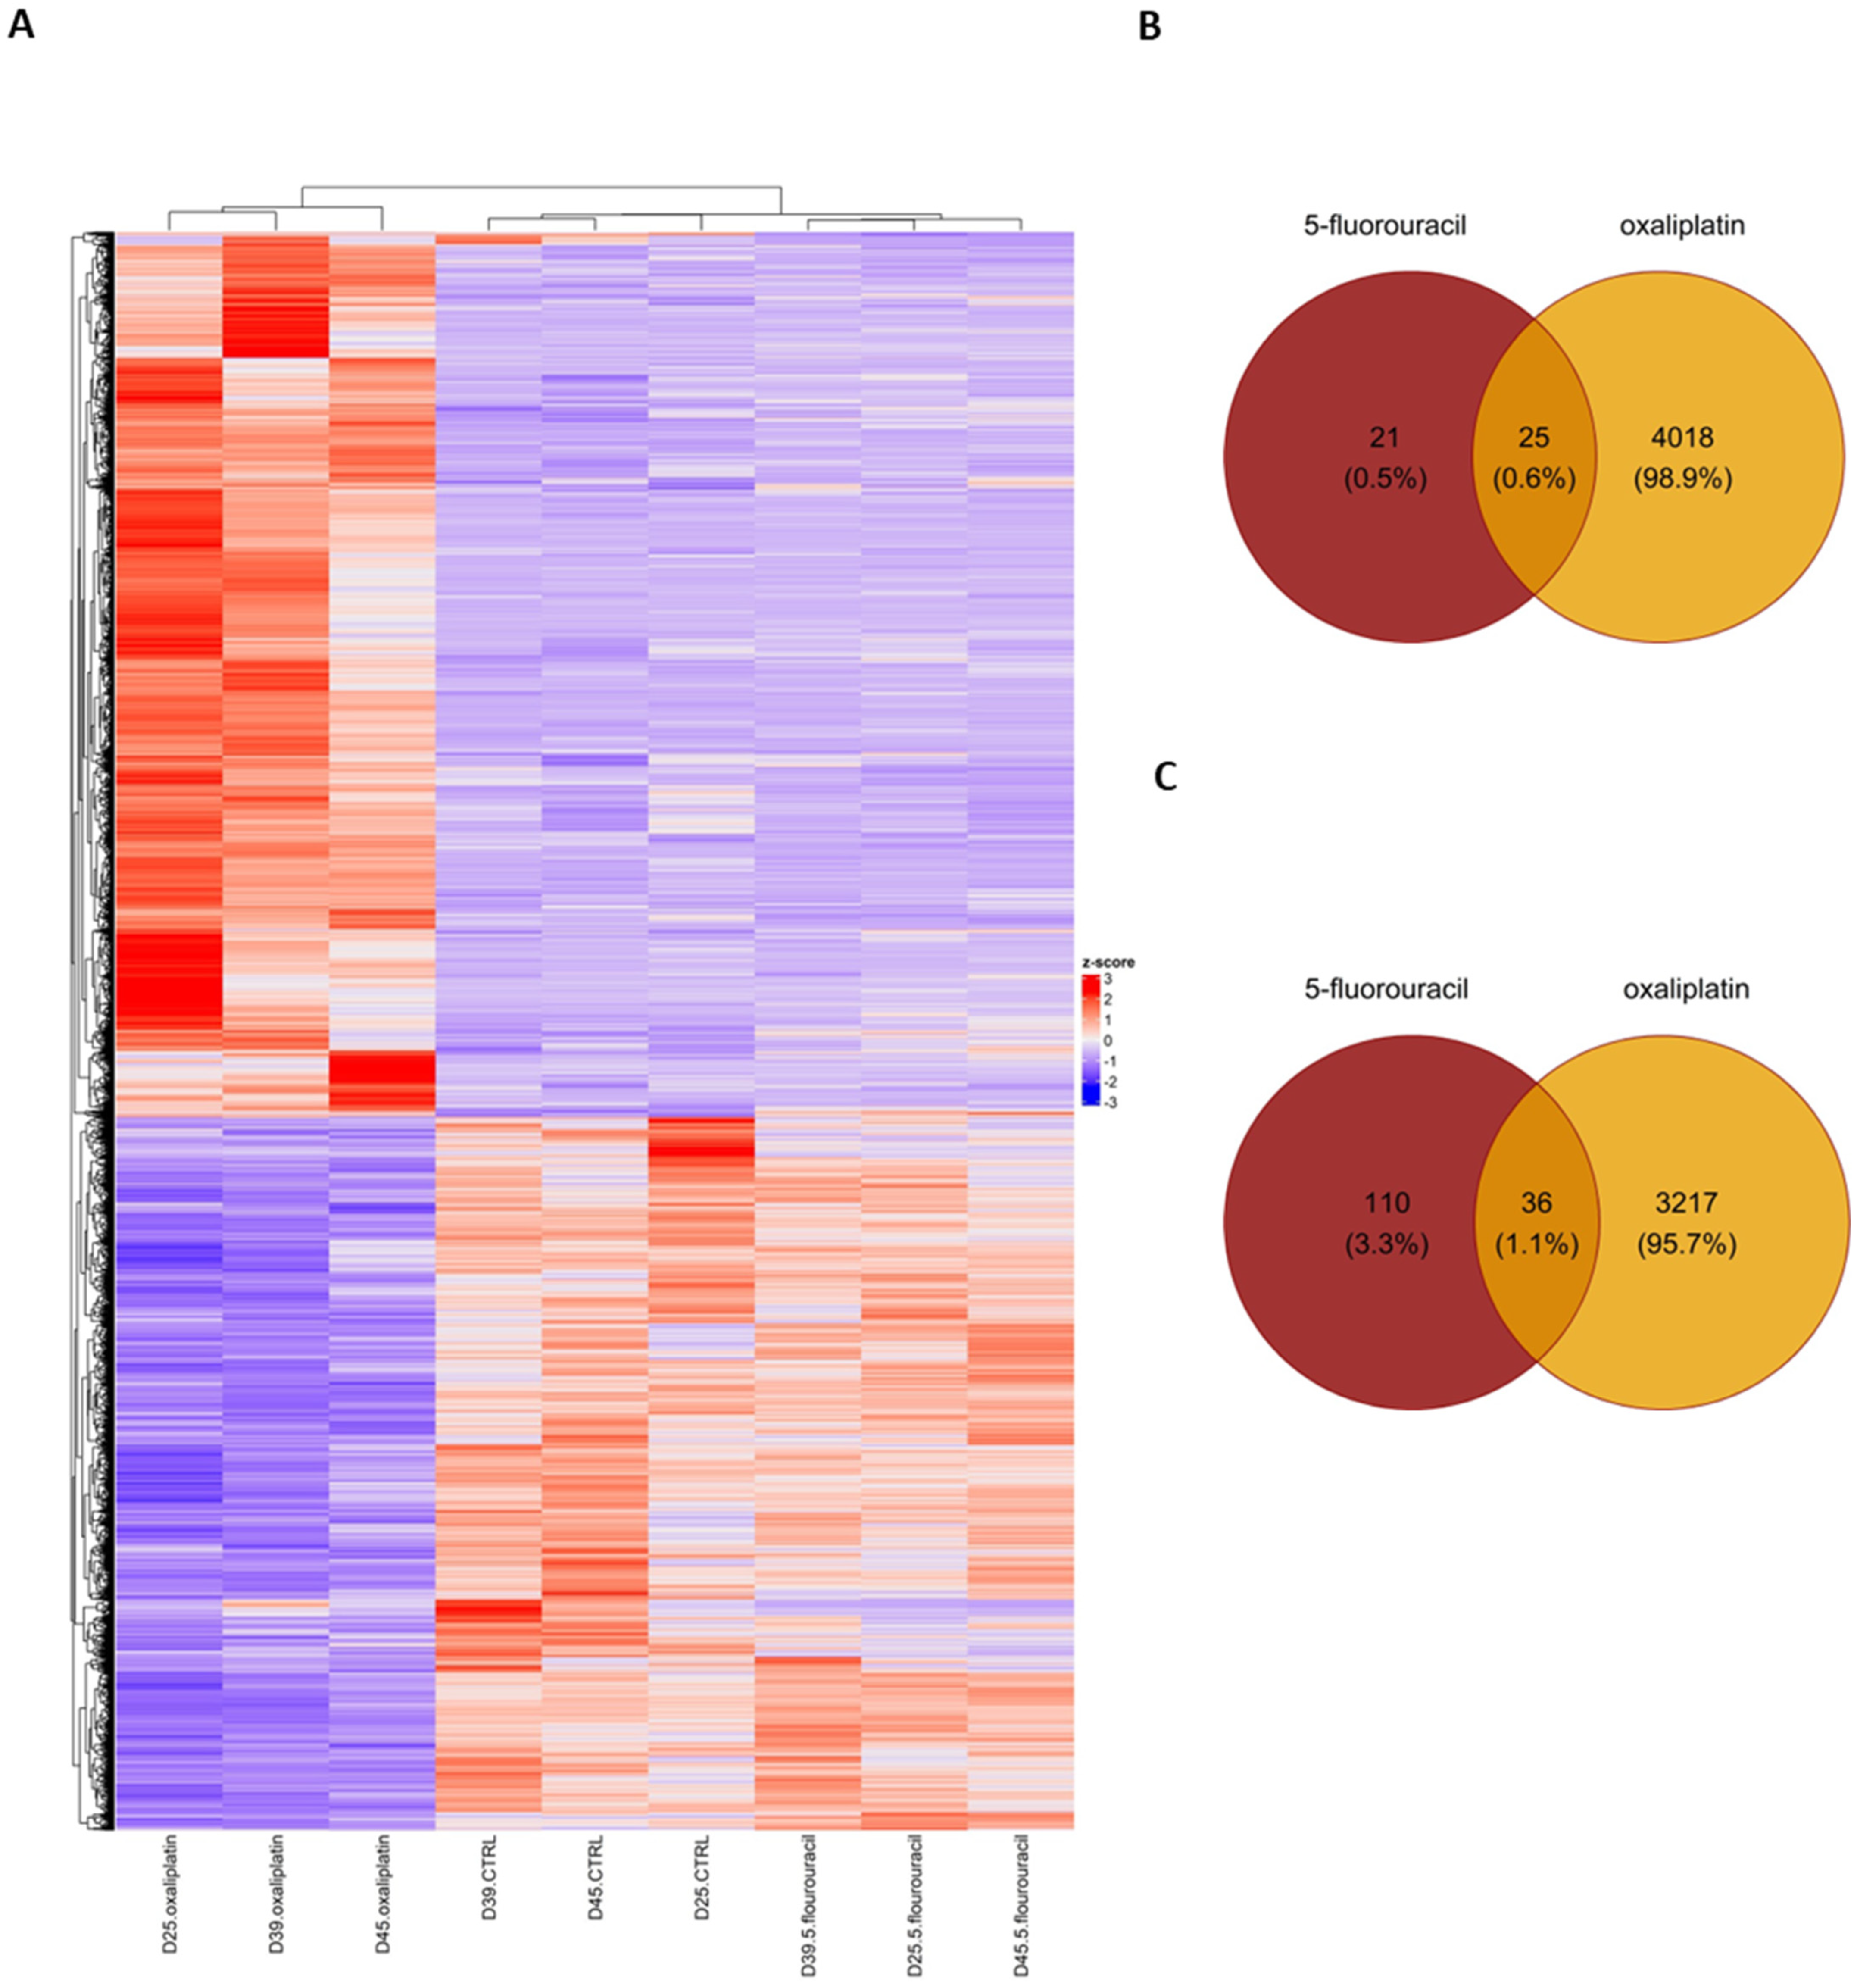
Within the DEGs identified in the 5-FU group, 46 genes were upregulated and 146 genes were downregulated compared with untreated controls (Figure 3C).

2.3. Gene Ontology (GO) Enrichment Analysis of DEGs in ASCs Treated with OXP and 5-FU

We performed a comprehensive GO enrichment analysis on the DEGs identified in the ASCs treated with OXP and 5-FU. The study revealed several significant enrichments in biological processes (BPs). Among the positively enriched GO terms, several crucial pathways involved in cellular responses to various stimuli and checkpoints in cell-cycle progression were identified. One notable enrichment is associated with the GO term “GO:0006977”, which involves “DNA damage response, signal transduction by p53 class mediator resulting in cell cycle arrest”. This GO term enrichment suggests increased activity in pathways responsible for detecting DNA damage and triggering cell cycle arrest mediated by p53 class proteins. Genes such as MDM2 and PIDD1 are implicated in this process (Table 1).
Among the positively enriched GO terms, several biological processes are notably represented, including the negative regulation of cell cycle progression (GO:0010948), DNA damage response (GO:0006977), cellular response to hypoxia (GO:0071456), and mitotic G1 DNA damage checkpoint signaling (GO:0031571) (Table 2). These findings indicate active mechanisms controlling cell cycle progression, responses to environmental stresses such as hypoxia, and the maintenance of genome stability. Moreover, the enrichment analysis highlights the involvement of specific genes in these processes, including B-cell Lymphoma 6 (BCL6), MDM2, PIDD1, and RBM14, among others (Table 1.) Among the negatively enriched GO terms for 5-FU and OXP, we identified exciting candidates, including Aurora kinase A (AURKA), B-cell Lymphoma 6 (BCL6), and breast cancer gene 1 (BRCA1) (Table 1). The expression patterns of genes that determine the biological pathways involved in tumorigenesis clearly show that oxaliplatin causes marked changes, whereas 5-FU is more like the untreated control, showing that it does not affect mesenchymal stem cells as it does tumor cells (Figures S2 and S3).

2.4. Differentially Expressed Gene Set Enrichment (GSEA) Analysis Results for ASCs Treated with Oxaliplatin

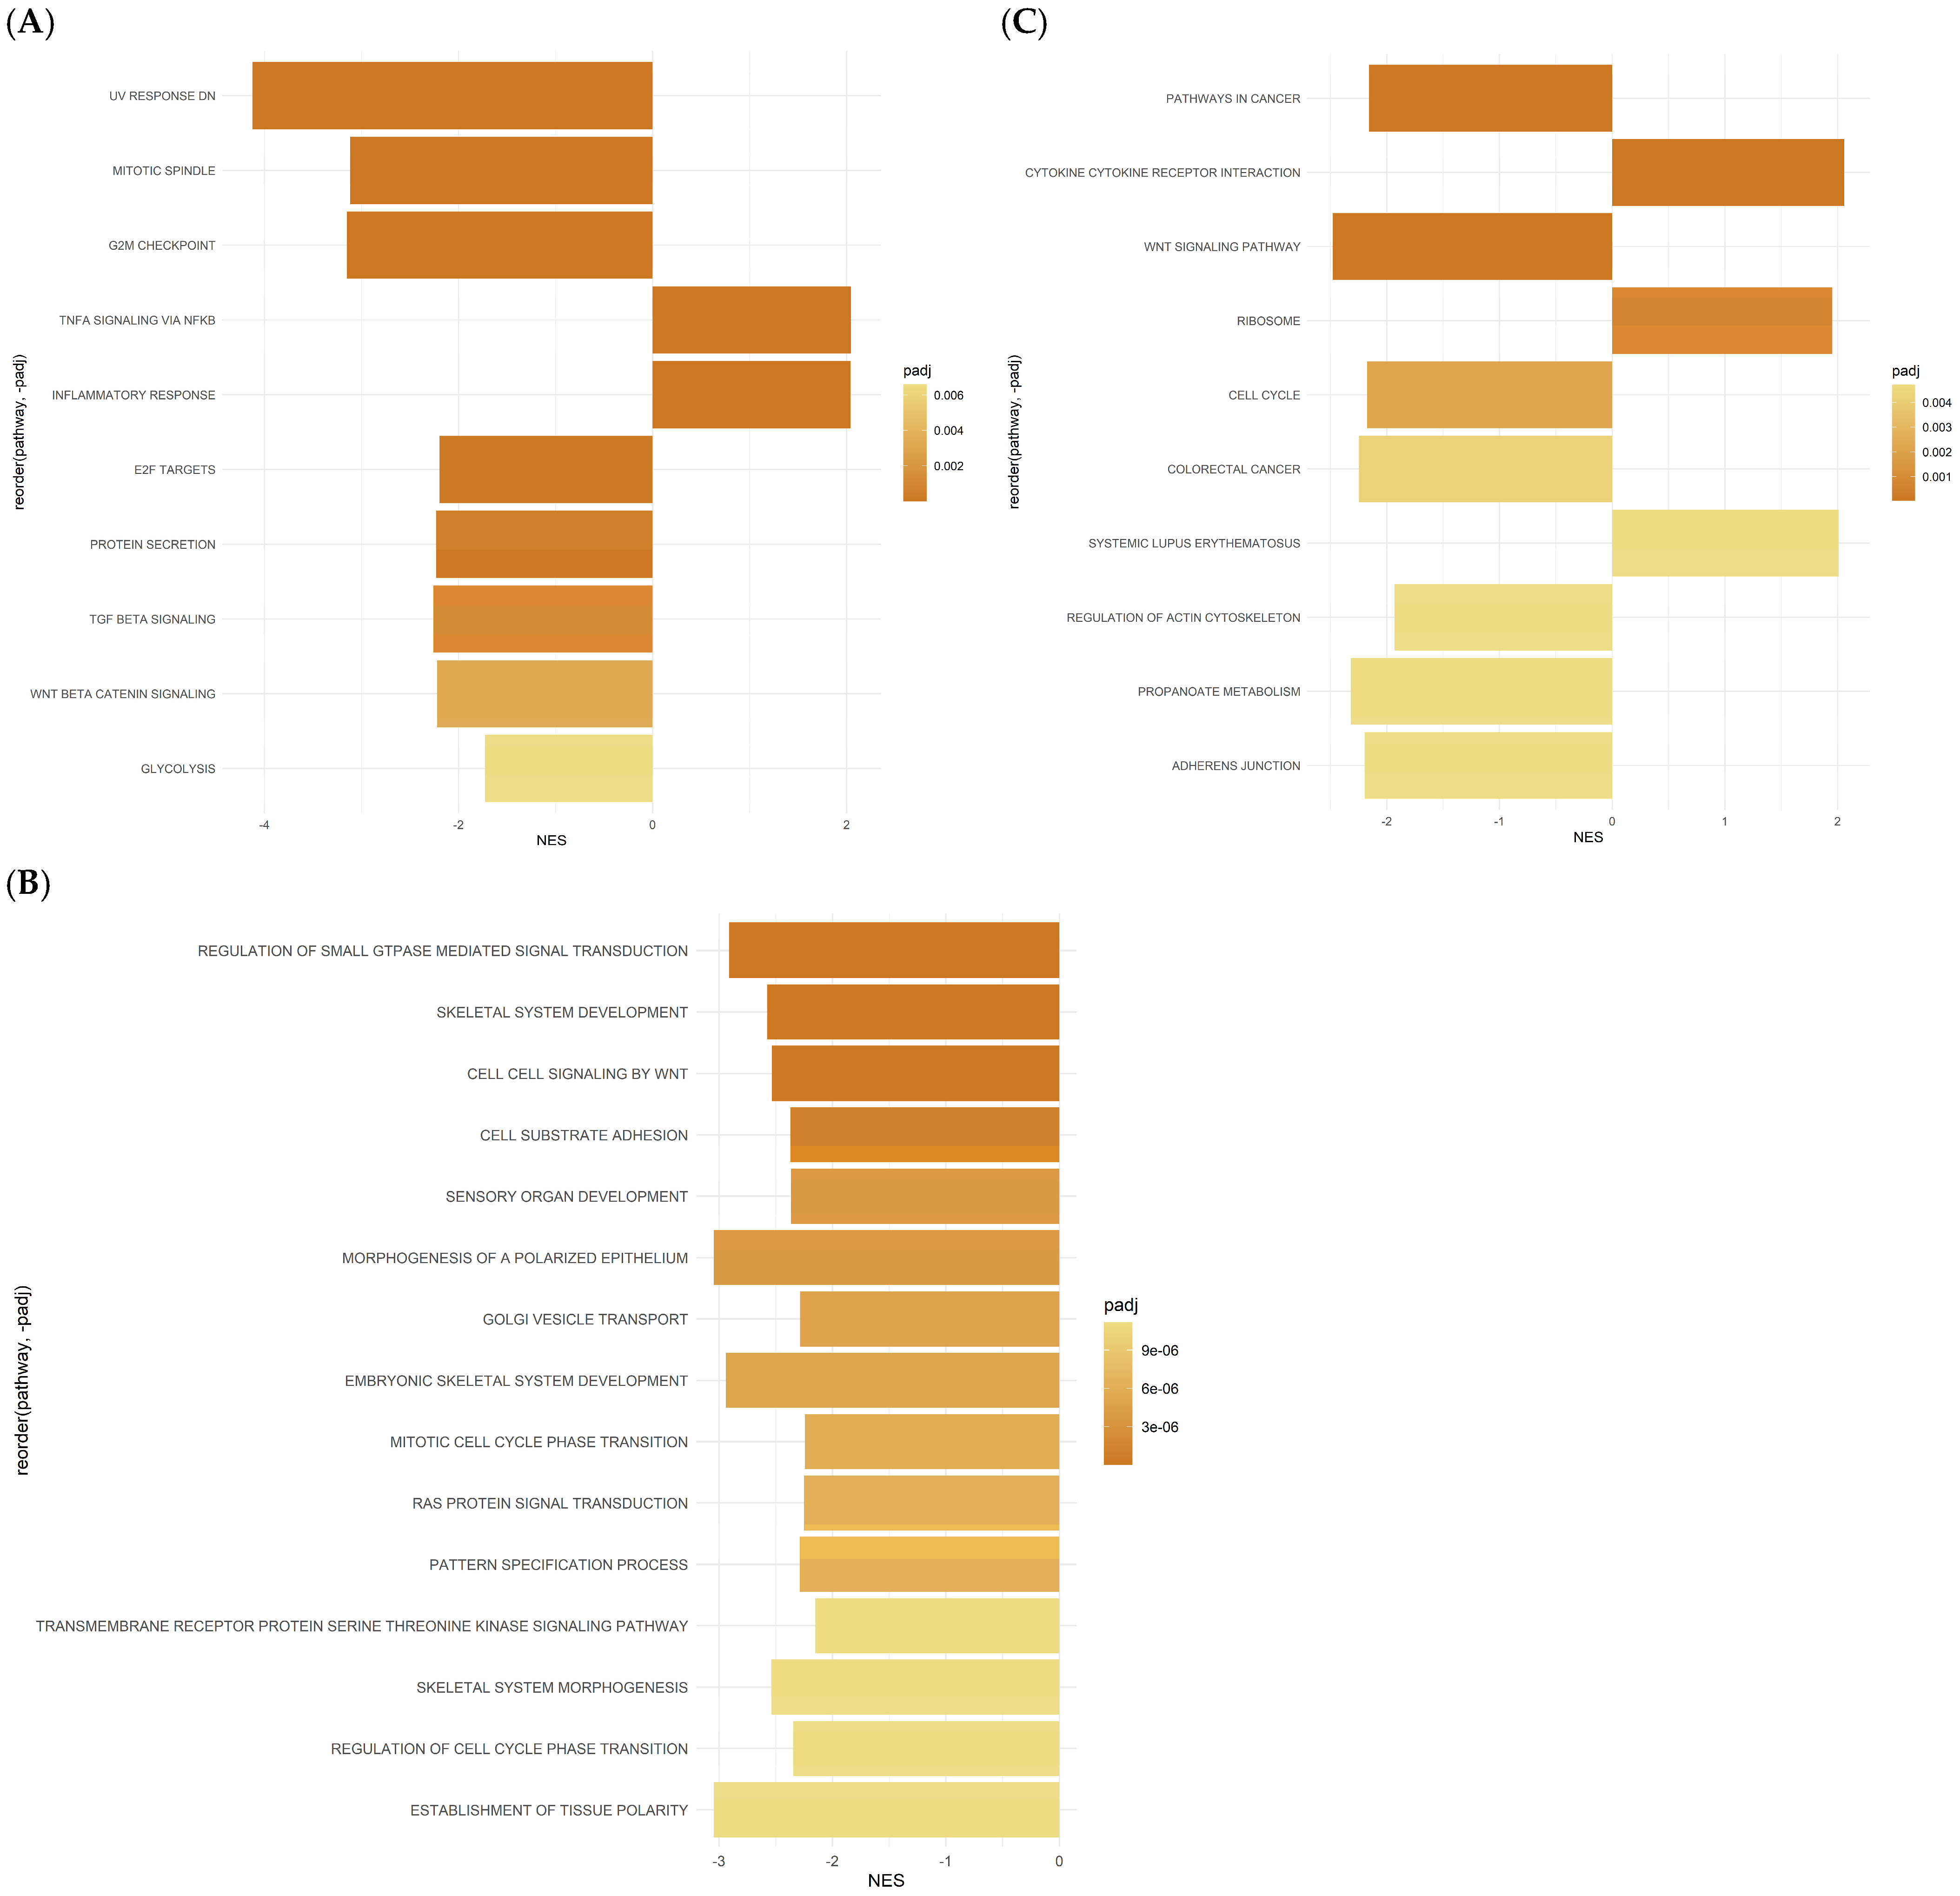
Pathway analysis revealed the dysregulation of several BPs in response to OXP treatment. Notably, analysis of the hallmark gene set pathways following OXP treatment revealed several pathways exhibiting significant regulation, each associated with diverse BPs, as shown in Figure 4A and Table 2. Among these, the HALLMARK_E2F_TARGETS pathway, with a significant p-value of 2.64 × 10⁻⁵ and a normalized enrichment score (NES) of −2.19, plays a crucial role in regulating the transcriptional activity of E2F transcription factors, which comprise 66 genes.
Similarly, the HALLMARK_PROTEIN_SECRETION pathway showed significant enrichment (p-value: 5.92 × 10⁻⁵, NES: −2.23), suggesting alterations in protein secretion mechanisms. This pathway consists of 48 genes crucial to intracellular trafficking and cellular communication. Furthermore, the HALLMARKs_TGF_BETA_SIGNALING and WNT_BETA_CATENIN_SIGNALING pathways displayed significant enrichment, with p-value: 0.00022, NES: −2.26 and p-value: 0.00059, NES: −2.22, respectively. These pathways are implicated in cell signaling and development. Another important pathway, HALLMARK_GLYCOLYSIS, demonstrated significant enrichment, with a p-value of 0.00132 and an NES of −1.73. This pathway, comprising 71 genes, is central to cellular energy metabolism, particularly glycolytic processes. Additionally, the HALLMARK_APICAL_SURFACE and HALLMARK_ANDROGEN_RESPONSE pathways were identified as significantly enriched (p-value: 0.00178, NES: −2.04 and p-value: 0.00268, NES: −1.77, respectively). These pathways are associated with epithelial cell polarity and androgen-mediated signaling events. Moreover, the HALLMARKs_IL6_JAK_STAT3_SIGNALING and INTERFERON_GAMMA_RESPONSE pathways showed significance with p-values of 0.00835 and 0.01327, respectively (Figure 4A, Table 2). These pathways play crucial roles in the immune response modulation and cytokine signaling pathways.
The exploration through KEGG (Kyoto Encyclopedia of Genes and Genomes) annotations uncovers diverse enriched pathways, highlighting their roles in biological processes (Figure 4B and Table 3). Sitting prominently within the top 10 is the KEGG_CYTOKINE_CYTOKINE_RECEPTOR_INTERACTION pathway, boasting a strikingly low p-value of 3.94 × 10⁻⁷ and NES of 2.06, indicating its positive significant enrichment. This pathway is essential for intercellular communication, primarily through cytokine–receptor interactions. Another important pathway is the KEGG_PATHWAYS_IN_CANCER, which demonstrates considerable enrichment with a p-value of 4.23 × 10⁻⁷ and NES of −2.16, suggesting a potential downregulation. This pathway remains central to cancer biology, offering critical insights into tumor progression and malignancy. Another standout contender is the KEGG_WNT_SIGNALING_PATHWAY, boasting a p-value of 7.93 × 10⁻⁷. Despite its negative NES of −2.48, suggesting downregulation, this pathway remains pivotal to developmental processes and disease pathology, notably cancer. In contrast, the KEGG_RIBOSOME pathway, while exhibiting a higher p-value of 1.80 × 10⁻⁵, highlights a positive NES of 1.95. This pathway is the cornerstone of protein synthesis and ribosomal function, vital for maintaining cellular equilibrium. Further, the KEGG_CELL_CYCLE pathway hints at potential downregulation with a p-value of 6.57 × 10⁻⁵ and a negative NES of −2.17. Orchestrating the orderly progression of cell division, this pathway underscores its importance in regulating cellular proliferation and growth, which the heatmaps of DEGS showed in Figure 5. Moreover, pathways like KEGG_COLORECTAL_CANCER and KEGG_ADHERENS_JUNCTION exhibit notable enrichment, suggesting their roles in colorectal cancer development and cell–cell adhesion processes. The analysis extends to metabolic pathways, such as KEGG_PROPANOATE_METABOLISM, hinting at potential dysregulation in metabolic processes. KEGG_SYSTEMIC_LUPUS_ERYTHEMATOSUS emerges, emphasizing its link to autoimmune disorders (Figure 4B, Table 2). According to the KEGG analysis, colorectal, endometrial, basal cell carcinoma, and pancreatic cancer-associated pathways were activated (Figures S2 and S3).
The following results are from Gene Ontology (GO) analysis, which categorizes genes based on their functions in biological processes (BPs), molecular functions (MFs), and cellular components (CCs) (Figure 4B, Table 2). In the GOBP_REGULATION_OF_SMALL_GTPASE_MEDIATED_SIGNAL_TRANSDUCTION pathway, with a notably low p-value of 5.10 × 10⁻¹³ and a negative normalized enrichment score (NES) of −2.91, there is a suggestion of potential downregulation. This pathway is crucial for regulating small GTPase-mediated signal transduction, which is vital for cell growth, differentiation, and migration. The GOMF_CYTOKINE_ACTIVITY pathway, which has a p-value of 7.15 × 10⁻¹³ and an NES of 2.56, indicates significant cytokine activity enrichment. This underscores its importance in modulating immune responses, inflammation, and cellular communication (Figure 4C, Table 2).
Similarly, the pathway GOMF_SIGNALING_RECEPTOR_REGULATOR_ACTIVITY, with a p-value of 5.38 × 10⁻¹³ and an NES of 2.30, emphasizes the role of signaling receptor regulator activity. It fine-tunes signal transduction cascades, ensuring cellular balance. In the case of GOBP_SKELETAL_SYSTEM_DEVELOPMENT, boasting an enrichment p-value of 8.64 × 10⁻¹² and an NES of −2.58, it highlights its involvement in skeletal system development, crucial for tissue formation and maintenance. The pathway GOMF_GTPASE_ACTIVATOR_ACTIVITY, exhibiting a p-value of 1.01 × 10⁻¹⁰ and an NES of −2.68, indicates significant enrichment in GTPase activator activity, crucial for intracellular signaling and vesicle trafficking.
Similarly, for GOMF_TUBULIN_BINDING, the p-value of 1.21 × 10⁻¹⁰ and NES of −2.52 signify substantial enrichment in tubulin binding, essential for cell division and intracellular transport. Regarding GOBP_CELL_CELL_SIGNALING_BY_WNT, featuring a p-value of 4.04 × 10⁻¹⁰ and an NES of −2.54, it suggests involvement in WNT signaling-mediated cell–cell communication, critical for developmental processes. Exhibiting a p-value of 6.23 × 10⁻¹⁰ and an NES of −2.48, GOCC_GOLGI_APPARATUS_SUBCOMPARTMENT indicates enrichment in the Golgi apparatus sub-compartment, pivotal for protein modification and trafficking. Moreover, GOMF_PHOSPHORIC_ESTER_HYDROLASE_ACTIVITY, boasting a p-value of 1.31 × 10⁻⁹ and an NES of −2.42, suggests significant enrichment in phosphoric ester hydrolase activity, crucial for cellular metabolism and signaling. Finally, the pathway GOMF_CYTOKINE_RECEPTOR_BINDING, with a p-value of 1.51 × 10⁻⁹ and an NES of 2.25, highlights enrichment in cytokine receptor binding, indicating its role in immune response regulation (Figure 4C, Table 2).

2.5. Gene Set Enrichment Analysis (GSEA) Reveals Hallmark and GO Pathways in ASCs Treated with 5-FU

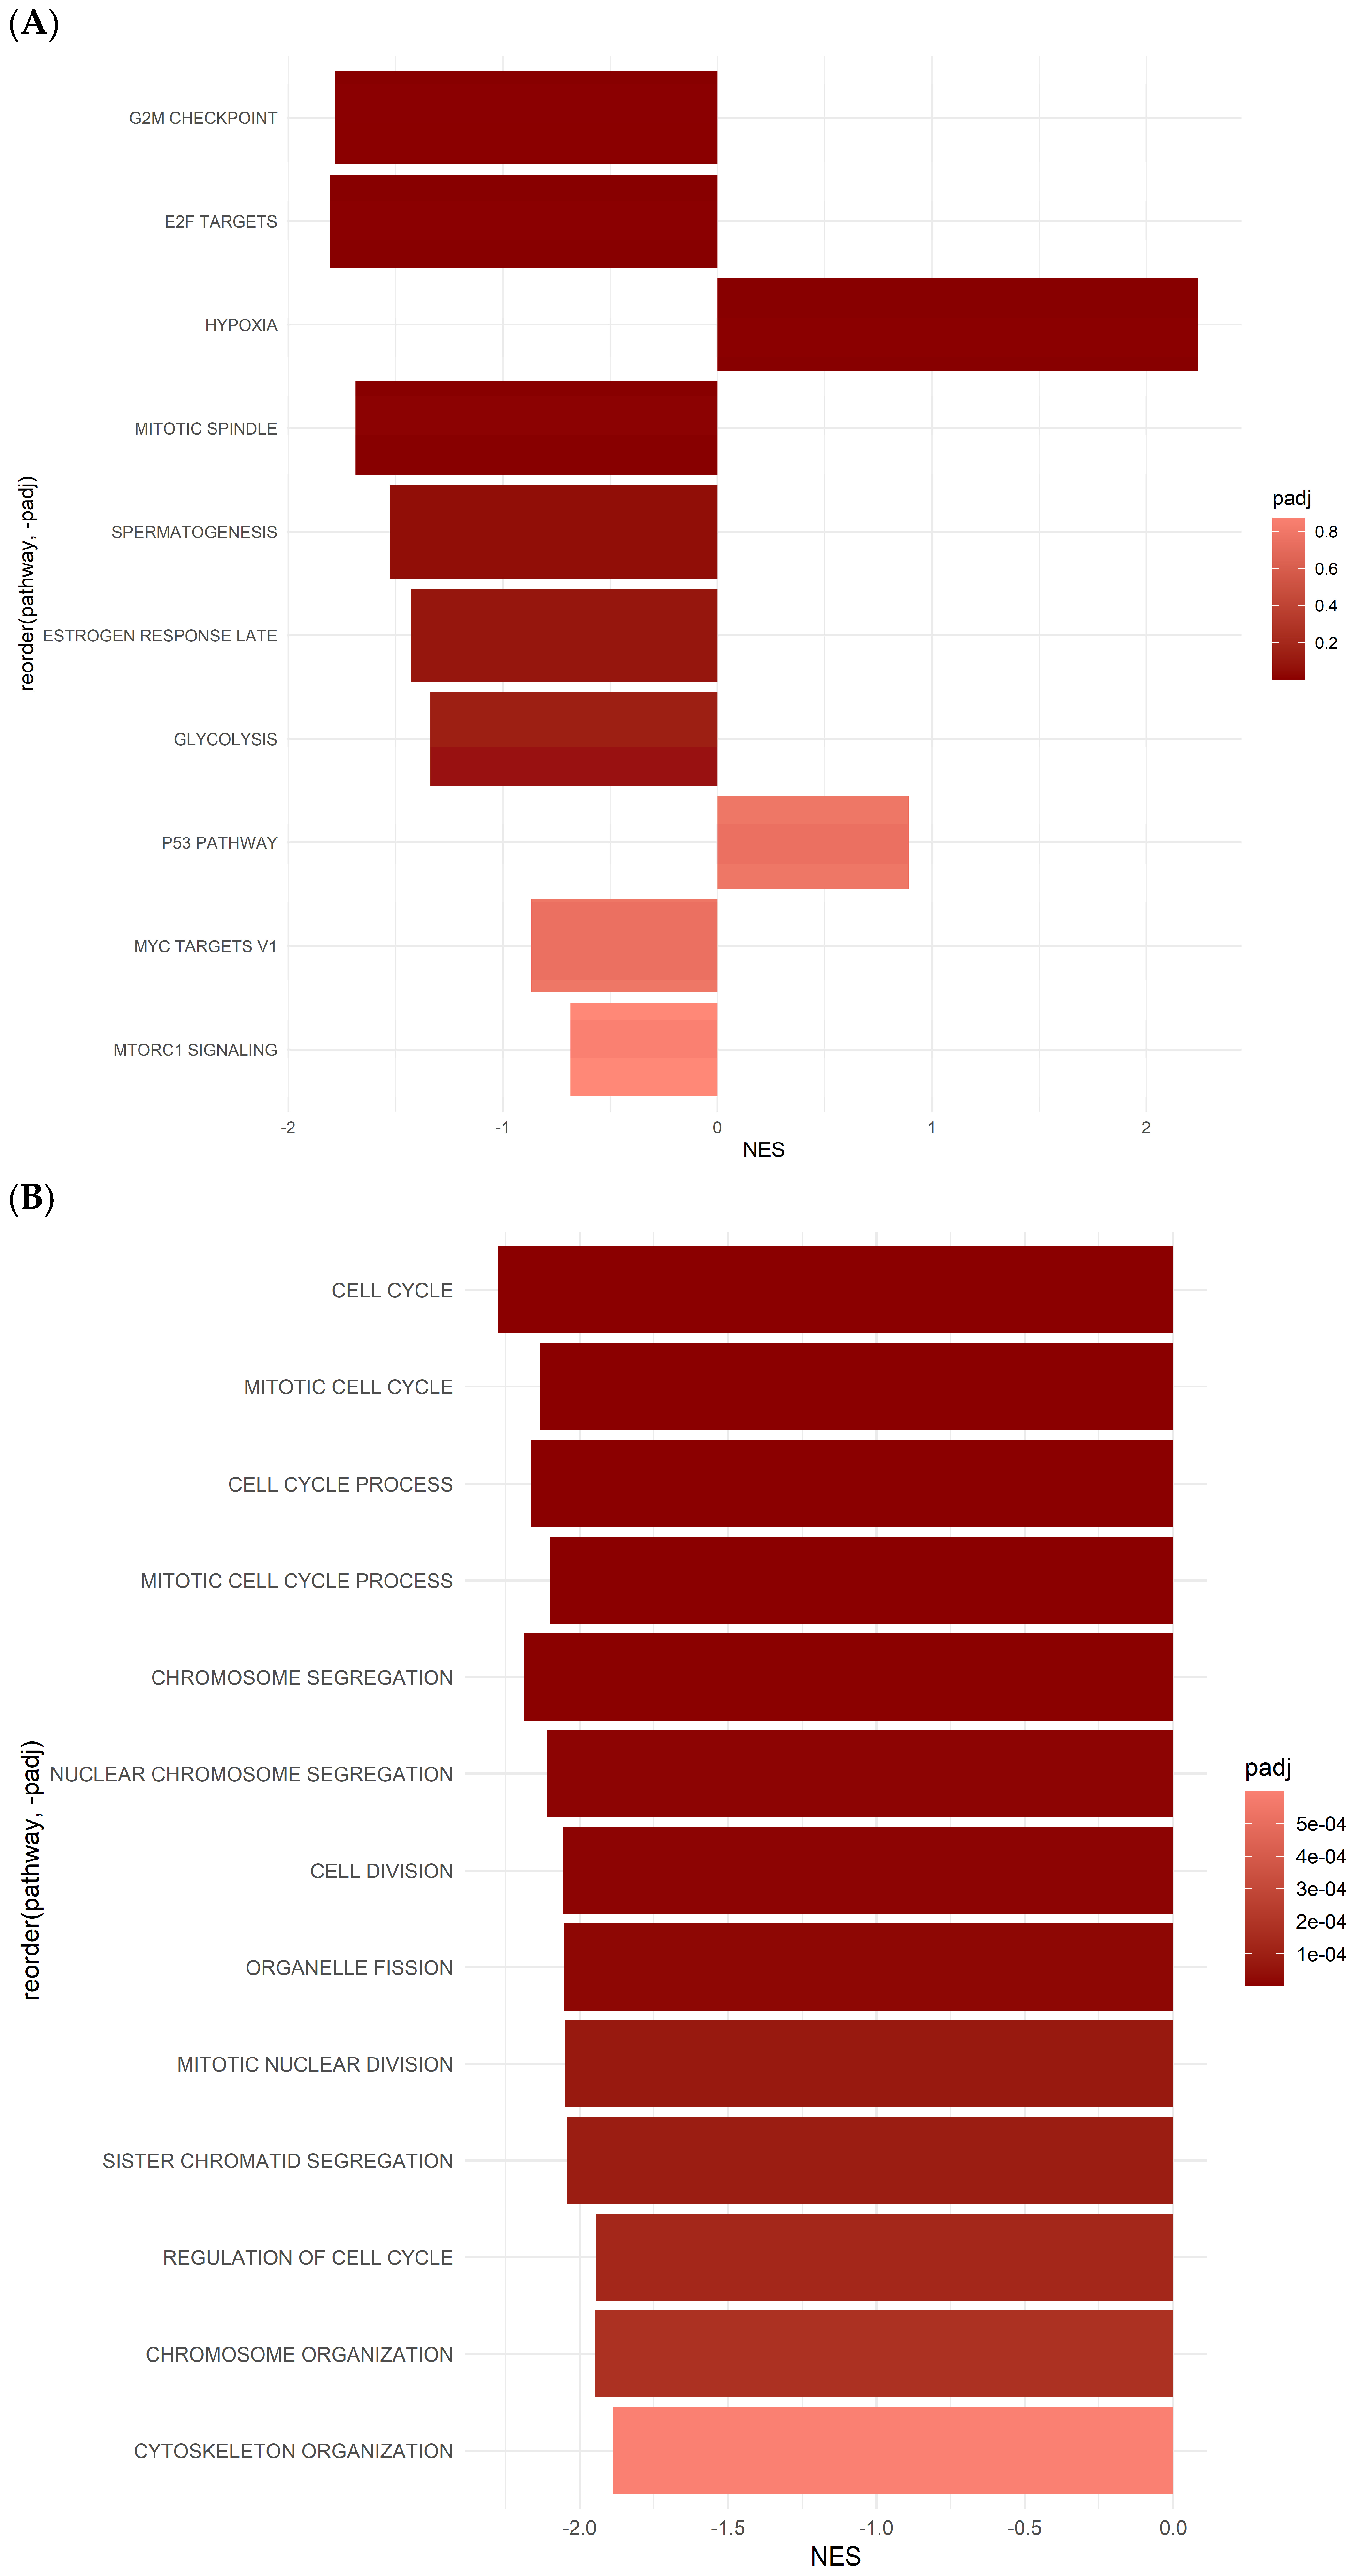
Several hallmark gene pathways exhibit notable responses in 5-FU-treated ASCs (Figure 5A and Figure S2, Table 3). The G2M_CHECKPOINT pathway, with a p-value of 0.0000733 and a significant NES of −1.78, indicates a potential downregulation of the genes associated with the G2/M checkpoint regulation, critical for cell cycle progression. Similarly, the E2F_TARGETS pathway, showing a p-value of 0.000136 and an NES of −1.81, suggests alterations in genes regulated by E2F transcription factors, indicative of potential cycle dysregulation.
In contrast, the MITOTIC_SPINDLE pathway, exhibiting a p-value of 0.00196 and an NES of −1.69, suggests potential downregulation of the genes involved in mitotic spindle assembly and function, essential for proper cell division. The SPERMATOGENESIS pathway, with a p-value of 0.0239 and an NES of −1.53, indicates potential gene alterations associated with spermatogenesis processes. Furthermore, the ESTROGEN_RESPONSE_LATE pathway, displaying a p-value of 0.0531 and an NES of −1.43, suggests potential downregulation of the genes regulated by estrogen signaling, which may affect late-stage estrogen responses. The GLYCOLYSIS pathway, with a p-value of 0.100 and an NES of −1.34, indicates potential alterations in the glycolytic pathway genes crucial for energy metabolism. Conversely, the HYPOXIA pathway (p-value = 0.000934, NES = 2.24) was significantly upregulated under 5-FU treatment (Figure 5A, Table 3). This pathway plays an essential role in controlling various cellular response signaling cascades.
Notably, the P53_PATHWAY and MYC_TARGETS_V1 pathways show non-significant responses, with p-values of 0.605 and 0.676, respectively. These pathways may not exhibit substantial changes in gene expression under 5-FU treatment in ASCs. Similarly, the MTORC1_SIGNALING pathway, with a p-value of 0.874, suggests minimal enrichment, indicating limited involvement in the cellular response to fluorouracil treatment (Figure 5A, Table 3).
The GO analysis of cells treated with 5-FU shows significant changes in various BPs and CCs gene sets. Several GO terms associated with cell cycle regulation exhibit pronounced dysregulation following 5-FU treatment. For instance, terms such as “GOBP_CELL_CYCLE”, “GOBP_CELL_CYCLE_PROCESS”, “GOBP_CELL_DIVISION”, and “GOBP_MITOTIC_CELL_CYCLE” show significant p-values, indicating their involvement in response to 5-FU-induced stress. These findings suggest that fluorouracil treatment disrupts normal cell cycle progression, inducing cell cycle arrest or aberrant cell division (Figure 5B, Table 3).
Moreover, GO terms associated with chromosome organization and segregation, such as “GOBP_CHROMOSOME_ORGANIZATION”, “GOBP_CHROMOSOME_SEGREGATION”, and “GOBP_NUCLEAR_CHROMOSOME_SEGREGATION”, are also significantly affected. This implies that 5-FU treatment may interfere with the proper organization and segregation of chromosomes during cell division, potentially leading to genomic instability and cell death. Additionally, alterations in cytoskeleton organization-related terms, including “GOBP_CYTOSKELETON_ORGANIZATION” and “GOCC_MICROTUBULE_CYTOSKELETON”, suggest perturbations in the cytoskeletal dynamics induced by 5-FU. Disruption of the cytoskeleton could affect various cellular processes, including cell shape maintenance, intracellular transport, and cell division. Furthermore, GO terms related to organelle dynamics, such as “GOBP_ORGANELLE_FISSION”, highlight the potential impacts of 5-FU on organelle integrity and dynamics within the cell. The GO analysis indicates that fluorouracil treatment profoundly affects fundamental cellular processes, particularly cell cycle regulation, chromosome dynamics, cytoskeletal organization, and organelle dynamics (Figure 5B, Table 3).

2.6. Protein Array Analysis of ASCs Supernatant Treated with OXP and 5-FU

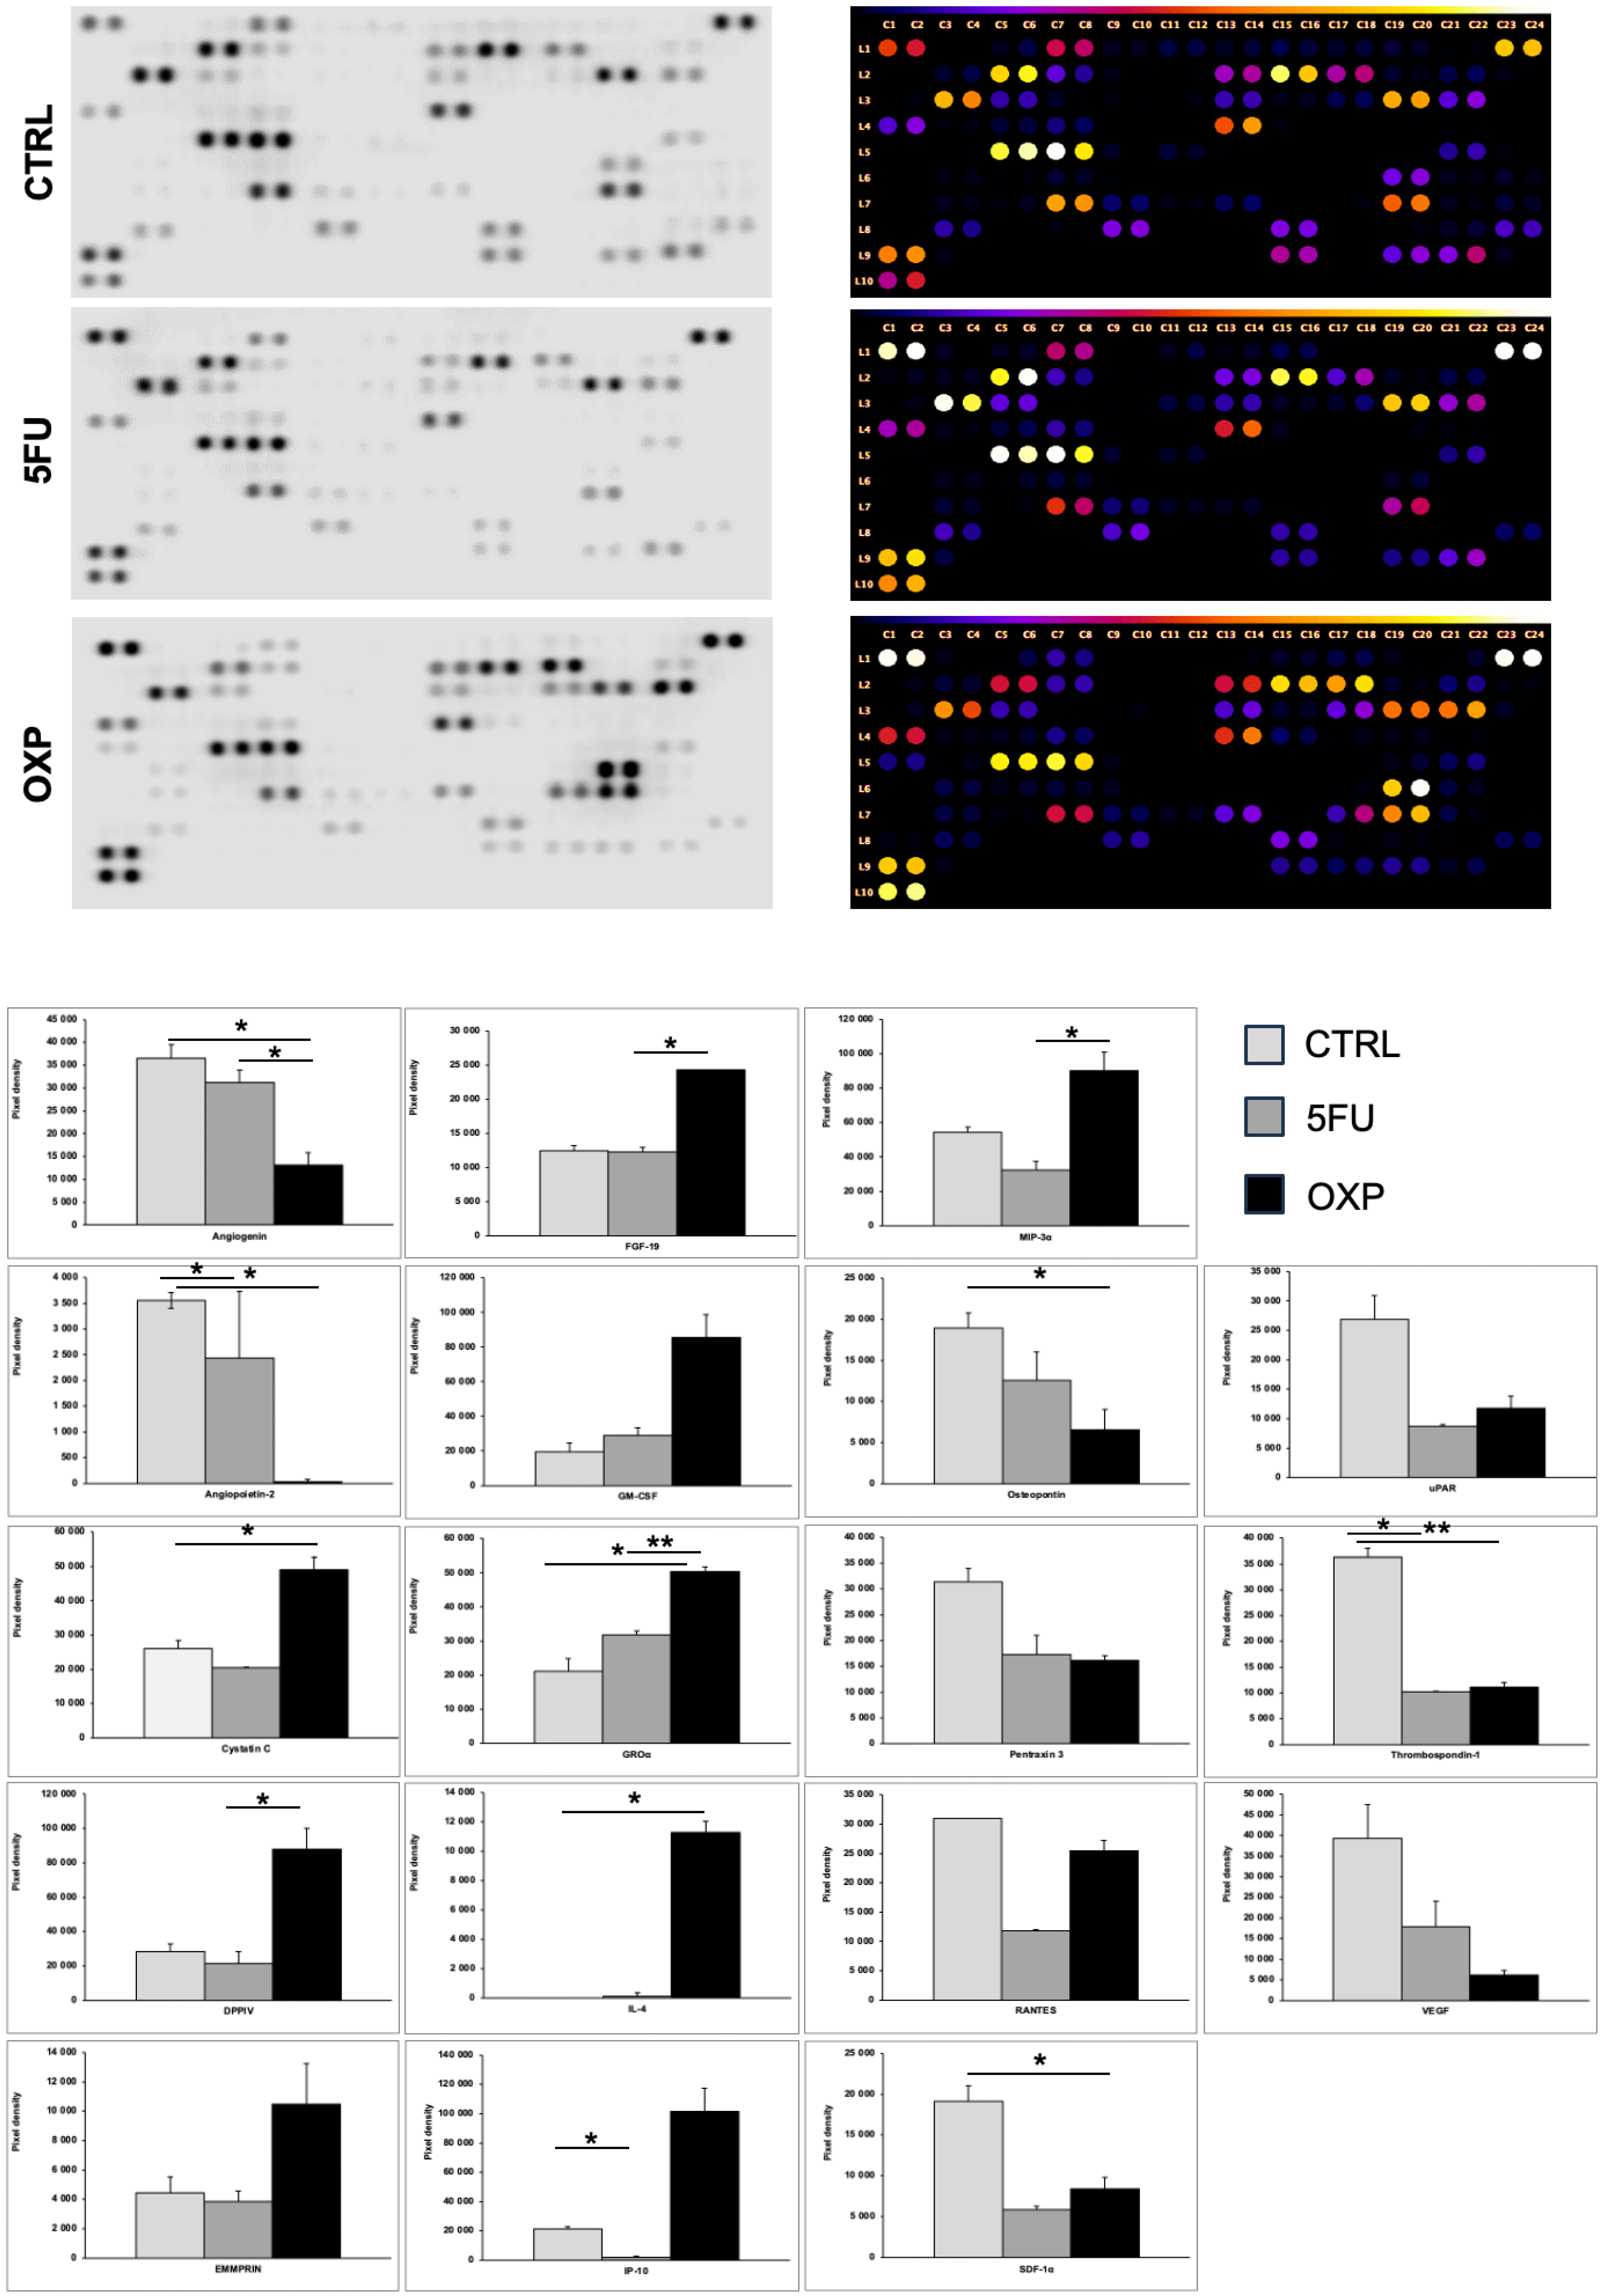
A large-scale protein array was conducted to assess the cytokine expression profiles of ASCs treated with OXP and 5-FU, compared with untreated controls (Figure 6). Both treatments markedly reduced pro-angiogenic factors, including angiogenin, angiopoietin-2, and VEGF, with OXP inducing a more pronounced anti-angiogenic effect. In contrast, stress-related markers such as cystatin C and extracellular matrix modulators like EMMPRIN were significantly upregulated under OXP treatment, while 5-FU had minimal impact. Immune-modulatory and pro-inflammatory factors showed divergent responses, with OXP causing a substantial increase in GM-CSF, GROα, FGF-19, and IL-4 as well as a significant elevation in IP-10 and MIP-3α, whereas 5-FU demonstrated a moderate or suppressive effect on these factors. Osteopontin expression was consistently suppressed by both treatments, while pentraxin 3 and RANTES levels decreased, although OXP partially restored RANTES levels compared with 5-FU. Additionally, SDF-1α and thrombospondin-1 were reduced by both treatments, but OXP slightly increased uPAR expression relative to 5-FU. These results reveal distinct and overlapping effects of OXP and 5-FU on the ASC secretome, highlighting their roles in modulating angiogenesis, inflammation, and extracellular matrix remodeling.

3. Discussion

MSCs have been explored as potential carriers for anticancer therapies due to their tumor-homing capabilities [33]. Recently, increasing attention has been given to the dynamic interactions between tumor and stromal cells in promoting cancer drug resistance [41,42]. Stromal cells, which comprise a massive portion of the TME’s cellular elements, influence tumor metabolism, growth, metastasis, immune evasion, and treatment resistance [28,42,43]. Additionally, it has been observed that ASCs can differentiate into cells that contribute to tumor cell invasion and survival via several mechanisms in laboratory settings [21,22,25,26].
This study offers important insights into the cytotoxic effects of OXP and 5-FU on PDAC cells (Capan-1) and ASCs, emphasizing both the potential and the challenges of these treatments. Furthermore, transcriptomic analyses and the cytokine secretion profile of ASCs treated with OXP and 5-FU revealed significant alterations in gene expression and cytokine release, shedding light on the potential complex interactions between stromal cells and the mechanisms underlying chemoresistance.
The MTT assay results reveal a striking difference in how Capan-1 cells and ASCs respond to the anticancer drugs. As expected, the Capan-1 cells show a time- and dose-dependent reduction in viability, with OXP exhibiting the highest cytotoxicity. In contrast, the high resistance of ASCs to these treatments is notable. Even at cytotoxic concentrations to Capan-1 cells (e.g., 50 μM of OXP), ASCs maintain viability above 90%, even after 48 h of treatment. This suggests that ASCs possess intrinsic protective mechanisms, possibly related to their stem cell-like properties, such as efficient DNA repair systems, lower proliferative rates, or increased resistance to apoptosis [43]. Noting that ASCs exhibited higher viability than Capan-1 cells across drug treatments, we focused our investigation on the efficacy of 5-FU and OXP to explore resistance mechanisms in ASCs at both the transcriptomic and protein array levels. The gene expression data reveal stark differences between OXP and 5-FU in their effects on ASCs’ gene regulation, with OXP showing profound transcriptional changes, while 5-FU has minimal impact. The significant transcriptional reprogramming caused by OXP highlights its broad effects on cellular processes in ASCs. Over 7000 genes are differentially expressed in response to OXP treatment, with many linked to critical biological processes such as DNA damage response, cell cycle regulation, and cellular stress responses (e.g., p53-mediated pathways, centriole replication, and cytokine signaling responses). The enrichment of GO terms related to “DNA damage response, signal transduction by p53 class mediator resulting in cell cycle arrest” underscores OXP’s role in inducing cell cycle arrest through DNA damage, which aligns with its known mechanism of action. This suggests that OXP effectively triggers apoptotic pathways or senescence, particularly in fast-dividing cells like cancer cells, but it might induce similar stress responses in ASCs at higher concentrations. Additionally, the GSEA analysis shows that hallmark pathways such as E2F targets, protein secretion, TGF-beta signaling, and Wnt/Beta-catenin signaling are significantly altered by OXP. These pathways are vital for cell proliferation, survival, and communication, and their dysregulation by OXP could contribute to both its therapeutic efficacy in cancer and its potential off-target side effects.
In contrast, 5-FU has a limited impact on ASCs, with only 192 differentially expressed genes, suggesting that ASCs exhibit minimal changes in gene expression in response to 5-FU, with profiles like the untreated controls. The GO and GSEA analyses reveal that while 5-FU induces some changes in pathways related to hypoxia, cell cycle, and chromosome organization, these effects are far less pronounced than those caused by OXP. This finding is promising, as it suggests that 5-FU may exert a more selective cytotoxic effect on cancer cells, while sparing normal stromal cells and potentially minimizing off-target toxicity.
The GO enrichment analysis of the DEGs in ASCs treated with OXP and 5-FU revealed significant enrichment in biological processes related to cellular responses to hypoxia, DNA damage response (DDR), and cell cycle regulation. Genes involved in these processes, such as MDM2, PIDD1, and RBM14, play crucial roles in orchestrating cellular responses to various stimuli and DNA damage [44]. We observed enrichment in the DDR pathway mediated by p53 class proteins, suggesting increased activity in detecting DNA damage and initiating cell cycle arrest [45]. Recent studies have emphasized the critical balance between MDM2 and p53 in the maintenance of ASCs and the viability of hematopoietic stem cells [46]. Among the DEGs identified in ASCs treated with OXP and 5-FU, Aurora kinase A (AURKA), B-cell Lymphoma 6 (BCL6), and breast cancer gene 1 (BRCA1), were also found to play essential roles in regulating the DNA damage response and cell cycle processes in ASCs (Figure 7).
BCL6, a transcriptional repressor linked to blood cancers and solid tumors, suppresses tumor suppressor genes while promoting those involved in cell proliferation and immune evasion, contributing to chemotherapy resistance [47,48,49]. Targeting BCL6 has increased cancer cell sensitivity to chemotherapy, suggesting its inhibition could overcome resistance in solid tumors [50,51]. The dysregulated BCL6 expression in our study may similarly promote chemoresistance in ASCs. BRCA1, crucial for DNA repair, showed increased expression in our transcriptome analysis, suggesting potential enhanced DNA repair mechanisms that reduce the genotoxic effects of 5-FU and OXP, aiding cell survival [52]. Pathway analysis also revealed the downregulation of the G2/M checkpoint and E2F target pathways, which may impair cell cycle arrest and promote genomic instability [53]. Activation of the IL6/JAK/STAT3 and IFN-γ signaling pathways highlights the role of immune modulation in chemoresistance, consistent with the cytokine array results and the well-established function of NF-κB/STAT3 in upregulating anti-apoptotic proteins and driving resistance to 5-FU and OXP [54,55]. Targeting the NF-κB/STAT3 pathway could therefore provide a potential strategy to overcome chemoresistance in pancreatic cancer treatment.
The upregulation of the hypoxia signaling pathway in 5-FU-treated ASCs indicates an adaptive response to chemotherapy-induced stress, aimed at compensating for disrupted metabolic processes [56]. Hypoxia, through HIF-1α, is known to promote tumor progression and immune evasion, contributing to chemoresistance in pancreatic cancer [57,58,59]. Targeting HIF-1α could potentially restore sensitivity to 5-FU in resistant tumors, as shown in other studies [57,60], emphasizing its role in therapy resistance and highlighting ASCs as potential contributors to this resistance mechanism.
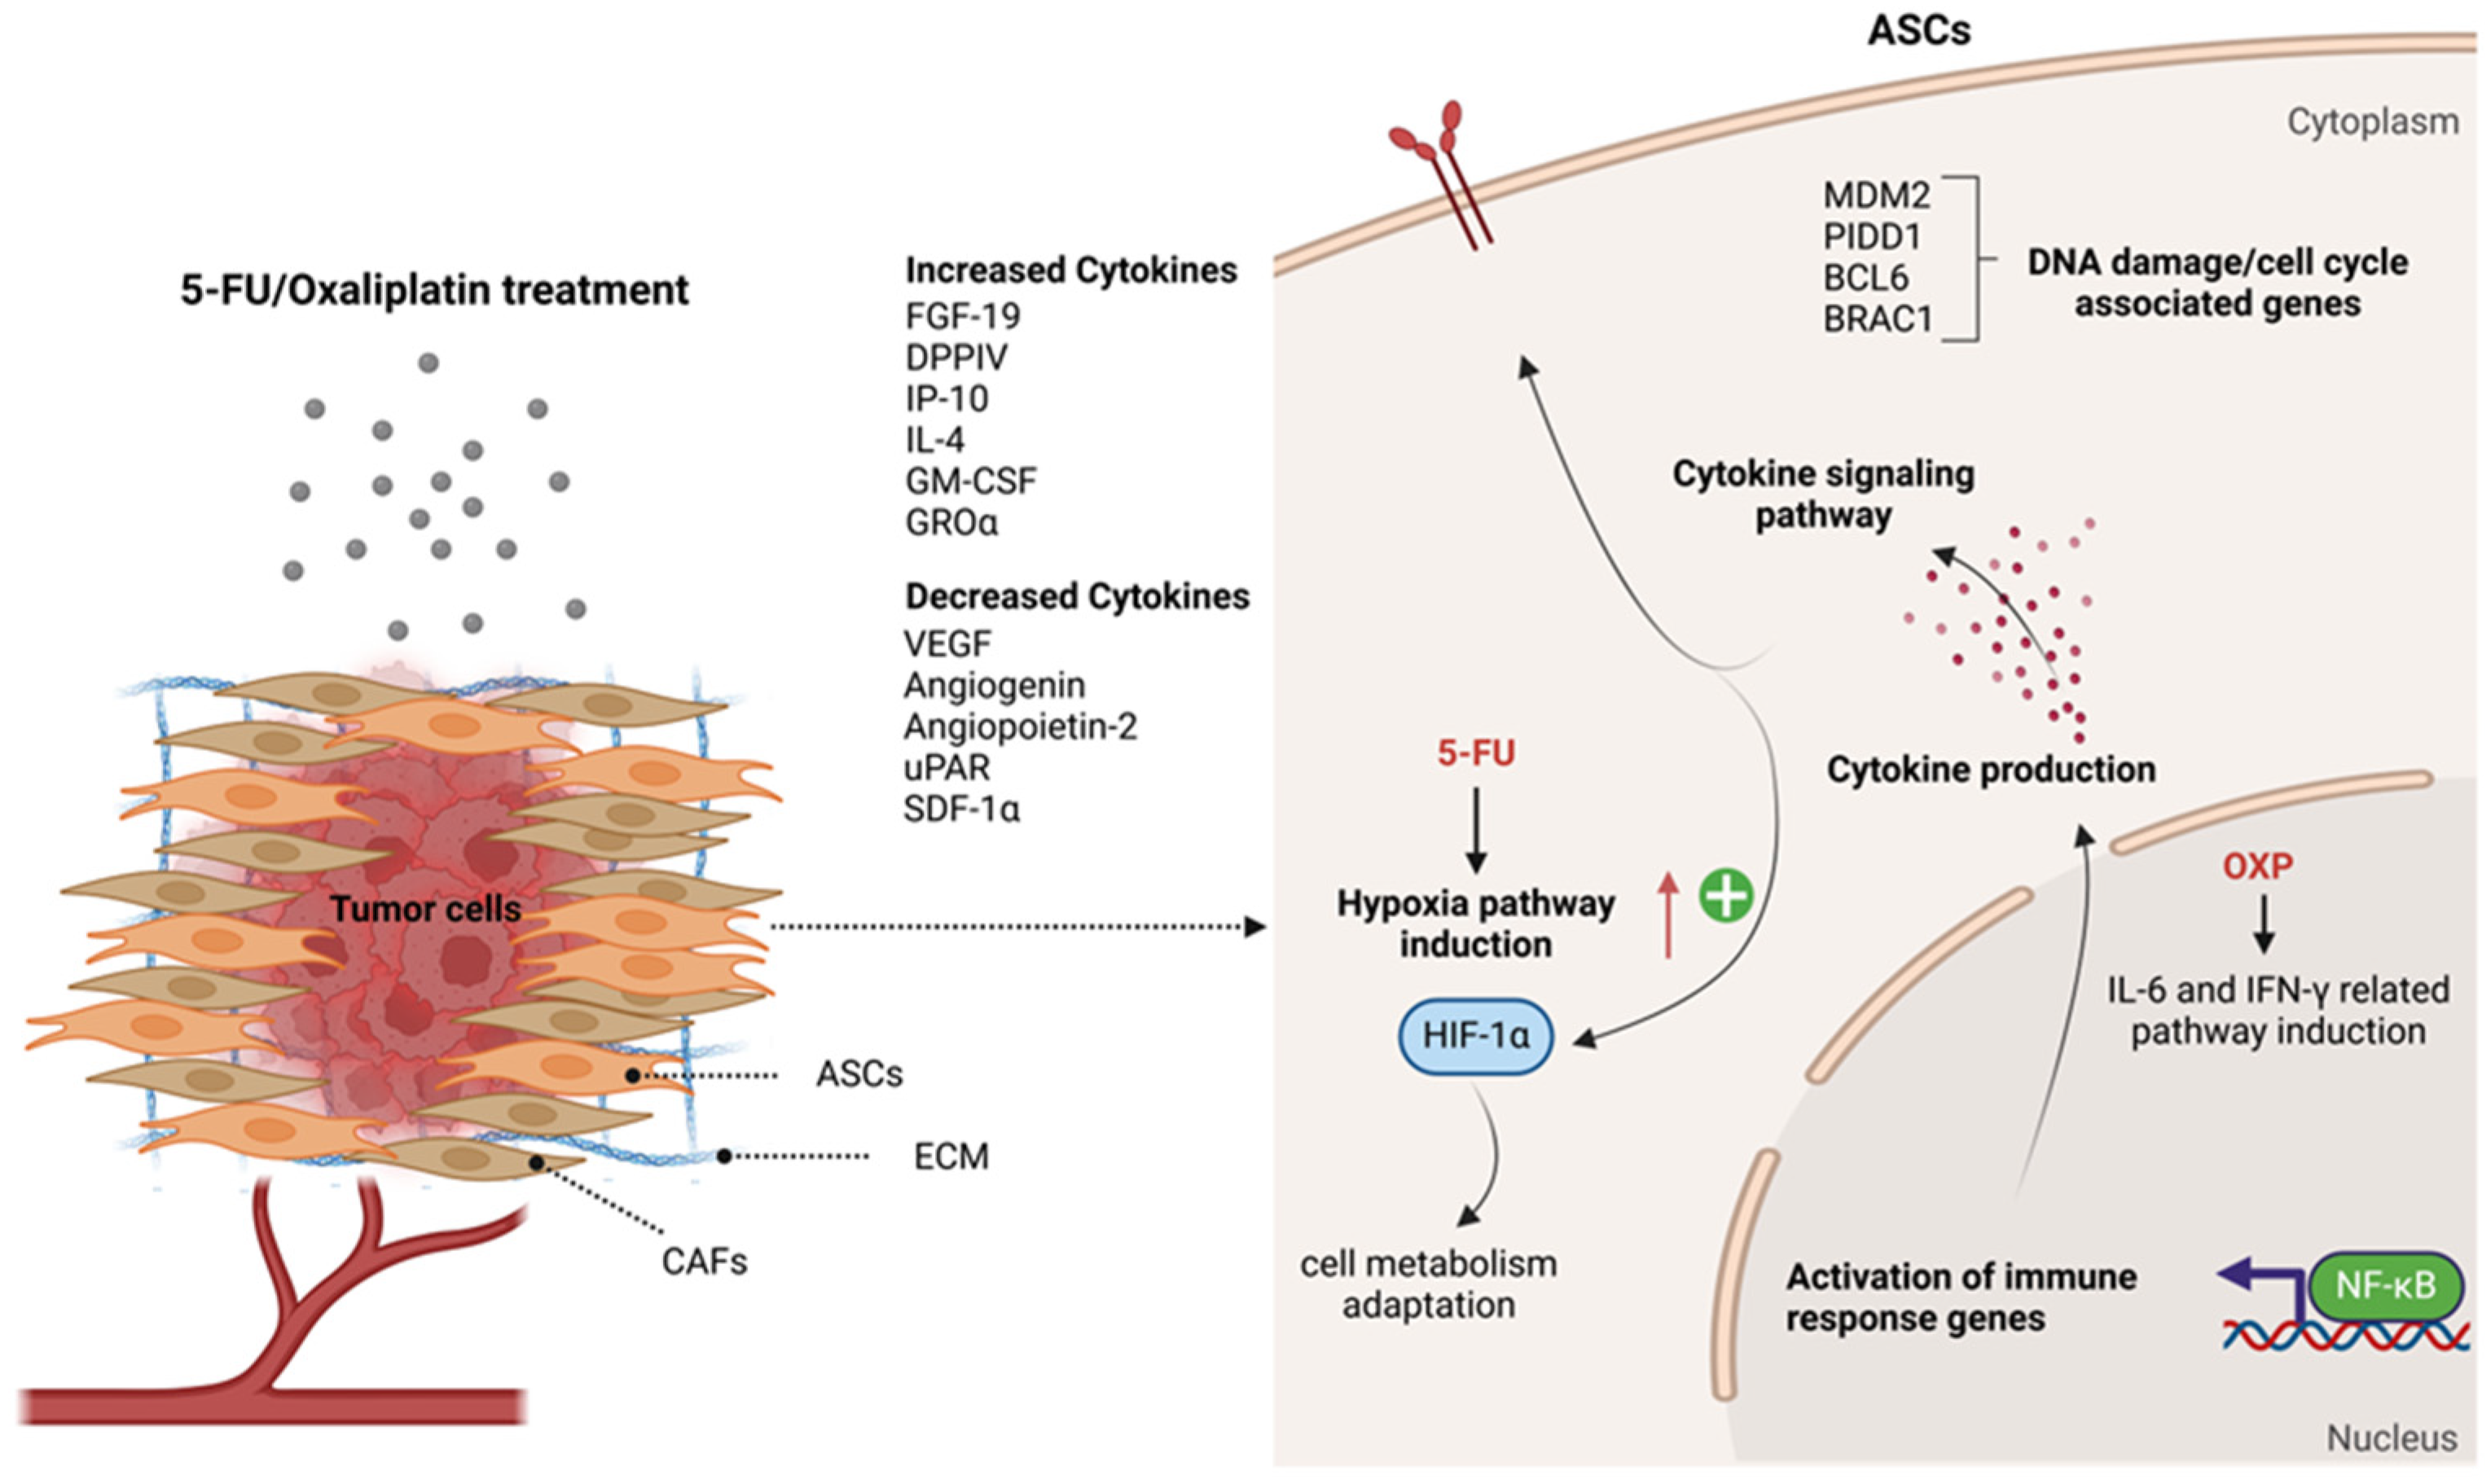
The protein array analysis results offer important insights into the adaptive responses of ASCs to the chemotherapy agents OXP and 5-FU. These findings demonstrate how ASCs alter their secretome in response to chemotherapy, potentially contributing to tumor chemoresistance in PDAC (Figure 7).
The cytokine array analysis reveals a significant reduction in pro-angiogenic factors, including VEGF, angiogenin, and angiopoietin-2, with OXP demonstrating a more pronounced suppressive effect compared with 5-FU treatment. While this reduction might initially imply impaired tumor vascularization, it more likely reflects a functional adaptation in ASCs rather than a straightforward inhibition of angiogenesis. This adaptation involves compensatory mechanisms such as the increased expression of stress-related proteins like cystatin C and ECM modulators like EMMPRIN, which support ECM remodeling and promote cellular survival [61,62].
The immune-modulatory and pro-inflammatory responses observed in ASCs further highlight their potential role in fostering chemoresistance. Elevated levels of GROα, GM-CSF, FGF-19, and IL-4 protein levels under OXP treatment suggest that ASCs actively modify the immune landscape of the TME [63]. GROα and GM-CSF are known to recruit immune cells, including myeloid-derived suppressor cells (MDSCs), which can inhibit anti-tumor immunity and support tumor survival [63,64]. Interestingly, IL-4, a cytokine associated with immune suppression such as the polarization of macrophages to a pro-tumoral M2 phenotype, was significantly induced in OXP-treated ASCs but remained almost undetectable in 5-FU-treated cells. Induction of IL-4 under OXP indicates a shift toward an immunosuppressive environment, which may contribute to immune evasion by tumor cells [64,65]. In terms of ECM remodeling, which is critical for tumor invasion and metastasis, ASCs treated with OXP showed a marked increase in the secretion of EMMPRIN and DPPIV, two key cytokines involved in ECM degradation and remodeling [66]. In contrast, 5-FU treatment induced only minor changes in these cytokines, indicating a limited effect on ECM turnover. Furthermore, thrombospondin-1, a cytokine that regulates cell adhesion and migration, was significantly suppressed by 5-FU, while OXP maintained or slightly increased its expression. These results suggest that OXP-treated ASCs may play a more active role in ECM remodeling, potentially facilitating the metastatic cascade, while 5-FU-treated cells exhibit a reduced capacity to promote ECM-dependent processes [67]. The differential regulation of chemokines such as IP-10 (CXCL10) and MIP-3α between OXP and 5-FU treatments underscores the complex and context-specific responses of ASCs. Under OXP treatment, the upregulation of IP-10 may contribute to chemoresistance through mechanisms that recruit immune-suppressive cells, such as MDSCs, which inhibit anti-tumor immune responses and support tumor survival [66,67]. In contrast, uPAR, a cytokine that facilitates tumor cell migration and invasion, was significantly suppressed in ASCs treated with 5-FU but only mildly reduced in OXP-treated cells [68,69]. Similarly, SDF-1α, a chemoattractant that directs cancer cells to metastatic niches, was decreased by both treatments, with 5-FU demonstrating a more pronounced effect [70,71]. The cytokine-secreted profile demonstrates that 5-FU-treated ASCs have a less substantial impact on metastasis-related processes than OXP. These findings align with the low cytotoxicity of 5-FU and the fewer DEGs observed in the RNA-seq data, indicating only a mild induction of cellular stress and adaptive responses in treated ASCs.
These findings suggest that ASCs play a dynamic role in modulating the TME under chemotherapeutic stress. By altering their secretome, ASCs may promote tumor survival through immune evasion, ECM remodeling, and adaptation to angiogenic suppression via hypoxia-related pathways. Future studies should focus on identifying the factors secreted by ASCs in response to chemotherapy and understanding how these factors interact with tumor cells and immune cells. These interactions may significantly influence chemoresistance and impact the overall effectiveness of cancer treatments.
While this study offers valuable insights into the cytotoxic effects of chemotherapeutic agents on PDAC cells and ASCs, several limitations should be acknowledged. For instance, the study was conducted in vitro and may not fully reflect the complexities of in vivo drug responses, where factors such as immune interactions and drug metabolism can influence outcomes. Moreover, focusing solely on the Capan-1 cell line may not capture the diversity of pancreatic cancer subtypes, which are known to exhibit varying drug sensitivities. To address these gaps, future research should include a broader range of cell lines as well as both in vitro co-culture and in vivo models to provide a more comprehensive understanding of drug responses and resistance mechanisms. Additionally, limiting the study to 24 h and 48 h time points may have overlooked longer-term effects and the evolution of resistance. Finally, financial constraints restricted RNA sequencing to select doses and time points, further limiting the scope of the investigation.

4. Materials and Methods

4.1. Cell Lines and Tissue Culture

4.1.1. Capan-1 Cell Culture

The Capan-1 cell line, derived from human pancreatic ductal adenocarcinoma and obtained from the American Type Culture Collection, was cultured in RPMI 1640 medium supplemented with 15% fetal bovine serum (FBS), 1% antibiotic-antimycotic (AB/AM), and 1% L-glutamine, (all from Biosera, Nuaille, France). The cells were subcultured up to passage 30–35 and maintained in a humidified incubator with 5% CO2 at 37 °C. Upon reaching 70–80% confluency, cells were detached using trypsin/EDTA and seeded into 96-well plates for cytotoxicity evaluation of 5-FU and oxaliplatin through the MTT assay.

4.1.2. Adipose-Derived Mesenchymal Stem Cells (ASCs) Isolation and Culture

Adipose tissue collection strictly adhered to the principles outlined in the Helsinki Declaration and received official approval from both the National Public Health and Medical Officer Service (NPHMOS) and the National Medical Research Council (approval numbers: 16821-6/2017/EÜIG, STEM-01/2017). This ensured compliance with EU Member States’ Directive 2004/23/EC, which requires written consent for tissue acquisition. The abdominal tissue samples were obtained as leftovers from the Plastic Surgery—Inpatient Care Unit, Department of Dermatology and Allergology, University of Szeged. Following established protocols, the abdominal adipose tissues were isolated within one hour of plastic surgery [43,44]. The cohort consisted of two female and one male donors, averaging 50.2 years (± 11.7 years). The ASCs were cultured in T25 cm2 flasks in a humidified incubator with 5% CO2 at 37 °C and were fed every other day with DMEM-high glucose medium (Biosera, Nuaille, France), supplemented with 10% FBS, 1% L-glutamine, and 1% AB/AM Solution (all from Biosera, Nuaille, France). The cells were subcultured up to passages 3–5. Upon reaching 70–80% confluency, the cells were trypsinized and seeded into 96-well plates for cytotoxicity evaluation of 5-FU and oxaliplatin through the MTT assay.

4.1.3. Viability and Metabolic Assay

A viability assay of ASCs was performed using Trypan Blue and an automated cell counter. Cultured cells were trypsinized, pelleted, and resuspended into 2 mL of αMEM. Each cell suspension was diluted 1:1 with Trypan Blue (T8154, Sigma-Aldrich, Budapest, Hungary), and live (unstained) and dead (stained) cells were counted using a hemocytometer. Cell viability was calculated by dividing the number of live cells by the total number of cells.

4.2. Validation of Adipose Tissue-Derived Mesenchymal Stem Cell Differentiation Potential into Adipocytes, Chondrocytes, and Osteocytes

To evaluate the differentiation potential of the isolated ASCs, we induced their differentiation into adipocytes, chondrocytes, and osteocytes in vitro [68,69]. The cells were seeded in a 24-well plate at a density of 5 × 10⁴ cells per well. After 24 h, the culture medium was replaced with differentiation medium using Gibco’s StemPro® Adipogenesis, Osteogenesis, and Chondrogenesis Differentiation Kits (Gibco, Thermo Fisher Scientific, Waltham, MA, USA), according to the manufacturer’s instructions. After 21 days of culturing under these conditions, the cells were fixed with 4% methanol-free formaldehyde (Molar Chemicals, Budapest, Hungary) for 20 min at room temperature (RT) in preparation for future staining to assess adipogenic, chondrogenic, and osteogenic differentiation. Nile red staining (Sigma-Aldrich, Merck KGaA, Darmstadt, Germany) was applied to visualize lipid-laden droplets, indicating adipocyte formation. Alizarin red staining (Sigma-Aldrich, Merck KGaA, Darmstadt, Germany) was used to detect mineral deposits associated with osteogenesis, and Toluidine blue staining (Sigma-Aldrich, Merck KGaA, Darmstadt, Germany) was applied to label chondrogenic masses.

4.3. Flow Cytometry

We performed surface antigen expression analysis using three-color flow cytometry to confirm that the isolated cells were mesenchymal stem cells. As detailed in our previous studies, we used fluorochrome-labeled antibodies targeting mesenchymal stem cell markers and matching isotype controls [72,73]. Fluorescent signals were measured with the ACEA NovoCyte 2060 flow cytometer and NovoSampler Pro Combo (Agilent Technologies Inc., Santa Clara, CA, USA) (Table 4).

4.4. MTT Cell Proliferation Assay

The half-maximal inhibitory concentration (IC50) was evaluated using a metabolic dimethyl thiazolyl diphenyl tetrazolium salt (MTT) assay, which detects cell viability by converting MTT into formazan, a reaction driven by mitochondrial enzymes. In this study, Capan-1 cells (1 × 10⁴ cells per well) and ASCs cells (5 × 10³ cells per well) were seeded into 96-well plates and allowed to adhere for 24 h. Cells were subsequently treated with various anticancer drugs, including serial dilutions of 5-fluorouracil (5-FU, F6627) and oxaliplatin (OXP, PHR1525) obtained from Sigma (Sigma-Aldrich, San Diego, CA, USA) at concentrations ranging from 6.25 to 1000 µM. A 5-FU solution (Accord Healthcare, Cork, Ireland) in mg/mL concentration provided by the hospital was also used. Each drug was tested separately to assess its specific effect on cell viability, and no combination treatments were used in this study. Cell proliferation was measured 24 h and 48 h post-treatment for Capan-1 cells and 48 h post-treatment for ASCs. The MTT assay was conducted using the Cell Proliferation Kit I (MTT) (Roche Diagnostics GmbH, Mannheim, Germany), and absorbance was measured at 575 nm using a Synergy HT plate reader (Biotek, Winooski, VT, USA). IC50 values were calculated using GraphPad Prism version 8.0.2 software (GraphPad Software, San Diego, CA, USA). Mitomycin (MTC) at a concentration of 20 μg/mL was used as a positive control in all MTT assays.

4.5. Treatment of ASCs for RNA-Seq and Protein Array

Isolated ASCs from three different donors were cultured (2.8 × 10⁵) cells in a T75 cm2 flask in a complete DMEM medium and maintained for 24 h. The medium was replaced, and the cells were treated individually with 200 µM 5-FU and 100 µM OXP. Cells were incubated for 48 h under standard conditions (37 °C, 5% CO2), with untreated cells used as the control. After 48 h of treatment, the cells were collected for RNA isolation and the supernatant for protein array.

4.6. RNA Isolation for RNA Sequencing

Cell pellets were first resuspended in 1 mL of TRI Reagent® (Genbiotech Argentina, Buenos Aires, Argentina) and stored at −80 °C for 24 h. After thawing, 200 µL of chloroform was added to each sample, followed by thorough mixing and incubation at room temperature (RT) for 10 min. The samples were centrifuged at 13,400× g for 20 min at 4 °C to allow phase separation. The aqueous phase was carefully transferred to new, clean tubes, and 500 µL of 2-propanol was added and mixed thoroughly, repeating the incubation and phase-separation processes. The supernatants were discarded, and the pellets were washed with 750 µL of 75% EtOH-DEPC. The samples were centrifuged at 7500× g for 5 min at 4 °C. After discarding the supernatants, the pellets were dried at 45 °C for 20 min. The dried pellets were then reconstituted in RNase-free water and incubated at 55 °C for 10 min. RNA concentrations were measured using the IMPLEN N50 UV-Vis Nanophotometer (Implen GmbH, Munich, Germany). Finally, the RNA samples were stored at −80 °C until further use.

4.7. RNA Sequencing

High-throughput mRNA sequencing was performed using the Illumina platform to generate comprehensive transcriptome data. The quality of total RNA samples was assessed with the Agilent BioAnalyzer, following the manufacturer’s protocol and using the Eukaryotic Total RNA Nano Kit. Only samples with an RNA integrity number (RIN) greater than seven were considered suitable for library preparation. For RNA-Seq library creation, the Ultra II RNA Sample Prep kit (New England BioLabs, Ipswich, MA, USA) was used according to the manufacturer’s instructions. In summary, poly-A RNAs were selectively captured with oligo-dT-conjugated magnetic beads, followed by elution and fragmentation of mRNAs at 94 °C. First-strand cDNA synthesis was performed using random priming reverse transcription, and after second-strand synthesis, double-stranded cDNA was generated. The cDNA fragments underwent end repair, A-tailing, and adapter ligation, and the adapter-ligated fragments were amplified via enrichment PCR to produce sequencing libraries. The sequencing was conducted on the Illumina NextSeq 500 instrument utilizing a single-end 75-cycle sequencing approach.

4.8. Protein Array

Supernatants were collected from three different ASC donors, treated with OXP and 5-FU individually, as previously described for RNA sequencing, and stored at −80 °C until further use. After thawing, the supernatants were pooled according to treatment type and analyzed using the Human XL Cytokine Array Kit Proteome Profiler (R&D Systems, Biotechne, McKinley Place NE, Minneapolis, MN, USA) to assess 105 simultaneously secreted cytokines. The array was performed following the manufacturer’s instructions. Arbitrary values of cytokine abundance were calculated as integrated densities, which were measured using the Fiji (ImageJ version 1.53s, NIH, Bethesda, MD, USA) software with Protein Array Analyzer for ImageJ macro by Gilles Carpentier. A comprehensive statistical analysis was performed for each cytokine to evaluate the differences in cytokine levels between the treatment groups. Changes were considered significant when there was a doubling (fold change = 2, Log2FC = 1) between untreated (CTRL) and treated cells (5-FU and OXP), or if there was a twofold decrease (factor change = 0.5, Log2FC = −1) between the groups. Initially, a Welch’s t-test was conducted to compare the mean values of the two groups assuming unequal variances. This test is robust to group size and variance differences, and a p-value < 0.05 was considered statistically significant. In parallel, a Mann–Whitney U-test, a nonparametric alternative to the t-test, was applied to compare the median values between the groups. This test is particularly useful for data that do not follow a normal distribution, and a p-value < 0.05 was also used as the threshold for significance. Additionally, a Kruskal–Wallis test, a nonparametric analysis of variance (ANOVA), was used to assess differences between the groups. If this test indicated statistical significance (p-value < 0.05), a post hoc Dunn test was performed to identify significant pairwise comparisons between the groups. The Dunn test results were corrected for multiple comparisons using the Bonferroni adjustment to minimize the risk of type I errors. All statistical computations were carried out using R (version 4.4.2, Auckland, New Zealand).

4.9. Data Analysis

Gene expression analysis was conducted in R (version 4.2.0, Auckland, New Zealand) with a pre-filtering step to remove genes with low expression, specifically those with a total count of less than ten across all samples. We utilized principal component analysis (PCA) to represent sample distances using the PCA tools package visually, and notably, it did not reveal any significant batch effects. Differential expression analysis was executed using DESeq2. Significantly differentially expressed genes (DEGs) were identified based on adjusted p-values below 0.05 and a log2-fold change threshold set at 0. Heatmaps were generated using the R package Complex Heatmap to visualize these DEGs. Pearson correlation was applied to rows and columns, and z-scores were calculated from normalized count data. The normalization process employed DESeq2 counts (dds, normalized = T). Additionally, volcano plots were generated using the Enhanced Volcano package. In the gene set enrichment analysis (GSEA) context, DEGs were ordered based on their log2-fold changes and utilized as input. For GSEA, we leveraged the R package Cluster Profiler with an adjusted p-value cutoff of 0.05 for Gene Ontology (GO) and Kyoto Encyclopedia of Genes and Genomes (KEGG) GSEA. Furthermore, GO terms were clustered further using rrvgo with default settings, and heatmaps representing various pathways were created using pre-selected gene sets. The DEGs in each gene set were consistent with the approach used for the heatmap visualization of all genes. DEGs were selected and ordered according to their log2-fold changes. This ordered list was then employed as input for the gene set enrichment analysis (GSEA), which aligned with the Gene Ontology and KEGG databases. Additionally, pathway analysis was performed using the Hallmark gene set system from the Molecular Signatures Database (MSigDB), which includes curated gene sets representing vital biological processes (BPs) such as cell cycle regulation, metabolism, and immune responses. This approach was used to identify significantly enriched pathways from the DEGs data of ASCs treated with 5-FU and OXP.

4.10. Statistical Analysis

Statistical analyses were conducted using GraphPad Prism 8.0.2 (GraphPad Software, San Diego, CA, USA) with Student’s unpaired t-tests to compare means. The data are presented as mean values with standard deviations, and statistical significance was set at p-value < 0.05. Furthermore, the nonparametric Mann–Whitney U test and ANOVA with multiple comparisons of the HSD–Tukey test were utilized to identify any additional statistically significant differences.

5. Conclusions

This study highlights the potential role of ASCs in pancreatic cancer chemoresistance, particularly in response to OXP and 5-FU treatments. The findings reveal distinct adaptive responses in ASCs, characterized by differential transcriptional reprogramming and cytokine secretion profiles, which dynamically reshape the TME. OXP induces extensive transcriptional changes, upregulating stress response pathways, immune-modulatory cytokines, and ECM remodeling factors, thereby fostering tumor survival and metastasis. Conversely, 5-FU elicits a milder impact on ASCs, resulting in moderate reductions in pro-tumoral cytokines, limited ECM remodeling, and reduced immune modulation.
The resilience of ASCs to chemotherapeutic agents underscores their potential role in shielding tumor cells from treatment-induced stress and maintaining TME homeostasis. The interplay between ASC-mediated immune evasion, hypoxia-driven survival pathways, and ECM remodeling highlights key mechanisms of chemoresistance, emphasizing the importance of targeting stromal components in cancer therapy.
Our findings suggest that therapeutic strategies combining direct tumor targeting with modulation of ASC-secreted factors—such as GROα, GM-CSF, EMMPRIN, or IL-4—may enhance treatment efficacy. Targeting hypoxia signaling, immune-modulatory pathways, or ECM remodeling could mitigate the supportive role of ASCs in the TME and reduce chemoresistance.
Future research should focus on dissecting the precise roles of ASC-derived factors in tumor progression and resistance, leveraging multi-omics approaches to identify novel therapeutic targets. A deeper understanding of the stromal–tumor crosstalk will be crucial for developing innovative strategies to overcome resistance and improve outcomes for patients with PDAC and other stromal-rich tumors.

Supplementary Materials

The following supporting information can be downloaded at https://www.mdpi.com/article/10.3390/ijms26010390/s1.

Author Contributions

S.P. (Shahram Parvaneh), T.M., S.P. (Szilárd Póliska), D.S. and Z.V. performed the experiments; L.K. and Z.V. provided financial support; V.M., Z.G.P., T.P. and Z.V. analyzed the data; S.P. (Shahram Parvaneh) and Z.V. designed the research; V.V. provided materials. All authors contributed to the writing of the manuscript. All authors have read and agreed to the published version of the manuscript.

Funding

This work was supported by the National Research, Development, and Innovation Office (NKFI PD 132570 to Z.V.) and GINOP_PLUSZ-2.1.1-21-2022-00043 project (co-financed by the European Union and the European Regional Development Fund). Z.V. was supported by the Bolyai János Postdoctoral Fellowship (BO/00190/20/5) financed by the New National Excellence Program of the Hungarian Ministry for Innovation and Technology from the source of the National Research Development and Innovation Fund. Project no. TKP2021-EGA-28 and TKP2021-EGA-32 were implemented with the support provided by the Ministry of Innovation and Technology of Hungary from the National Research, Development, and Innovation Fund, financed under the TKP2021-EGA funding scheme. L.K. was supported by the New National Excellence Program of the Hungarian Ministry for Innovation and Technology from the source of the National Research, Development, and Innovation Fund, K.L-HCEMM: H2020-EU.4.a. This work also received funds from the National Research, Development, and Innovation Office, grant NKFI-FK 132080 (TP); the EU’s Horizon 2020 Research and Innovation Program with grant agreement No. 739593 (TP); the Ministry of Culture and Innovation of Hungary from the National Research, Development, and Innovation Fund, TKP2021-EGA funding scheme, TKP-2021-EGA-05 (TP); the Ministry of Culture and Innovation of Hungary from the National Research, Development, and Innovation Fund, 2022-2.1.1-NL funding scheme, 2022-2.1.1-NL-2022-00005 (TP); and the Hungarian Academy of Sciences, POST-COVID2021-36 (TP). S.P. was supported by the project TKP2021-NKTA-34, which was implemented with the support provided by the Ministry of Culture and Innovation of Hungary from the National Research, Development, and Innovation Fund, financed under the TKP2021-NKTA funding scheme.

Institutional Review Board Statement

The collection of adipose tissue complied with the guidelines of the Helsinki Declaration. It was approved by the National Public Health and Medical Officer Service (NPHMOS) and the National Medical Research Council (16821-6/2017/EÜIG, STEM-01/2017), which follows the EU Member States’ Directive 2004/23/EC on presumed written consent practice for tissue collection.

Informed Consent Statement

Informed consent was obtained from all subjects involved in the study.

Data Availability Statement

All data generated and analyzed during this study are included in this manuscript (and its Supplementary Materials).

Acknowledgments

We thank Ameneh Ghaffarinia for helping format the manuscript.

Conflicts of Interest

The authors declare no conflicts of interest.

References

  1. Kanno, A.; Masamune, A.; Hanada, K.; Kikuyama, M.; Kitano, M. Advances in Early Detection of Pancreatic Cancer. Diagnostics 2019, 9, 18. [Google Scholar] [CrossRef]
  2. Bausch, D.; Keck, T. Minimally Invasive Surgery of Pancreatic Cancer: Feasibility and Rationale. Visc. Med. 2018, 34, 440–443. [Google Scholar] [CrossRef]
  3. Sung, H.; Ferlay, J.; Siegel, R.L.; Laversanne, M.; Soerjomataram, I.; Jemal, A.; Bray, F. Global Cancer Statistics 2020: GLOBOCAN Estimates of Incidence and Mortality Worldwide for 36 Cancers in 185 Countries. CA. Cancer J. Clin. 2021, 71, 209–249. [Google Scholar] [CrossRef]
  4. Siegel, R.L.; Miller, K.D.; Fuchs, H.E.; Jemal, A. Cancer Statistics, 2022. CA. Cancer J. Clin. 2022, 72, 7–33. [Google Scholar] [CrossRef]
  5. Singhi, A.D.; Koay, E.J.; Chari, S.T.; Maitra, A. Early Detection of Pancreatic Cancer: Opportunities and Challenges. Gastroenterology 2019, 156, 2024–2040. [Google Scholar] [CrossRef]
  6. Sunami, Y.; Kleeff, J. Immunotherapy of Pancreatic Cancer. In Progress in Molecular Biology and Translational Science; Elsevier: Amsterdam, The Netherlands, 2019; Volume 164, pp. 189–216. ISBN 978-0-12-816575-1. [Google Scholar]
  7. Wang, Q.; Shao, X.; Zhang, Y.; Zhu, M.; Wang, F.X.C.; Mu, J.; Li, J.; Yao, H.; Chen, K. Role of Tumor Microenvironment in Cancer Progression and Therapeutic Strategy. Cancer Med. 2023, 12, 11149–11165. [Google Scholar] [CrossRef] [PubMed]
  8. Hanahan, D.; Weinberg, R.A. Hallmarks of Cancer: The Next Generation. Cell 2011, 144, 646–674. [Google Scholar] [CrossRef]
  9. Crippa, S.; Belfiori, G.; Bissolati, M.; Partelli, S.; Pagnanelli, M.; Tamburrino, D.; Gasparini, G.; Rubini, C.; Zamboni, G.; Falconi, M. Recurrence after Surgical Resection of Pancreatic Cancer: The Importance of Postoperative Complications beyond Tumor Biology. HPB 2021, 23, 1666–1673. [Google Scholar] [CrossRef]
  10. Chu, X.; Tian, W.; Ning, J.; Xiao, G.; Zhou, Y.; Wang, Z.; Zhai, Z.; Tanzhu, G.; Yang, J.; Zhou, R. Cancer Stem Cells: Advances in Knowledge and Implications for Cancer Therapy. Signal Transduct. Target. Ther. 2024, 9, 170. [Google Scholar] [CrossRef]
  11. Neesse, A.; Algül, H.; Tuveson, D.A.; Gress, T.M. Stromal Biology and Therapy in Pancreatic Cancer: A Changing Paradigm. Gut 2015, 64, 1476–1484. [Google Scholar] [CrossRef]
  12. El-Haibi, C.P.; Karnoub, A.E. Mesenchymal Stem Cells in the Pathogenesis and Therapy of Breast Cancer. J. Mammary Gland Biol. Neoplasia 2010, 15, 399–409. [Google Scholar] [CrossRef]
  13. Zhao, Y.; Shen, M.; Wu, L.; Yang, H.; Yao, Y.; Yang, Q.; Du, J.; Liu, L.; Li, Y.; Bai, Y. Stromal Cells in the Tumor Microenvironment: Accomplices of Tumor Progression? Cell Death Dis. 2023, 14, 587. [Google Scholar] [CrossRef]
  14. Kidd, S.; Spaeth, E.; Dembinski, J.L.; Dietrich, M.; Watson, K.; Klopp, A.; Battula, V.L.; Weil, M.; Andreeff, M.; Marini, F.C. Direct Evidence of Mesenchymal Stem Cell Tropism for Tumor and Wounding Microenvironments Using In Vivo Bioluminescent Imaging. Stem Cells 2009, 27, 2614–2623. [Google Scholar] [CrossRef] [PubMed]
  15. Manoukian, P.; Bijlsma, M.; Van Laarhoven, H. The Cellular Origins of Cancer-Associated Fibroblasts and Their Opposing Contributions to Pancreatic Cancer Growth. Front. Cell Dev. Biol. 2021, 9, 743907. [Google Scholar] [CrossRef] [PubMed]
  16. Zhang, W.; Huang, P. Cancer-Stromal Interactions: Role in Cell Survival, Metabolism and Drug Sensitivity. Cancer Biol. Ther. 2011, 11, 150–156. [Google Scholar] [CrossRef]
  17. Li, W.; Zhou, Y.; Yang, J.; Zhang, X.; Zhang, H.; Zhang, T.; Zhao, S.; Zheng, P.; Huo, J.; Wu, H. Gastric Cancer-Derived Mesenchymal Stem Cells Prompt Gastric Cancer Progression through Secretion of Interleukin-8. J. Exp. Clin. Cancer Res. CR 2015, 34, 52. [Google Scholar] [CrossRef]
  18. Kabashima-Niibe, A.; Higuchi, H.; Takaishi, H.; Masugi, Y.; Matsuzaki, Y.; Mabuchi, Y.; Funakoshi, S.; Adachi, M.; Hamamoto, Y.; Kawachi, S.; et al. Mesenchymal Stem Cells Regulate Epithelial-Mesenchymal Transition and Tumor Progression of Pancreatic Cancer Cells. Cancer Sci. 2013, 104, 157–164. [Google Scholar] [CrossRef] [PubMed]
  19. Zou, W.; Zhao, J.; Li, Y.; Wang, Z.; Yan, H.; Liu, Y.; Sun, M.; Zhuang, J.; Wang, J. Rat Bone Marrow-Derived Mesenchymal Stem Cells Promote the Migration and Invasion of Colorectal Cancer Stem Cells. OncoTargets Ther. 2020, 13, 6617–6628. [Google Scholar] [CrossRef] [PubMed]
  20. Ritter, A.; Kreis, N.-N.; Hoock, S.C.; Solbach, C.; Louwen, F.; Yuan, J. Adipose Tissue-Derived Mesenchymal Stromal/Stem Cells, Obesity and the Tumor Microenvironment of Breast Cancer. Cancers 2022, 14, 3908. [Google Scholar] [CrossRef]
  21. Del Vecchio, V.; Rehman, A.; Panda, S.K.; Torsiello, M.; Marigliano, M.; Nicoletti, M.M.; Ferraro, G.A.; De Falco, V.; Lappano, R.; Lieto, E.; et al. Mitochondrial Transfer from Adipose Stem Cells to Breast Cancer Cells Drives Multi-Drug Resistance. J. Exp. Clin. Cancer Res. 2024, 43, 166. [Google Scholar] [CrossRef] [PubMed]
  22. Salaud, C.; Alvarez-Arenas, A.; Geraldo, F.; Belmonte-Beitia, J.; Calvo, G.F.; Gratas, C.; Pecqueur, C.; Garnier, D.; Pérez-Garcià, V.; Vallette, F.M.; et al. Mitochondria Transfer from Tumor-Activated Stromal Cells (TASC) to Primary Glioblastoma Cells. Biochem. Biophys. Res. Commun. 2020, 533, 139–147. [Google Scholar] [CrossRef] [PubMed]
  23. Saito, K.; Sakaguchi, M.; Maruyama, S.; Iioka, H.; Putranto, E.W.; Sumardika, I.W.; Tomonobu, N.; Kawasaki, T.; Homma, K.; Kondo, E. Stromal Mesenchymal Stem Cells Facilitate Pancreatic Cancer Progression by Regulating Specific Secretory Molecules through Mutual Cellular Interaction. J. Cancer 2018, 9, 2916–2929. [Google Scholar] [CrossRef] [PubMed]
  24. Liu, T.; Zhou, L.; Li, D.; Andl, T.; Zhang, Y. Cancer-Associated Fibroblasts Build and Secure the Tumor Microenvironment. Front. Cell Dev. Biol. 2019, 7, 60. [Google Scholar] [CrossRef] [PubMed]
  25. Okumura, T.; Ohuchida, K.; Kibe, S.; Iwamoto, C.; Ando, Y.; Takesue, S.; Nakayama, H.; Abe, T.; Endo, S.; Koikawa, K.; et al. Adipose Tissue-Derived Stromal Cells Are Sources of Cancer-Associated Fibroblasts and Enhance Tumor Progression by Dense Collagen Matrix. Int. J. Cancer 2019, 144, 1401–1413. [Google Scholar] [CrossRef]
  26. Incio, J.; Liu, H.; Suboj, P.; Chin, S.M.; Chen, I.X.; Pinter, M.; Ng, M.R.; Nia, H.T.; Grahovac, J.; Kao, S.; et al. Obesity-Induced Inflammation and Desmoplasia Promote Pancreatic Cancer Progression and Resistance to Chemotherapy. Cancer Discov. 2016, 6, 852–869. [Google Scholar] [CrossRef] [PubMed]
  27. Miyazaki, Y.; Oda, T.; Inagaki, Y.; Kushige, H.; Saito, Y.; Mori, N.; Takayama, Y.; Kumagai, Y.; Mitsuyama, T.; Kida, Y.S. Adipose-Derived Mesenchymal Stem Cells Differentiate into Heterogeneous Cancer-Associated Fibroblasts in a Stroma-Rich Xenograft Model. Sci. Rep. 2021, 11, 4690. [Google Scholar] [CrossRef]
  28. Sperb, N.; Tsesmelis, M.; Wirth, T. Crosstalk between Tumor and Stromal Cells in Pancreatic Ductal Adenocarcinoma. Int. J. Mol. Sci. 2020, 21, 5486. [Google Scholar] [CrossRef] [PubMed]
  29. Antoon, R.; Overdevest, N.; Saleh, A.H.; Keating, A. Mesenchymal Stromal Cells as Cancer Promoters. Oncogene 2024, 43, 3545–3555. [Google Scholar] [CrossRef]
  30. Duluc, C.; Moatassim-Billah, S.; Chalabi-Dchar, M.; Perraud, A.; Samain, R.; Breibach, F.; Gayral, M.; Cordelier, P.; Delisle, M.-B.; Bousquet-Dubouch, M.-P.; et al. Pharmacological Targeting of the Protein Synthesis mTOR/4E-BP1 Pathway in Cancer-Associated Fibroblasts Abrogates Pancreatic Tumour Chemoresistance. EMBO Mol. Med. 2015, 7, 735–753. [Google Scholar] [CrossRef]
  31. Garg, B.; Giri, B.; Modi, S.; Sethi, V.; Castro, I.; Umland, O.; Ban, Y.; Lavania, S.; Dawra, R.; Banerjee, S.; et al. NFκB in Pancreatic Stellate Cells Reduces Infiltration of Tumors by Cytotoxic T Cells and Killing of Cancer Cells, via Up-Regulation of CXCL12. Gastroenterology 2018, 155, 880–891.e8. [Google Scholar] [CrossRef] [PubMed]
  32. Wörmann, S.M.; Song, L.; Ai, J.; Diakopoulos, K.N.; Kurkowski, M.U.; Görgülü, K.; Ruess, D.; Campbell, A.; Doglioni, C.; Jodrell, D.; et al. Loss of P53 Function Activates JAK2–STAT3 Signaling to Promote Pancreatic Tumor Growth, Stroma Modification, and Gemcitabine Resistance in Mice and Is Associated With Patient Survival. Gastroenterology 2016, 151, 180–193.e12. [Google Scholar] [CrossRef]
  33. Li, L.; Tian, H.; Yue, W.; Zhu, F.; Li, S.; Li, W. Human Mesenchymal Stem Cells Play a Dual Role on Tumor Cell Growth in Vitro and in Vivo. J. Cell. Physiol. 2011, 226, 1860–1867. [Google Scholar] [CrossRef] [PubMed]
  34. Rhim, A.D.; Oberstein, P.E.; Thomas, D.H.; Mirek, E.T.; Palermo, C.F.; Sastra, S.A.; Dekleva, E.N.; Saunders, T.; Becerra, C.P.; Tattersall, I.W.; et al. Stromal Elements Act to Restrain, Rather Than Support, Pancreatic Ductal Adenocarcinoma. Cancer Cell 2014, 25, 735–747. [Google Scholar] [CrossRef]
  35. Ji, N.; Yu, J.-W.; Ni, X.-C.; Wu, J.-G.; Wang, S.-L.; Jiang, B.-J. Bone Marrow-Derived Mesenchymal Stem Cells Increase Drug Resistance in CD133-Expressing Gastric Cancer Cells by Regulating the PI3K/AKT Pathway. Tumour Biol. J. Int. Soc. Oncodevelopmental Biol. Med. 2016, 37, 14637–14651. [Google Scholar] [CrossRef] [PubMed]
  36. Citterio, C.; Baccini, M.; Orlandi, E.; Di Nunzio, C.; Cavanna, L. Second-Line Chemotherapy for the Treatment of Metastatic Pancreatic Cancer after First-Line Gemcitabine-Based Chemotherapy: A Network Meta-Analysis. Oncotarget 2018, 9, 29801–29809. [Google Scholar] [CrossRef]
  37. Saung, M.T.; Zheng, L. Current Standards of Chemotherapy for Pancreatic Cancer. Clin. Ther. 2017, 39, 2125–2134. [Google Scholar] [CrossRef] [PubMed]
  38. Phua, L.C.; Mal, M.; Koh, P.K.; Cheah, P.Y.; Chan, E.C.Y.; Ho, H.K. Investigating the Role of Nucleoside Transporters in the Resistance of Colorectal Cancer to 5-Fluorouracil Therapy. Cancer Chemother. Pharmacol. 2013, 71, 817–823. [Google Scholar] [CrossRef]
  39. Longley, D.B.; Harkin, D.P.; Johnston, P.G. 5-Fluorouracil: Mechanisms of Action and Clinical Strategies. Nat. Rev. Cancer 2003, 3, 330–338. [Google Scholar] [CrossRef]
  40. Wang, W.-B.; Yang, Y.; Zhao, Y.-P.; Zhang, T.-P.; Liao, Q.; Shu, H. Recent Studies of 5-Fluorouracil Resistance in Pancreatic Cancer. World J. Gastroenterol. 2014, 20, 15682–15690. [Google Scholar] [CrossRef] [PubMed]
  41. Shiga, K.; Hara, M.; Nagasaki, T.; Sato, T.; Takahashi, H.; Takeyama, H. Cancer-Associated Fibroblasts: Their Characteristics and Their Roles in Tumor Growth. Cancers 2015, 7, 2443–2458. [Google Scholar] [CrossRef] [PubMed]
  42. Houthuijzen, J.M.; Daenen, L.G.M.; Roodhart, J.M.L.; Voest, E.E. The Role of Mesenchymal Stem Cells in Anti-Cancer Drug Resistance and Tumour Progression. Br. J. Cancer 2012, 106, 1901–1906. [Google Scholar] [CrossRef] [PubMed]
  43. Gillespie, M.S.; Ward, C.M.; Davies, C.C. DNA Repair and Therapeutic Strategies in Cancer Stem Cells. Cancers 2023, 15, 1897. [Google Scholar] [CrossRef]
  44. Yuan, M.; Eberhart, C.G.; Kai, M. RNA Binding Protein RBM14 Promotes Radio-Resistance in Glioblastoma by Regulating DNA Repair and Cell Differentiation. Oncotarget 2014, 5, 2820–2826. [Google Scholar] [CrossRef]
  45. Wade, M.; Wang, Y.V.; Wahl, G.M. The P53 Orchestra: Mdm2 and Mdmx Set the Tone. Trends Cell Biol. 2010, 20, 299–309. [Google Scholar] [CrossRef] [PubMed]
  46. Pourebrahim, R.; Heinz Montoya, R.; Alaniz, Z.; Ostermann, L.; Lin, P.P.; Liu, B.; Ayoub, E.; Burks, J.K.; Andreeff, M. Mdm2/P53 Levels in Bone Marrow Mesenchymal Stromal Cells Are Essential for Maintaining the Hematopoietic Niche in Response to DNA Damage. Cell Death Dis. 2023, 14, 371. [Google Scholar] [CrossRef] [PubMed]
  47. McLachlan, T.; Matthews, W.C.; Jackson, E.R.; Staudt, D.E.; Douglas, A.M.; Findlay, I.J.; Persson, M.L.; Duchatel, R.J.; Mannan, A.; Germon, Z.P.; et al. B-Cell Lymphoma 6 (BCL6): From Master Regulator of Humoral Immunity to Oncogenic Driver in Pediatric Cancers. Mol. Cancer Res. MCR 2022, 20, 1711–1723. [Google Scholar] [CrossRef] [PubMed]
  48. Liu, Y.; Feng, J.; Yuan, K.; Wu, Z.; Hu, L.; Lu, Y.; Li, K.; Guo, J.; Chen, J.; Ma, C.; et al. The Oncoprotein BCL6 Enables Solid Tumor Cells to Evade Genotoxic Stress. eLife 2022, 11, e69255. [Google Scholar] [CrossRef]
  49. Hatzi, K.; Nance, J.P.; Kroenke, M.A.; Bothwell, M.; Haddad, E.K.; Melnick, A.; Crotty, S. BCL6 Orchestrates Tfh Cell Differentiation via Multiple Distinct Mechanisms. J. Exp. Med. 2015, 212, 539–553. [Google Scholar] [CrossRef] [PubMed]
  50. Walker, S.R.; Liu, S.; Xiang, M.; Nicolais, M.; Hatzi, K.; Giannopoulou, E.; Elemento, O.; Cerchietti, L.; Melnick, A.; Frank, D.A. The Transcriptional Modulator BCL6 as a Molecular Target for Breast Cancer Therapy. Oncogene 2015, 34, 1073–1082. [Google Scholar] [CrossRef]
  51. Cardenas, M.G.; Oswald, E.; Yu, W.; Xue, F.; MacKerell, A.D.; Melnick, A.M. The Expanding Role of the BCL6 Oncoprotein as a Cancer Therapeutic Target. Clin. Cancer Res. 2017, 23, 885–893. [Google Scholar] [CrossRef] [PubMed]
  52. Ray Chaudhuri, A.; Callen, E.; Ding, X.; Gogola, E.; Duarte, A.A.; Lee, J.-E.; Wong, N.; Lafarga, V.; Calvo, J.A.; Panzarino, N.J.; et al. Replication Fork Stability Confers Chemoresistance in BRCA-Deficient Cells. Nature 2016, 535, 382–387. [Google Scholar] [CrossRef] [PubMed]
  53. Xie, D.; Pei, Q.; Li, J.; Wan, X.; Ye, T. Emerging Role of E2F Family in Cancer Stem Cells. Front. Oncol. 2021, 11, 723137. [Google Scholar] [CrossRef]
  54. Castro, F.; Cardoso, A.P.; Gonçalves, R.M.; Serre, K.; Oliveira, M.J. Interferon-Gamma at the Crossroads of Tumor Immune Surveillance or Evasion. Front. Immunol. 2018, 9, 847. [Google Scholar] [CrossRef] [PubMed]
  55. Jorgovanovic, D.; Song, M.; Wang, L.; Zhang, Y. Roles of IFN-γ in Tumor Progression and Regression: A Review. Biomark. Res. 2020, 8, 49. [Google Scholar] [CrossRef]
  56. Dong, S.; Liang, S.; Cheng, Z.; Zhang, X.; Luo, L.; Li, L.; Zhang, W.; Li, S.; Xu, Q.; Zhong, M.; et al. ROS/PI3K/Akt and Wnt/β-Catenin Signalings Activate HIF-1α-Induced Metabolic Reprogramming to Impart 5-Fluorouracil Resistance in Colorectal Cancer. J. Exp. Clin. Cancer Res. CR 2022, 41, 15. [Google Scholar] [CrossRef] [PubMed]
  57. Ortmann, B.M. Hypoxia-Inducible Factor in Cancer: From Pathway Regulation to Therapeutic Opportunity. BMJ Oncol. 2024, 3, e000154. [Google Scholar] [CrossRef]
  58. Akakura, N.; Kobayashi, M.; Horiuchi, I.; Suzuki, A.; Wang, J.; Chen, J.; Niizeki, H.; Kawamura, K.I.; Hosokawa, M.; Asaka, M. Constitutive Expression of Hypoxia-Inducible Factor-1alpha Renders Pancreatic Cancer Cells Resistant to Apoptosis Induced by Hypoxia and Nutrient Deprivation. Cancer Res. 2001, 61, 6548–6554. [Google Scholar]
  59. Kumar, H.; Choi, D.-K. Hypoxia Inducible Factor Pathway and Physiological Adaptation: A Cell Survival Pathway? Mediators Inflamm. 2015, 2015, 584758. [Google Scholar] [CrossRef]
  60. Chen, Z.; Han, F.; Du, Y.; Shi, H.; Zhou, W. Hypoxic Microenvironment in Cancer: Molecular Mechanisms and Therapeutic Interventions. Signal Transduct. Target. Ther. 2023, 8, 70. [Google Scholar] [CrossRef]
  61. Monaci, S.; Coppola, F.; Filippi, I.; Falsini, A.; Carraro, F.; Naldini, A. Targeting Hypoxia Signaling Pathways in Angiogenesis. Front. Physiol. 2024, 15, 1408750. [Google Scholar] [CrossRef]
  62. Szűcs, D.; Monostori, T.; Miklós, V.; Páhi, Z.G.; Póliska, S.; Kemény, L.; Veréb, Z. Licensing Effects of Inflammatory Factors and TLR Ligands on the Regenerative Capacity of Adipose-Derived Mesenchymal Stem Cells. Front. Cell Dev. Biol. 2024, 12, 1367242. [Google Scholar] [CrossRef]
  63. Czajka-Francuz, P.; Prendes, M.J.; Mankan, A.; Quintana, Á.; Pabla, S.; Ramkissoon, S.; Jensen, T.J.; Peiró, S.; Severson, E.A.; Achyut, B.R.; et al. Mechanisms of Immune Modulation in the Tumor Microenvironment and Implications for Targeted Therapy. Front. Oncol. 2023, 13, 1200646. [Google Scholar] [CrossRef]
  64. Popova, N.V.; Jücker, M. The Functional Role of Extracellular Matrix Proteins in Cancer. Cancers 2022, 14, 238. [Google Scholar] [CrossRef] [PubMed]
  65. Xia, P.; Dubrovska, A. CD98 Heavy Chain as a Prognostic Biomarker and Target for Cancer Treatment. Front. Oncol. 2023, 13, 1251100. [Google Scholar] [CrossRef] [PubMed]
  66. Li, Y.; He, H.; Jihu, R.; Zhou, J.; Zeng, R.; Yan, H. Novel Characterization of Myeloid-Derived Suppressor Cells in Tumor Microenvironment. Front. Cell Dev. Biol. 2021, 9, 698532. [Google Scholar] [CrossRef]
  67. Seetharam, R.N. Oxaliplatin: Preclinical Perspectives on the Mechanisms of Action, Response and Resistance. ecancermedicalscience 2010. [Google Scholar] [CrossRef] [PubMed]
  68. Kumar, A.A.; Buckley, B.J.; Ranson, M. The Urokinase Plasminogen Activation System in Pancreatic Cancer: Prospective Diagnostic and Therapeutic Targets. Biomolecules 2022, 12, 152. [Google Scholar] [CrossRef] [PubMed]
  69. Peng, L.; Li, Y.; Yao, S.; Gaedcke, J.; Baart, V.M.; Sier, C.F.M.; Neesse, A.; Ellenrieder, V.; Bohnenberger, H.; Fuchs, F.; et al. Urokinase-Type Plasminogen Activator Receptor (uPAR) Cooperates with Mutated KRAS in Regulating Cellular Plasticity and Gemcitabine Response in Pancreatic Adenocarcinomas. Cancers 2023, 15, 1587. [Google Scholar] [CrossRef]
  70. Li, X.; Ma, Q.; Xu, Q.; Liu, H.; Lei, J.; Duan, W.; Bhat, K.; Wang, F.; Wu, E.; Wang, Z. SDF-1/CXCR4 Signaling Induces Pancreatic Cancer Cell Invasion and Epithelial–Mesenchymal Transition in Vitro through Non-Canonical Activation of Hedgehog Pathway. Cancer Lett. 2012, 322, 169–176. [Google Scholar] [CrossRef] [PubMed]
  71. Qian, D.; Lu, Z.; Xu, Q.; Wu, P.; Tian, L.; Zhao, L.; Cai, B.; Yin, J.; Wu, Y.; Staveley-O’Carroll, K.F.; et al. Galectin-1-Driven Upregulation of SDF-1 in Pancreatic Stellate Cells Promotes Pancreatic Cancer Metastasis. Cancer Lett. 2017, 397, 43–51. [Google Scholar] [CrossRef] [PubMed]
  72. Szűcs, D.; Miklós, V.; Monostori, T.; Guba, M.; Kun-Varga, A.; Póliska, S.; Kis, E.; Bende, B.; Kemény, L.; Veréb, Z. Effect of Inflammatory Microenvironment on the Regenerative Capacity of Adipose-Derived Mesenchymal Stem Cells. Cells 2023, 12, 1966. [Google Scholar] [CrossRef] [PubMed]
  73. Kun-Varga, A.; Gubán, B.; Miklós, V.; Parvaneh, S.; Guba, M.; Szűcs, D.; Monostori, T.; Varga, J.; Varga, Á.; Rázga, Z.; et al. Herpes Simplex Virus Infection Alters the Immunological Properties of Adipose-Tissue-Derived Mesenchymal-Stem Cells. Int. J. Mol. Sci. 2023, 24, 11989. [Google Scholar] [CrossRef] [PubMed]
Figure 1. Evaluating the cytotoxic effects of OXP and 5-FU on Capan-1 cells and ASCs using MTT assay. The cells were treated for 48 h with concentrations (ranging from 6.25 to 1000 μM) of (a) OXA and (b) 5-FU. Cell viability is expressed as a percentage of untreated control (Ctrl). Mitomycin (Mito) 20 μg/mL was used as the positive control. (mean ± SD, n = 3). ** p < 0.01 and # p < 0.0001.
Ijms 26 00390 g001
Figure 2. The overall results of RNA sequencing analysis comparing 5-FU and OXP-treated ASCs with the untreated control are presented in (A) PCA plot, (B) heatmap, and (C) Venn diagrams. D25, D39, and D45 represent three biological donor codes (n = 3).
Ijms 26 00390 g002
Figure 3. Significantly differentially expressed genes (DEGs) in ASCs treated with 5-FU and OXP compared with untreated controls. (A) The heatmap shows distinct clustering of control, 5-fluorouracil, and oxaliplatin treatments when only differentially expressed genes (DEGs) are plotted. Venn diagrams of (B) upregulated genes and (C) downregulated genes. D25, D39, and D45 represent three different biological donor codes (n = 3).
Ijms 26 00390 g003
Figure 4. Differentially expressed gene set enrichment analysis (GSEA) results for ASCs treated with OXP: (A) Hallmark gene sets, (B) KEGG pathways, and (C) GO term gene sets pathways.
Ijms 26 00390 g004
Figure 5. GSEA results from the Hallmark and GO Pathway databases for ASCs treated with 5-FU. (A) Hallmark gene sets, (B) GO term gene sets.
Ijms 26 00390 g005
Figure 6. Cytokine expression profile of ASCs following 5-FU and OXP treatment. Compared with untreated controls, the cytokine secretion profile of ASCs at 48 h post-treatment were assessed using the proteome profiler human cytokine array (mean ± SD, n = 3). FGF-19: Fibroblast Growth Factor 19, GM-CSF: Granulocyte–Macrophage Colony-Stimulating Factor, GROα: Growth-Regulated Oncogene Alpha (CXCL1), IL-4: Interleukin 4, IP-10: Interferon Gamma-Induced Protein 10 (CXCL10), DPPIV: Dipeptidyl Peptidase IV (CD26), MIP-α: Macrophage Inflammatory Protein-alpha (CCL3), SDF-1α: Stromal Cell-Derived Factor 1 (CXCL12), uPAR: Urokinase Plasminogen Activator Receptor, VEGF: Vascular Endothelial Growth Factor. Although twofold changes were measured for several cytokines, the significance values ranged from p = 0.05 to p = 0.06. (* p ≤ 0.05, ** p ≤ 0.01,).
Ijms 26 00390 g006
Figure 7. Schematic illustration of the effects of 5-FU and OXP treatments on ASCs, their potential role in the PDAC tumor microenvironment, and the development of chemotherapy resistance. CAFs: cancer-associated fibroblasts, ECM: extracellular matrix, FGF-19: Fibroblast Growth Factor 19, DPPIV: Dipeptidyl Peptidase IV (CD26), IP-10: Interferon Gamma-Induced Protein 10 (CXCL10), IL-4: Interleukin 4, GM-CSF: Granulocyte–Macrophage Colony-Stimulating Factor, GROα: Growth-Regulated Oncogene Alpha (CXCL1), VEGF: Vascular Endothelial Growth Factor, uPAR: Urokinase Plasminogen Activator Receptor, SDF-1α: Stromal Cell-Derived Factor 1 (CXCL12), HIF-1α: Hypoxia-Inducible Factor 1, IL-6: Interleukin 6, IFNγ: Interferon Gamma, NF-κB: Nuclear Factor Kappa B. Created in BioRender.com.
Ijms 26 00390 g007
Table 1. GO enrichment analysis of DEGs in ASCs treated with OXP and 5-FU.
Positively Enriched GO Terms
GO IDDescriptionBg Ratiop-Valuep. Adjustq-ValueGene IDCount
0006977DNA damage response, signal transduction by p53 class mediator resulting in cell cycle arrest18/18,9030.0001019606560474550.02533415486495520.0162517934743993MDM2/PIDD12
0010948Negative regulation of cell cycle process318/18,9030.0001219095279709450.02533415486495520.0162517934743993BCL6/MDM2/PIDD1/RBM144
0046599Regulation of centriole replication23/18,9030.0001681859064557390.02533415486495520.0162517934743993CEP295NL/RBM142
0071456Cellular response to hypoxia151/18,9030.0002592592353428490.02533415486495520.0162517934743993MDM2/STC1/TIGAR3
0031571Mitotic G1 DNA damage checkpoint signaling29/18,9030.0002690969265083240.02533415486495520.0162517934743993MDM2/PIDD12
0044819Mitotic G1/S transition checkpoint signaling30/18,9030.0002881758493646750.02533415486495520.0162517934743993MDM2/PIDD12
0036294Cellular response to decreased oxygen levels159/18,9030.0003017441379418420.02533415486495520.0162517934743993MDM2/STC1/TIGAR3
0045786Negative regulation of cell cycle405/18,9030.0003080140409113090.02533415486495520.0162517934743993BCL6/MDM2/PIDD1/RBM144
0072331Signal transduction by p53 class mediator173/18,9030.0003864688872399210.02629991938766330.0168713288665062EDA2R/MDM2/PIDD13
0071453Cellular response to oxygen levels175/18,9030.000399694823520720.02629991938766330.0168713288665062MDM2/STC1/TIGAR3
0007099Centriole replication42/18,9030.0005670212111696820.03391817790451370.0217584215960806CEP295NL/RBM142
0098534Centriole assembly46/18,9030.0006802667883297520.03594453398435820.0230583236725766CEP295NL/RBM142
0010824Regulation of centrosome duplication47/18,9030.0007101503674721220.03594453398435820.0230583236725766CEP295NL/RBM142
0046605Regulation of centrosome cycle54/18,9030.0009368376076824310.04403136756107420.0282460060662146CEP295NL/RBM142
0010332Response to gamma radiation57/18,9030.001043313463568040.04423414209501840.0283760853945007MDM2/TIGAR2
0045930Negative regulation of mitotic cell cycle246/18,9030.001075602239392550.04423414209501840.0283760853945007BCL6/MDM2/PIDD13
0043122Regulation of I-kappaB kinase/NF-kappaB signaling255/18,9030.001192984330510440.04617551114563940.0296214685160797EDA2R/PIDD1/TNFRSF10B3
Negatively Enriched GO Terms
GO IDDescriptionBg Ratiop-Valuep. Adjustq-ValueGene IDCount
0000280Nuclear division481/18,9031.76881066719348 × 10−181.47872571777375 × 10−151.03894352873049 × 10⁻¹⁵AURKA/BUB1/BUB1B/CCNB1/CCNB2/CENPE/CENPF/DLGAP5/KIF11/KIF20B/KIF23/NDC80/NUF2/NUSAP1/RAD51/TOP2A/TTK17
0007088Regulation of mitotic nuclear division118/18,9031.28092889781954 × 10−164.8902786348109 × 10−143.43587947014396686 × 10⁻¹⁴AURKA/BUB1/BUB1B/CCNB1/CENPF/DLGAP5/KIF20B/NDC80/NUF2/NUSAP1/TTK11
0000819Sister chromatid segregation239/18,9031.75488467756372 × 10−164.8902786348109 × 10−143.43587947396686 × 10⁻¹⁴BUB1/BUB1B/CCNB1/CENPE/CENPF/DLGAP5/KIF11/KIF23/NDC80/NUF2/NUSAP1/TOP2A/TTK13
0140014Mitotic nuclear division325/18,9032.50022223332157 × 10−165.22546446764208 × 10−143.67137896366693 × 10⁻¹⁴AURKA/BUB1/BUB1B/CCNB1/CENPE/CENPF/DLGAP5/KIF11/KIF20B/KIF23/NDC80/NUF2/NUSAP1/TTK14
0000070Mitotic sister chromatid segregation204/18,9031.20987483051498 × 10−151.82830384900337 × 10−131.28455495812627 × 10⁻¹³BUB1/BUB1B/CCNB1/CENPE/CENPF/DLGAP5/KIF11/KIF23/NDC80/NUF2/NUSAP1/TTK12
0051783Regulation of nuclear division145/18,9031.31217979593543 × 10−151.82830384900337 × 10−131.28455495812627 × 10⁻¹³AURKA/BUB1/BUB1B/CCNB1/CENPF/DLGAP5/KIF20B/NDC80/NUF2/NUSAP1/TTK11
0044772Mitotic cell cycle phase transition473/18,9031.55567542073125 × 10−151.85792093104475 × 10−131.30536373649329 × 10⁻¹³AURKA/BRCA1/BUB1/BUB1B/CCNA2/CCNB1/CCNB2/CENPE/CENPF/CIT/DLGAP5/MELK/NDC80/NUF2/TTK15
0007059Chromosome segregation382/18,9032.36061743337282 × 10−152.4668452178746 × 10−131.73319016818689 × 10⁻¹³BRCA1/BUB1/BUB1B/CCNB1/CENPE/CENPF/DLGAP5/KIF11/KIF23/NDC80/NUF2/NUSAP1/TOP2A/TTK14
0098813Nuclear chromosome segregation321/18,9038.09097373728085 × 10−157.51561560485199 × 10−135.28042496538329 × 10⁻¹³BUB1/BUB1B/CCNB1/CENPE/CENPF/DLGAP5/KIF11/KIF23/NDC80/NUF2/NUSAP1/TOP2A/TTK13
0051304Chromosome separation135/18,9033.88243219597149 × 10−143.24571331583216 × 10−122.28041806879167 × 10⁻¹²BUB1/BUB1B/CCNB1/CENPE/CENPF/DLGAP5/NDC80/NUF2/TOP2A/TTK10
Table 2. GSEA results from the Hallmark, KEGG, and GO Pathway databases for ASCs treated with OXP.
Hallmark Gene Sets of ASDMSCs Treated by OXP
Pathwayp-Valuep-Adjlog2errESNESSize
1HALLMARK_E2F_TARGETS2.64139101652653 × 10−50.0002201159180438770.575610261071129−0.340157293053717−2.1949953433741966
2HALLMARK_PROTEIN_SECRETION5.91563187836908 × 10−50.000422545134169220.557332238758646−0.37601381727437−2.2326672567766348
3HALLMARK_TGF_BETA_SIGNALING0.0002185766648844530.001366104155527830.518848077743792−0.495322402827272−2.2584630609656122
4HALLMARK_WNT_BETA_CATENIN_SIGNALING0.0005903240633369320.003279578129649620.477270815362862−0.52540555272117−2.2222835400929118
5HALLMARK_GLYCOLYSIS0.00131753395003110.006587669750155480.45505986738723−0.263389231583071−1.7289968595686271
6HALLMARK_APICAL_SURFACE0.00178041764060840.008092807457310910.45505986738723−0.491393827829415−2.0438994731000217
7HALLMARK_ANDROGEN_RESPONSE0.00267847483936610.01116031183069210.431707695803346−0.310678503446223−1.7723383373859543
8HALLMARK_IL6_JAK_STAT3_SIGNALING0.008348375451263540.03210913635101360.1676585280657650.5033779462622521.6885565229383831
9HALLMARK_INTERFERON_GAMMA_RESPONSE0.01326595072646870.0473783954516740.127970305762430.4230175957674141.5699353194205957
10HALLMARK_OXIDATIVE_PHOSPHORYLATION0.01693631890375520.05645439634585050.3524878575836190.1909076323316221.40892610341346116
KEGG Pathway Gene Sets of ASCs Treated by OXP
Pathwayp-Valuep-Adjlog2errESNESSize
1KEGG_CYTOKINE_CYTOKINE_RECEPTOR_INTERACTION3.93732090514141 × 10−70.00003464927694445320.6749628600110250.5323319381265442.0589265198708380
2KEGG_PATHWAYS_IN_CANCER4.22552157859185 × 10−70.00003464927694445320.674962860011025−0.294701843495029−2.15756612113785130
3KEGG_WNT_SIGNALING_PATHWAY7.93012559407585 × 10−70.00004335135324761460.659444398037935−0.393751027771448−2.4788336269972163
4KEGG_RIBOSOME1.8006005614366 × 10−50.0007382462301890040.5756102610711290.5081959953472521.9527204383297774
5KEGG_CELL_CYCLE6.56683118791417 × 10−50.002153920629635850.538434096309916−0.368250635338693−2.1742837199590949
6KEGG_COLORECTAL_CANCER0.0001531270644226250.004185473094218420.518848077743792−0.424324314956772−2.246479721758934
7KEGG_ADHERENS_JUNCTION0.0003447170356975920.004711132821200420.49849310876659−0.417114186960923−2.1963043683229833
8KEGG_PROPANOATE_METABOLISM0.0002541444051571460.004711132821200420.49849310876659−0.587093416395374−2.3189172250216515
9KEGG_REGULATION_OF_ACTIN_CYTOSKELETON0.0002232725601996410.004711132821200420.518848077743792−0.289865264978343−1.9313568174466275
10KEGG_SYSTEMIC_LUPUS_ERYTHEMATOSUS0.0003259455076231770.004711132821200420.498493108766590.6249118708425552.0101640980668525
GO Pathway Gene Sets of ASCs Treated by OXP
Pathwayp-Valuep-Adjlog2errESNESSize
1GOCC_CILIARY_BASAL_BODY7.82720516782125 × 10−70.00009199268191356980.659444398037935−0.39610119737703−2.4404040147657160
2GOMF_CYTOKINE_RECEPTOR_BINDING1.51281379650273 × 10−90.0000009067805896237340.7881868108002370.5829636222965492.2492696453628380
3GOMF_PHOSPHORIC_ESTER_HYDROLASE_ACTIVITY1.3092422431839 × 10−90.0000008719553339604780.788186810800237−0.333513038562531−2.41942991352463126
4GOBP_REGULATION_OF_PROTEIN_SERINE_THREONINE_KINASE_ACTIVITY7.01033059960302 × 10−70.0000840398432280410.659444398037935−0.257783461836265−1.98310722278176152
5GOBP_CELLULAR_RESPONSE_TO_ORGANIC_CYCLIC_COMPOUND6.54759701956862 × 10−70.00008009448272509040.659444398037935−0.237847374889051−2.05107083041299201
6GOMF_PHOSPHATASE_ACTIVITY2.66353767958835 × 10−80.00000798262242572630.73376198835648−0.352246801743327−2.49094501452385101
7GOBP_CILIUM_ORGANIZATION6.36062716975486 × 10−70.00007942833178231380.659444398037935−0.275699356833308−2.05428254765141
8GOBP_HEART_MORPHOGENESIS6.08811861023075 × 10−70.00007764294244621940.659444398037935−0.358748271702841−2.3868075479636182
9GOBP_REGIONALIZATION6.07629933943173 × 10−70.00007764294244621940.659444398037935−0.319006359814004−2.2465575880912103
10GOBP_PATTERN_SPECIFICATION_PROCESS1.97618354957955 × 10−80.000006330356263945350.73376198835648−0.307348031514522−2.28721000698764135
Table 3. GSEA results from the Hallmark and GO Pathway databases for ASCs treated with 5-FU.
Hallmark Pathway Gene Sets of ASCs Treated by 5-FU
Pathwayp-Valuep-Adjlog2errESNESSize
1HALLMARK_G2M_CHECKPOINT0.00007334711097272290.0006823625734107190.538434096309916−0.558868261837081−1.783066839069745
2HALLMARK_E2F_TARGETS0.0001364725146821440.0006823625734107190.518848077743792−0.574875140341789−1.8051530864607838
3HALLMARK_HYPOXIA0.0009341512332584010.003113837444194670.4772708153628620.7694308700179442.240040891281297
4HALLMARK_MITOTIC_SPINDLE0.001965652803641630.004914132009104080.335068558717014−0.567565074528727−1.6866125330105225
5HALLMARK_SPERMATOGENESIS0.02385821404226310.04771642808452620.0986244904449457−0.61558780552373−1.5272479517533810
6HALLMARK_ESTROGEN_RESPONSE_LATE0.05311425296140620.0885237549356770.0692037251597512−0.691973854147228−1.428653476191815
7HALLMARK_GLYCOLYSIS0.1005354606053980.143622086579140.0453371931652217−0.507474988249809−1.339052734408213
8HALLMARK_P53_PATHWAY0.6052998605299860.7519211989980040.03729720166767910.3636363636363640.8912840308261185
9HALLMARK_MYC_TARGETS_V10.6767290790982040.7519211989980040.0135521440941112−0.420312088040893−0.8677789226661985
10HALLMARK_MTORC1_SIGNALING0.8747986191024170.8747986191024170.00810455465169815−0.283125336361726−0.6859839950430199
GO Pathway Gene Sets of ASCs Treated by 5-FU
Pathwayp-Valuep-Adjlog2errESNESSize
1GOBP_CELL_CYCLE2.79067384940996 × 10−111.58231207261545 × 10−80.863415391606693−0.685309035511196−2.2733332658102797
2GOBP_CELL_CYCLE_PROCESS3.82674947408738 × 10−97.23255650602515 × 10−70.761460801445585−0.651897388248435−2.1637115517334988
3GOBP_CELL_DIVISION1.40683280616485 × 10−71.13953457299353 × 10−50.690132458796796−0.632482709801711−2.05558972226756
4GOBP_CHROMOSOME_ORGANIZATION4.06803322002345 × 10−60.0001774288335194840.610526878385931−0.603365321057273−1.9493676992925152
5GOBP_CHROMOSOME_SEGREGATION1.29447171412157 × 10−81.46793092381386 × 10−60.747739663149885−0.68303550124922−2.1863977237624646
6GOBP_CYTOSKELETON_ORGANIZATION1.58714316917903 × 10−50.0005999401179496740.575610261071129−0.58390599218358−1.8864980151518752
7GOBP_MITOTIC_CELL_CYCLE2.96260527345182 × 10−97.23255650602515 × 10−70.774939030136436−0.644228764699433−2.1317138773759979
8GOBP_MITOTIC_CELL_CYCLE_PROCESS8.47450055550495 × 10−91.20126045374283 × 10−60.747739663149885−0.635828913368128−2.1004572162712576
9GOBP_MITOTIC_NUCLEAR_DIVISION1.12901172508325 × 10−067.11277386802448 × 10−50.643551836150722−0.640638667096561−2.0506853903382446
10GOBP_NUCLEAR_CHROMOSOME_SEGREGATION1.26791003202673 × 10−71.13953457299353 × 10−50.690132458796796−0.668286487412083−2.1109178510708340
11GOBP_ORGANELLE_FISSION2.5763252011723 × 10−71.82597048633087. × 10−50.674962860011025−0.632903138174849−2.0510311971621454
12GOBP_REGULATION_OF_CELL_CYCLE2.5659740132735 x. 10−60.0001322642968660070.627256739718528−0.590061640981375−1.9439625142652170
13GOBP_SISTER_CHROMATID_SEGREGATION1.53348302367881 × 10−68.69484874425883 × 10−50.643551836150722−0.650394050059615−2.0436156373629638
14GOCC_MICROTUBULE_CYTOSKELETON4.61134563187446 × 10−60.0001867594980909150.610526878385931−0.592507368359088−1.9287049325056857
15GOCC_SPINDLE3.52663387478052 × 10−60.0001666334505833790.627256739718528−0.617148091472953−1.9534490881243441
Table 4. The phenotype of ASCs used in the study.
CD MarkersMeanSD
HLA-DR0.90.7
CD2999.00.4
CD341.91.5
CD4796.11.6
CD49A92.55.6
CD5182.95.8
CD7399.00.1
CD9090.91.0
CD10588.16.0
CD16695.90.8
Disclaimer/Publisher’s Note: The statements, opinions and data contained in all publications are solely those of the individual author(s) and contributor(s) and not of MDPI and/or the editor(s). MDPI and/or the editor(s) disclaim responsibility for any injury to people or property resulting from any ideas, methods, instructions or products referred to in the content.