
Evaluation of Selected Pro- and Anti-Inflammatory Adipokines in Colostrum from Mothers with Gestational Diabetes Mellitus


Abstract
1. Introduction
2. Results
2.1. Characteristics of the Study Population
2.2. Concentration of Colostral Adipokines in Relation to Maternal Hyperglycemia (GDM vs. Non-GDM)
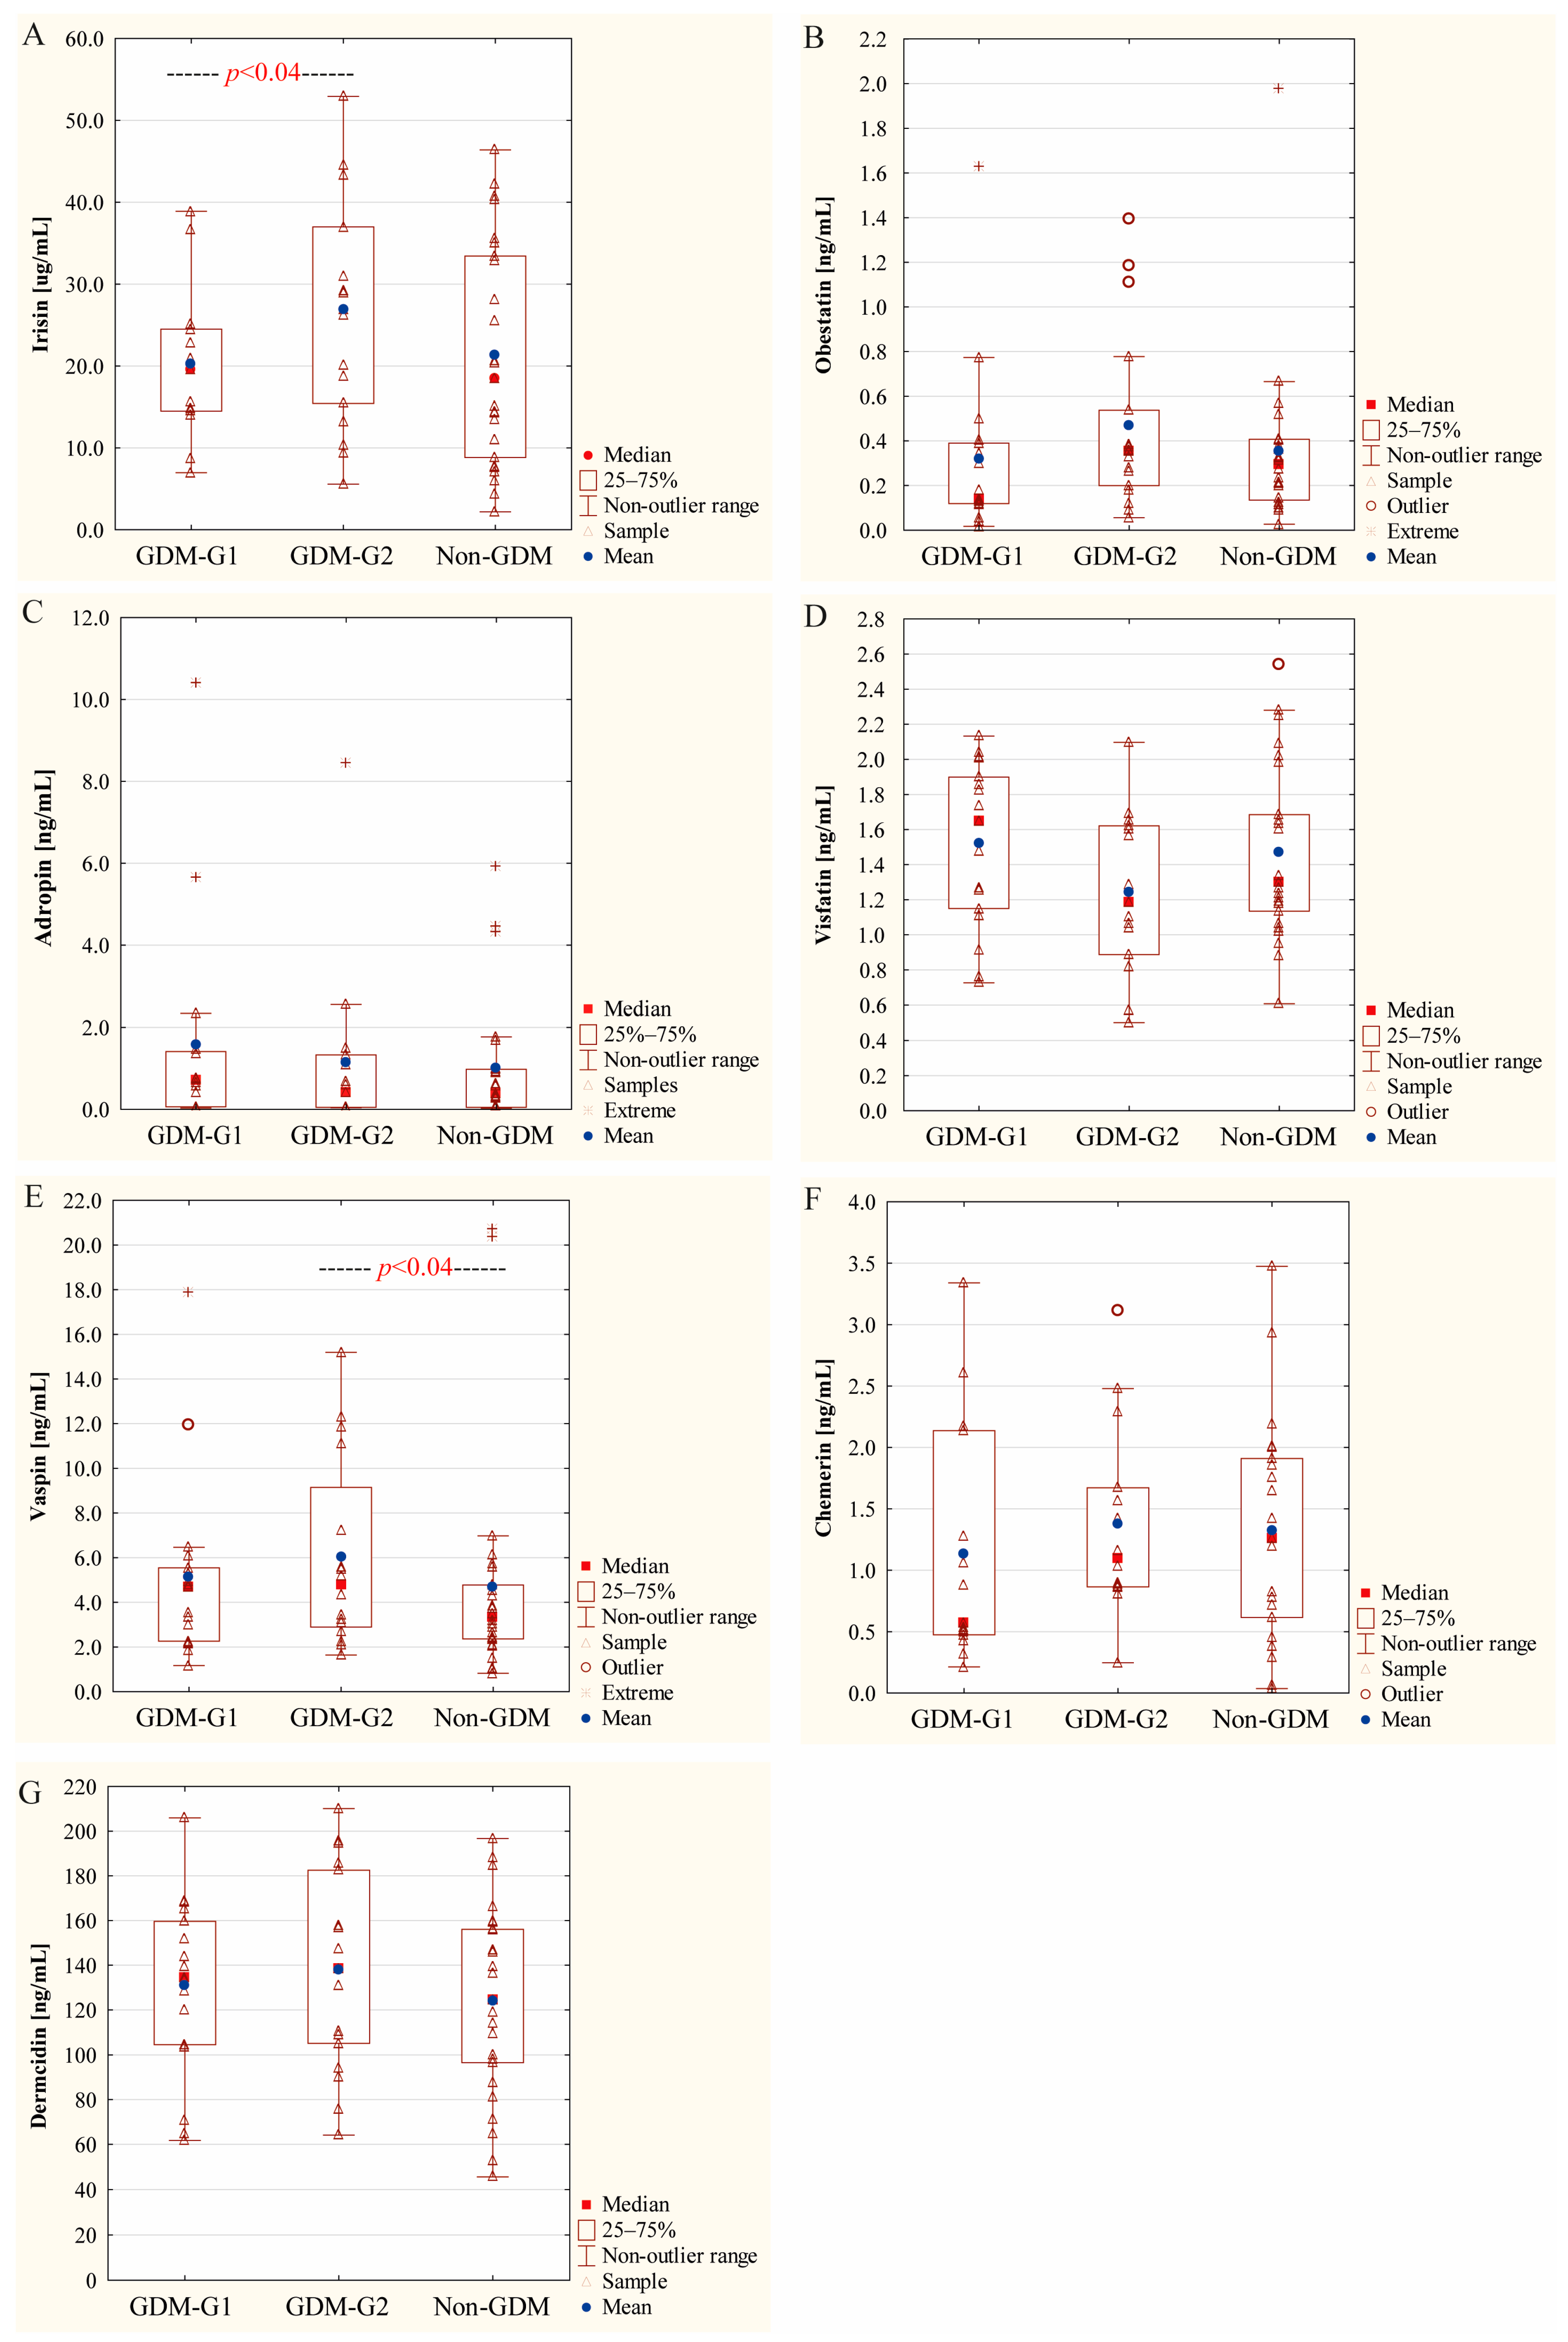
2.3. Concentration of Colostral Adipokines in Relation to Severity of Maternal Hyperglycemia
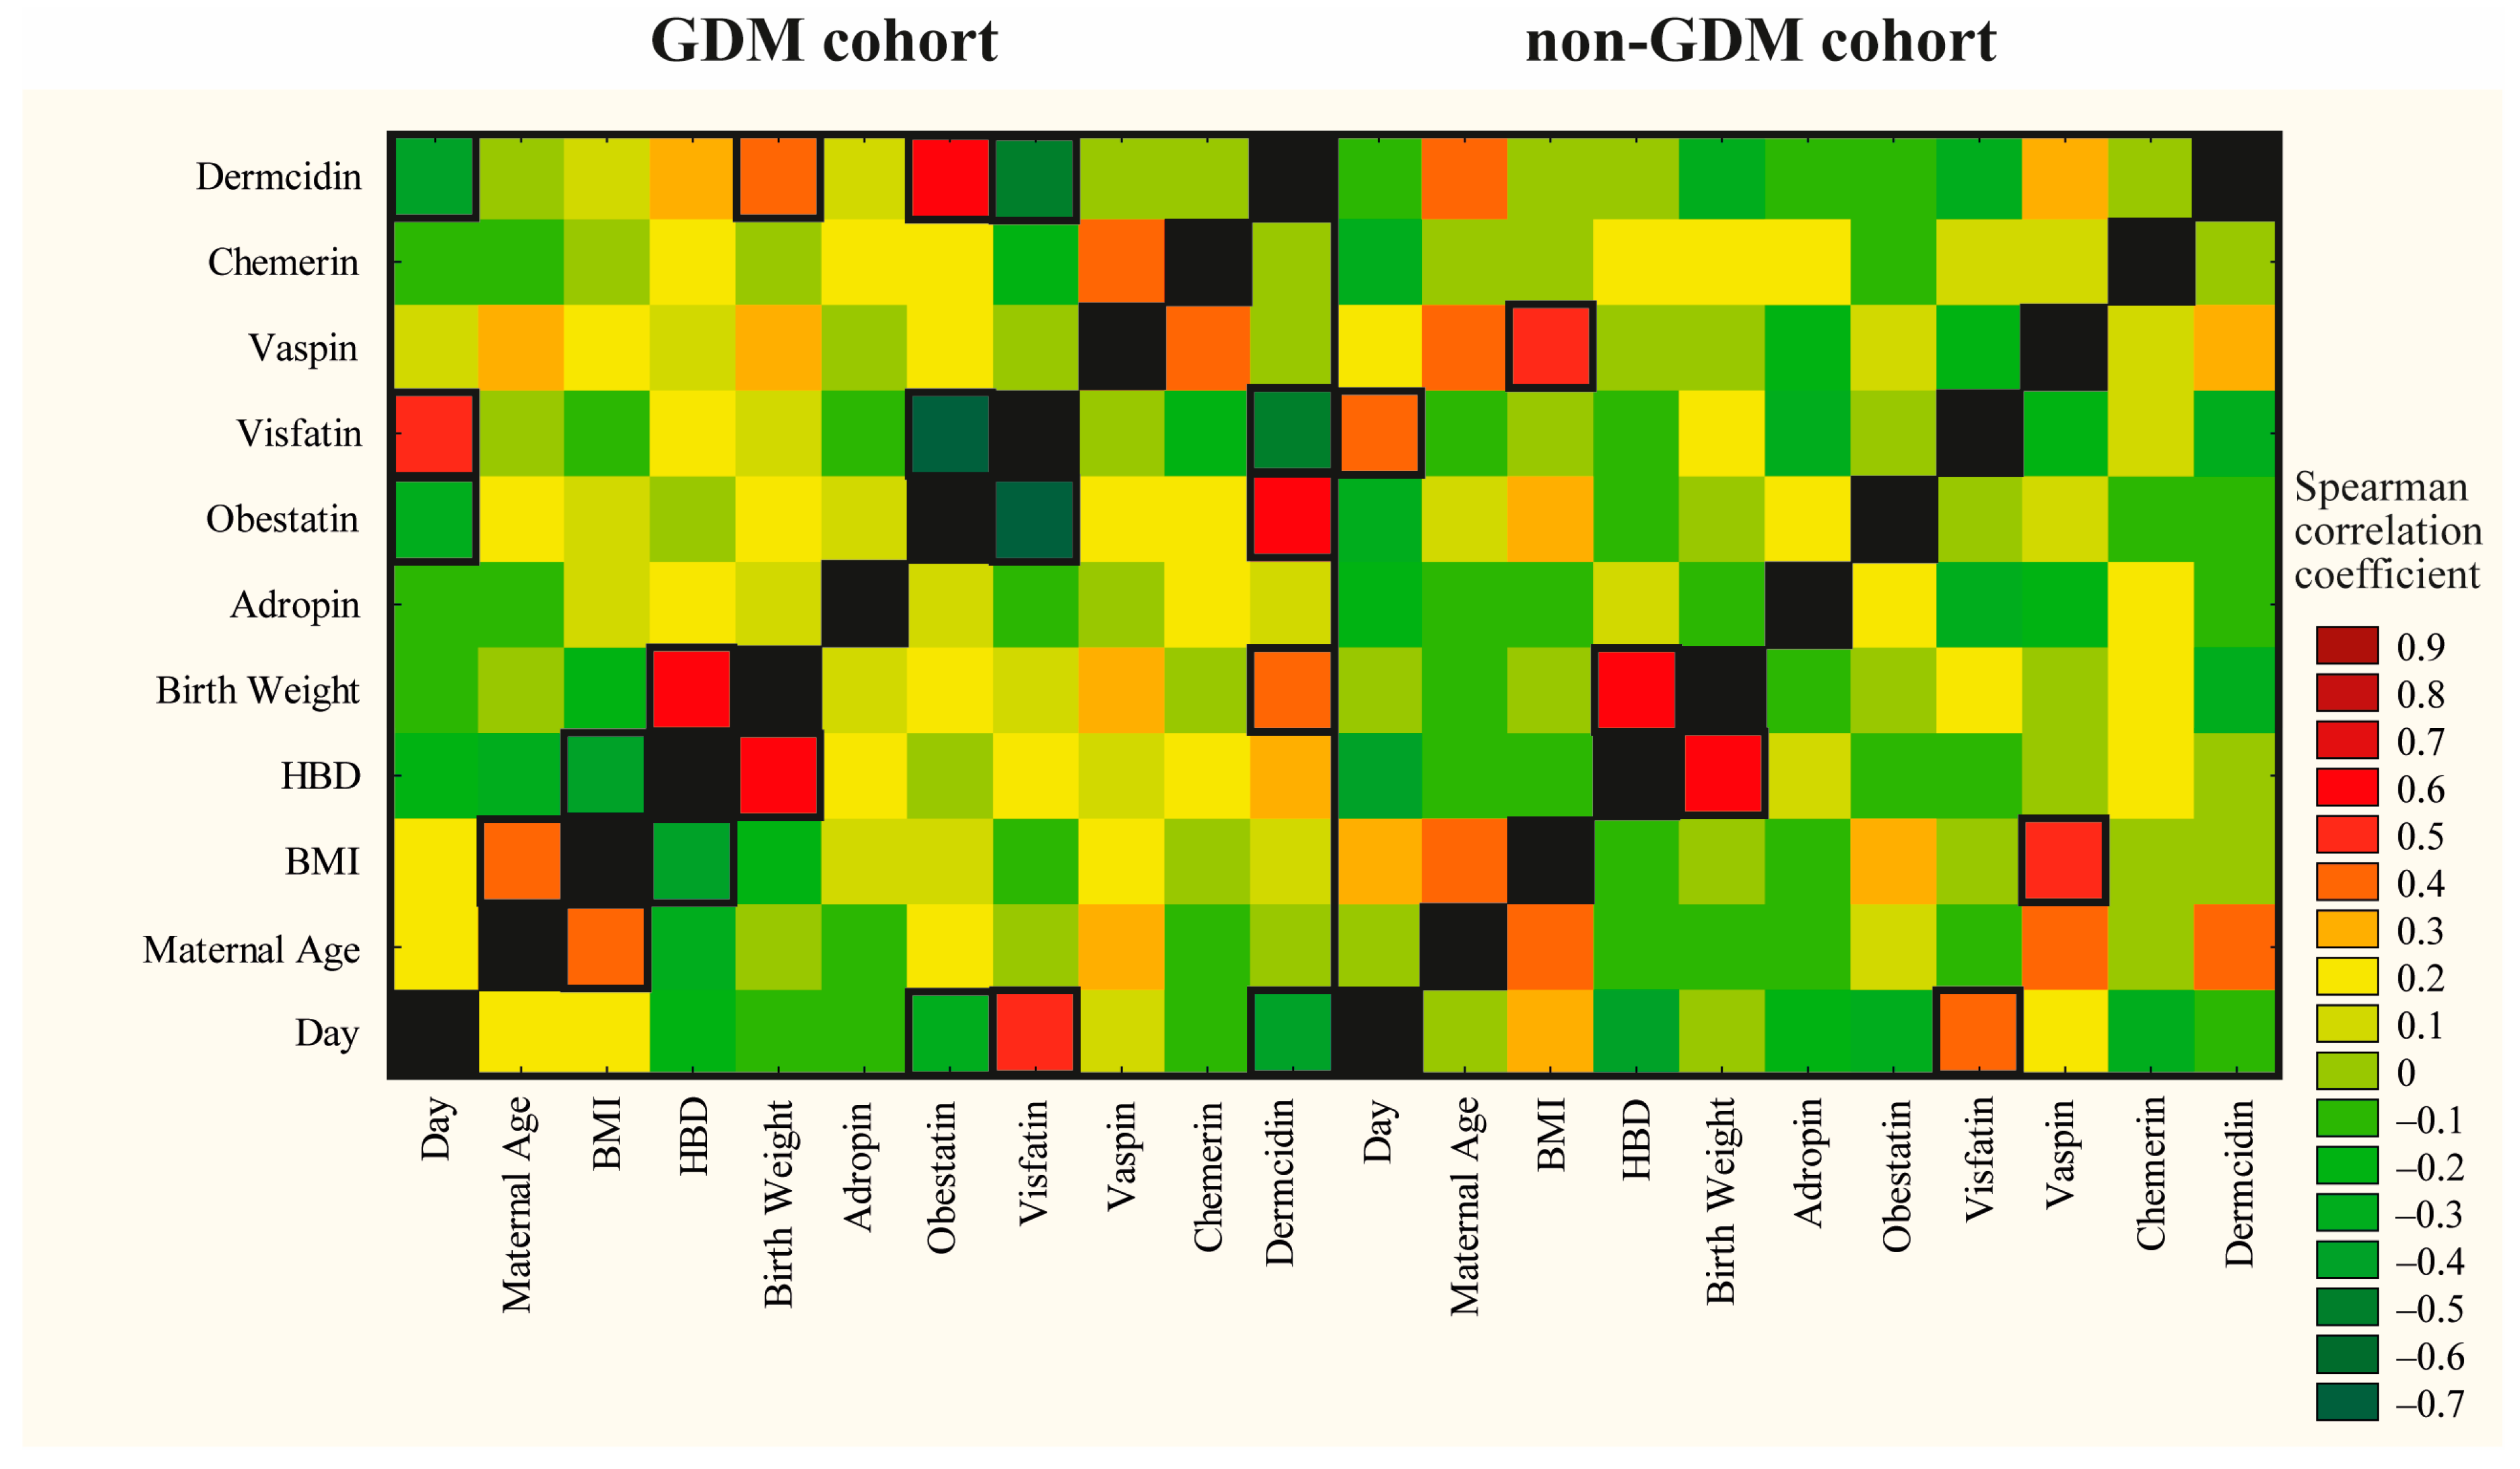
2.4. Correlations Between Adipokines and Maternal, Obstetrical and Neonatal Outcomes
2.5. Human Colostral Irisin Levels Reflect Maternal Health State
2.6. Associations of Maternal, Obstetrical and Neonatal Factors with Colostral Adipokines
3. Discussion
Strength and Limitations
4. Materials and Methods
4.1. Study Designed
4.2. Recruitment of Breastfeeding Mothers
4.3. Ethics
4.4. Colostrum Collection
4.5. Sample Pre-Treatment for Analysis
4.6. Determination of Adipokine Concentrations
4.7. Statistical Analysis
5. Conclusions and Future Perspectives
Supplementary Materials
Author Contributions
Funding
Institutional Review Board Statement
Informed Consent Statement
Data Availability Statement
Conflicts of Interest
References
- Nilofer, A.R.; Raju, V.S.; Dakshayini, B.R.; Zaki, S.A. Screening in high-risk group of gestational diabetes mellitus with its maternal and fetal outcomes. Indian J. Endocrinol. Metab. 2012, 16, 74–78. [Google Scholar]
- Buchanan, T.A.; Xiang, A.H.; Page, K.A. Gestational diabetes mellitus: Risks and management during and after pregnancy. Nat. Rev. Endocrinol. 2012, 8, 639–649. [Google Scholar] [CrossRef] [PubMed]
- Sandsæter, H.L.; Horn, J.; Rich-Edwards, J.W.; Haugdahl, H.S. Preeclampsia, gestational diabetes and later risk of cardiovascular disease: Women’s experiences and motivation for lifestyle changes explored in focus group interviews. BMC Pregnancy Childbirth 2019, 19, 448. [Google Scholar] [CrossRef]
- Deng, L.; Ning, B.; Yang, H. Association between gestational diabetes mellitus and adverse obstetric outcomes among women with advanced maternal age: A retrospective cohort study. Medicine 2022, 101, e30588. [Google Scholar] [CrossRef] [PubMed]
- Bashir, M.; Ibrahim, I.; Eltaher, F.; Beer, S.; Baagar, K.; Aboulfotouh, M.; Konje, J.C.; Abou-Samra, A.B. Screening pregnant women in a high-risk population with WHO-2013 or NICE diagnostic criteria does not affect the prevalence of gestational diabetes. Sci. Rep. 2021, 11, 5604. [Google Scholar] [CrossRef]
- Mazumder, T.; Akter, E.; Rahman, S.M.; Islam, M.T.; Talukder, M.R. Prevalence and risk factors of gestational diabetes mellitus in bangladesh: Findings from demographic health survey 2017–2018. Int. J. Environ. Res. Public Health 2022, 19, 2583. [Google Scholar] [CrossRef]
- Modzelewski, R.; Stefanowicz-Rutkowska, M.M.; Matuszewski, W.; Bandurska-Stankiewicz, E.M. Gestational Diabetes Mellitus-Recent Literature Review. J. Clin. Med. 2022, 11, 5736. [Google Scholar] [CrossRef] [PubMed]
- Zaccara, T.A.; Paganoti, C.F.; Mikami, F.C.F.; Francisco, R.P.V.; Costa, R.A. WHO criteria for diabetes in pregnancy: A retrospective cohort. BMC Pregnancy Childbirth 2022, 22, 385. [Google Scholar] [CrossRef]
- Hedderson, M.M.; Darbinian, J.A.; Ferrara, A. Disparities in the risk of gestational diabetes by race-ethnicity and country of birth. Paediatr. Perinat. Epidemiol. 2010, 24, 441–448. [Google Scholar] [CrossRef] [PubMed]
- Li, G.; Wei, T.; Ni, W.; Zhang, A.; Zhang, J.; Xing, Y.; Xing, Q. Incidence and risk factors of gestational diabetes mellitus: A prospective cohort study in Qingdao, China. Front. Endocrinol. 2020, 11, 636. [Google Scholar] [CrossRef] [PubMed]
- Shah, L.M.; Kwapong, Y.A.; Boakye, E.; Ogunwole, S.M.; Bennett, W.L.; Blumenthal, R.S.; Hays, A.G.; Blaha, M.J.; Nasir, K.; Zakaria, S.; et al. Racial disparities in prevalence of gestational diabetes by maternal nativity and length of US residence in an urban low-income population in the United States. CJC Open 2022, 4, 540–550. [Google Scholar] [CrossRef]
- Zeng, J.; Shen, F.; Zou, Z.Y.; Yang, R.X.; Jin, Q.; Yang, J.; Chen, G.Y.; Fan, J.G. Association of maternal obesity and gestational diabetes mellitus with overweight/obesity and fatty liver risk in offspring. World J. Gastroenterol. 2022, 28, 1681–1691. [Google Scholar] [CrossRef] [PubMed]
- American Diabetes Association. Diagnosis and classification of diabetes mellitus. Diabetes Care 2010, 33, S62–S69. [Google Scholar] [CrossRef] [PubMed]
- World Health Organisation. Use of Glycated Haemoglobin (HbA1c) in Diagnosis of Diabetes Mellitus; WHO/NMH/CHP/CPM/11.1; World Health Organisation: Geneva, Switzerland, 2011. [Google Scholar]
- Fan, W.; Zheng, H.; Wei, N.; Nathan, D.M. Estimating HbA1c from timed Self-Monitored Blood Glucose values. Diabetes Res. Clin. Pract. 2018, 141, 56–61. [Google Scholar] [CrossRef] [PubMed]
- Buhary, B.M.; Almohareb, O.; Aljohani, N.; Alzahrani, S.H.; Elkaissi, S.; Sherbeeni, S.; Almaghamsi, A.; Almalki, M. Glycemic control and pregnancy outcomes in patients with diabetes in pregnancy: A retrospective study. Indian. J. Endocrinol. Metab. 2016, 20, 481–490. [Google Scholar]
- Kumari, R.; Dalal, V.; Kachhawa, G.; Sahoo, I.; Khadgawat, R.; Mahey, R.; Kulshrestha, V.; Vanamail, P.; Sharma, J.B.; Bhatla, N.; et al. Maternal and perinatal outcome in gestational diabetes mellitus in a tertiary care hospital in Delhi. Indian J. Endocrinol. Metab. 2018, 22, 116–120. [Google Scholar] [PubMed]
- Contreras-Duarte, S.; Carvajal, L.; Garchitorena, M.J.; Subiabre, M.; Fuenzalida, B.; Cantin, C.; Farías, M.; Leiva, A. Gestational diabetes mellitus treatment schemes modify maternal plasma cholesterol levels dependent to women’s weight: Possible impact on feto-placental vascular function. Nutrients 2020, 12, 506. [Google Scholar] [CrossRef]
- Ejaz, Z.; Azhar Khan, A.; Sebghat Ullah, S.; Aamir Hayat, M.; Maqbool, M.A.; Amin Baig, A. The effects of gestational diabetes on fetus: A surveillance study. Cureus 2023, 15, e35103. [Google Scholar] [CrossRef] [PubMed]
- Le, D.C.; Vu, T.B.; Tran, T.N.; Nguyen, T.L.; Nguyen, T.B.; Nguyen, D.C.; Hoang, V.T. The effectiveness of lifestyle changes in glycemic control among pregnant women with gestational diabetes mellitus. Medicina 2023, 59, 1587. [Google Scholar] [CrossRef]
- Bryson, C.L.; Ioannou, G.N.; Rulyak, S.J.; Critchlow, C. Association between gestational diabetes and pregnancy-induced hypertension. Am. J. Epidemiol. 2003, 158, 1148–1153. [Google Scholar] [CrossRef] [PubMed]
- Metcalfe, A.; Sabr, Y.; Hutcheon, J.A.; Donovan, L.; Lyons, J.; Burrows, J.; Joseph, K.S. Trends in obstetric intervention and pregnancy outcomes of canadian women with diabetes in pregnancy from 2004 to 2015. J. Endocr. Soc. 2017, 1, 1540–1549. [Google Scholar] [CrossRef]
- Martyn, J.A.; Kaneki, M.; Yasuhara, S. Obesity-induced insulin resistance and hyperglycemia: Etiologic factors and molecular mechanisms. Anesthesiology 2008, 109, 137–148. [Google Scholar] [CrossRef] [PubMed]
- Bellamy, L.; Casas, J.P.; Hingorani, A.D.; Williams, D. Type 2 diabetes mellitus after gestational diabetes: A systematic review and meta-analysis. Lancet 2009, 373, 1773–1779. [Google Scholar] [CrossRef]
- Herath, H.; Herath, R.; Wickremasinghe, R. Gestational diabetes mellitus and risk of type 2 diabetes 10 years after the index pregnancy in Sri Lankan women—A community based retrospective cohort study. PLoS ONE 2017, 12, e0179647. [Google Scholar] [CrossRef] [PubMed]
- Arimitsu, T.; Kasuga, Y.; Ikenoue, S.; Saisho, Y.; Hida, M.; Yoshino, J.; Itoh, H.; Tanaka, M.; Ochiai, D. Risk factors of neonatal hypoglycemia in neonates born to mothers with gestational diabetes. Endocr. J. 2023, 70, 511–517. [Google Scholar] [CrossRef]
- Mitanchez, D.; Yzydorczyk, C.; Simeoni, U. What neonatal complications should the pediatrician be aware of in case of maternal gestational diabetes? World J. Diabetes. 2015, 6, 734–743. [Google Scholar] [CrossRef] [PubMed]
- Al-Biltagi, M.; El Razaky, O.; El Amrousy, D. Cardiac changes in infants of diabetic mothers. World J. Diabetes 2021, 12, 1233–1247. [Google Scholar] [CrossRef]
- Langer, O.; Mazze, R. The relationship between large-for-gestational-age infants and glycemic control in women with gestational diabetes. Am. J. Obstet. Gynecol. 1988, 159, 1478–1483. [Google Scholar] [CrossRef]
- Katon, J.; Reiber, G.; Williams, M.A.; Yanez, D.; Miller, E. Antenatal haemoglobin A1c and risk of large-for-gestational-age infants in a multi-ethnic cohort of women with gestational diabetes. Paediatr. Perinat. Epidemiol. 2012, 26, 208–2017. [Google Scholar] [CrossRef]
- Gillman, M.W.; Rifas-Shiman, S.; Berkey, C.S.; Field, A.E.; Colditz, G.A. Maternal gestational diabetes, birth weight, and adolescent obesity. Pediatrics 2003, 111, e221–e226. [Google Scholar] [CrossRef]
- Boney, C.M.; Verma, A.; Tucker, R.; Vohr, B.R. Metabolic syndrome in childhood: Association with birth weight, maternal obesity, and gestational diabetes mellitus. Pediatrics 2005, 115, e290–e296. [Google Scholar] [CrossRef]
- Kim, S.Y.; England, J.L.; Sharma, J.A.; Njoroge, T. Gestational diabetes mellitus and risk of childhood overweight and obesity in offspring: A systematic review. Exp. Diabetes Res. 2011, 2011, 541308. [Google Scholar] [CrossRef] [PubMed]
- Bider-Canfield, Z.; Martinez, M.P.; Wang, X.; Yu, W.; Bautista, M.P.; Brookey, J.; Page, K.A.; Buchanan, T.A.; Xiang, A.H. Maternal obesity, gestational diabetes, breastfeeding and childhood overweight at age 2 years. Pediatr. Obes. 2017, 12, 171–178. [Google Scholar] [CrossRef]
- Kaul, P.; Bowker, S.L.; Savu, A.; Yeung, R.O.; Donovan, L.E.; Ryan, E.A. Association between maternal diabetes, being large for gestational age and breast-feeding on being overweight or obese in childhood. Diabetologia 2019, 62, 249–258. [Google Scholar] [CrossRef] [PubMed]
- Murray, S.R.; Reynolds, R.M. Short- and long-term outcomes of gestational diabetes and its treatment on fetal development. Prenat. Diagn. 2020, 40, 1085–1091. [Google Scholar] [CrossRef] [PubMed]
- Alejandro, E.U.; Mamerto, T.P.; Chung, G.; Villavieja, A.; Gaus, N.L.; Morgan, E.; Pineda-Cortel, M.R.B. Gestational diabetes mellitus: A harbinger of the vicious cycle of diabetes. Int. J. Mol. Sci. 2020, 21, 5003. [Google Scholar] [CrossRef] [PubMed]
- Torres-Torres, J.; Monroy-Muñoz, I.E.; Perez-Duran, J.; Solis-Paredes, J.M.; Camacho-Martinez, Z.A.; Baca, D.; Espino-y-Sosa, S.; Martinez-Portilla, R.; Rojas-Zepeda, L.; Borboa-Olivares, H.; et al. Cellular and molecular pathophysiology of gestational diabetes. Int. J. Mol. Sci. 2024, 25, 11641. [Google Scholar] [CrossRef] [PubMed]
- Carreno, C.A.; Clifton, R.G.; Hauth, J.C.; Myatt, L.; Roberts, J.M.; Spong, C.Y.; Varner, M.W.; Thorp JMJr Mercer, B.M.; Peaceman, A.M.; Ramin, S.M.; et al. Eunice Kennedy Shriver National Institute of Child Health and Human Development (NICHD) Maternal-Fetal Medicine Units (MFMU) Network. Excessive early gestational weight gain and risk of gestational diabetes mellitus in nulliparous women. Obstet. Gynecol. 2012, 119, 1227–1233. [Google Scholar] [CrossRef]
- Lim, P.Q.; Lai, Y.J.; Ling, P.Y.; Chen, K.H. Cellular and molecular overview of gestational diabetes mellitus: Is it predictable and preventable? World J. Diabetes 2023, 14, 1693–1709. [Google Scholar] [CrossRef] [PubMed]
- Brown, B.N.; Ratner, B.D.; Goodman, S.B.; Amar, S.; Badylak, S.F. Macrophage polarization: An opportunity for improved outcomes in biomaterials and regenerative medicine. Biomaterials 2012, 33, 3792–3802. [Google Scholar] [CrossRef]
- Xue, H.; Zhang, Z.; Lin, Z.; Su, J.; Panayi, A.C.; Xiong, Y.; Hu, L.; Hu, Y.; Chen, L.; Yan, C.; et al. Enhanced tissue regeneration through immunomodulation of angiogenesis and osteogenesis with a multifaceted nanohybrid modified bioactive scaffold. Bioact. Mater. 2022, 18, 552–568. [Google Scholar] [CrossRef] [PubMed]
- Yu, Y.; Yue, Z.; Xu, M.; Zhang, M.; Shen, X.; Ma, Z.; Li, J.; Xie, X. Macrophages play a key role in tissue repair and regeneration. Peer. J. 2022, 10, e14053. [Google Scholar] [CrossRef] [PubMed]
- Ouchi, N.; Parker, J.L.; Lugus, J.J.; Walsh, K. Adipokines in inflammation and metabolic disease. Nat. Rev. Immunol. 2011, 11, 85–97. [Google Scholar] [CrossRef] [PubMed]
- Makki, K.; Froguel, P.; Wolowczuk, I. Adipose tissue in obesity-related inflammation and insulin resistance: Cells, cytokines, and chemokines. ISRN Inflamm. 2013, 2013, 139239. [Google Scholar] [CrossRef]
- Menendez, A.; Wanczyk, H.; Walker, J.; Zhou, B.; Santos, M.; Finck, C. Obesity and adipose tissue dysfunction: From pediatrics to adults. Genes 2022, 13, 1866. [Google Scholar] [CrossRef]
- Varra, F.N.; Varras, M.; Varra, V.K.; Theodosis-Nobelos, P. Molecular and pathophysiological relationship between obesity and chronic inflammation in the manifestation of metabolic dysfunctions and their inflammation mediating treatment options (Review). Mol. Med. Rep. 2024, 29, 95. [Google Scholar] [CrossRef] [PubMed]
- Hsu, P.S.; Wu, C.S.; Chang, J.F.; Lin, W.N. Leptin promotes cPLA2 gene expression through activation of the MAPK/NF-ΚB/P300 cascade. Int. J. Mol. Sci. 2015, 16, 27640–27658. [Google Scholar] [CrossRef] [PubMed]
- Mancuso, P. The role of adipokines in chronic inflammation. Immunotargets Ther. 2016, 5, 47–56. [Google Scholar] [CrossRef]
- Clemente-Suárez, V.J.; Redondo-Flórez, L.; Beltrán-Velasco, A.I.; Martín-Rodríguez, A.; Martínez-Guardado, I.; Navarro-Jiménez, E.; Laborde-Cárdenas, C.C.; Tornero-Aguilera, J.F. The role of adipokines in health and disease. Biomedicines 2023, 11, 1290. [Google Scholar] [CrossRef] [PubMed]
- Kirichenko, T.V.; Markina, Y.V.; Bogatyreva, A.I.; Tolstik, T.V.; Varaeva, Y.R.; Starodubova, A.V. The Role of Adipokines in Inflammatory Mechanisms of Obesity. Int. J. Mol. Sci. 2022, 23, 14982. [Google Scholar] [CrossRef]
- Li, S.; Li, X. Leptin in normal physiology and leptin resistance. Sci. Bull. 2016, 61, 1480–1488. [Google Scholar] [CrossRef]
- Socol, C.T.; Chira, A.; Martinez-Sanchez, M.A.; Nuñez-Sanchez, M.A.; Maerescu, C.M.; Mierlita, D.; Rusu, A.V.; Ruiz-Alcaraz, A.J.; Trif, M.; Ramos-Molina, B. Leptin signaling in obesity and colorectal cancer. Int. J. Mol. Sci. 2022, 23, 4713. [Google Scholar] [CrossRef] [PubMed]
- Kugananthan, S.; Gridneva, Z.; Lai, C.T.; Hepworth, A.R.; Mark, P.J.; Kakulas, F.; Geddes, D.T. Associations between maternal body composition and appetite hormones and macronutrients in human milk. Nutrients 2017, 9, 252. [Google Scholar] [CrossRef]
- de Fluiter, K.S.; Kerkhof, G.F.; van Beijsterveldt, I.A.L.P.; Breij, L.M.; van Vark-van der Zee, L.C.; Mulder, M.T.; Abrahamse-Berkeveld, M.; Hokken-Koelega, A.C.S. Appetite-regulating hormone trajectories and relationships with fat mass development in term-born infants during the first 6 months of life. Eur. J. Nutr. 2021, 60, 3717–3725. [Google Scholar] [CrossRef]
- Juan Castell, M.F.; Peraita-Costa, I.; Soriano, J.M.; Llopis-Morales, A.; Morales-Suarez-Varela, M. A review of the relationship between the appetite-regulating hormone leptin present in human milk and infant growth. Breastfeed. Med. 2022, 17, 98–111. [Google Scholar] [CrossRef]
- Christensen, S.H.; Lewis, J.I.; Larnkjær, A.; Frøkiær, H.; Allen, L.H.; Mølgaard, C.; Michaelsen, K.F. Associations between maternal adiposity and appetite-regulating hormones in human milk are mediated through maternal circulating concentrations and might affect infant outcomes. Front. Nutr. 2022, 9, 1025439. [Google Scholar] [CrossRef]
- Lis-Kuberka, J.; Berghausen-Mazur, M.; Orczyk-Pawiłowicz, M. Gestational diabetes mellitus and colostral appetite-regulating adipokines. Int. J. Mol. Sci. 2024, 25, 3853. [Google Scholar] [CrossRef] [PubMed]
- Aydin, S. Three new players in energy regulation: Preptin, adropin and irisin. Peptides 2014, 56, 94–110. [Google Scholar] [CrossRef] [PubMed]
- Cowan, E.; Burch, K.J.; Green, B.D.; Grieve, D.J. Obestatin as a key regulator of metabolism and cardiovascular function with emerging therapeutic potential for diabetes. Br. J. Pharmacol. 2016, 173, 2165–2181. [Google Scholar] [CrossRef] [PubMed]
- Sengupta, P.; Dutta, S.; Karkada, I.R.; Akhigbe, R.E.; Chinni, S.V. Irisin, energy homeostasis and male reproduction. Front. Physiol. 2021, 12, 746049. [Google Scholar] [CrossRef] [PubMed]
- El-Mesallamy, H.O.; Kassem, D.H.; El-Demerdash, E.; Amin, A.I. Vaspin and visfatin/Nampt are interesting interrelated adipokines playing a role in the pathogenesis of type 2 diabetes mellitus. Metabolism 2011, 60, 63–70. [Google Scholar] [CrossRef]
- Yin, C.; Hu, W.; Wang, M.; Xiao, Y. The role of the adipocytokines vaspin and visfatin in vascular endothelial function and insulin resistance in obese children. BMC Endocr. Disord. 2019, 19, 127. [Google Scholar] [CrossRef] [PubMed]
- Yang, H.W.; Huang, Y.G.; Gai, C.L.; Chai, G.R.; Lee, S. Serum vaspin levels are positively associated with diabetic retinopathy in patients with type 2 diabetes mellitus. J. Diabetes Investig. 2021, 12, 566–573. [Google Scholar] [CrossRef]
- Ustebay, S.; Baykus, Y.; Deniz, R.; Ugur, K.; Yavuzkir, S.; Yardim, M.; Kalayci, M.; Çaglar, M.; Aydin, S. Chemerin and dermcidin in human milk and their alteration in gestational diabetes. J. Hum. Lact. 2019, 35, 550–558. [Google Scholar] [CrossRef]
- Wu, X.Y.; Song, H.B.; Wang, J.W. The association between leptin and diabetes: A meta-analysis. J. Obstet. Gynaecol. Res. 2024, 50, 1126–1131. [Google Scholar] [CrossRef]
- Chen, B.H.; Song, Y.; Ding, E.L.; Roberts, C.K.; Manson, J.E.; Rifai, N.; Buring, J.E.; Gaziano, J.M.; Liu, S. Circulating levels of resistin and risk of type 2 diabetes in men and women: Results from two prospective cohorts. Diabetes Care 2009, 32, 329–334. [Google Scholar] [CrossRef]
- Mukherji, A.B.; Idowu, V.; Zhao, L.; Leung, L.L.K.; Shen, S.; Palaniappan, L.; Morser, J. Chemerin levels in individuals with type 2 diabetes and a normal weight versus individuals with type 2 diabetes and obesity: An observational, cross-sectional study. Biomedicines 2024, 12, 983. [Google Scholar] [CrossRef] [PubMed]
- Zheng, L.Y.; Xu, X.; Wan, R.H.; Xia, S.; Lu, J.; Huang, Q. Association between serum visfatin levels and atherosclerotic plaque in patients with type 2 diabetes. Diabetol. Metab. Syndr. 2019, 11, 60. [Google Scholar] [CrossRef] [PubMed]
- Esteghamati, A.; Noshad, S.; Mousavizadeh, M.; Zandieh, A.; Nakhjavani, M. Association of vaspin with metabolic syndrome: The pivotal role of insulin resistance. Diabetes Metab. J. 2014, 38, 143–149. [Google Scholar] [CrossRef] [PubMed]
- Ali, H.H.; Al-Rawi, K.; Khalaf, Y.; Alaaraji, S.; Aldahham, B.; Awad, M.; Al-Ani, O.; Al-Ani, F.; Ali, A.T. Serum caveolin-1 level is inversely associated with serum vaspin, visfatin, and HbA1c in newly diagnosed men with type-2 diabetes. Rep. Biochem. Mol. Biol. 2022, 11, 299–309. [Google Scholar] [PubMed]
- Belalcazar, L.M.; Lang, W.; Haffner, S.M.; Schwenke, D.C.; Kriska, A.; Balasubramanyam, A.; Hoogeveen, R.C.; Pi-Sunyer, F.X.; Tracy, R.P.; Ballantyne, C.M. Look AHEAD (Action for Health in Diabetes) Research Group. Improving adiponectin levels in individuals with diabetes and obesity: Insights from look AHEAD. Diabetes Care 2015, 38, 1544–1550. [Google Scholar] [CrossRef] [PubMed]
- Mani, B.K.; Shankar, K.; Zigman, J.M. Ghrelin’s relationship to blood glucose. Endocrinology 2019, 160, 1247–1261. [Google Scholar] [CrossRef] [PubMed]
- Marrano, N.; Biondi, G.; Borrelli, A.; Cignarelli, A.; Perrini, S.; Laviola, L.; Giorgino, F.; Natalicchio, A. Irisin and incretin hormones: Similarities, differences, and implications in type 2 diabetes and obesity. Biomolecules 2021, 11, 286. [Google Scholar] [CrossRef] [PubMed]
- Qi, X.; Li, L.; Yang, G.; Liu, J.; Li, K.; Tang, Y.; Liou, H.; Boden, G. Circulating obestatin levels in normal subjects and in patients with impaired glucose regulation and type 2 diabetes mellitus. Clin. Endocrinol. 2007, 66, 593–597. [Google Scholar] [CrossRef] [PubMed]
- Celik, E.; Yilmaz, E.; Celik, O.; Ulas, M.; Turkcuoglu, I.; Karaer, A.; Simsek, Y.; Minareci, Y.; Aydin, S. Maternal and fetal adropin levels in gestational diabetes mellitus. J. Perinat. Med. 2013, 41, 375–380. [Google Scholar] [CrossRef]
- Soltani, S.; Beigrezaei, S.; Malekahmadi, M.; Clark, C.C.T.; Abdollahi, S. Circulating levels of adropin and diabetes: A systematic review and meta-analysis of observational studies. BMC Endocr. Disord. 2023, 23, 73. [Google Scholar] [CrossRef]
- Sağmak Tartar, A.; Uğur, K.; Tuncer Kara, K.; Akbulut, A.; Demirdağ, K.; Aydin, S. Association between dermcidin, salusin-α, salusin-β molecules and diabetic foot infections. Int. J. Low. Extrem. Wounds 2021, 20, 15347346211065527. [Google Scholar] [CrossRef]
- Pilarski, Ł.; Pelczyńska, M.; Koperska, A.; Seraszek-Jaros, A.; Szulińska, M.; Bogdański, P. Association of serum vaspin concentration with metabolic disorders in obese individuals. Biomolecules 2023, 13, 508. [Google Scholar] [CrossRef]
- Hetta, H.F.; Ez-Eldeen, M.E.; Mohamed, G.A.; Gaber, M.A.; ElBadre, H.M.; Ahmed, E.A.; Abdellatief, R.B.; Abd-ElBaky, R.M.; Elkady, A.; Nafee, A.M.; et al. Visfatin serum levels in obese type 2 diabetic patients: Relation to proinflammatory cytokines and insulin resistance. Egypt. J. Immunol. 2018, 25, 141–151. [Google Scholar] [PubMed]
- Werida, R.H.; El-Gharbawy, N.M.; Mostafa, T.M. Circulating IL-6, clusterin and irisin in obese subjects with different grades of obesity: Association with insulin resistance and sexual dimorphism. Arch. Endocrinol. Metab. 2021, 65, 126–136. [Google Scholar] [CrossRef]
- Yamamoto, S.; Matsushita, Y.; Nakagawa, T.; Hayashi, T.; Noda, M.; Mizoue, T. Circulating adiponectin levels and risk of type 2 diabetes in the Japanese. Nutr. Diabetes 2014, 4, e130. [Google Scholar] [CrossRef] [PubMed]
- Hedderson, M.M.; Darbinian, J.; Havel, P.J.; Quesenberry, C.P.; Sridhar, S.; Ehrlich, S.; Ferrara, A. Low prepregnancy adiponectin concentrations are associated with a marked increase in risk for development of gestational diabetes mellitus. Diabetes Care 2013, 36, 3930–3937. [Google Scholar] [CrossRef] [PubMed]
- Kamiński, M.; Mierzyński, R.; Poniedziałek-Czajkowska, E.; Sadowska, A.; Sotowski, M.; Leszczyńska-Gorzelak, B. Comparative evaluation of adipokine metrics for the diagnosis of gestational diabetes mellitus. Int. J. Mol. Sci. 2023, 25, 175. [Google Scholar] [CrossRef]
- Chu, S.H.; Lee, M.K.; Ahn, K.Y.; Im, J.A.; Park, M.S.; Lee, D.C.; Jeon, J.Y.; Lee, J.W. Chemerin and adiponectin contribute reciprocally to metabolic syndrome. PLoS ONE 2012, 7, e34710. [Google Scholar] [CrossRef] [PubMed]
- Singh, A.; Choubey, M.; Bora, P.; Krishna, A. Adiponectin and chemerin: Contrary adipokines in regulating reproduction and metabolic disorders. Reprod. Sci. 2018, 25, 1462–1473. [Google Scholar] [CrossRef]
- Sell, H.; Laurencikiene, J.; Taube, A.; Eckardt, K.; Cramer, A.; Horrighs, A.; Arner, P.; Eckel, J. Chemerin is a novel adipocyte-derived factor inducing insulin resistance in primary human skeletal muscle cells. Diabetes 2009, 58, 2731–2740. [Google Scholar] [CrossRef] [PubMed]
- Begum, M.; Choubey, M.; Tirumalasetty, M.B.; Arbee, S.; Mohib, M.M.; Wahiduzzaman, M.; Mamun, M.A.; Uddin, M.B.; Mohiuddin, M.S. Adiponectin: A promising target for the treatment of diabetes and its complications. Life 2023, 13, 2213. [Google Scholar] [CrossRef]
- Zhao, L.; Zhou, J.; Abbasi, F.; Fathzadeh, M.; Knowles, J.W.; Leung, L.L.K.; Morser, J. Chemerin in participants with or without insulin resistance and diabetes. Biomedicines 2024, 12, 924. [Google Scholar] [CrossRef] [PubMed]
- Tan, L.; Lu, X.; Danser, A.H.J.; Verdonk, K. The role of chemerin in metabolic and cardiovascular disease: A literature review of its physiology and pathology from a nutritional perspective. Nutrients 2023, 15, 2878. [Google Scholar] [CrossRef]
- Kurowska, P.; Mlyczyńska, E.; Dawid, M.; Jurek, M.; Klimczyk, D.; Dupont, J.; Rak, A. Review: Vaspin (SERPINA12) expression and function in endocrine cells. Cells 2021, 10, 1710. [Google Scholar] [CrossRef] [PubMed]
- Badillo-Suárez, P.A.; Rodríguez-Cruz, M.; Nieves-Morales, X. Impact of metabolic hormones secreted in human breast milk on nutritional programming in childhood obesity. J. Mammary Gland. Biol. Neoplasia 2017, 22, 171–191. [Google Scholar] [CrossRef] [PubMed]
- Gridneva, Z.; Kugananthan, S.; Rea, A.; Lai, C.T.; Ward, L.C.; Murray, K.; Hartmann, P.E.; Geddes, D.T. Human milk adiponectin and leptin and infant body composition over the first 12 months of lactation. Nutrients 2018, 10, 1125. [Google Scholar] [CrossRef]
- Eliana, U.D.; Fly, A.D. The function and alteration of immunological properties in human milk of obese mothers. Nutrients 2019, 11, 1284. [Google Scholar] [CrossRef] [PubMed]
- Suwaydi, M.A.; Zhou, X.; Perrella, S.L.; Wlodek, M.E.; Lai, C.T.; Gridneva, Z.; Geddes, D.T. The impact of gestational diabetes mellitus on human milk metabolic hormones: A systematic review. Nutrients 2022, 14, 3620. [Google Scholar] [CrossRef] [PubMed]
- Tekin Guler, T.; Koc, N.; Kara Uzun, A.; Fisunoglu, M. The association of pre-pregnancy BMI on leptin, ghrelin, adiponectin and insulin-like growth factor-1 in breast milk: A case-control study. Br. J. Nutr. 2022, 127, 1675–1681. [Google Scholar] [CrossRef]
- Lis-Kuberka, J.; Pupek, M.; Orczyk-Pawiłowicz, M. The mother-child dyad adipokine pattern: A review of current knowledge. Nutrients 2023, 15, 4059. [Google Scholar] [CrossRef] [PubMed]
- Moyce Gruber, B.L.; Dolinsky, V.W. The Role of adiponectin during pregnancy and gestational diabetes. Life 2023, 13, 301. [Google Scholar] [CrossRef] [PubMed]
- Gunderson, E.P.; Greenspan, L.C.; Faith, M.S.; Hurston, S.R.; Quesenberry, C.P., Jr.; Investigators, S.O.S. Breastfeeding and growth during infancy among offspring of mothers with gestational diabetes mellitus: A prospective cohort study. Pediatr. Obes. 2018, 13, 492–504. [Google Scholar] [CrossRef] [PubMed]
- Ortega-Garcia, J.A.; Kloosterman, N.; Alvarez, L.; Tobarra-Sanchez, E.; Carceles-Alvarez, A.; Pastor-Valero, R.; Lopez-Hernandez, F.A.; Sanchez-Solis, M.; Claudio, L. Full Breastfeeding and Obesity in Children: A Prospective Study from Birth to 6 Years. Child. Obes. 2018, 14, 327–337. [Google Scholar] [CrossRef]
- Barbagallo, F.; Cannarella, R.; Garofalo, V.; Marino, M.; La Vignera, S.; Condorelli, R.A.; Tiranini, L.; Nappi, R.E.; Calogero, A.E. The role of irisin throughout women’s life Span. Biomedicines 2023, 11, 3260. [Google Scholar] [CrossRef]
- Mól, N.; Zasada, M.; Tomasik, P.; Klimasz, K.; Kwinta, P. Evaluation of irisin and visfatin levels in very low birth weight preterm newborns compared to full term newborns-a prospective cohort study. PLoS ONE 2018, 13, e0204835. [Google Scholar] [CrossRef] [PubMed]
- Huo, Y.; Liu, S.X.; Song, G.Y.; Ren, L.P.; Wang, C.; Zhang, D.H. Plasma levels and placental expression of vaspin in pregnant women with diabetes mellitus. Braz. J. Med. Biol. Res. 2015, 48, 273–279. [Google Scholar] [CrossRef] [PubMed]
- Hernández-Rodríguez, C.E.; Estrada Zúñiga, C.M.; De la O-Cavazos, M.E.; Montes-Tapia, F.F.; Gerez-Martínez, P.; Lavalle-González, F.J.; Treviño Garza, C. Vaspin, a compensatory mechanism against high glucose levels since birth? J. Clin. Res. Pediatr. Endocrinol. 2019, 11, 125–131. [Google Scholar] [CrossRef] [PubMed]
- Yuksel, M.A.; Oncul, M.; Tuten, A.; Imamoglu, M.; Acikgoz, A.S.; Kucur, M.; Madazli, R. Maternal serum and fetal cord blood irisin levels in gestational diabetes mellitus. Diabetes Res. Clin. Pract. 2014, 104, 171–175. [Google Scholar] [CrossRef] [PubMed]
- Wawrusiewicz-Kurylonek, N.; Telejko, B.; Kuzmicki, M.; Sobota, A.; Lipinska, D.; Pliszka, J.; Raczkowska, B.; Kuc, P.; Urban, R.; Szamatowicz, J.; et al. Increased maternal and cord blood betatrophin in gestational diabetes. PLoS ONE 2015, 10, e0131171. [Google Scholar] [CrossRef]
- Ersahin, S.S.; Yurci, A. Cord blood and maternal serum preptin and irisin concentrations are regulated independently in GDM. Eur. Rev. Med. Pharmacol. Sci. 2021, 25, 1954–1958. [Google Scholar] [PubMed]
- Aydin, S.; Kuloglu, T.; Aydin, S. Copeptin, adropin and irisin concentrations in breast milk and plasma of healthy women and those with gestational diabetes mellitus. Peptides 2013, 47, 66–70. [Google Scholar] [CrossRef] [PubMed]
- Fatima, S.S.; Khalid, E.; Ladak, A.A.; Ali, S.A. Colostrum and mature breast milk analysis of serum irisin and sterol regulatory element-binding proteins-1c in gestational diabetes mellitus. J. Matern. Fetal Neonatal Med. 2019, 32, 2993–2999. [Google Scholar] [CrossRef]
- Löffler, D.; Müller, U.; Scheuermann, K.; Friebe, D.; Gesing, J.; Bielitz, J.; Erbs, S.; Landgraf, K.; Wagner, I.V.; Kiess, W.; et al. Serum irisin levels are regulated by acute strenuous exercise. J. Clin. Endocrinol. Metab. 2015, 100, 1289–1299. [Google Scholar] [CrossRef] [PubMed]
- Elizondo-Montemayor, L.; Mendoza-Lara, G.; Gutierrez-DelBosque, G.; Peschard-Franco, M.; Nieblas, B.; Garcia-Rivas, G. Relationship of circulating irisin with body composition, physical activity, and cardiovascular and metabolic disorders in the pediatric population. Int. J. Mol. Sci. 2018, 19, 3727. [Google Scholar] [CrossRef] [PubMed]
- Esin, K.; Batirel, S.; Ülfer, G.; Yigit, P.; Sanlier, N. Association of serum irisin levels with body composition, metabolic profile, leptin, and adiponectin levels in lean and obese children. Medicina 2023, 59, 1954. [Google Scholar] [CrossRef]
- Shan, D.; Liu, X.; Cai, Y.; Qiao, X.; Xu, L.; Zou, L. Irisin level and neonatal birthweight: A systematic review and meta-analysis. Eur. J. Obstet. Gynecol. Reprod. Biol. 2020, 254, 25–32. [Google Scholar] [CrossRef] [PubMed]
- Hernandez-Trejo, M.; Garcia-Rivas, G.; Torres-Quintanilla, A.; Laresgoiti-Servitje, E. Relationship between irisin concentration and serum cytokines in mother and newborn. PLoS ONE 2016, 11, e0165229. [Google Scholar] [CrossRef]
- Khorasani, Z.M.; Besharat, M.; Mehrad-Majd, H.; Mohammadi, S.A.; Mahmoudinia, M. Comparison irisin peptide serum level in pregnant women with and without gestational diabetes mellitus: A case-control study. Endocrinol. Diabetes Metab. 2022, 5, e370. [Google Scholar] [CrossRef]
- Jia, J.; Yu, F.; Wei, W.P.; Yang, P.; Zhang, R.; Sheng, Y.; Shi, Y.Q. Relationship between circulating irisin levels and overweight/obesity: A meta-analysis. World J. Clin. Cases 2019, 7, 1444–1455. [Google Scholar] [CrossRef] [PubMed]
- Dimova, R.; Tankova, T. The role of vaspin in the development of metabolic and glucose tolerance disorders and atherosclerosis. Biomed. Res. Int. 2015, 2015, 823481. [Google Scholar] [CrossRef] [PubMed]
- Youn, B.S.; Kloting, N.; Kratzsch, J.; Lee, N.; Park, J.W.; Song, E.S.; Ruschke, K.; Oberbach, A.; Fasshauer, M.; Stumvoll, M.; et al. Serum vaspin concentrations in human obesity and type 2 diabetes. Diabetes 2008, 57, 372–377. [Google Scholar] [CrossRef]
- Stepan, H.; Kralisch, S.; Klostermann, K.; Schrey, S.; Reisenbüchler, C.; Verlohren, M.; Verlohren, H.J.; Drynda, K.; Blüher, M.; Stumvoll, M.; et al. Preliminary report: Circulating levels of the adipokine vaspin in gestational diabetes mellitus and preeclampsia. Metabolism 2010, 59, 1054–1056. [Google Scholar] [CrossRef]
- Gkiomisi, A.; Makedou, K.G.; Anastasilakis, A.D.; Polyzos, S.A.; Kourtis, A.; Gerou, S.; Gavana, E.; Dagklis, T.; Rousso, D.; Giannoulis, C. Serum vaspin levels in women with and without gestational diabetes mellitus during pregnancy and postpartum. Cytokine 2013, 61, 127–132. [Google Scholar] [CrossRef]
- Xu, X.; Wen, J.; Lu, Y.; Ji, H.; Zhuang, J.; Su, Y.; Liu, B.; Li, H.; Xu, Y. Impact of age on plasma vaspin concentration in a group of normal Chinese people. J. Endocrinol. Investig. 2017, 40, 143–151. [Google Scholar] [CrossRef] [PubMed]
- Villarreal, D.; Pradhan, G.; Zhou, Y.; Xue, B.; Sun, Y. Diverse and complementary effects of ghrelin and obestatin. Biomolecules 2022, 12, 517. [Google Scholar] [CrossRef] [PubMed]
- Baykus, Y.; Gurates, B.; Aydin, S.; Celik, H.; Kavak, B.; Aksoy, A.; Sahin, I.; Deniz, R.; Gungor, S.; Guzel, S.P.; et al. Changes in serum obestatin, preptin and ghrelins in patients with gestational diabetes mellitus. Clin. Biochem. 2012, 45, 198–202. [Google Scholar] [CrossRef] [PubMed]
- Zhang, J.V.; Ren, P.G.; Avsian-Kretchmer, O.; Luo, C.W.; Rauch, R.; Klein, C.; Hsueh, A.J. Obestatin, a peptide encoded by the ghrelin gene, opposes ghrelin’s effects on food intake. Science 2005, 310, 996–999. [Google Scholar] [CrossRef]
- Allwsh, T.A.; Mohamed, J.A. Clinical Study of Obestatin Hormone and its Relation to Diabetes Mellitus. Raf. J. Sci. 2013, 4, 74–87. [Google Scholar] [CrossRef]
- Aydin, S.; Ozkan, Y.; Erman, F.; Gurates, B.; Kilic, N.; Colak, R.; Gundogan, T.; Catak, Z.; Bozkurt, M.; Akin, O.; et al. Presence of obestatin in breast milk: Relationship among obestatin, ghrelin, and leptin in lactating women. Nutrition 2008, 24, 689–693. [Google Scholar] [CrossRef] [PubMed]
- Kapica, M.; Puzio, I.; Kato, I.; Kuwahara, A.; Zabielski, R.; Antushevich, H. Exogenous obestatin affects pancreatic enzyme secretion in rat through two opposite mechanisms, direct inhibition and vagally-mediated stimulation. J. Anim. Feed Sci. 2018, 27, 155–162. [Google Scholar] [CrossRef]
- Slupecka-Ziemilska, M.; Wolinski, J.; Herman, A.P.; Romanowicz, K.; Dziegielewska, Z.; Borszewska-Kornacka, M.K. Influence of preterm delivery on ghrelin and obestatin concentrations in maternal plasm, milk and their expression in mammary epithelial cells. J. Physiol. Pharmacol. 2017, 68, 693–698. [Google Scholar]
- Dembinski, A.; Warzecha, Z.; Ceranowicz, P.; Cieszkowski, J.; Dembinski, M.; Ptak-Belowska, A.; Kuwahara, A.; Kato, I. Administration of obestatin accelerates the healing of chronic gastric ulcers in rats. Med. Sci. Monit. 2011, 17, BR196–BR200. [Google Scholar] [CrossRef] [PubMed]
- Konarska, K.; Cieszkowski, J.; Warzecha, Z.; Ceranowicz, P.; Chmura, A.; Kusnierz-Cabala, B.; Galazka, K.; Kowalczyk, P.; Miskiewicz, A.; Konturek, T.J.; et al. Treatment with obestatin-a Ghrelin gene-encoded peptide-reduces the severity of experimental colitis evoked by trinitrobenzene sulfonic acid. Int. J. Mol. Sci. 2018, 19, 1643. [Google Scholar] [CrossRef]
- Korkut, S.; Özdemir, A.; Yay, A.H.; Yalçın, B.; Ceylan, M.; Korkmaz, L.; Yazıcı, C.; Güntürk, İ.; Kurtoğlu, S. Obestatin reduces intestinal damage in experimental necrotizing enterocolitis in newborn Rats. Am. J. Perinatol. 2019, 36, 1179–1187. [Google Scholar] [CrossRef] [PubMed]
- Ganesh Kumar, K.; Zhang, J.; Gao, S.; Rossi, J.; McGuinness, O.P.; Halem, H.H.; Culler, M.D.; Mynatt, R.L.; Butler, A.A. Adropin deficiency is associated with increased adiposity and insulin resistance. Obesity 2012, 20, 1394–1402. [Google Scholar] [CrossRef] [PubMed]
- Thapa, D.; Xie, B.; Manning, J.R.; Zhang, M.; Stoner, M.W.; Huckestein, B.R.; Edmunds, L.R.; Zhang, X.; Dedousis, N.L.; O’Doherty, R.M.; et al. Adropin reduces blood glucose levels in mice by limiting hepatic glucose production. Physiol. Rep. 2019, 7, e14043. [Google Scholar] [CrossRef] [PubMed]
- Adamczak, L.; Gutaj, P.; Wender-Ozegowska, E. Adropin in pregnancy complicated by hyperglycemia and obesity—A preliminary study. Ginekol. Pol. 2023, 94, 229–232. [Google Scholar] [CrossRef]
- Vivek, K.; Reddy, E.P.; Thangappazham, B.; Raj, H.; Pérez-López, F.R.; Varikasuvu, S.R. Maternal adropin levels in patients with gestational diabetes mellitus: A systematic review and meta-analysis. Gynecol. Endocrinol. 2022, 38, 105–109. [Google Scholar] [CrossRef] [PubMed]
- Beigi, A.; Shirzad, N.; Nikpour, F.; Nasli Esfahani, E.; Emamgholipour, S.; Bandarian, F. Association between serum adropin levels and gestational diabetes mellitus; a case-control study. Gynecol. Endocrinol. 2015, 31, 939–941. [Google Scholar] [CrossRef]
- Kumar, K.G.; Trevaskis, J.L.; Lam, D.D.; Sutton, G.M.; Koza, R.A.; Chouljenko, V.N.; Kousoulas, K.G.; Rogers, P.M.; Kesterson, R.A.; Thearle, M.; et al. Identification of adropin as a secreted factor linking dietary macronutrient intake with energy homeostasis and lipid metabolism. Cell Metab. 2008, 8, 468–481. [Google Scholar] [CrossRef] [PubMed]
- Ali, I.I.; D’Souza, C.; Singh, J.; Adeghate, E. Adropin’s Role in Energy Homeostasis and Metabolic Disorders. Int. J. Mol. Sci. 2022, 23, 8318. [Google Scholar] [CrossRef]
- Zhang, H.; Chen, N. Adropin as an indicator of T2DM and its complications. Food Sci. Hum. Wellness 2022, 11, 1455–1463. [Google Scholar] [CrossRef]
- Semwal, D.K.; Semwal, R.B.; Combrinck, S.; Viljoen, A. Myricetin: A dietary molecule with diverse biological activities. Nutrients 2016, 8, 90. [Google Scholar] [CrossRef] [PubMed]
- Chao HCTsai, P.F.; Lee, S.C.; Lin, Y.S.; Wu, M.C. Effects of myricetin-containing ethanol solution on high-fat diet induced obese rats. J. Food Sci. 2017, 82, 1947–1952. [Google Scholar] [CrossRef]
- Butler, A.A.; St-Onge, M.P.; Siebert, E.A.; Medici, V.; Stanhope, K.L.; Havel, P.J. Differential responses of plasma adropin concentrations to dietary glucose or fructose consumption in humans. Sci. Rep. 2015, 5, 14691. [Google Scholar] [CrossRef] [PubMed]
- Zarrati, M.; Raji Lahiji, M.; Salehi, E.; Yazdani, B.; Razmpoosh, E.; Shokouhi Shoormasti, R.; Shidfar, F. Effects of probiotic yogurt on serum omentin-1, adropin, and nesfatin-1 concentrations in overweight and obese participants under low-calorie diet. Probiotics Antimicrob. Proteins 2019, 11, 1202–1209. [Google Scholar] [CrossRef] [PubMed]
- Bienertová-Vašků, J.; Bienert, P.; Zlámal, F.; Tomandl, J.; Tomandlová, M.; Dostálová, Z.; Vašků, A. Visfatin is secreted into the breast milk and is correlated with weight changes of the infant after the birth. Diabetes Res. Clin. Pract. 2012, 96, 355–361. [Google Scholar] [CrossRef] [PubMed]
- Visfatin and Omentin-1—Markers of Nutritional Status of Newborns Born to Diabetic Mothers. Available online: https://clinicaltrials.gov/ (accessed on 9 December 2024).
- Gutaj, P.; Sibiak, R.; Jankowski, M.; Awdi, K.; Bryl, R.; Mozdziak, P.; Kempisty, B.; Wender-Ozegowska, E. The Role of the Adipokines in the Most Common Gestational Complications. Int. J. Mol. Sci. 2020, 21, 9408. [Google Scholar] [CrossRef] [PubMed]
- Fatima, S.S.; Rehman, R.; Muhammad, J.S.; Martins, R.; Mohammed, N.; Khan, U. Association of chemerin gene promoter methylation in maternal blood and breast milk during gestational diabetes. J. Dev. Orig. Health Dis. 2022, 13, 108–114. [Google Scholar] [CrossRef] [PubMed]
- Che, D.; Jia, T.; Zhang, X.; Zhang, L.; Du, X.; Zheng, Y.; Zhou, T.; Song, X.; Geng, S. Dermcidin-derived polypeptides: DCD(86–103) induced inflammatory reaction in the skin by activation of mast cells via ST2. Immunol. Lett. 2022, 251–252, 29–37. [Google Scholar] [CrossRef] [PubMed]
- Peila, C.; Gazzolo, D.; Bertino, E.; Cresi, F.; Coscia, A. Influence of diabetes during pregnancy on human milk composition. Nutrients 2020, 12, 185. [Google Scholar] [CrossRef]
- Burian, M.; Schittek, B. The secrets of dermcidin action. Int. J. Med. Microbiol. 2015, 305, 283–286. [Google Scholar] [CrossRef] [PubMed]
- Taylor, E.B. The complex role of adipokines in obesity, inflammation, and autoimmunity. Clin. Sci. 2021, 135, 731–752. [Google Scholar] [CrossRef]
- Putera, B.W.; Sartika, C.R.; Wijaya, A. The dynamic roles of visfatin and obestatin serum concentration in pancreatic beta cells dysfunction (HOMA-beta) and insulin resistance (HOMA-IR) in centrally obese men. Indones. Biomed. J. 2012, 4, 43–49. [Google Scholar] [CrossRef]
- Jara, A.; Dreher, M.; Porter, K.; Christian, L.M. The association of maternal obesity and race with serum adipokines in pregnancy and postpartum: Implications for gestational weight gain and infant birth weight. Brain Behav. Immun. Health 2020, 3, 100053. [Google Scholar] [CrossRef] [PubMed]
- Ruiz, L.; Espinosa-Martos, I.; García-Carral, C.; Manzano, S.; McGuire, M.K.; Meehan, C.L.; McGuire, M.A.; Williams, J.E.; Foster, J.; Sellen, D.W.; et al. What’s normal? Immune profiling of human milk from healthy women living in different geographical and socioeconomic settings. Front. Immunol. 2017, 8, 696. [Google Scholar] [CrossRef]
- Saeidi, A.; Haghighi, M.M.; Kolahdouzi, S.; Daraei, A.; Abderrahmane, A.B.; Essop, M.F.; Laher, I.; Hackney, A.C.; Zouhal, H. The effects of physical activity on adipokines in individuals with overweight/obesity across the lifespan: A narrative review. Obes. Rev. 2021, 22, e13090. [Google Scholar] [CrossRef] [PubMed]
- Babaei, P.; Hoseini, R. Exercise training modulates adipokine dysregulations in metabolic syndrome. Sports Med. Health Sci. 2022, 4, 18–28. [Google Scholar] [CrossRef]
- Bendinelli, B.; Masala, G.; Bella, C.D.; Assedi, M.; Benagiano, M.; Pratesi, S.; Ermini, I.; Occhini, D.; Castaldo, M.; Saieva, C.; et al. Adipocytokine plasma level changes in a 24-month dietary and physical activity randomised intervention trial in postmenopausal women. Eur. J. Nutr. 2023, 62, 1185–1194. [Google Scholar] [CrossRef]
- Expert Committee on the Diagnosis and Classification of Diabetes Mellitus. Report of the expert committee on the diagnosis and classification of diabetes mellitus. Diabetes Care 2003, 1, S5–S20. [Google Scholar]
- Wender-Ożegowska, E.; Bomba-Opoń, D.; Brązert, J.; Celewicz, Z.; Czajkowski, K.; Gutaj, P.; Malinowska-Polubiec, A.; Zawiejska, A.; Wielgoś, M. Standards of Polish Society of Gynecologists and Obstetricians in management of women with diabetes. Ginekol. Pol. 2018, 89, 341–350. [Google Scholar] [CrossRef] [PubMed]
- Araszkiewicz, A.; Bandurska-Stankiewicz, E.; Budzyński, A.; Cypryk, K.; Czech, A.; Czupryniak, L.; Józef, D.; Grzegorz, D.; Tomasz, D.; Edward, F.; et al. Guidelines on the management of diabetic patients. A position of Diabetes Poland. Clin. Diabetol. 2020, 9, 1. [Google Scholar]
- Lis-Kuberka, J.; Berghausen-Mazur, M.; Orczyk-Pawiłowicz, M. Lactoferrin and immunoglobulin concentrations in milk of gestational diabetic mothers. Nutrients 2021, 13, 818. [Google Scholar] [CrossRef] [PubMed]
- Woo, J.G.; Guerrero, M.L.; Altaye, M.; Ruiz-Palacios, G.M.; Martin, L.J.; Dubert-Ferrandon, A.; Newburg, D.S.; Morrow, A.L. Human milk adiponectin is associated with infant growth in two independent cohorts. Breastfeed. Med. 2009, 4, 101–109. [Google Scholar] [CrossRef] [PubMed]
- Kratzsch, J.; Bae, Y.J.; Kiess, W. Adipokines in human breast milk. Best. Pract. Res. Clin. Endocrinol. Metab. 2018, 32, 27–38. [Google Scholar] [CrossRef]

| Overall N = 60 % (n/N) | GDM-G1 N = 17 % (n/N) | GDM-G2 N = 17 % (n/N) | Non-GDM N = 26 % (n/N) | Chi-Square Test χ2 | p-Value | |
|---|---|---|---|---|---|---|
Race/ethnicity
| 100% (60/60) | 100% (17/17) | 100% (17/17) | 100% (26/26) | - | - |
Day of lactation (mean ± SD)
| 2.95 ± 1.76 65.00% (39/60) 35.00% (21/60) | 3.41 ± 1.94 58.82% (10/17) 41.18% (7/17) | 2.88 ± 1.53 70.59% (12/17) 29.41% (5/17) | 2.69 ± 1.78 65.38% (17/26) 34.62% (9/26) | 0.52 | 0.77 |
Maternal age (mean ± SD)
| 33.00 ± 4.81 25.00% (15/60) 36.67% (22/60) 33.33% (20/60) 5.00% (3/60) | 33.00 ± 4.69 35.29% (6/17) 35.29% (6/17) 23.53% (4/17) 5.88% (1/17) | 34.12 ± 5.35 17.65% (3/17) 29.41% (5/17) 47.06% (8/17) 5.88% (1/17) | 32.27 ± 4.57 23.08% (6/26) 42.31% (11/26) 30.77% (8/26) 3.85% (1/26) | 3.23 | 0.78 |
Maternal pre-pregnancy BMI, kg/m2 (mean ± SD)
| 23.99 ± 4.81 3.33% (2/60) 65.00% (39/60) 16.67% (10/60) 11.67% (7/60) 3.33% (2/60) | 22.99 ± 4.16 5.88% (1/17) 64.71% (11/17) 23.53% (4/17) 5.88% (1/17) 0.00% (0/17) | 27.18 ± 5.79 0.00% (0/17) 41.18% (7/17) 29.41% (5/17) 17.65% (3/17) 11.76% (2/17) | 22.55 ± 3.51 3.85% (1/26) 80.77% (21/26) 3.85% (1/26) 11.54% (3/26) 0.00% (0/26) | 14.17 | 0.08 |
Gestational age (mean ± SD)
| 38.68 ± 1.33 21.67% (13/60) 78.33% (47/60) | 38.77 ± 1.35 23.53% (4/17) 76.47% (13/17) | 38.12 ± 1.11 29.41% (5/17) 70.59% (12/17) | 39.00 ± 1.38 15.38% (4/26) 84.62% (22/26) | 1.24 | 0.54 |
Delivery mode
| 26.67% (16/60) 73.33% (44/60) | 23.53% (4/17) 76.47% (13/17) | 29.41% (5/17) 70.59% (12/17) | 26.92% (7/26) 73.08% (19/26) | 0.15 | 0.93 |
Birth weight (g) (mean ± SD)
| 3267.08 ± 547.12 100% (60/60) | 3238.82 ± 587.37 100% (17/17) | 3187.94 ± 484.11 100% (17/17) | 3337.31 ± 571.26 100% (26/26) | - | - |
Apgar score [5 min]
| 9.64 ± 0.79 1.67% (1/60) 1.67% (1/60) 5.00% (3/60) 10.00% (6/60) 81.67% (49/60) | 9.35 ± 1.22 5.88% (1/17) 5.88% (1/17) 5.88% (1/17) 11.76% (2/17) 70.59% (12/17) | 9.82 ± 0.53 0.00% (0/17) 0.00% (0/17) 5.88% (1/17) 5.88% (1/17) 88.24% (15/17) | 9.81 ± 0.49 0.00% (0/17) 0.00% (0/17) 3.85% (1/26) 11.54% (3/26) 84.62% (22/26) | 5.96 | 0.65 |
Newborn’s gender
| 43.33% (26/60) 50.00% (30/60) 6.67% (4/60) | 58.82% (10/17) 35.29% (6/17) 5.88% (1/17) | 52.94% (9/17) 47.06% (8/17) 0.00% (0/17) | 26.92% (7/26) 61.54% (16/26) 11.54% (3/26) | 6.45 | 0.17 |
| Colostral Hormones | Group | * p-Value | ||||||
|---|---|---|---|---|---|---|---|---|
| GDM N = 34 | GDM-G1 N= 17 | GDM-G2 N = 17 | Non-GDM N = 26 | GDM vs. Non-GDM | G1 vs. Non-GDM | G2 vs. Non-GDM | G1 vs. G2 | |
| Irisin [µg/mL] | 22.51 ± 11.42 19.87 (14.80–26.95) | 18.11 ± 5.48 17.59 (14.80–22.77) | 26.90 ± 14.07 26.95 (15.44–36.99) | 21.16 ± 13.39 18.53 (8.82–33.44) | 0.53 | 0.78 | 0.18 | 0.04 |
| Adropin [ng/mL] | 0.66 ± 0.71 0.49 (0.05–0.92) | 0.80 ± 0.83 0.70 (0.06–1.05) | 0.52 ± 0.55 0.42 (0.05–0.88) | 0.48 ± 0.52 0.34 (0.04–0.91) | 0.30 | 0.18 | 0.67 | 0.31 |
| Obestatin [ng/mL] | 0.31 ± 0.23 0.28 (0.13–0.39) | 0.22 ± 0.16 0.14 (0.12–0.37) | 0.39 ± 0.25 0.36 (0.20–0.54) | 0.29 ± 0.16 0.30 (0.14–0.38) | 0.94 | 0.22 | 0.30 | 0.05 |
| Visfatin [ng/mL] | 1.38 ± 0.47 1.38 (1.04–1.73) | 1.52 ± 0.47 1.65 (1.15–1.90) | 1.25 ± 0.45 1.19 (0.89–1.62) | 1.45 ± 0.47 1.30 (1.14–1.69) | 0.62 | 0.65 | 0.20 | 0.08 |
| Vaspin [ng/mL] | 4.92 ± 3.07 4.69 (2.69–5.58) | 3.98 ± 1.76 4.11 (2.23–5.42) | 5.80 ± 3.77 4.77 (3.09–7.21) | 3.35 ± 1.67 3.12 (2.22 -4.41) | 0.06 | 0.29 | 0.04 | 0.31 |
| Chemerin [ng/mL] | 1.23 ± 0.84 0.90 (0.54–1.67) | 1.14 ± 0.97 0.57 (0.47–2.14) | 1.33 ± 0.69 1.10 (0.87–1.67) | 1.32 ± 0.93 1.26 (0.62–1.91) | 0.88 | 0.53 | 0.71 | 0.21 |
| Dermcidin [ng/mL] | 134.49 ± 42.28 136.55 (104.58–165.36) | 130.87 ± 39.92 134.51 (104.58–159.64) | 138.11 ± 45.45 138.58 (105.22–182.55) | 124.03 ± 41.88 124.70 (96.56–156.09) | 0.39 | 0.57 | 0.38 | 0.66 |
| Irisin [µg/mL] | |||
|---|---|---|---|
| GDM-G1 | GDM-G2 | non-GDM | |
| Day of lactation | −0.27 | 0.59 | 0.03 |
| Maternal age [years] | −0.20 | 0.26 | −0.04 |
| BMI [kg/m2] | −0.10 | 0.26 | 0.45 |
| HBD [week] | 0.23 | 0.05 | 0.16 |
| Birth weight [g] | −0.08 | −0.07 | 0.40 |
| Chemerin [ng/mL] | 0.34 | 0.03 | 0.17 |
| Irisin [µg/mL] | - | - | - |
| Visfatin [ng/mL] | −0.33 | 0.44 | 0.20 |
| Vaspin [ng/mL] | 0.42 | 0.20 | 0.11 |
| Dermcidin [ng/mL] | 0.17 | −0.51 | −0.53 |
| Obestatin [ng/mL] | −0.04 | −0.23 | 0.32 |
| Adropin [ng/mL] | 0.17 | 0.01 | 0.04 |
| Colostral Adipokines | Pre-Pregnancy BMI [kg/m2] | Age [Years] | GDM (Ref. Non-GDM) | ||||||
|---|---|---|---|---|---|---|---|---|---|
| β | 95% CI | p-Value | β | 95% CI | p-Value | OR | 95% CI | p-Value | |
| Chemerin [ng/mL] | −0.13 | −0.46–0.20 | 0.42 | −0.12 | −0.43–0.19 | 0.43 | 0.99 | 0.44–2.23 | 0.98 |
| Irisin (µg/mL) | 0.40 | 0.04–0.76 | 0.03 | −0.12 | −0.46–0.21 | 0.46 | 1.01 | 0.95–1.07 | 0.78 |
| Visfatin (ng/mL) | −0.29 | −0.70 to 0.12 | 0.16 | −0.14 | −0.53–0.24 | 0.45 | 1.00 | 1.00–1.001 | 0.50 |
| Vaspin (ng/mL) | 0.22 | −0.11–0.54 | 0.19 | 0.55 | 0.25–0.86 | 0.0008 | 1.32 | 0.93–1.87 | 0.12 |
| Dermcidin (ng/mL) | −0.07 | −0.47–0.33 | 0.72 | −0.04 | −0.41–0.34 | 0.85 | 1.02 | 0.99–1.04 | 0.19 |
| Obestatin (ng/mL) | −0.12 | −0.47–0.23 | 0.49 | 0.16 | −0.17–0.49 | 0.34 | 1.00 | 1.00–1.01 | 0.50 |
| Adropin (ng/mL) | 0.11 | −0.20–0.43 | 0.46 | −0.07 | −0.37–0.22 | 0.62 | 1.00 | 1.00–1.01 | 0.16 |
| Colostral Adipokines | Obstetrical Factors | Neonatal Factors | ||||||||||
|---|---|---|---|---|---|---|---|---|---|---|---|---|
| Gestational Age (weeks) | Delivery Mode (Ref. Cesarean Section) | Birth Weight [g] | Apgar Score (5 min) | |||||||||
| β | 95% CI | p-Value | OR | 95% CI | p-Value | β | 95% CI | p-Value | β | 95% CI | p-Value | |
| Chemerin [ng/mL] | 0.14 | −0.21–0.49 | 0.41 | 1.56 | 0.57–4.28 | 0.39 | 0.16 | −0.18–0.51 | 0.35 | 0.06 | −0.29–0.42 | 0.72 |
| Irisin (µg/mL) | 0.24 | −0.14–0.62 | 0.21 | 1.00 | 0.94–1.08 | 0.91 | 0.20 | −0.18–0.57 | 0.29 | 0.21 | −0.18–0.59 | 0.28 |
| Visfatin (pg/mL) | 0.25 | −0.19–0.69 | 0.25 | 1.00 | 1.00–1.01 | 0.76 | 0.35 | −0.08–0.78 | 0.11 | −0.07 | −0.51–0.37 | 0.75 |
| Vaspin (ng/mL) | −0.15 | −0.50–0.20 | 0.38 | 1.60 | 0.95–2.68 | 0.08 | −0.04 | −0.38–0.30 | 0.81 | −0.01 | −0.36–0.34 | 0.96 |
| Dermcidin (ng/mL) | 0.45 | 0.02–0.88 | 0.04 | 1.00 | 0.97–1.03 | 0.99 | 0.41 | −0.01–0.83 | 0.06 | 0.02 | −0.41–0.46 | 0.91 |
| Obestatin (ng/mL) | −0.05 | −0.42–0.33 | 0.80 | 1.00 | 1.00–1.01 | 0.43 | 0.17 | −0.20–0.54 | 0.36 | 0.19 | −0.19–0.57 | 0.31 |
| Adropin (ng/mL) | 0.01 | −0.32–0.35 | 0.94 | 1.00 | 1.00–1.01 | 0.28 | −0.09 | −0.42–0.24 | 0.57 | 0.14 | −0.19–0.48 | 0.39 |
Disclaimer/Publisher’s Note: The statements, opinions and data contained in all publications are solely those of the individual author(s) and contributor(s) and not of MDPI and/or the editor(s). MDPI and/or the editor(s) disclaim responsibility for any injury to people or property resulting from any ideas, methods, instructions or products referred to in the content. |
© 2024 by the authors. Licensee MDPI, Basel, Switzerland. This article is an open access article distributed under the terms and conditions of the Creative Commons Attribution (CC BY) license (https://creativecommons.org/licenses/by/4.0/).
Share and Cite
Lis-Kuberka, J.; Berghausen-Mazur, M.; Orczyk-Pawiłowicz, M. Evaluation of Selected Pro- and Anti-Inflammatory Adipokines in Colostrum from Mothers with Gestational Diabetes Mellitus. Int. J. Mol. Sci. 2025, 26, 40. https://doi.org/10.3390/ijms26010040
Lis-Kuberka J, Berghausen-Mazur M, Orczyk-Pawiłowicz M. Evaluation of Selected Pro- and Anti-Inflammatory Adipokines in Colostrum from Mothers with Gestational Diabetes Mellitus. International Journal of Molecular Sciences. 2025; 26(1):40. https://doi.org/10.3390/ijms26010040
Chicago/Turabian StyleLis-Kuberka, Jolanta, Marta Berghausen-Mazur, and Magdalena Orczyk-Pawiłowicz. 2025. "Evaluation of Selected Pro- and Anti-Inflammatory Adipokines in Colostrum from Mothers with Gestational Diabetes Mellitus" International Journal of Molecular Sciences 26, no. 1: 40. https://doi.org/10.3390/ijms26010040
APA StyleLis-Kuberka, J., Berghausen-Mazur, M., & Orczyk-Pawiłowicz, M. (2025). Evaluation of Selected Pro- and Anti-Inflammatory Adipokines in Colostrum from Mothers with Gestational Diabetes Mellitus. International Journal of Molecular Sciences, 26(1), 40. https://doi.org/10.3390/ijms26010040