

Plasma GlycA, a Glycoprotein Marker of Chronic Inflammation, and All-Cause Mortality in Cirrhotic Patients and Liver Transplant Recipients

 , , ,
, , ,  ,
,  , , , and
Abstract
1. Introduction
2. Results
2.1. Comparison of Baseline Clinical Characteristics Between Patients with Cirrhosis, Liver Transplant Recipients, and PREVEND Participants
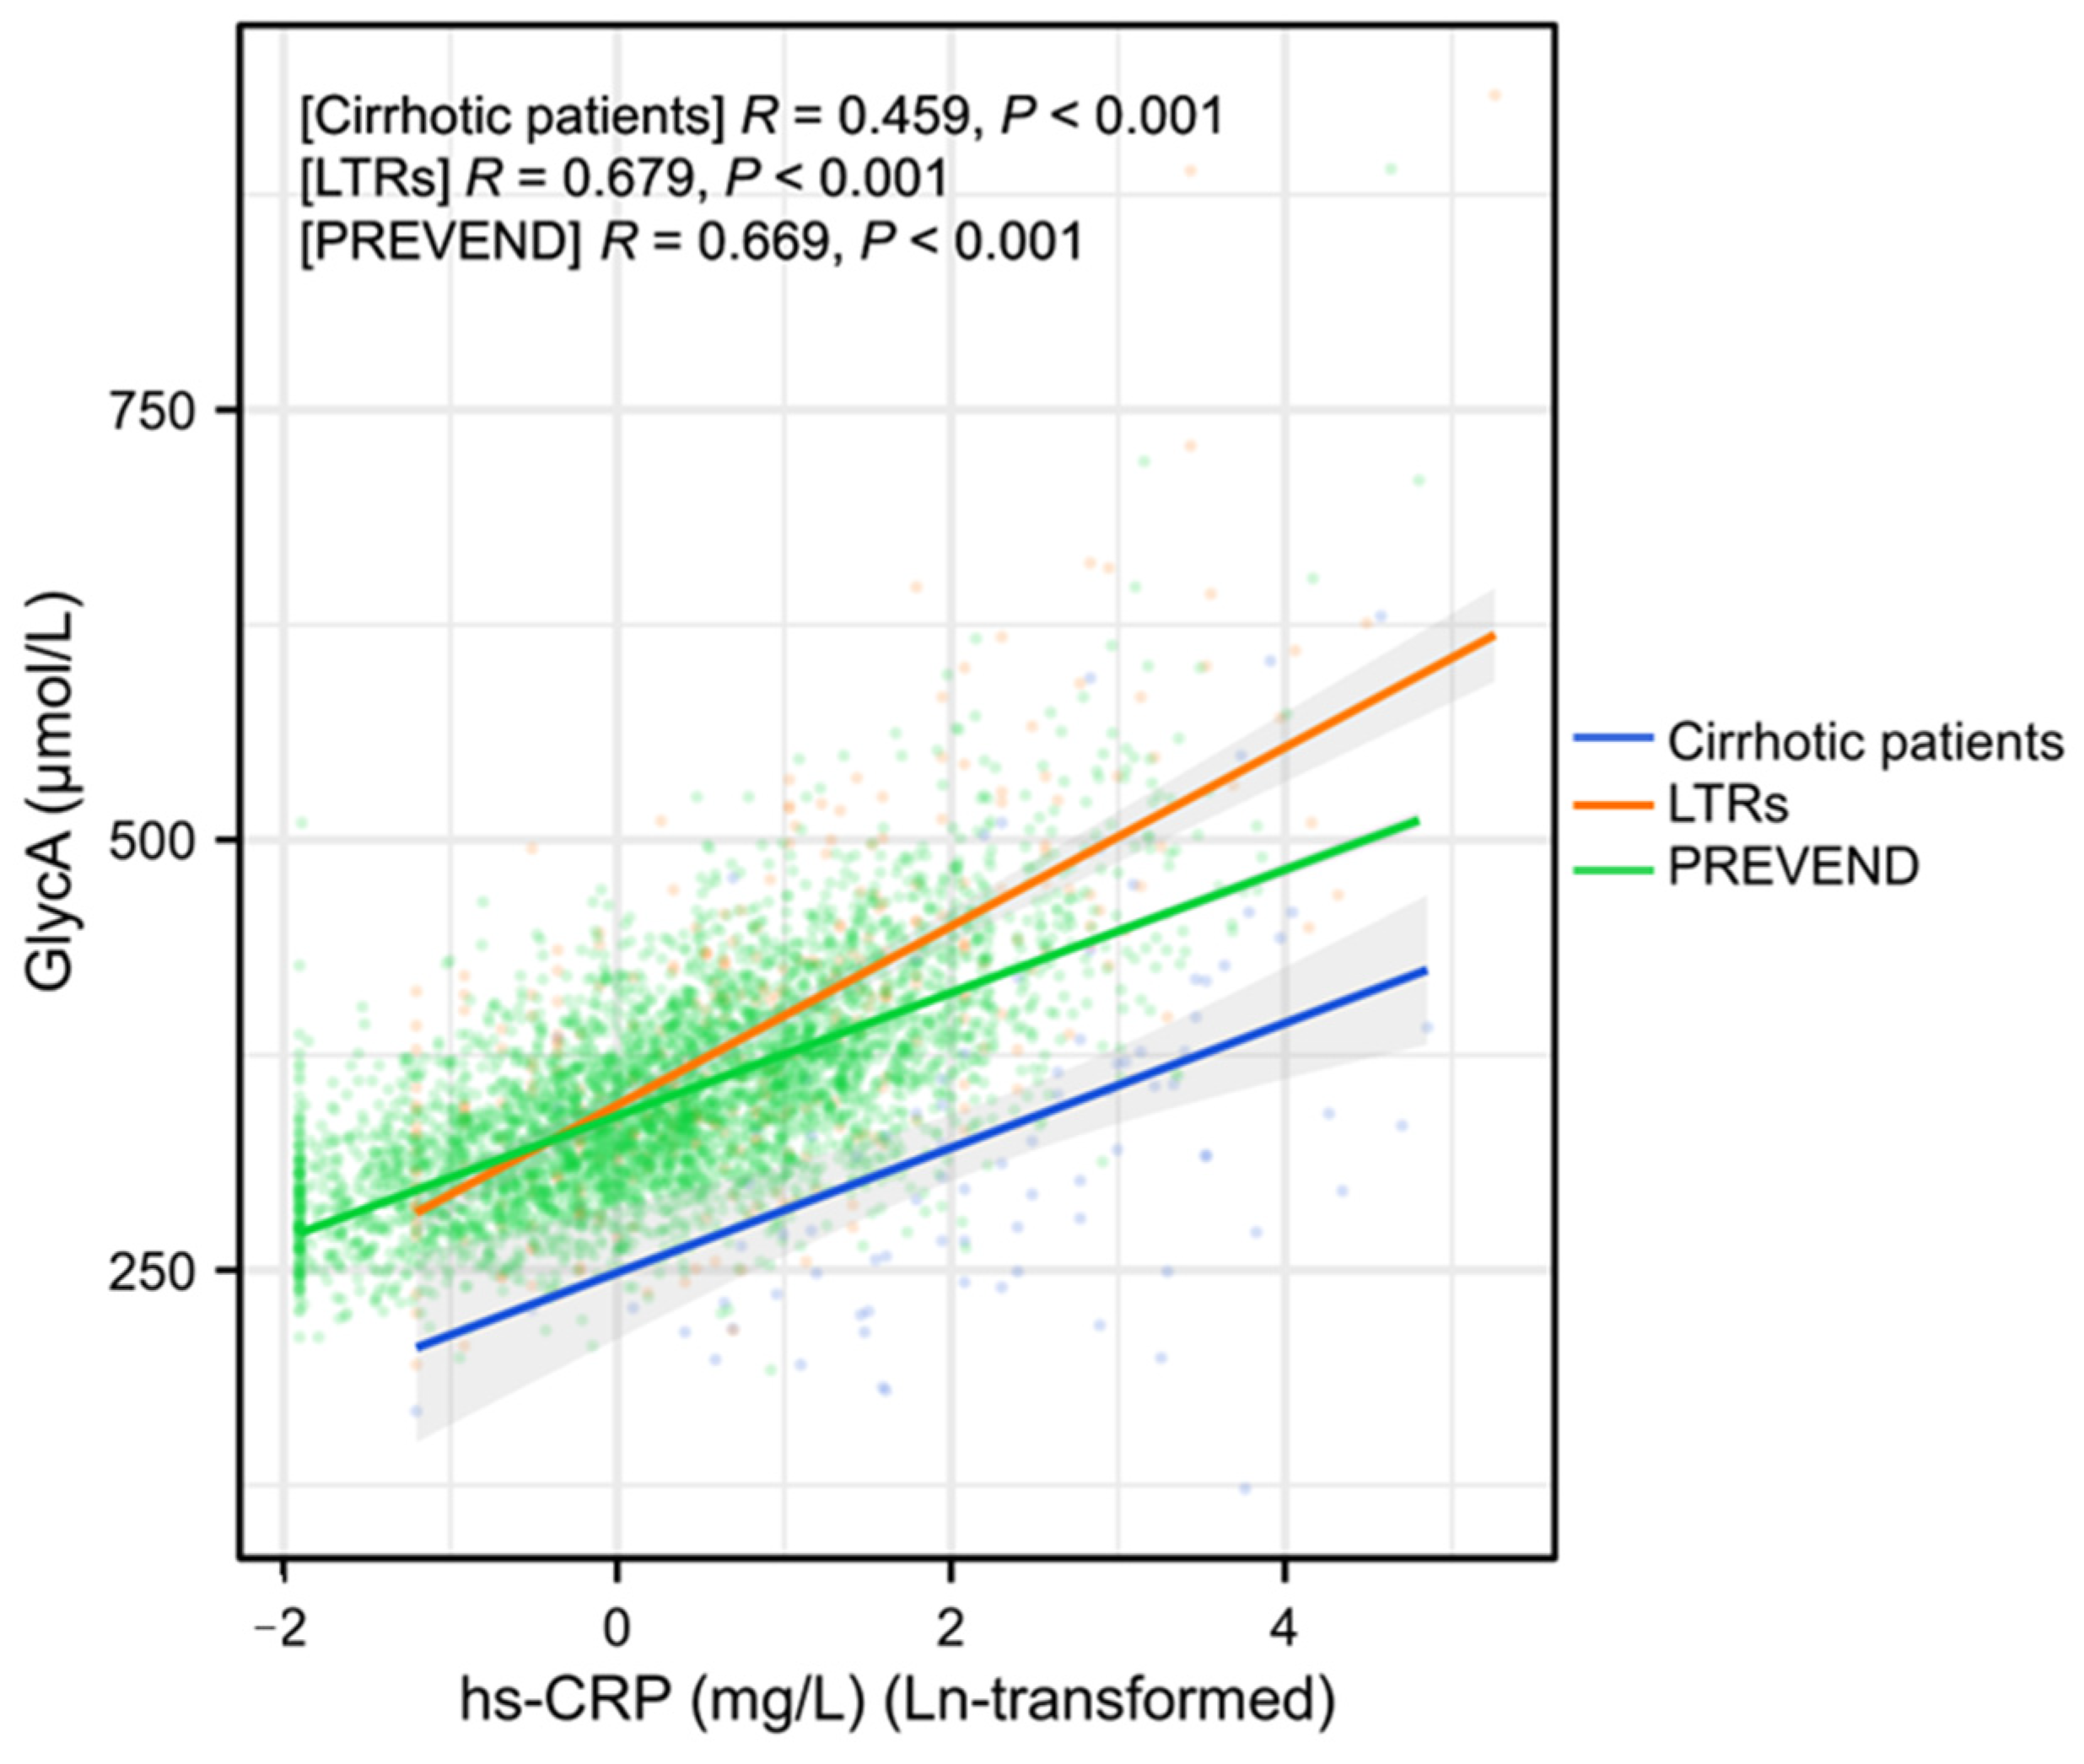
2.2. Associations of GlycA and Hs-CRP with Clinical and Laboratory Variables in Patients with Cirrhosis and Liver Transplant Recipients
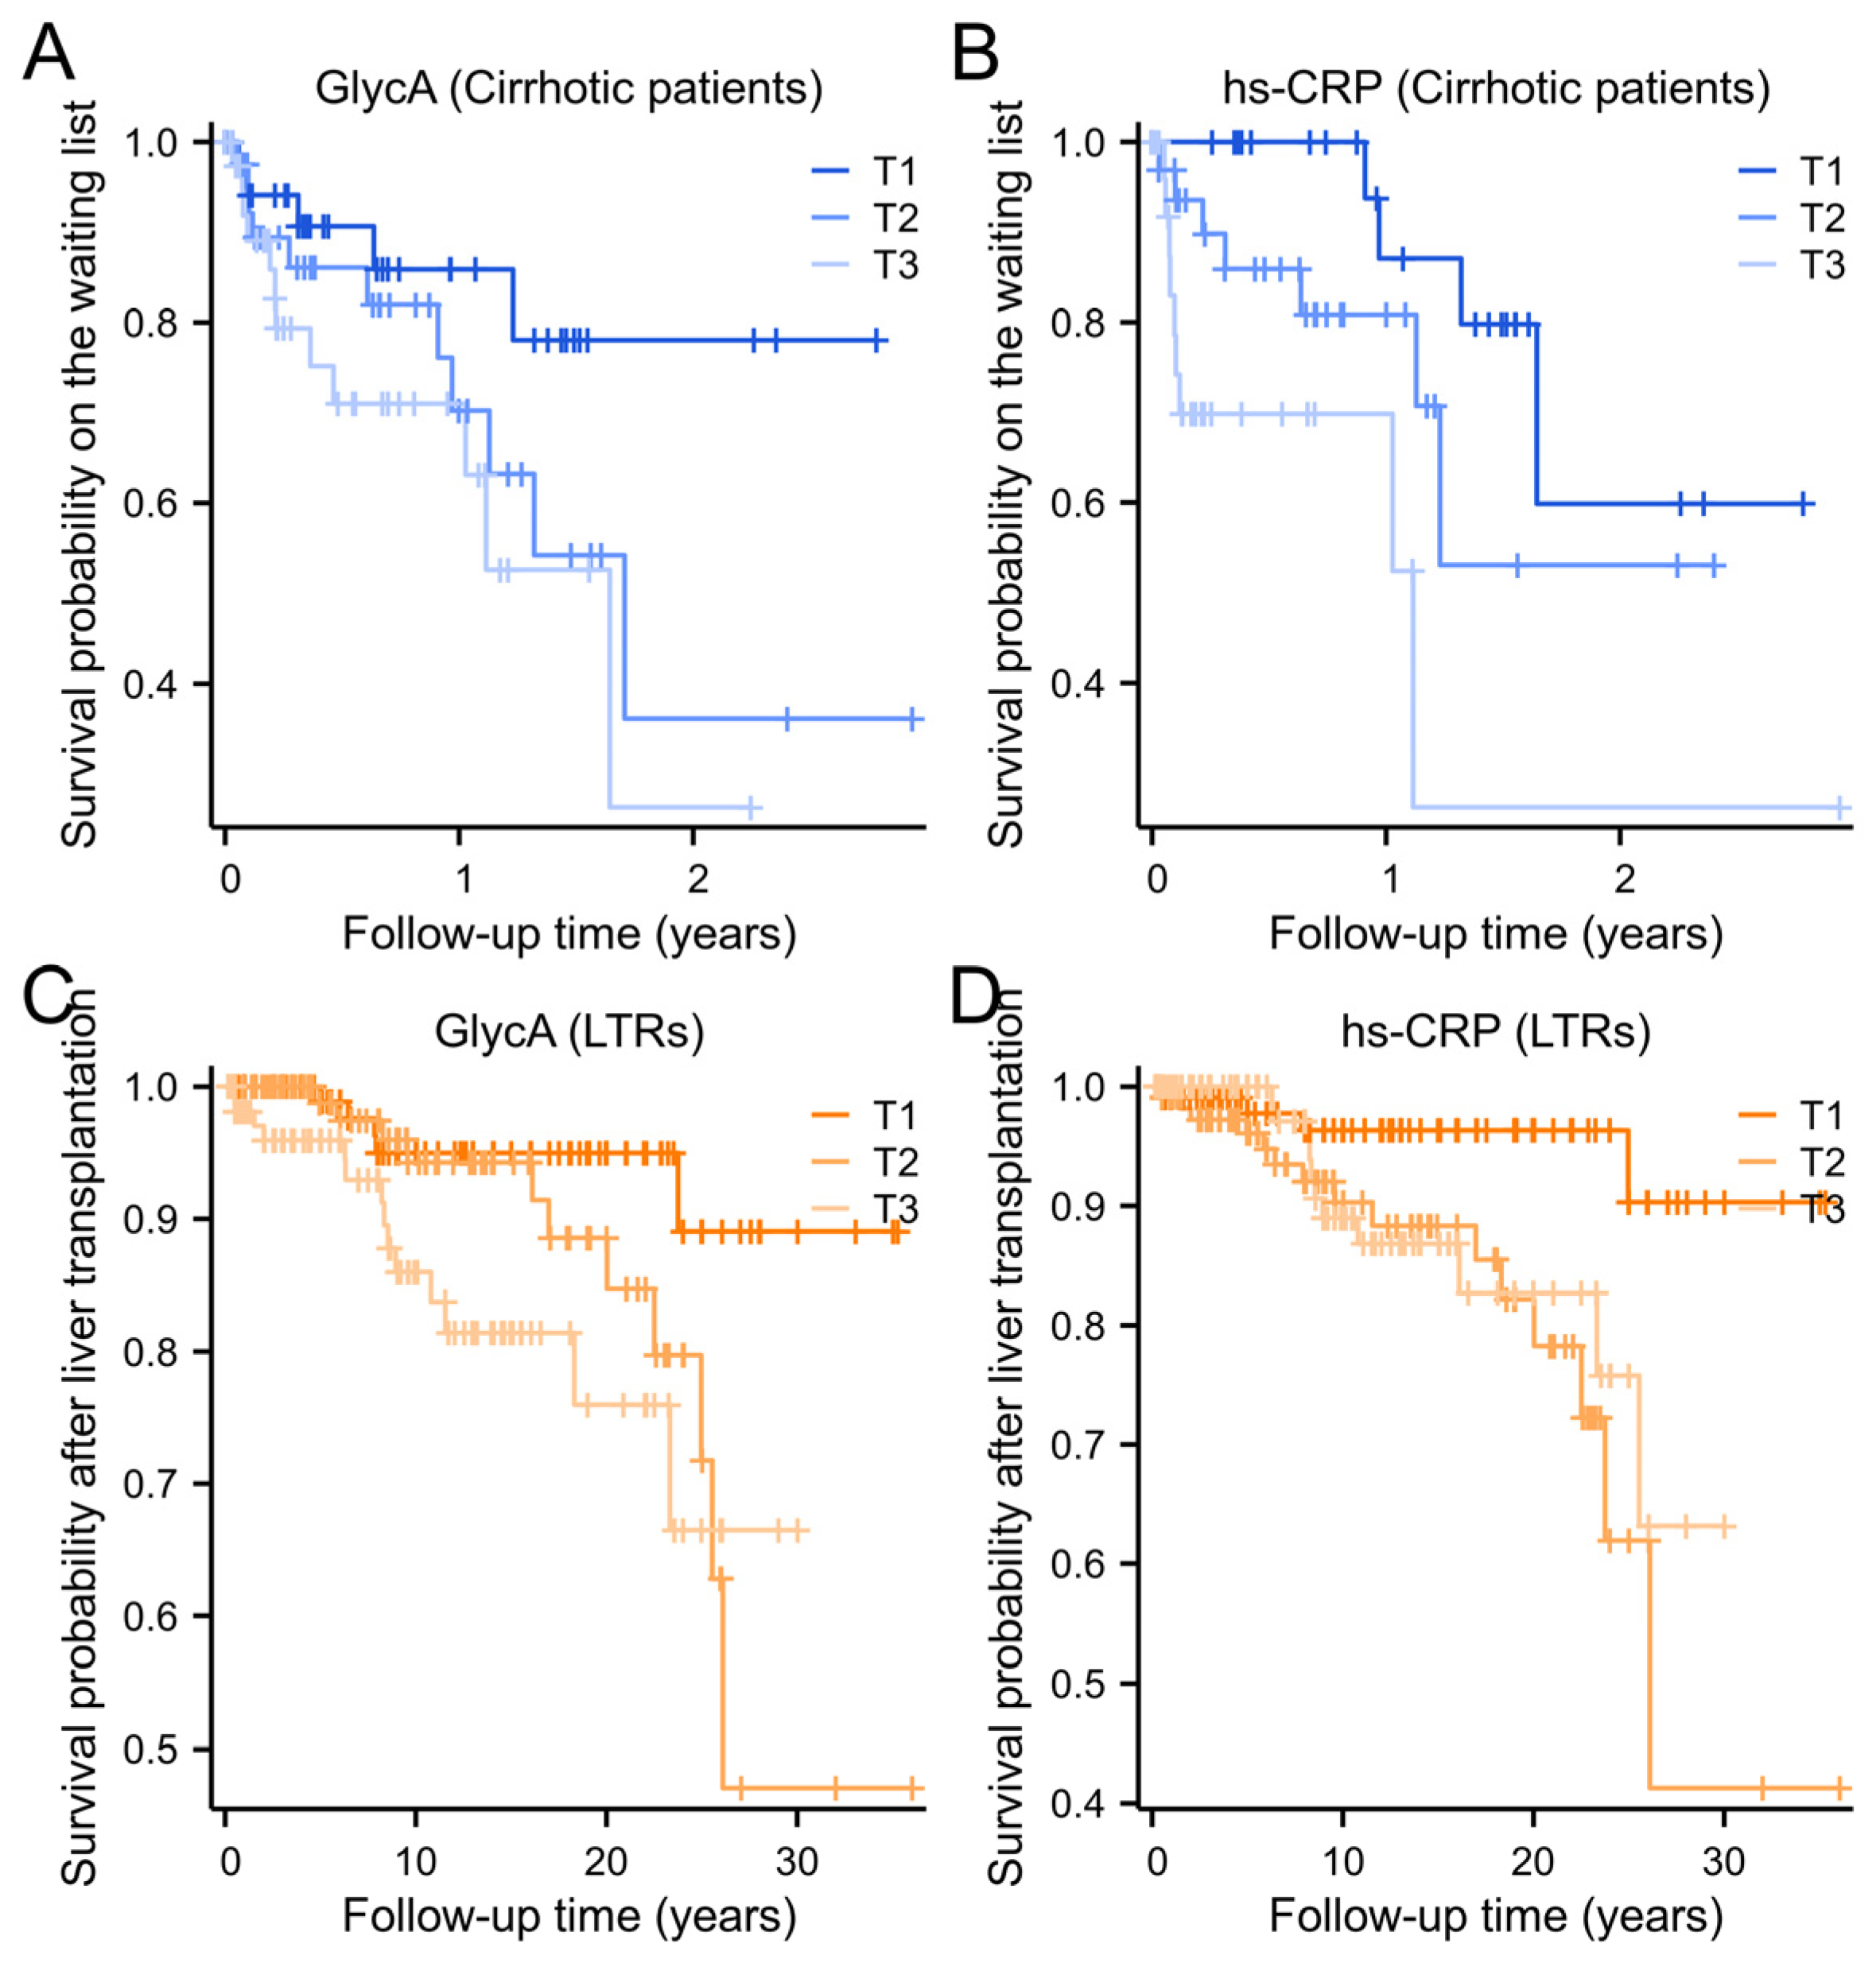
2.3. Longitudinal Analysis of GlycA and Hs-CRP with All-Cause Mortality in Patients with Cirrhosis and Liver Transplant Recipients
3. Discussion
4. Materials and Methods
4.1. Study Population
4.2. Data Collection and Clinical Measurements
4.3. Laboratory Measurements
4.4. Statistical Analysis
5. Conclusions
Supplementary Materials
Author Contributions
Funding
Institutional Review Board Statement
Informed Consent Statement
Data Availability Statement
Acknowledgments
Conflicts of Interest
References
- Kaplan, A.; Fortune, B.; Ufere, N.; Brown, R.S.; Rosenblatt, R. National Trends in Location of Death in Patients with End-Stage Liver Disease. Liver Transpl. 2021, 27, 165–176. [Google Scholar] [CrossRef]
- Wahid, N.A.; Lee, J.; Kaplan, A.; Fortune, B.E.; Safford, M.M.; Brown, R.S.; Rosenblatt, R. Medicaid Expansion Association with End-Stage Liver Disease Mortality Depends on Leniency of Medicaid Hepatitis C Virus Coverage. Liver Transpl. 2021, 27, 1723–1732. [Google Scholar] [CrossRef] [PubMed]
- Miro, J.; Laguno, M.; Moreno, A.; Rimola, A.; Hospital Clinic Olt In Hiv Working Group. Management of end stage liver disease (ESLD): What is the current role of orthotopic liver transplantation (OLT)? J. Hepatol. 2006, 44, S140–S145. [Google Scholar] [CrossRef]
- Burra, P.; Becchetti, C.; Germani, G. NAFLD and liver transplantation: Disease burden, current management and future challenges. JHEP Rep. 2020, 2, 100192. [Google Scholar] [CrossRef] [PubMed]
- Serrano, M.T.; Sabroso, S.; Esteban, L.M.; Berenguer, M.; Fondevila, C.; Lorente, S.; Cortés, L.; Sanchez-Antolin, G.; Nuño, J.; De La Rosa, G.; et al. Mortality and Causes of Death After Liver Transplantation: Analysis of Sex Differences in a Large Nationwide Cohort. Transpl. Int. 2022, 35, 10263. [Google Scholar] [CrossRef]
- Albillos, A.; Martin-Mateos, R.; Van Der Merwe, S.; Wiest, R.; Jalan, R.; Álvarez-Mon, M. Cirrhosis-associated immune dysfunction. Nat. Rev. Gastroenterol. Hepatol. 2022, 19, 112–134. [Google Scholar] [CrossRef]
- Trebicka, J.; Amoros, A.; Pitarch, C.; Titos, E.; Alcaraz-Quiles, J.; Schierwagen, R.; Deulofeu, C.; Fernandez-Gomez, J.; Piano, S.; Caraceni, P.; et al. Addressing Profiles of Systemic Inflammation Across the Different Clinical Phenotypes of Acutely Decompensated Cirrhosis. Front. Immunol. 2019, 10, 476. [Google Scholar] [CrossRef]
- Tilg, H.; Moschen, A.R. Insulin resistance, inflammation, and non-alcoholic fatty liver disease. Trends Endocrinol. Metab. 2008, 19, 371–379. [Google Scholar] [CrossRef]
- Liu, Y.-B.; Ying, J.; Kuang, S.-J.; Jin, H.-S.; Yin, Z.; Chang, L.; Yang, H.; Ou, Y.-L.; Zheng, J.-H.; Zhang, W.-D.; et al. Elevated Preoperative Serum Hs-CRP Level as a Prognostic Factor in Patients Who Underwent Resection for Hepatocellular Carcinoma. Medicine 2015, 94, e2209. [Google Scholar] [CrossRef]
- Jamialahmadi, T.; Bo, S.; Abbasifard, M.; Sathyapalan, T.; Jangjoo, A.; Moallem, S.A.; Almahmeed, W.; Ashari, S.; Johnston, T.P.; Sahebkar, A. Association of C-reactive protein with histological, elastographic, and sonographic indices of non-alcoholic fatty liver disease in individuals with severe obesity. J. Health Popul. Nutr. 2023, 42, 30. [Google Scholar] [CrossRef]
- Zanetto, A.; Pelizzaro, F.; Campello, E.; Bulato, C.; Balcar, L.; Gu, W.; Gavasso, S.; Saggiorato, G.; Zeuzem, S.; Russo, F.P.; et al. Severity of systemic inflammation is the main predictor of ACLF and bleeding in individuals with acutely decompensated cirrhosis. J. Hepatol. 2023, 78, 301–311. [Google Scholar] [CrossRef]
- Pompili, E.; Baldassarre, M.; Bedogni, G.; Zaccherini, G.; Iannone, G.; De Venuto, C.; Pratelli, D.; Palmese, F.; Domenicali, M.; Caraceni, P. Predictors of clinical trajectories of patients with acutely decompensated cirrhosis. An external validation of the PREDICT study. Liver Int. 2024, 44, 72–82. [Google Scholar] [CrossRef]
- Turco, L.; Garcia-Tsao, G.; Magnani, I.; Bianchini, M.; Costetti, M.; Caporali, C.; Colopi, S.; Simonini, E.; De Maria, N.; Banchelli, F.; et al. Cardiopulmonary hemodynamics and C-reactive protein as prognostic indicators in compensated and decompensated cirrhosis. J. Hepatol. 2018, 68, 949–958. [Google Scholar] [CrossRef] [PubMed]
- Trebicka, J.; Fernandez, J.; Papp, M.; Caraceni, P.; Laleman, W.; Gambino, C.; Giovo, I.; Uschner, F.E.; Jimenez, C.; Mookerjee, R.; et al. The PREDICT study uncovers three clinical courses of acutely decompensated cirrhosis that have distinct pathophysiology. J. Hepatol. 2020, 73, 842–854. [Google Scholar] [CrossRef] [PubMed]
- Otvos, J.D.; Shalaurova, I.; Wolak-Dinsmore, J.; Connelly, M.A.; Mackey, R.H.; Stein, J.H.; Tracy, R.P. GlycA: A Composite Nuclear Magnetic Resonance Biomarker of Systemic Inflammation. Clin. Chem. 2015, 61, 714–723. [Google Scholar] [CrossRef] [PubMed]
- Connelly, M.A.; Otvos, J.D.; Shalaurova, I.; Playford, M.P.; Mehta, N.N. GlycA, a novel biomarker of systemic inflammation and cardiovascular disease risk. J. Transl. Med. 2017, 15, 219. [Google Scholar] [CrossRef]
- Bourgonje, A.R.; Van Der Vaart, A.; Gruppen, E.G.; Van Goor, H.; Bakker, S.J.L.; Connelly, M.A.; Van Dijk, P.R.; Dullaart, R.P.F. Plasma levels of GlycA, a pro-inflammatory glycoprotein biomarker, associate with an increased risk of microvascular complications in patients with type 2 diabetes (Zodiac-62). Endocrine 2023, 80, 312–316. [Google Scholar] [CrossRef]
- Akinkuolie, A.O.; Buring, J.E.; Ridker, P.M.; Mora, S. A Novel Protein Glycan Biomarker and Future Cardiovascular Disease Events. J. Am. Heart Assoc. 2014, 3, e001221. [Google Scholar] [CrossRef]
- Van Den Berg, E.H.; Flores-Guerrero, J.L.; Gruppen, E.G.; Garcia, E.; Connelly, M.A.; De Meijer, V.E.; Bakker, S.J.L.; Blokzijl, H.; Dullaart, R.P.F. Profoundly Disturbed Lipoproteins in Cirrhotic Patients: Role of Lipoprotein-Z, a Hepatotoxic LDL-like Lipoprotein. J. Clin. Med. 2022, 11, 1223. [Google Scholar] [CrossRef] [PubMed]
- Gruppen, E.G.; Riphagen, I.J.; Connelly, M.A.; Otvos, J.D.; Bakker, S.J.L.; Dullaart, R.P.F. GlycA, a Pro-Inflammatory Glycoprotein Biomarker, and Incident Cardiovascular Disease: Relationship with C-Reactive Protein and Renal Function. PLoS ONE 2015, 10, e0139057. [Google Scholar] [CrossRef] [PubMed]
- Zhou, H.-H.; Tang, Y.-L.; Xu, T.-H.; Cheng, B. C-reactive protein: Structure, function, regulation, and role in clinical diseases. Front. Immunol. 2024, 15, 1425168. [Google Scholar] [CrossRef]
- Lai, C.-Y.; Cheng, S.-B.; Lee, T.-Y.; Liu, H.-T.; Huang, S.-C.; Huang, Y.-C. Possible Synergistic Effects of Glutathione and C-Reactive Protein in the Progression of Liver Cirrhosis. Nutrients 2018, 10, 678. [Google Scholar] [CrossRef]
- Callewaert, N.; Vlierberghe, H.V.; Hecke, A.V.; Laroy, W.; Delanghe, J.; Contreras, R. Noninvasive diagnosis of liver cirrhosis using DNA sequencer–based total serum protein glycomics. Nat. Med. 2004, 10, 429–434. [Google Scholar] [CrossRef]
- Scheper, A.F.; Schofield, J.; Bohara, R.; Ritter, T.; Pandit, A. Understanding glycosylation: Regulation through the metabolic flux of precursor pathways. Biotechnol. Adv. 2023, 67, 108184. [Google Scholar] [CrossRef]
- McCarthy, C.; Saldova, R.; Wormald, M.R.; Rudd, P.M.; McElvaney, N.G.; Reeves, E.P. The Role and Importance of Glycosylation of Acute Phase Proteins with Focus on Alpha-1 Antitrypsin in Acute and Chronic Inflammatory Conditions. J. Proteome Res. 2014, 13, 3131–3143. [Google Scholar] [CrossRef] [PubMed]
- Noel, M.; Chasman, D.I.; Mora, S.; Otvos, J.D.; Palmer, C.D.; Parsons, P.J.; Smoller, J.W.; Cummings, R.D.; Mealer, R.G. The Inflammation Biomarker GlycA Reflects Plasma N-Glycan Branching. Clin. Chem. 2023, 69, 80–87. [Google Scholar] [CrossRef] [PubMed]
- Nebert, D.W.; Liu, Z. SLC39A8 gene encoding a metal ion transporter: Discovery and bench to bedside. Hum. Genom. 2019, 13, 51. [Google Scholar] [CrossRef]
- Lin, W.; Vann, D.R.; Doulias, P.-T.; Wang, T.; Landesberg, G.; Li, X.; Ricciotti, E.; Scalia, R.; He, M.; Hand, N.J.; et al. Hepatic metal ion transporter ZIP8 regulates manganese homeostasis and manganese-dependent enzyme activity. J. Clin. Investig. 2017, 127, 2407–2417. [Google Scholar] [CrossRef]
- Chung, H.S.; Kim, E.S.; Park, J.H.; Park, C.S. Prediction of Gross Post-Transplant Outcomes Based on the Intra-Operative Decline in C-Reactive Protein in Living Donor Liver Transplantation. Transplant. Proc. 2015, 47, 431–437. [Google Scholar] [CrossRef] [PubMed]
- Gruppen, E.G.; Kunutsor, S.K.; Kieneker, L.M.; Van Der Vegt, B.; Connelly, M.A.; De Bock, G.H.; Gansevoort, R.T.; Bakker, S.J.L.; Dullaart, R.P.F. GlycA, a novel pro-inflammatory glycoprotein biomarker is associated with mortality: Results from the PREVEND study and meta-analysis. J. Intern. Med. 2019, 286, 596–609. [Google Scholar] [CrossRef] [PubMed]
- Tilg, H.; Zmora, N.; Adolph, T.E.; Elinav, E. The intestinal microbiota fuelling metabolic inflammation. Nat. Rev. Immunol. 2020, 20, 40–54. [Google Scholar] [CrossRef] [PubMed]
- Trillos-Almanza, M.C.; Chvatal-Medina, M.; Connelly, M.A.; Moshage, H.; TransplantLines Investigators Bakker, S.J.L.; De Meijer, V.E.; Blokzijl, H.; Dullaart, R.P.F. Circulating Trimethylamine-N-Oxide Is Elevated in Liver Transplant Recipients. Int. J. Mol. Sci. 2024, 25, 6031. [Google Scholar] [CrossRef]
- Han, Y.; Wu, L.; Ling, Q.; Wu, P.; Zhang, C.; Jia, L.; Weng, H.; Wang, B. Intestinal Dysbiosis Correlates with Sirolimus-induced Metabolic Disorders in Mice. Transplantation 2021, 105, 1017–1029. [Google Scholar] [CrossRef] [PubMed]
- Faucher, Q.; Jardou, M.; Brossier, C.; Picard, N.; Marquet, P.; Lawson, R. Is Intestinal Dysbiosis-Associated with Immunosuppressive Therapy a Key Factor in the Pathophysiology of Post-Transplant Diabetes Mellitus? Front. Endocrinol. 2022, 13, 898878. [Google Scholar] [CrossRef]
- Duprez, D.A.; Otvos, J.; Sanchez, O.A.; Mackey, R.H.; Tracy, R.; Jacobs, D.R. Comparison of the Predictive Value of GlycA and Other Biomarkers of Inflammation for Total Death, Incident Cardiovascular Events, Noncardiovascular and Noncancer Inflammatory-Related Events, and Total Cancer Events. Clin. Chem. 2016, 62, 1020–1031. [Google Scholar] [CrossRef]
- Fizelova, M.; Jauhiainen, R.; Kangas, A.J.; Soininen, P.; Ala-Korpela, M.; Kuusisto, J.; Laakso, M.; Stančáková, A. Differential Associations of Inflammatory Markers with Insulin Sensitivity and Secretion: The Prospective METSIM Study. J. Clin. Endocrinol. Metab. 2017, 102, 3600–3609. [Google Scholar] [CrossRef]
- Olson, M.L.; Rentería-Mexía, A.; Connelly, M.A.; Vega-López, S.; Soltero, E.G.; Konopken, Y.P.; Williams, A.N.; Castro, F.G.; Keller, C.S.; Yang, H.P.; et al. Decreased GlycA after lifestyle intervention among obese, prediabetic adolescent Latinos. J. Clin. Lipidol. 2019, 13, 186–193. [Google Scholar] [CrossRef]
- Manmadhan, A.; Lin, B.; Zhong, J.; Parikh, M.; Berger, J.S.; Fisher, E.A.; Heffron, S.P. Elevated GlycA in severe obesity is normalized by bariatric surgery. Diabetes Obes. Metab. 2019, 21, 178–182. [Google Scholar] [CrossRef]
- Von Elm, E.; Altman, D.G.; Egger, M.; Pocock, S.J.; Gøtzsche, P.C.; Vandenbroucke, J.P. The Strengthening the Reporting of Observational Studies in Epidemiology (STROBE) Statement: Guidelines for reporting observational studies. Int. J. Surg. 2014, 12, 1495–1499. [Google Scholar] [CrossRef]
- Eisenga, M.F.; Gomes-Neto, A.W.; Van Londen, M.; Ziengs, A.L.; Douwes, R.M.; Stam, S.P.; Osté, M.C.J.; Knobbe, T.J.; Hessels, N.R.; Buunk, A.M.; et al. Rationale and design of TransplantLines: A prospective cohort study and biobank of solid organ transplant recipients. BMJ Open 2018, 8, e024502. [Google Scholar] [CrossRef] [PubMed]
- World Medical Association. World Medical Association Declaration of Helsinki: Ethical Principles for Medical Research Involving Human Subjects. JAMA 2013, 310, 2191. [Google Scholar] [CrossRef]
- Borggreve, S.E.; Hillege, H.L.; Wolffenbuttel, B.H.R.; De Jong, P.E.; Bakker, S.J.L.; Van Der Steege, G.; Van Tol, A.; Dullaart, R.P.F. The Effect of Cholesteryl Ester Transfer Protein −629C→A Promoter Polymorphism on High-Density Lipoprotein Cholesterol Is Dependent on Serum Triglycerides. J. Clin. Endocrinol. Metab. 2005, 90, 4198–4204. [Google Scholar] [CrossRef]
- Kappelle, P.J.W.H.; Gansevoort, R.T.; Hillege, J.L.; Wolffenbuttel, B.H.R.; Dullaart, R.P.F.; on behalf of the PREVEND study group. Apolipoprotein B/A-I and total cholesterol/high-density lipoprotein cholesterol ratios both predict cardiovascular events in the general population independently of nonlipid risk factors, albuminuria and C-reactive protein. J. Intern. Med. 2011, 269, 232–242. [Google Scholar] [CrossRef]
- Inker, L.A.; Schmid, C.H.; Tighiouart, H.; Eckfeldt, J.H.; Feldman, H.I.; Greene, T.; Kusek, J.W.; Manzi, J.; Van Lente, F.; Zhang, Y.L.; et al. Estimating Glomerular Filtration Rate from Serum Creatinine and Cystatin C. N. Engl. J. Med. 2012, 367, 20–29. [Google Scholar] [CrossRef] [PubMed]
- Wiesner, R.; Edwards, E.; Freeman, R.; Harper, A.; Kim, R.; Kamath, P.; Kremers, W.; Lake, J.; Howard, T.; Merion, R.M.; et al. Model for end-stage liver disease (MELD) and allocation of donor livers. Gastroenterology 2003, 124, 91–96. [Google Scholar] [CrossRef]
- Pugh, R.N.H.; Murray-Lyon, I.M.; Dawson, J.L.; Pietroni, M.C.; Williams, R. Transection of the oesophagus for bleeding oesophageal varices. Br. J. Surg. 2005, 60, 646–649. [Google Scholar] [CrossRef]
- Bedi, S.; Garcia, E.; Jeyarajah, E.; Shalaurova, I.; Perez-Matos, M.; Jiang, Z.; Dullaart, R.; Matyus, S.; Kirk, W.; Otvos, J.; et al. Characterization of LP-Z Lipoprotein Particles and Quantification in Subjects with Liver Disease Using a Newly Developed NMR-Based Assay. J. Clin. Med. 2020, 9, 2915. [Google Scholar] [CrossRef]

| Cirrhotic Patients (n = 129) | LTRs (n = 367) | PREVEND (n = 4837) | p Value * | p Value # | |
|---|---|---|---|---|---|
| Age (years) | 60 (52, 65) | 59 (47, 67) | 52 (44, 63) | <0.001 | 0.65 |
| Sex | <0.001 | 0.19 | |||
| Male, n (%) | 84 (65.1%) | 215 (58.6%) | 2388 (49.4%) | ||
| Female, n (%) | 45 (34.9%) | 152 (41.4%) | 2449 (50.6%) | ||
| BMI (kg/m2) | 27.8 (24.8, 30.9) | 25.9 (23, 29.5) | 26.1 (23.7, 28.9) | <0.001 | <0.001 |
| SBP (mmHg) | 115 (107, 130) | 130 (120, 142) | 123 (112, 137) | <0.001 | <0.001 |
| DBP (mmHg) | 65 (59, 75) | 79 (74, 87) | 72 (67, 79) | <0.001 | <0.001 |
| Current smoking, n (%) | 16 (12.4%) | 33 (9%) | 1321 (27.3%) | <0.001 | 0.26 |
| Alcohol consumption (g/day) | <0.001 | <0.001 | |||
| 0/rarely, n (%) | 124 (96.1%) | 267 (72.8%) | 1697 (35.1%) | ||
| 0.1–10, n (%) | 5 (3.9%) | 67 (18.3%) | 1218 (25.2%) | ||
| 10–30, n (%) | 0 (0%) | 25 (6.8%) | 993 (20.5%) | ||
| ≥30, n (%) | 0 (0%) | 8 (2.2%) | 929 (19.2%) | ||
| Diabetes, n (%) | 36 (27.9%) | 104 (28.3%) | 294 (6.1%) | <0.001 | 0.93 |
| History of cardiovascular disease, n (%) | 6 (4.7%) | 28 (7.6%) | 301 (6.2%) | 0.418 | 0.25 |
| Blood glucose-lowering drugs, n (%) | 35 (27.1%) | 77 (21%) | 178 (3.7%) | <0.001 | 0.15 |
| Lipid-lowering drugs, n (%) | 19 (14.7%) | 86 (23.4%) | 458 (9.5%) | <0.001 | 0.037 |
| Antihypertensives, n (%) | 80 (62%) | 167 (45.5%) | 854 (17.7%) | <0.001 | 0.001 |
| Etiology, n (%) | - | - | <0.001 | ||
| MASLD | 33 (25.6%) | 34 (9.3%) | |||
| Storage diseases | 4 (3.1%) | 33 (9%) | |||
| Cholestatic liver diseases | 33 (25.6%) | 100 (27.2%) | |||
| Alcohol | 28 (21.7%) | 48 (13.1%) | |||
| Viral | 12 (9.3%) | 37 (10.1%) | |||
| Autoimmune hepatitis | 10 (7.8%) | 19 (5.2%) | |||
| Others | 9 (7%) | 96 (26.2%) | |||
| Child–Turcotte–Pugh classification | - | - | - | - | |
| A, n (%) | 28 (21.7%) | ||||
| B, n (%) | 63 (48.8%) | ||||
| C, n (%) | 38 (29.5%) | ||||
| MELD score | 15 (10,19) | - | - | - | - |
| Ascites, n (%) | 48 (37.2%) | ||||
| Hepatic encephalopathy, n (%) | 28 (21.7%) | ||||
| Esophageal variceal bleeding, n (%) | 11 (8.5%) | ||||
| Total cholesterol (mmol/L) | 3.2 (2.5, 4.1) | 4.2 (3.6, 4.8) | 5.3 (4.7, 6.1) | <0.001 | <0.001 |
| LDL cholesterol (mmol/L) | 1.8 (1.3, 2.2) | 2.1 (1.7, 2.5) | 3.5 (2.9, 4.1) | <0.001 | <0.001 |
| HDL cholesterol (mmol/L) | 0.9 (0.4, 1.2) | 1.3 (1.1, 1.7) | 1.2 (1.0, 1.4) | <0.001 | <0.001 |
| Triglycerides (mmol/L) | 0.7 (0.5, 1.1) | 1.3 (1.0, 1.8) | 1.1 (0.8, 1.6) | <0.001 | <0.001 |
| Albumin (g/L) | 31 (27, 36) | 44 (42, 46) | - | - | <0.001 |
| Fasting glucose (mmol/L) | 6.2 (5, 8.2) | 5.7 (5.2, 6.9) | 4.8 (4.4, 5.3) | <0.001 | 0.35 |
| HbA1c (%) | 5.1 (4.5, 5.75) | 5.4 (5.1, 6.1) | - | - | 0.002 |
| Serum creatinine (µmol/L) | 73.2 (55.6, 95.7) | 88.9 (74.6, 107.4) | 83.2 (73.9, 92.4) | <0.001 | <0.001 |
| eGFR (mL/min/1.73 m2) | 99.5 (75.5, 109.5) | 77.9 (61.15, 97.6) | 93.7 (81.6, 104.3) | <0.001 | <0.001 |
| Total bilirubin (µmol/L) | 42 (23.3, 98.5) | 10 (7, 14) | 7 (5, 9) | <0.001 | <0.001 |
| ALT (U/L) | 40 (28, 60) | 25 (18, 36) | 17 (13, 24) | <0.001 | <0.001 |
| AST (U/L) | 54 (44, 84) | 25 (20, 33) | 22 (19, 26) | <0.001 | <0.001 |
| GGT (U/L) | 95 (48.5, 150.5) | 40.5 (21, 88.5) | 24 (16, 38) | <0.001 | <0.001 |
| ALP (U/L) | 141 (98.5, 213.5) | 87 (69, 126.5) | 66 (55, 79) | <0.001 | <0.001 |
| Hemoglobin (mmol/L) | 6.8 ± 1.3 | 8.5 ± 1.2 | 8.5 ± 0.8 | <0.001 | <0.001 |
| Thrombocytes (×109/L) | 112 (78, 148.5) | 197 (153.8, 246.5) | - | - | <0.001 |
| Leucocytes (×109/L) | 4.9 (3.6, 7.6) | 6.1 (4.8, 7.6) | - | - | <0.001 |
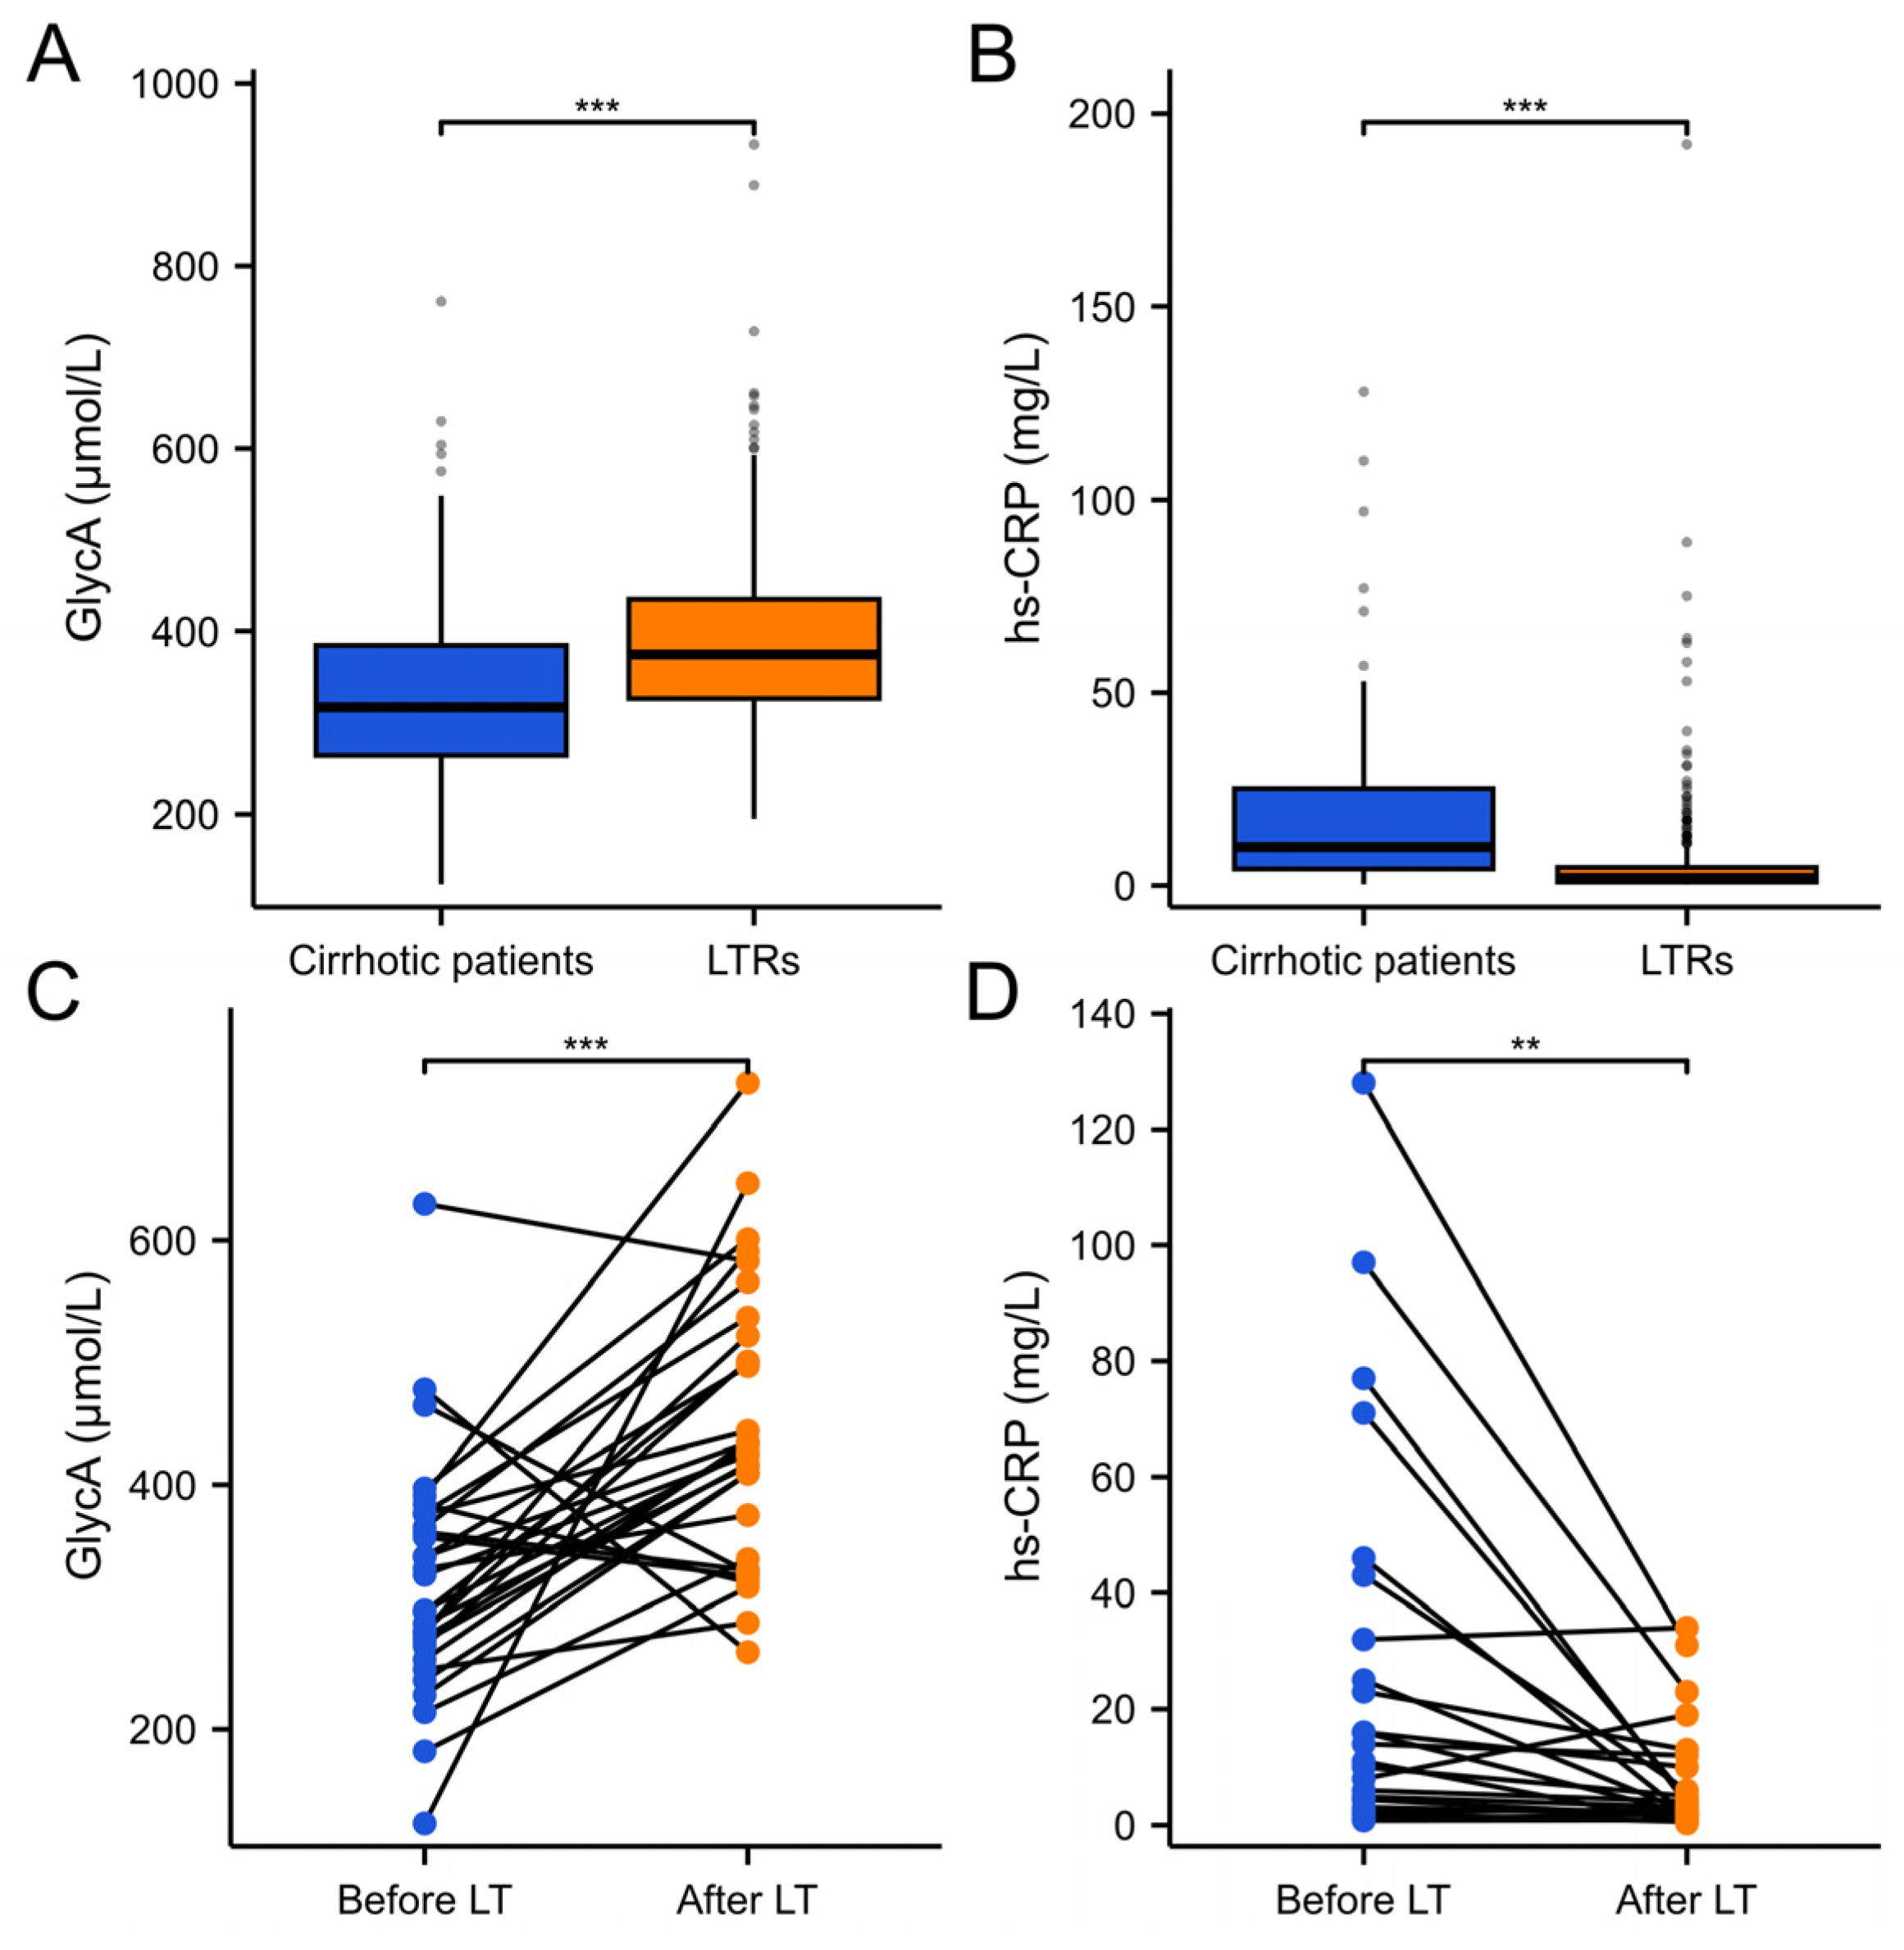
| hs-CRP (mg/L) | 10 (4.3, 25) | 2 (0.9, 4.7) | 1.3 (0.6, 3.0) | <0.001 | <0.001 |
| GlycA (μmol/L) | 317 (264, 385) | 375 (326.5, 435) | 344 (308, 388) | <0.001 | <0.001 |
| GlycA, Per 1 SD Increment | hs-CRP, Per 1 SD Increment | |||
|---|---|---|---|---|
| HR [95% CI] | p Value | HR [95% CI] | p Value | |
| Model 1 | 1.73 [1.15–2.60] | 0.009 | 1.74 [1.23–2.47] | 0.002 |
| Model 2 | 1.81 [1.18–2.78] | 0.006 | 1.63 [1.14–2.33] | 0.007 |
| Model 3 | 1.70 [1.08–2.68] | 0.021 | 1.46 [0.99–2.17] | 0.056 |
| Model 4 | 2.76 [1.53–4.99] | 0.001 | 1.46 [0.99–2.16] | 0.059 |
| Model 5 | 2.34 [1.07–5.13] | 0.033 | 1.22 [0.78–1.91] | 0.38 |
| GlycA, Per 1 SD Increment | hs-CRP, Per 1 SD Increment | |||
|---|---|---|---|---|
| HR [95% CI] | p Value | HR [95% CI] | p Value | |
| Model 1 | 1.69 [1.29–2.21] | <0.001 | 1.25 [1.09–1.44] | 0.002 |
| Model 2 | 1.59 [1.19–2.13] | 0.002 | 1.24 [1.07–1.44] | 0.004 |
| Model 3 | 1.60 [1.19–2.14] | 0.002 | 1.64 [1.08–2.51] | 0.021 |
| Model 4 | 1.45 [0.90–2.32] | 0.124 | 1.06 [0.82–1.38] | 0.652 |
Disclaimer/Publisher’s Note: The statements, opinions and data contained in all publications are solely those of the individual author(s) and contributor(s) and not of MDPI and/or the editor(s). MDPI and/or the editor(s) disclaim responsibility for any injury to people or property resulting from any ideas, methods, instructions or products referred to in the content. |
© 2025 by the authors. Licensee MDPI, Basel, Switzerland. This article is an open access article distributed under the terms and conditions of the Creative Commons Attribution (CC BY) license (https://creativecommons.org/licenses/by/4.0/).
Share and Cite
Li, Y.; Chvatal-Medina, M.; Trillos-Almanza, M.C.; Connelly, M.A.; Moshage, H.; Bakker, S.J.L.; de Meijer, V.E.; Blokzijl, H.; Dullaart, R.P.F. Plasma GlycA, a Glycoprotein Marker of Chronic Inflammation, and All-Cause Mortality in Cirrhotic Patients and Liver Transplant Recipients. Int. J. Mol. Sci. 2025, 26, 459. https://doi.org/10.3390/ijms26020459
Li Y, Chvatal-Medina M, Trillos-Almanza MC, Connelly MA, Moshage H, Bakker SJL, de Meijer VE, Blokzijl H, Dullaart RPF. Plasma GlycA, a Glycoprotein Marker of Chronic Inflammation, and All-Cause Mortality in Cirrhotic Patients and Liver Transplant Recipients. International Journal of Molecular Sciences. 2025; 26(2):459. https://doi.org/10.3390/ijms26020459
Chicago/Turabian StyleLi, Yakun, Mateo Chvatal-Medina, Maria Camila Trillos-Almanza, Margery A. Connelly, Han Moshage, Stephan J. L. Bakker, Vincent E. de Meijer, Hans Blokzijl, and Robin P. F. Dullaart. 2025. "Plasma GlycA, a Glycoprotein Marker of Chronic Inflammation, and All-Cause Mortality in Cirrhotic Patients and Liver Transplant Recipients" International Journal of Molecular Sciences 26, no. 2: 459. https://doi.org/10.3390/ijms26020459
APA StyleLi, Y., Chvatal-Medina, M., Trillos-Almanza, M. C., Connelly, M. A., Moshage, H., Bakker, S. J. L., de Meijer, V. E., Blokzijl, H., & Dullaart, R. P. F. (2025). Plasma GlycA, a Glycoprotein Marker of Chronic Inflammation, and All-Cause Mortality in Cirrhotic Patients and Liver Transplant Recipients. International Journal of Molecular Sciences, 26(2), 459. https://doi.org/10.3390/ijms26020459