
Structure-Based Discovery of MolPort-137: A Novel Autotaxin Inhibitor That Improves Paclitaxel Efficacy

 , , , and
Abstract
:
1. Introduction
2. Results and Discussion
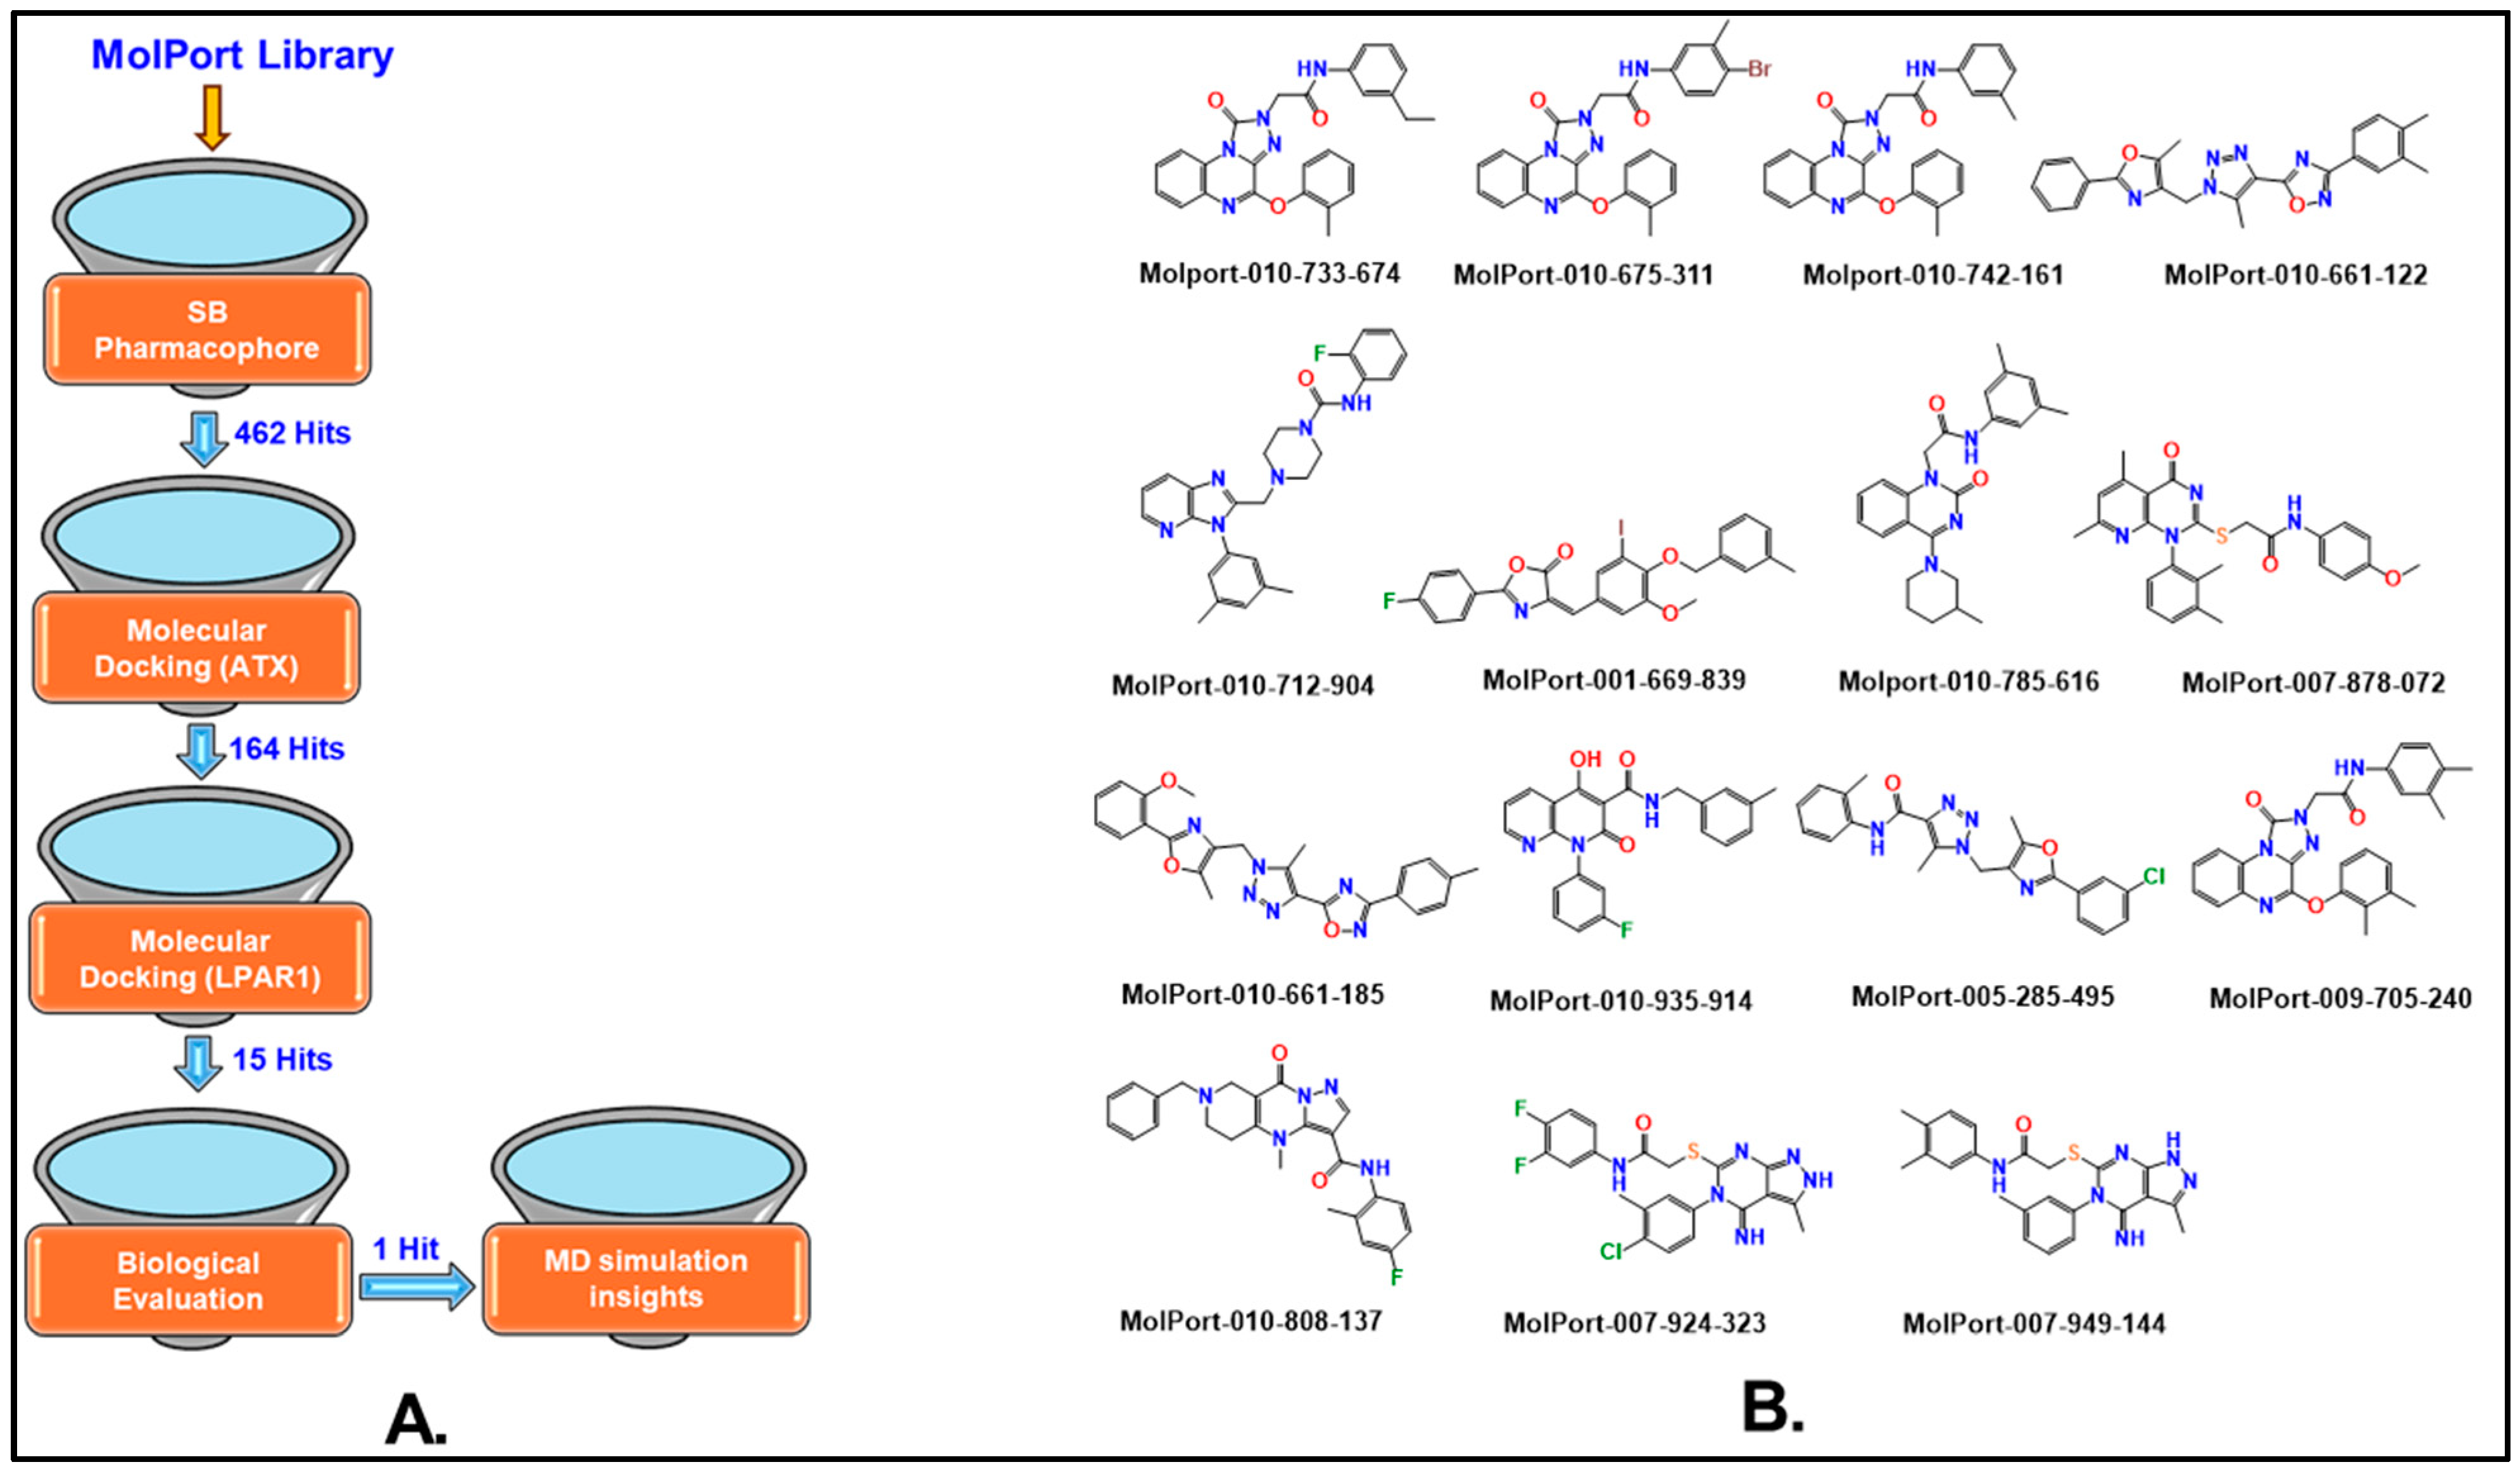
2.1. Pharmacophore-Based Virtual Screening
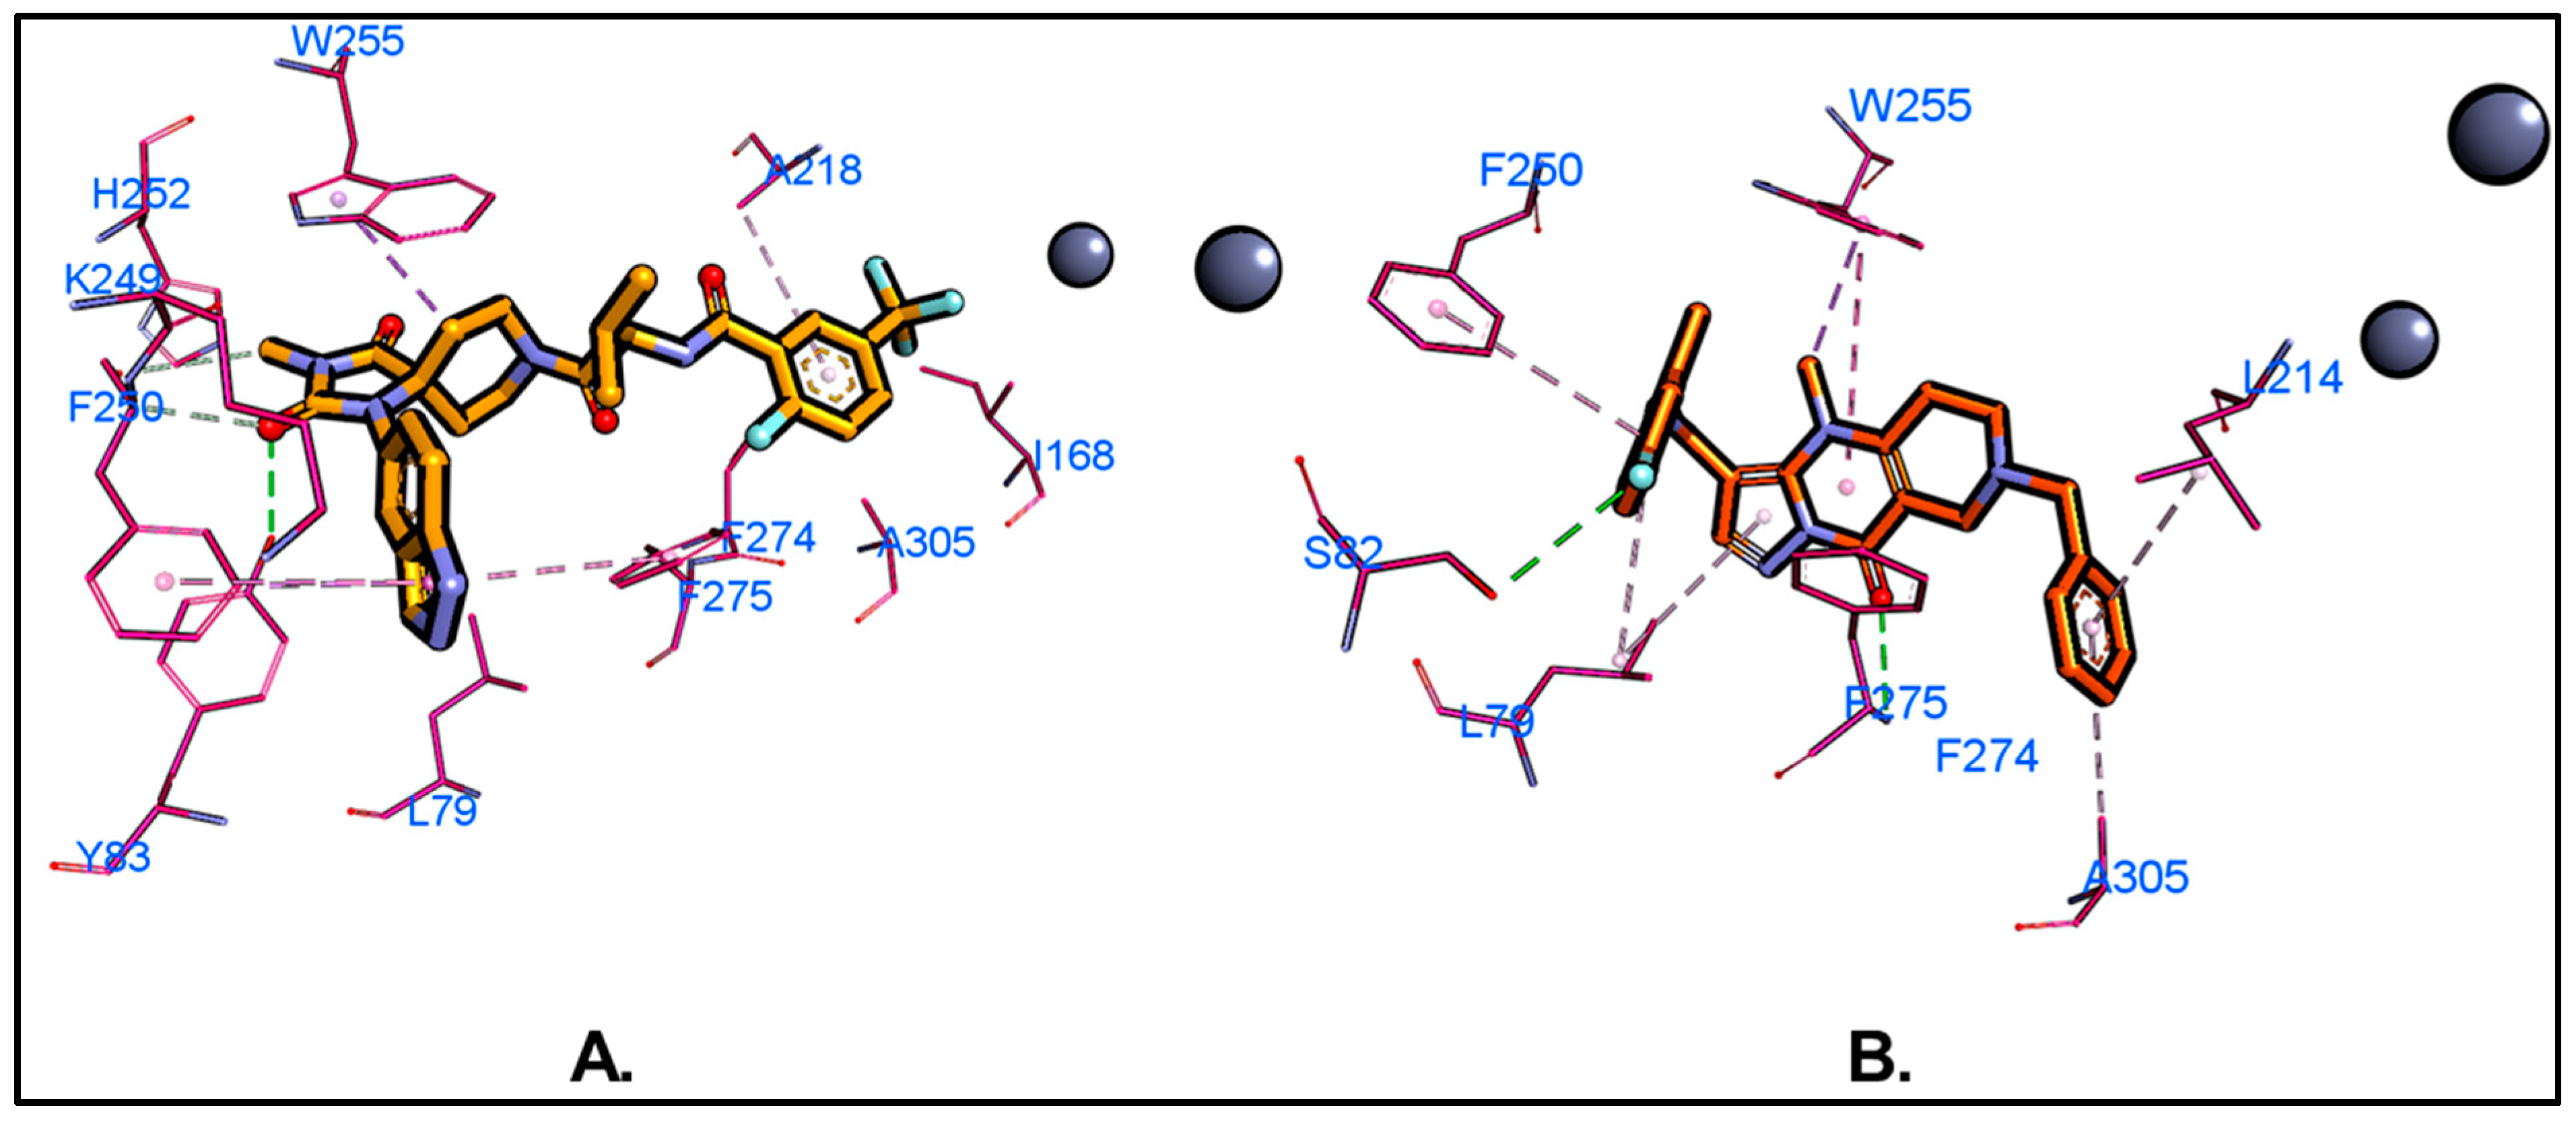
2.2. Molecular Docking-Based Virtual Screening
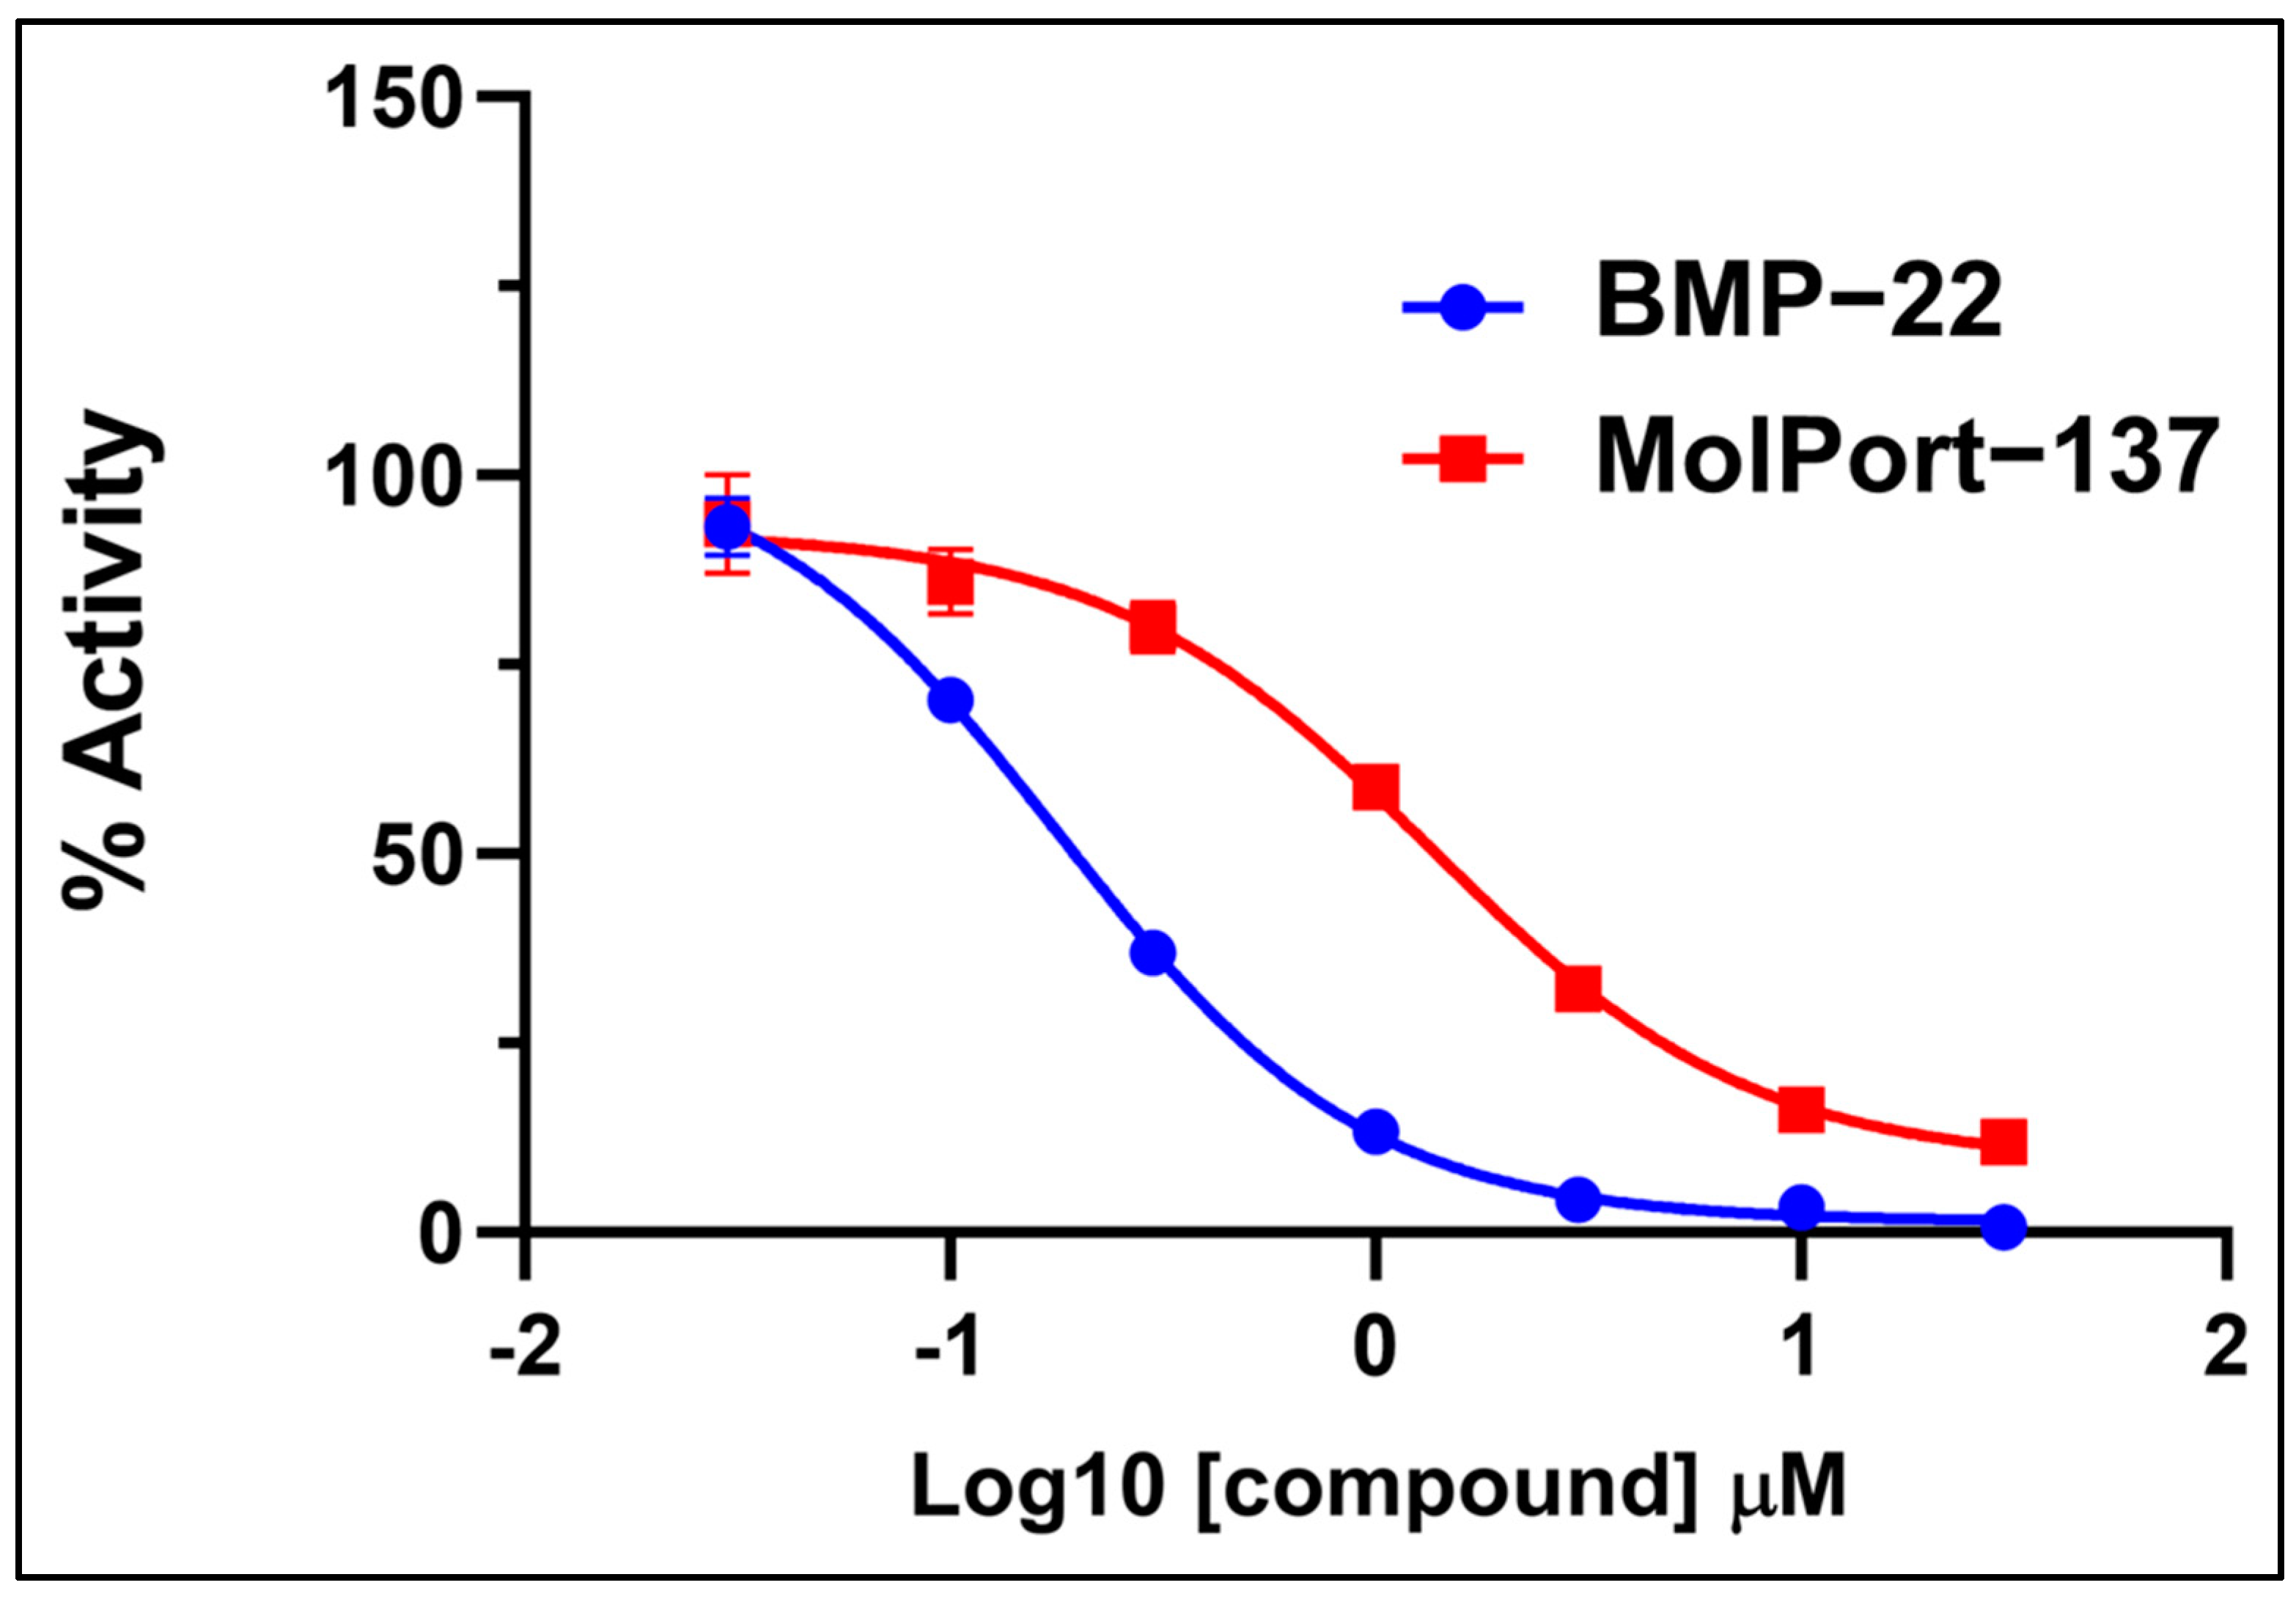
2.3. Autotaxin Enzyme Inhibition Assay
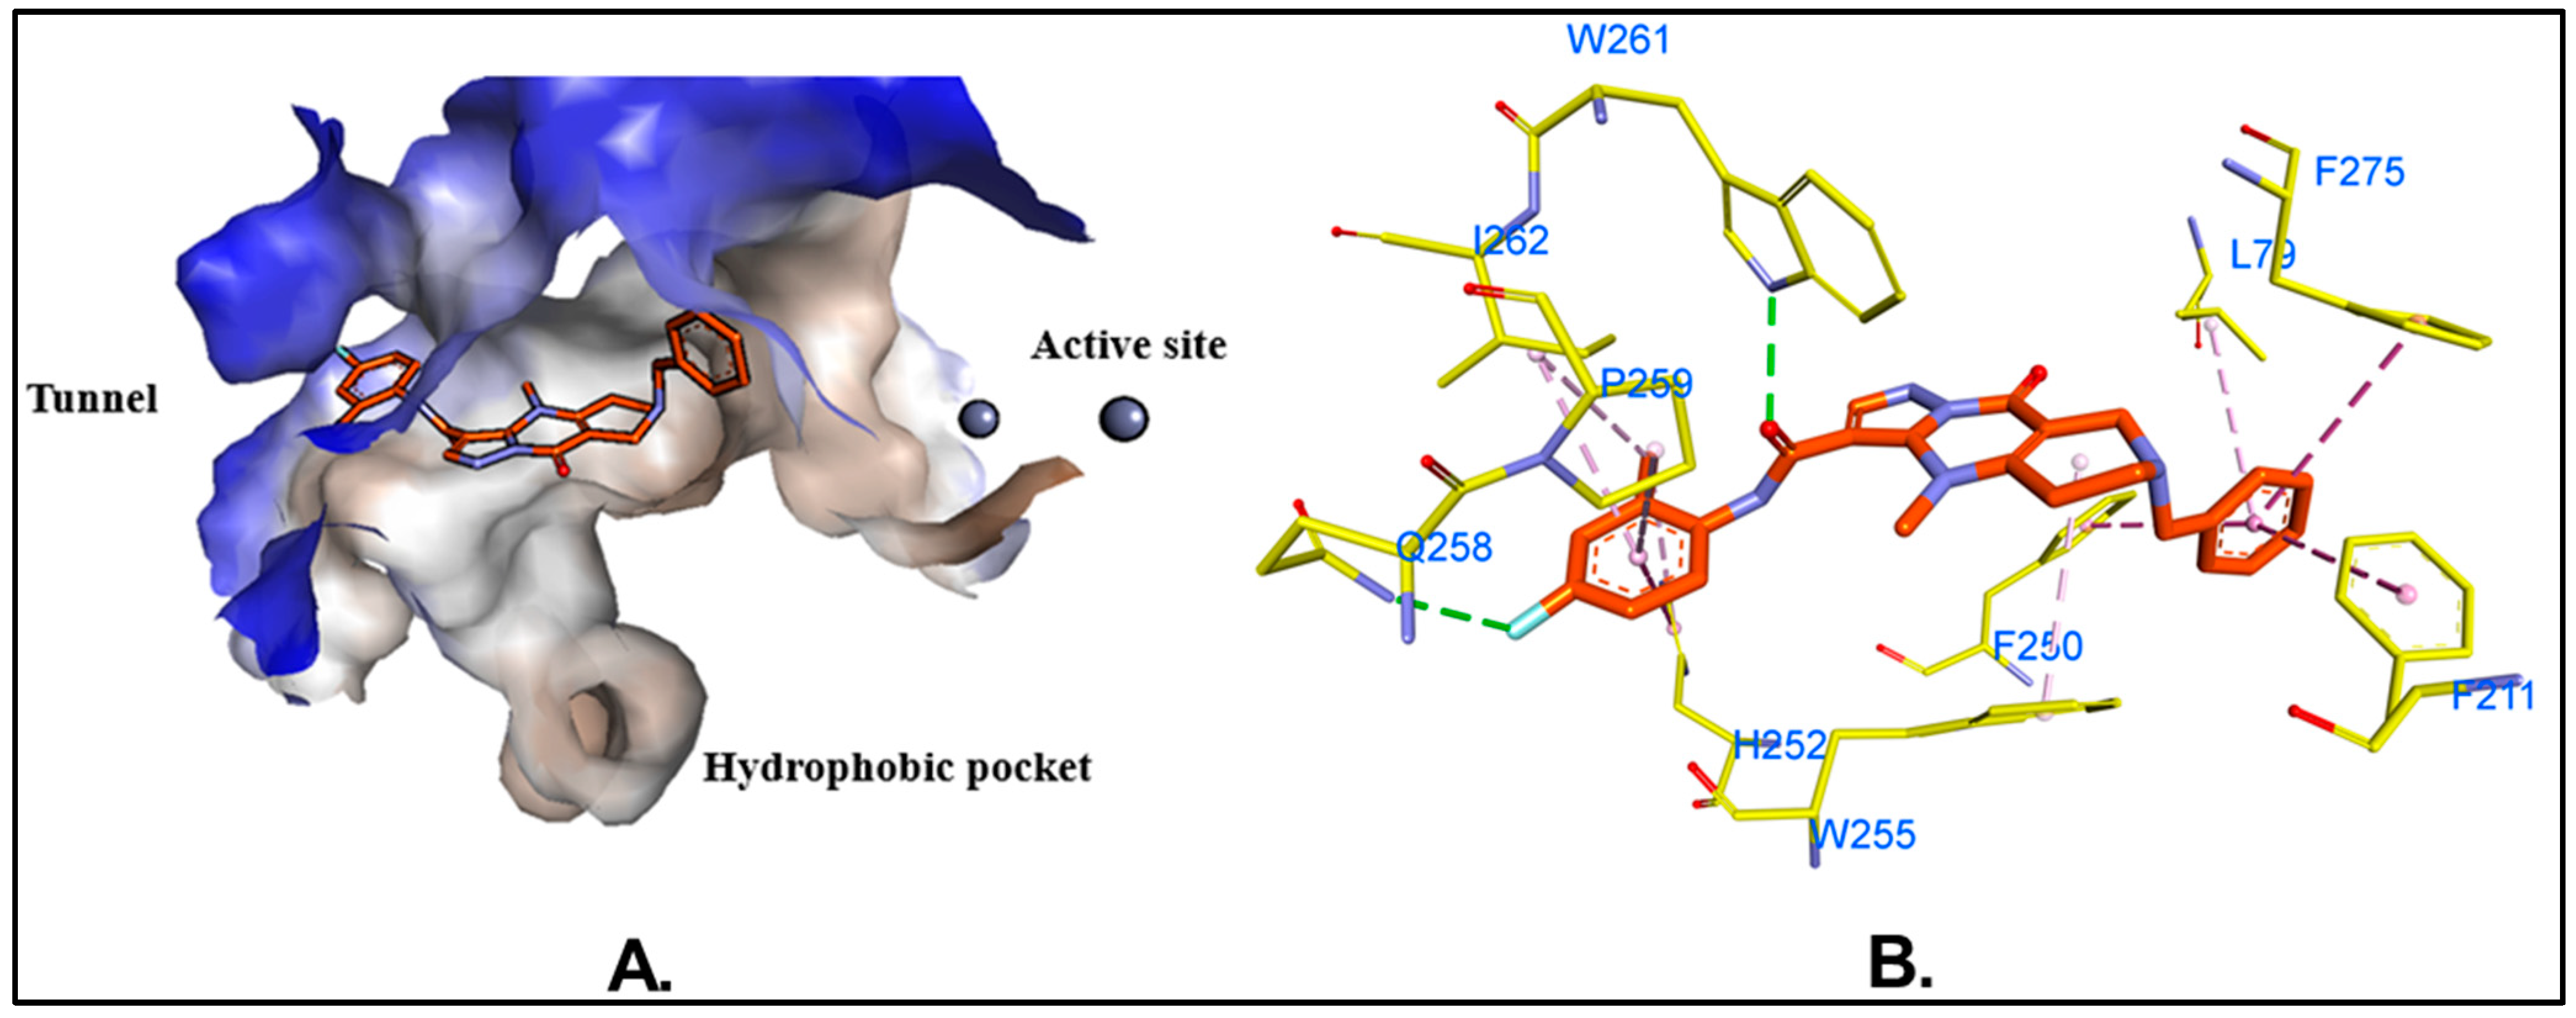
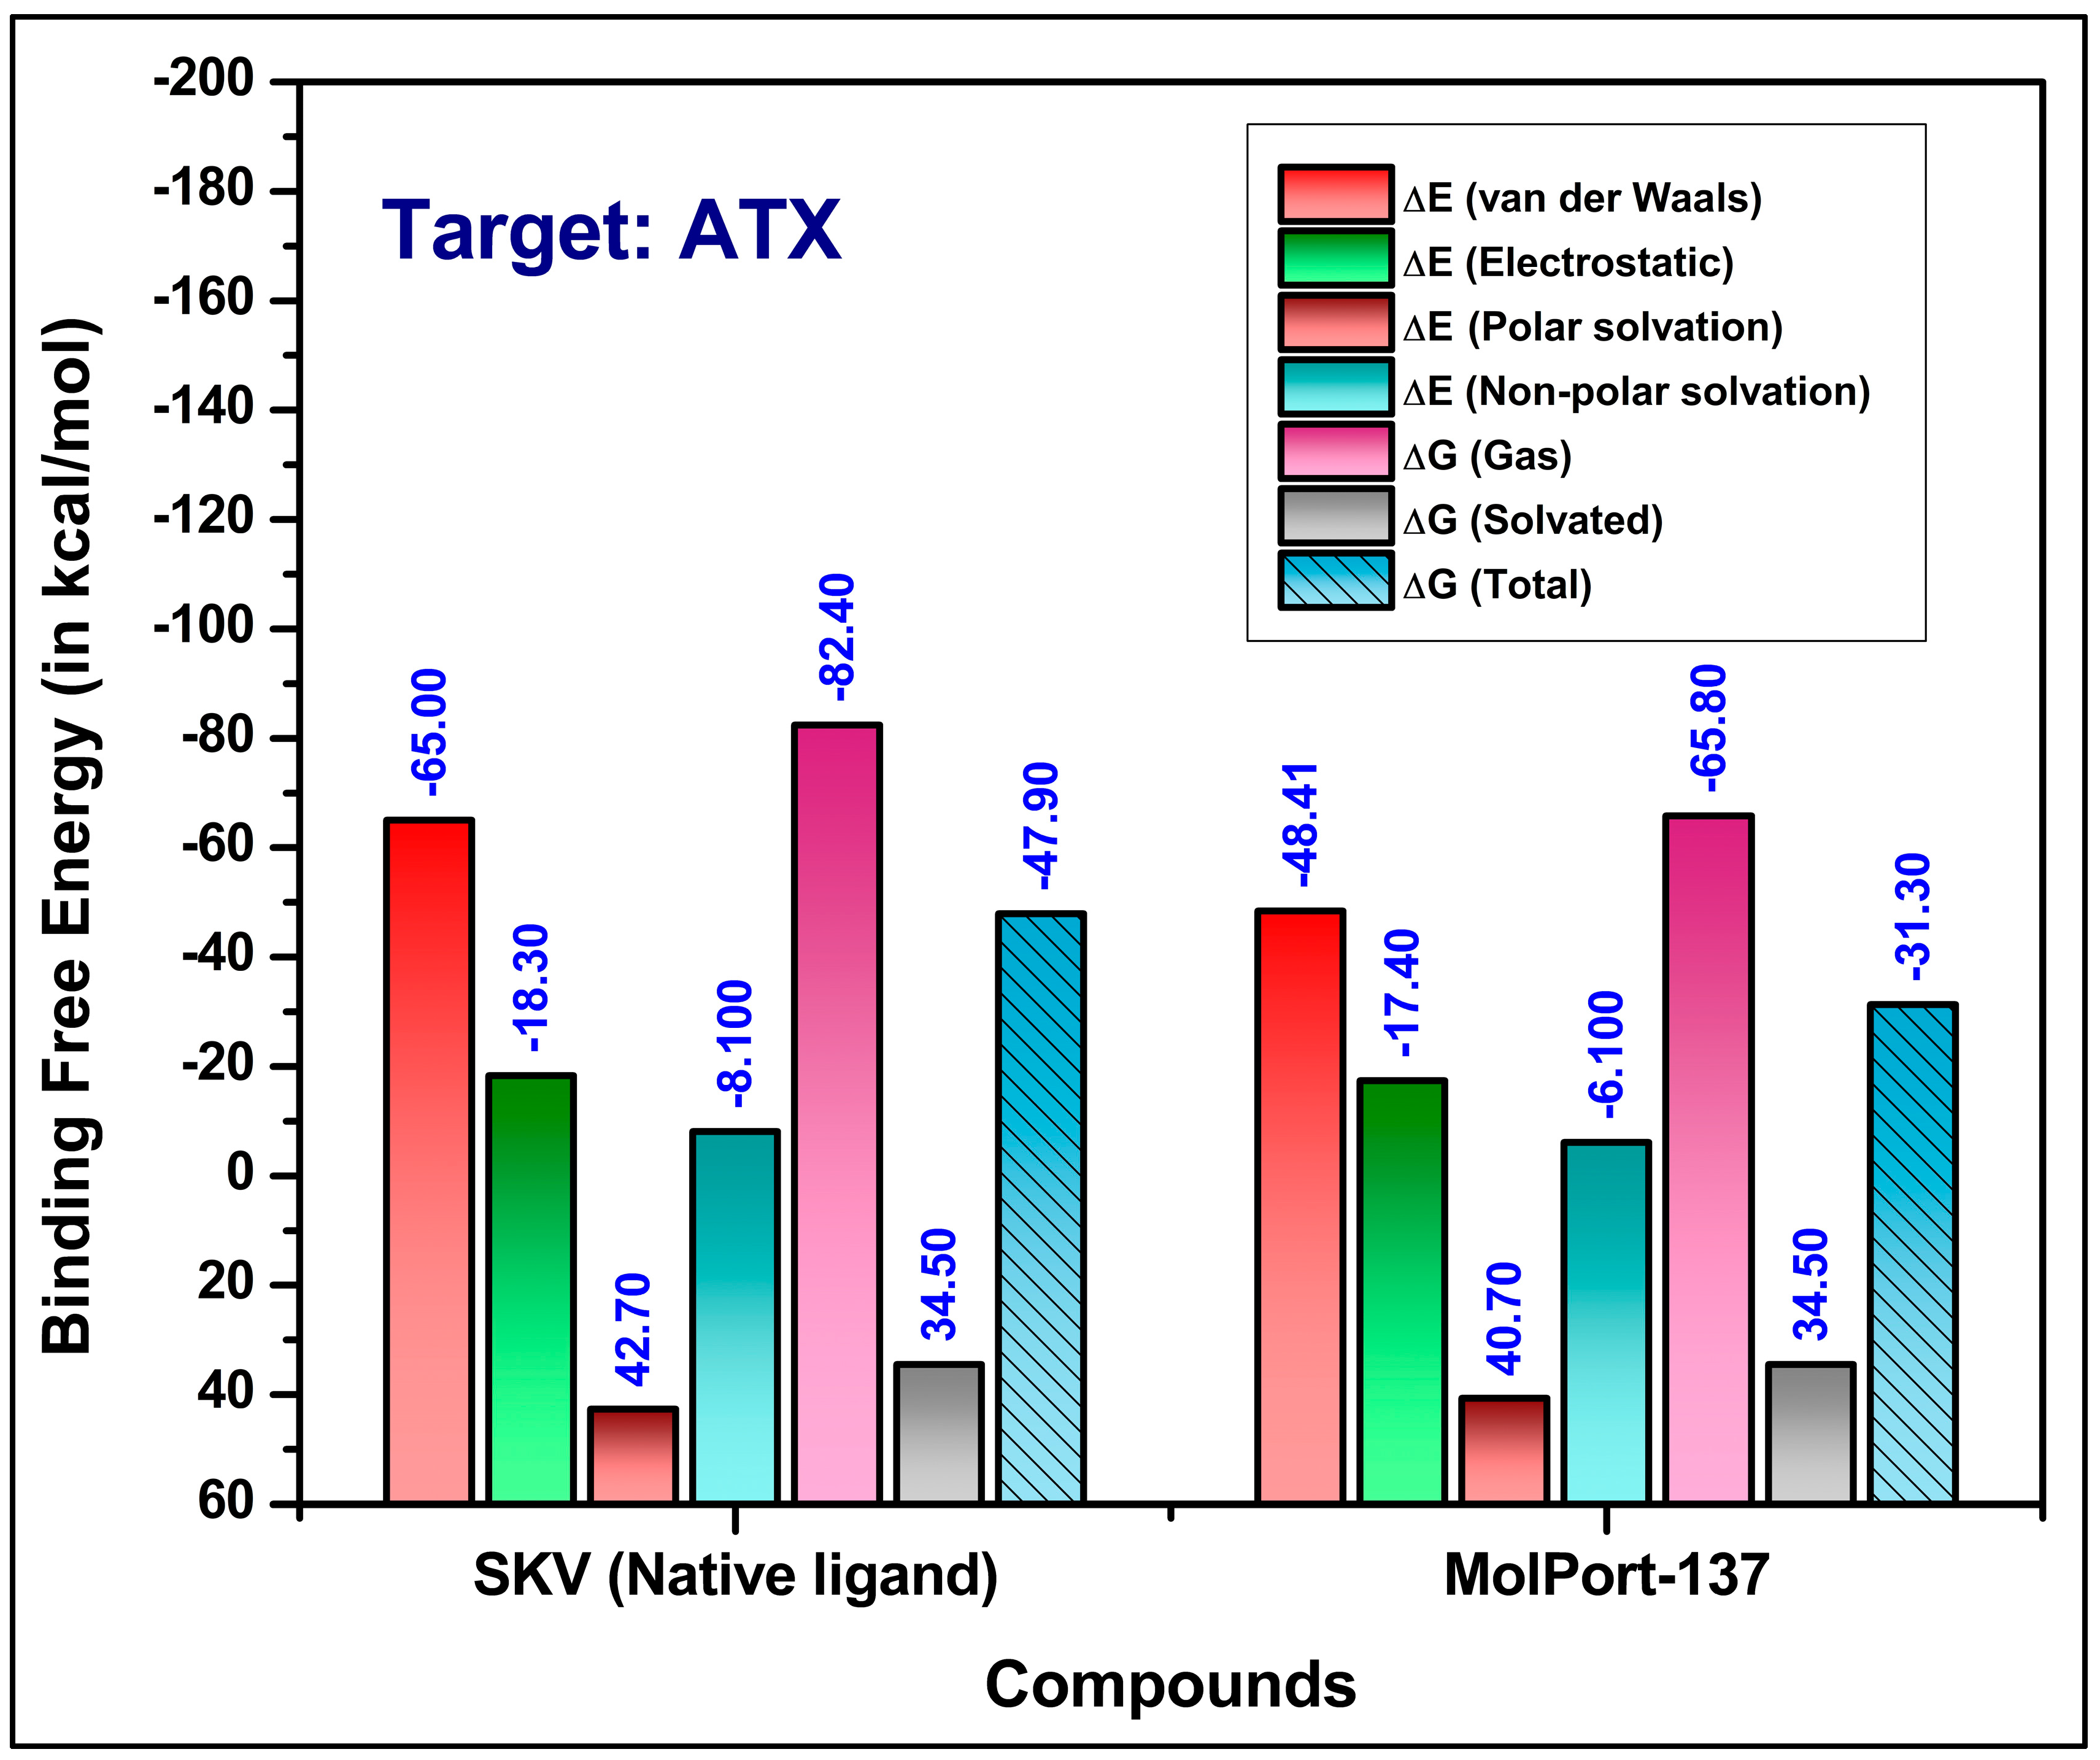
2.4. Molecular Dynamics (MD) Simulations and Binding Free Energy Calculations
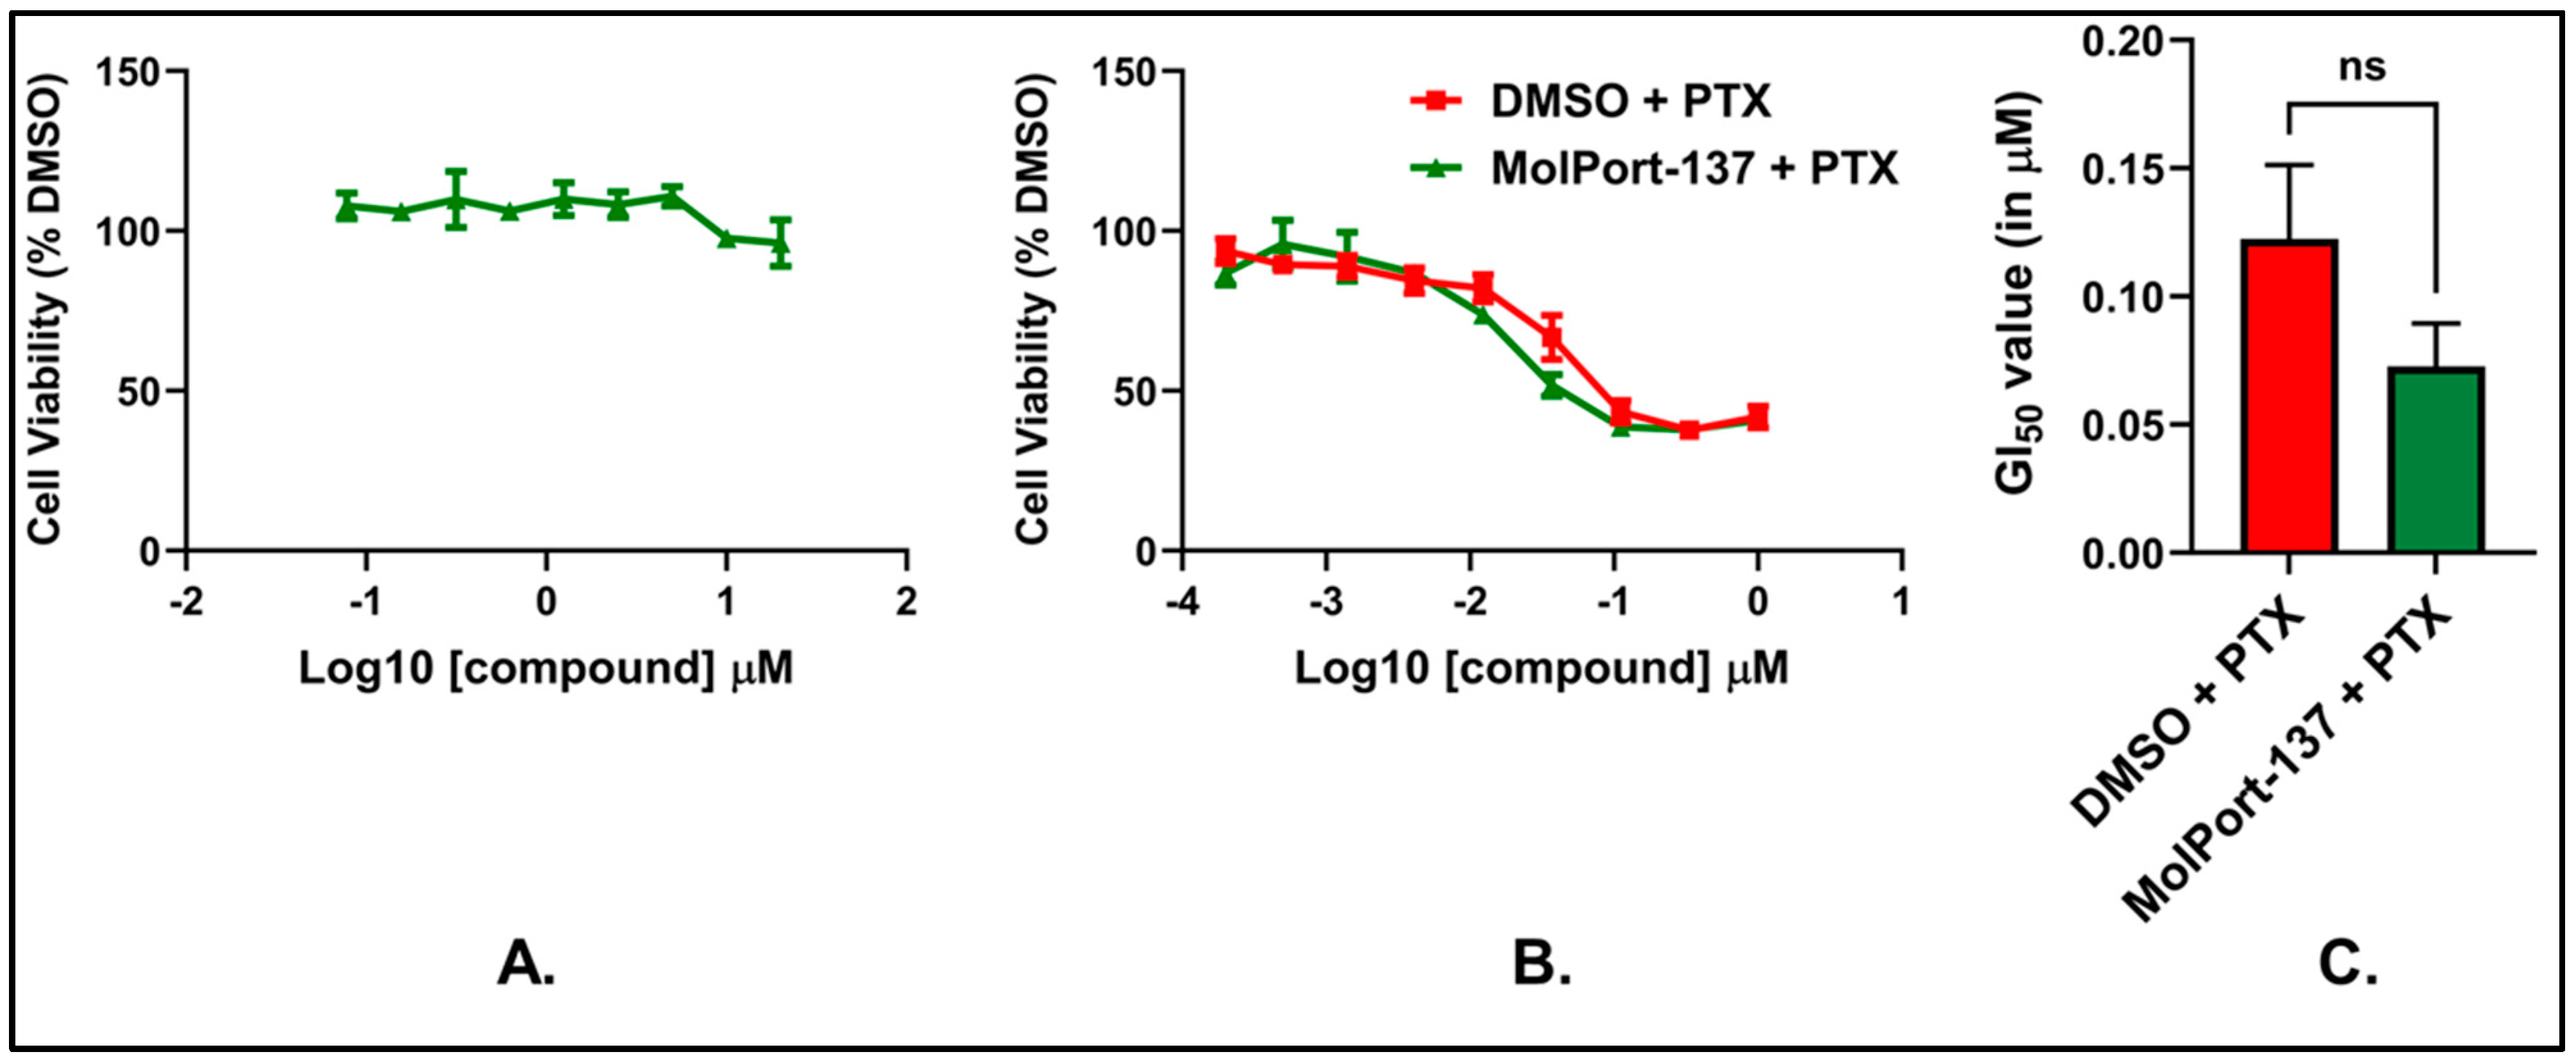
2.5. MolPort-137 Improves the Efficacy of PTX Treatment in Murine Breast Carcinoma Cells
2.6. MolPort-137 Does Not Exhibit Cytotoxicity When Used Alone
2.7. Chemical Stability of MolPort-137
3. Materials and Methods
3.1. Computational Details
3.2. Generation of Structure-Based Pharmacophores
3.3. Virtual Screening Using Pharmacophore Models
3.4. Molecular Docking
3.5. Molecular Dynamics (MD) Simulations
3.6. Binding Free Energy Calculations
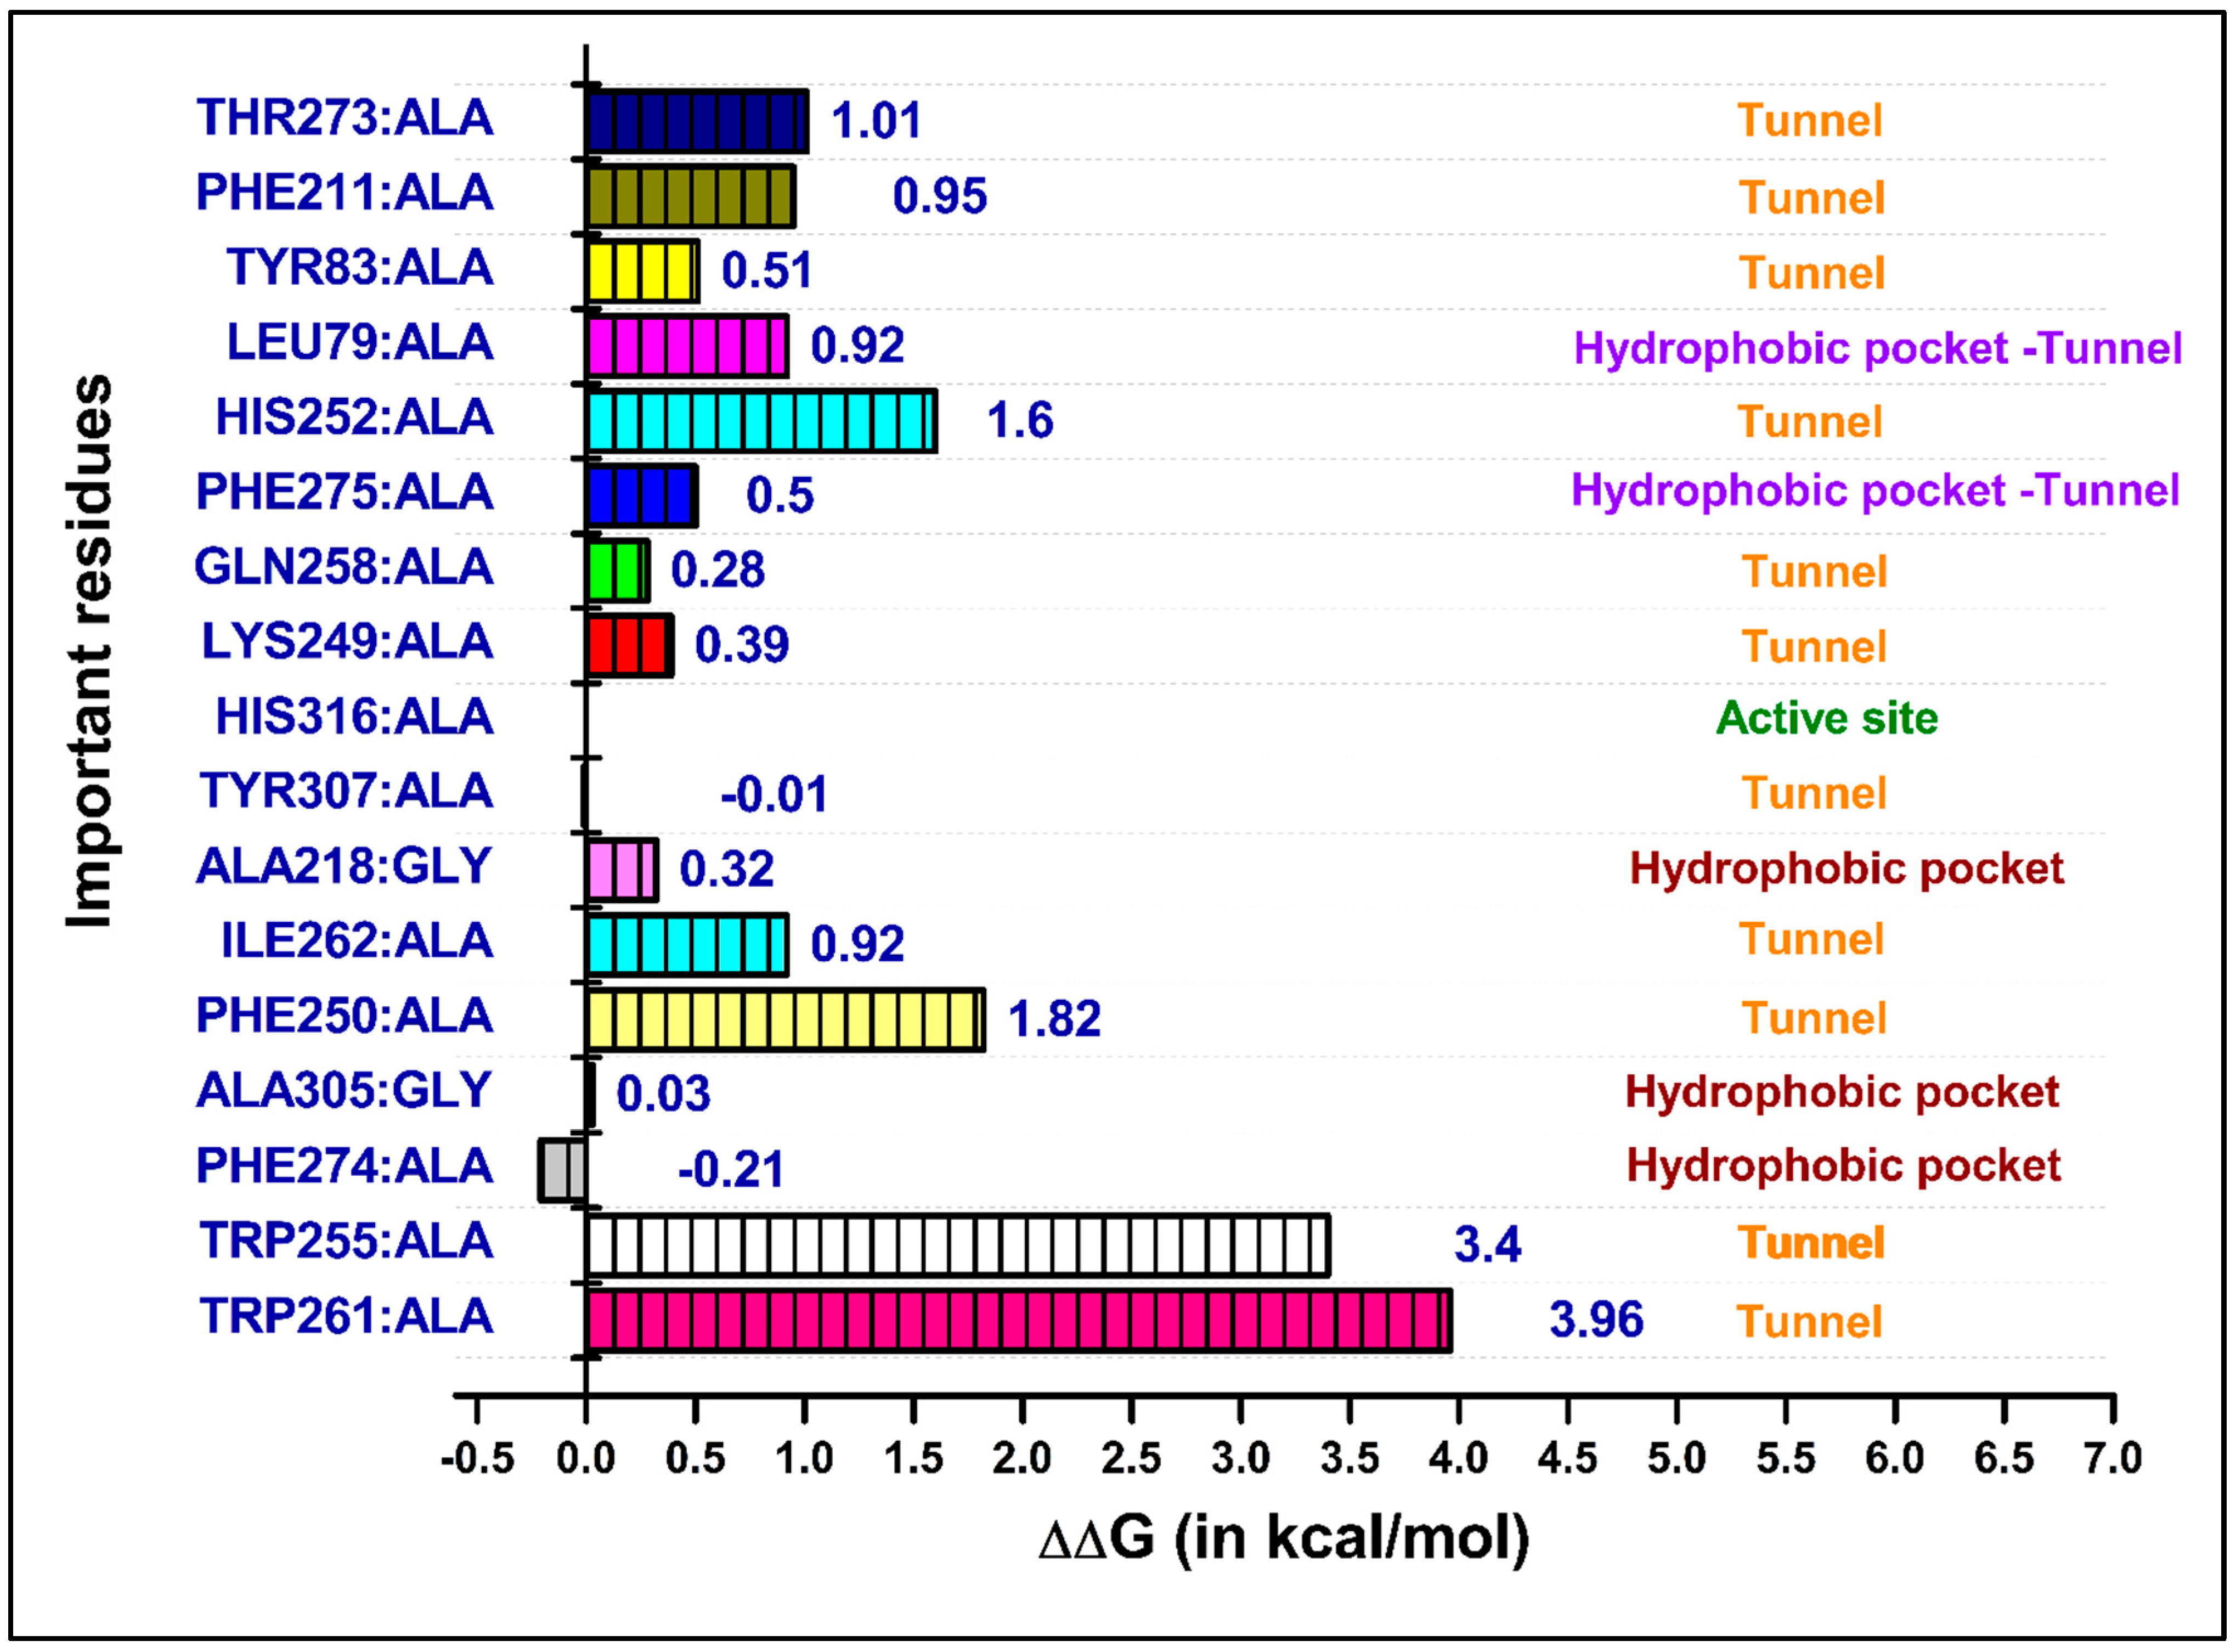
3.7. Computational Alanine Scanning Mutagenesis
3.8. Experimental Details
3.8.1. Compounds/Samples
3.8.2. Cell-Free ATX Enzyme Inhibition Experiment
3.8.3. Cell Viability Assay
3.8.4. In Vitro Chemical Stability Study
4. Conclusions
Supplementary Materials
Author Contributions
Funding
Institutional Review Board Statement
Informed Consent Statement
Data Availability Statement
Acknowledgments
Conflicts of Interest
Abbreviations
References
- Salgado-Polo, F.; Borza, R.; Matsoukas, M.-T.; Marsais, F.; Jagerschmidt, C.; Waeckel, L.; Moolenaar, W.H.; Ford, P.; Heckmann, B.; Perrakis, A. Autotaxin Facilitates Selective LPA Receptor Signaling. Cell Chem. Biol. 2023, 30, 69–84.e14. [Google Scholar] [CrossRef] [PubMed]
- Perrakis, A.; Moolenaar, W.H. Autotaxin: Structure-Function and Signaling. J. Lipid Res. 2014, 55, 1010–1018. [Google Scholar] [CrossRef] [PubMed]
- Kaffe, E.; Magkrioti, C.; Aidinis, V. Deregulated Lysophosphatidic Acid Metabolism and Signaling in Liver Cancer. Cancers 2019, 11, 1626. [Google Scholar] [CrossRef] [PubMed]
- Ninou, I.; Magkrioti, C.; Aidinis, V. Autotaxin in Pathophysiology and Pulmonary Fibrosis. Front. Med. 2018, 5, 180. [Google Scholar] [CrossRef]
- Brindley, D.N.; Lin, F.-T.; Tigyi, G.J. Role of the Autotaxin–Lysophosphatidate Axis in Cancer Resistance to Chemotherapy and Radiotherapy. Biochim. Biophys. Acta Mol. Cell Biol. Lipids 2013, 1831, 74–85. [Google Scholar] [CrossRef]
- Houben, A.J.S.; Moolenaar, W.H. Autotaxin and LPA Receptor Signaling in Cancer. Cancer Metastasis Rev. 2011, 30, 557–565. [Google Scholar] [CrossRef]
- Barbayianni, E.; Kaffe, E.; Aidinis, V.; Kokotos, G. Autotaxin, a Secreted Lysophospholipase D, as a Promising Therapeutic Target in Chronic Inflammation and Cancer. Prog. Lipid Res. 2015, 58, 76–96. [Google Scholar] [CrossRef] [PubMed]
- Quan, M.; Cui, J.; Feng, X.; Huang, Q. The Critical Role and Potential Target of the Autotaxin/Lysophosphatidate Axis in Pancreatic Cancer. Tumor Biol. 2017, 39, 101042831769454. [Google Scholar] [CrossRef]
- Benesch, M.; MacIntyre, I.; McMullen, T.; Brindley, D. Coming of Age for Autotaxin and Lysophosphatidate Signaling: Clinical Applications for Preventing, Detecting and Targeting Tumor-Promoting Inflammation. Cancers 2018, 10, 73. [Google Scholar] [CrossRef] [PubMed]
- Leblanc, R.; Peyruchaud, O. New Insights into the Autotaxin/LPA Axis in Cancer Development and Metastasis. Exp. Cell Res. 2015, 333, 183–189. [Google Scholar] [CrossRef] [PubMed]
- Benesch, M.G.; Wu, R.; Tang, X.; Brindley, D.N.; Ishikawa, T.; Takabe, K. Autotaxin Production in the Human Breast Cancer Tumor Microenvironment Mitigates Tumor Progression in Early Breast Cancers. Am. J. Cancer Res. 2023, 13, 2790–2813. [Google Scholar]
- Drosouni, A.; Panagopoulou, M.; Aidinis, V.; Chatzaki, E. Autotaxin in Breast Cancer: Role, Epigenetic Regulation and Clinical Implications. Cancers 2022, 14, 5437. [Google Scholar] [CrossRef]
- Turner, J.A.; Fredrickson, M.A.; D’Antonio, M.; Katsnelson, E.; MacBeth, M.; Van Gulick, R.; Chimed, T.-S.; McCarter, M.; D’Alessandro, A.; Robinson, W.A.; et al. Lysophosphatidic Acid Modulates CD8 T Cell Immunosurveillance and Metabolism to Impair Anti-Tumor Immunity. Nat. Commun. 2023, 14, 3214. [Google Scholar] [CrossRef] [PubMed]
- Matas-Rico, E.; Frijlink, E.; van der Haar Àvila, I.; Menegakis, A.; van Zon, M.; Morris, A.J.; Koster, J.; Salgado-Polo, F.; de Kivit, S.; Lança, T.; et al. Autotaxin Impedes Anti-Tumor Immunity by Suppressing Chemotaxis and Tumor Infiltration of CD8+ T Cells. Cell Rep. 2021, 37, 110013. [Google Scholar] [CrossRef]
- Peyruchaud, O.; Saier, L.; Leblanc, R. Autotaxin Implication in Cancer Metastasis and Autoimunne Disorders: Functional Implication of Binding Autotaxin to the Cell Surface. Cancers 2019, 12, 105. [Google Scholar] [CrossRef]
- Liu, S.; Umezu-Goto, M.; Murph, M.; Lu, Y.; Liu, W.; Zhang, F.; Yu, S.; Stephens, L.C.; Cui, X.; Murrow, G.; et al. Expression of Autotaxin and Lysophosphatidic Acid Receptors Increases Mammary Tumorigenesis, Invasion, and Metastases. Cancer Cell 2009, 15, 539–550. [Google Scholar] [CrossRef] [PubMed]
- Auciello, F.R.; Bulusu, V.; Oon, C.; Tait-Mulder, J.; Berry, M.; Bhattacharyya, S.; Tumanov, S.; Allen-Petersen, B.L.; Link, J.; Kendsersky, N.D.; et al. A Stromal Lysolipid–Autotaxin Signaling Axis Promotes Pancreatic Tumor Progression. Cancer Discov. 2019, 9, 617–627. [Google Scholar] [CrossRef]
- Tang, X.; Wuest, M.; Benesch, M.G.K.; Dufour, J.; Zhao, Y.; Curtis, J.M.; Monjardet, A.; Heckmann, B.; Murray, D.; Wuest, F.; et al. Inhibition of Autotaxin with GLPG1690 Increases the Efficacy of Radiotherapy and Chemotherapy in a Mouse Model of Breast Cancer. Mol. Cancer Ther. 2020, 19, 63–74. [Google Scholar] [CrossRef] [PubMed]
- Banerjee, S.; Norman, D.D.; Lee, S.C.; Parrill, A.L.; Pham, T.C.T.; Baker, D.L.; Tigyi, G.J.; Miller, D.D. Highly Potent Non-Carboxylic Acid Autotaxin Inhibitors Reduce Melanoma Metastasis and Chemotherapeutic Resistance of Breast Cancer Stem Cells. J. Med. Chem. 2017, 60, 1309–1324. [Google Scholar] [CrossRef] [PubMed]
- Venkatraman, G.; Benesch, M.G.K.; Tang, X.; Dewald, J.; McMullen, T.P.W.; Brindley, D.N. Lysophosphatidate Signaling Stabilizes Nrf2 and Increases the Expression of Genes Involved in Drug Resistance and Oxidative Stress Responses: Implications for Cancer Treatment. FASEB J. 2015, 29, 772–785. [Google Scholar] [CrossRef] [PubMed]
- Bernacchioni, C.; Cencetti, F.; Ouro, A.; Bruno, M.; Gomez-Muñoz, A.; Donati, C.; Bruni, P. Lysophosphatidic Acid Signaling Axis Mediates Ceramide 1-Phosphate-Induced Proliferation of C2C12 Myoblasts. Int. J. Mol. Sci. 2018, 19, 139. [Google Scholar] [CrossRef] [PubMed]
- Ishdorj, G.; Graham, B.A.; Hu, X.; Chen, J.; Johnston, J.B.; Fang, X.; Gibson, S.B. Lysophosphatidic Acid Protects Cancer Cells from Histone Deacetylase (HDAC) Inhibitor-Induced Apoptosis through Activation of HDAC. J. Biol. Chem. 2008, 283, 16818–16829. [Google Scholar] [CrossRef] [PubMed]
- Banerjee, S.; Lee, S.; Norman, D.D.; Tigyi, G.J. Designing Dual Inhibitors of Autotaxin-LPAR GPCR Axis. Molecules 2022, 27, 5487. [Google Scholar] [CrossRef]
- Benesch, M.G.K.; Tang, X.; Brindley, D.N.; Takabe, K. Autotaxin and Lysophosphatidate Signaling: Prime Targets for Mitigating Therapy Resistance in Breast Cancer. World J. Oncol. 2024, 15, 1–13. [Google Scholar] [CrossRef] [PubMed]
- Gierse, J.; Thorarensen, A.; Beltey, K.; Bradshaw-Pierce, E.; Cortes-Burgos, L.; Hall, T.; Johnston, A.; Murphy, M.; Nemirovskiy, O.; Ogawa, S.; et al. A Novel Autotaxin Inhibitor Reduces Lysophosphatidic Acid Levels in Plasma and the Site of Inflammation. J. Pharmacol. Exp. Ther. 2010, 334, 310–317. [Google Scholar] [CrossRef]
- Fells, J.I.; Lee, S.C.; Fujiwara, Y.; Norman, D.D.; Lim, K.G.; Tsukahara, R.; Liu, J.; Patil, R.; Miller, D.D.; Kirby, R.J.; et al. Hits of a High-Throughput Screen Identify the Hydrophobic Pocket of Autotaxin/Lysophospholipase D As an Inhibitory Surface. Mol. Pharmacol. 2013, 84, 415–424. [Google Scholar] [CrossRef] [PubMed]
- Stein, A.J.; Bain, G.; Prodanovich, P.; Santini, A.M.; Darlington, J.; Stelzer, N.M.P.; Sidhu, R.S.; Schaub, J.; Goulet, L.; Lonergan, D.; et al. Structural Basis for Inhibition of Human Autotaxin by Four Potent Compounds with Distinct Modes of Binding. Mol. Pharmacol. 2015, 88, 982–992. [Google Scholar] [CrossRef] [PubMed]
- Desroy, N.; Housseman, C.; Bock, X.; Joncour, A.; Bienvenu, N.; Cherel, L.; Labeguere, V.; Rondet, E.; Peixoto, C.; Grassot, J.-M.; et al. Discovery of 2-[[2-Ethyl-6-[4-[2-(3-Hydroxyazetidin-1-Yl)-2-Oxoethyl]Piperazin-1-Yl]-8-Methylimidazo [1,2-a]Pyridin-3-Yl]Methylamino]-4-(4-Fluorophenyl)Thiazole-5-Carbonitrile (GLPG1690), a First-in-Class Autotaxin Inhibitor Undergoing Clinical Evaluation for the Treatment of Idiopathic Pulmonary Fibrosis. J. Med. Chem. 2017, 60, 3580–3590. [Google Scholar] [CrossRef] [PubMed]
- Clark, J.M.; Salgado-Polo, F.; Macdonald, S.J.F.; Barrett, T.N.; Perrakis, A.; Jamieson, C. Structure-Based Design of a Novel Class of Autotaxin Inhibitors Based on Endogenous Allosteric Modulators. J. Med. Chem. 2022, 65, 6338–6351. [Google Scholar] [CrossRef] [PubMed]
- Zhang, C.; Liu, Y.; Zhou, Q.; Fan, H.; Liu, X.; Hu, J. Recent Research Advances in ATX Inhibitors: An Overview of Primary Literature. Bioorganic Med. Chem. 2023, 90, 117374. [Google Scholar] [CrossRef]
- Meng, F.; Yin, Z.; Lu, F.; Wang, W.; Zhang, H. Disruption of LPA-LPAR1 Pathway Results in Lung Tumor Growth Inhibition by Downregulating B7-H3 Expression in Fibroblasts. Thorac. Cancer 2024, 15, 316–326. [Google Scholar] [CrossRef] [PubMed]
- Komachi, M.; Sato, K.; Tobo, M.; Mogi, C.; Yamada, T.; Ohta, H.; Tomura, H.; Kimura, T.; Im, D.; Yanagida, K.; et al. Orally Active Lysophosphatidic Acid Receptor Antagonist Attenuates Pancreatic Cancer Invasion and Metastasis in Vivo. Cancer Sci. 2012, 103, 1099–1104. [Google Scholar] [CrossRef] [PubMed]
- Yang, S.-Y. Pharmacophore Modeling and Applications in Drug Discovery: Challenges and Recent Advances. Drug Discov. Today 2010, 15, 444–450. [Google Scholar] [CrossRef]
- Giordano, D.; Biancaniello, C.; Argenio, M.A.; Facchiano, A. Drug Design by Pharmacophore and Virtual Screening Approach. Pharmaceuticals 2022, 15, 646. [Google Scholar] [CrossRef] [PubMed]
- Gupte, R.; Patil, R.; Liu, J.; Wang, Y.; Lee, S.C.; Fujiwara, Y.; Fells, J.; Bolen, A.L.; Emmons-Thompson, K.; Yates, C.R.; et al. Benzyl and Naphthalene Methylphosphonic Acid Inhibitors of Autotaxin with Anti-invasive and Anti-metastatic Activity. Chem. Med. Chem. 2011, 6, 922–935. [Google Scholar] [CrossRef]
- Salgado-Polo, F.; Perrakis, A. The Structural Binding Mode of the Four Autotaxin Inhibitor Types That Differentially Affect Catalytic and Non-Catalytic Functions. Cancers 2019, 11, 1577. [Google Scholar] [CrossRef] [PubMed]
- Daina, A.; Michielin, O.; Zoete, V. SwissADME: A Free Web Tool to Evaluate Pharmacokinetics, Drug-Likeness and Medicinal Chemistry Friendliness of Small Molecules. Sci. Rep. 2017, 7, 42717. [Google Scholar] [CrossRef]
- Pires, D.E.V.; Blundell, T.L.; Ascher, D.B. PkCSM: Predicting Small-Molecule Pharmacokinetic and Toxicity Properties Using Graph-Based Signatures. J. Med. Chem. 2015, 58, 4066–4072. [Google Scholar] [CrossRef] [PubMed]
- Iwaki, Y.; Ohhata, A.; Nakatani, S.; Hisaichi, K.; Okabe, Y.; Hiramatsu, A.; Watanabe, T.; Yamamoto, S.; Nishiyama, T.; Kobayashi, J.; et al. ONO-8430506: A Novel Autotaxin Inhibitor That Enhances the Antitumor Effect of Paclitaxel in a Breast Cancer Model. ACS Med. Chem. Lett. 2020, 11, 1335–1341. [Google Scholar] [CrossRef]
- Wolber, G.; Langer, T. LigandScout: 3-D Pharmacophores Derived from Protein-Bound Ligands and Their Use as Virtual Screening Filters. J. Chem. Inf. Model. 2005, 45, 160–169. [Google Scholar] [CrossRef] [PubMed]
- Dallakyan, S.; Olson, A.J. Small-Molecule Library Screening by Docking with PyRx. Methods Mol. Biol. 2015, 1263, 243–250. [Google Scholar] [CrossRef] [PubMed]
- Trott, O.; Olson, A.J. AutoDock Vina: Improving the Speed and Accuracy of Docking with a New Scoring Function, Efficient Optimization, and Multithreading. J. Comput. Chem. 2010, 31, 455–461. [Google Scholar] [CrossRef] [PubMed]
- Abraham, M.J.; Murtola, T.; Schulz, R.; Páll, S.; Smith, J.C.; Hess, B.; Lindahl, E. GROMACS: High Performance Molecular Simulations through Multi-Level Parallelism from Laptops to Supercomputers. SoftwareX 2015, 1, 19–25. [Google Scholar] [CrossRef]
- Valdés-Tresanco, M.S.; Valdés-Tresanco, M.E.; Valiente, P.A.; Moreno, E. Gmx_MMPBSA: A New Tool to Perform End-State Free Energy Calculations with GROMACS. J. Chem. Theory Comput. 2021, 17, 6281–6291. [Google Scholar] [CrossRef] [PubMed]
- Dassault Systèmes. BIOVIA, Discovery Studio Visualizer 2020. Available online: https://discover.3ds.com/discovery-studio-visualizer-download (accessed on 20 August 2022).
- Cuozzo, J.W.; Clark, M.A.; Keefe, A.D.; Kohlmann, A.; Mulvihill, M.; Ni, H.; Renzetti, L.M.; Resnicow, D.I.; Ruebsam, F.; Sigel, E.A.; et al. Novel Autotaxin Inhibitor for the Treatment of Idiopathic Pulmonary Fibrosis: A Clinical Candidate Discovered Using DNA-Encoded Chemistry. J. Med. Chem. 2020, 63, 7840–7856. [Google Scholar] [CrossRef]
- Guex, N.; Peitsch, M.C. SWISS-MODEL and the Swiss-Pdb Viewer: An Environment for Comparative Protein Modeling. Electrophoresis 1997, 18, 2714–2723. [Google Scholar] [CrossRef]
- Halgren, T.A.; Nachbar, R.B. Merck Molecular Force Field. IV. Conformational Energies and Geometries for MMFF94. J. Comput. Chem. 1996, 17, 587–615. [Google Scholar] [CrossRef]
- Chrencik, J.E.; Roth, C.B.; Terakado, M.; Kurata, H.; Omi, R.; Kihara, Y.; Warshaviak, D.; Nakade, S.; Asmar-Rovira, G.; Mileni, M.; et al. Crystal Structure of Antagonist Bound Human Lysophosphatidic Acid Receptor 1. Cell 2015, 161, 1633–1643. [Google Scholar] [CrossRef] [PubMed]
- Bell, E.W.; Zhang, Y. DockRMSD: An Open-Source Tool for Atom Mapping and RMSD Calculation of Symmetric Molecules through Graph Isomorphism. J. Cheminform. 2019, 11, 40. [Google Scholar] [CrossRef] [PubMed]
- Huang, J.; MacKerell, A.D. CHARMM36 All-Atom Additive Protein Force Field: Validation Based on Comparison to NMR Data. J. Comput. Chem. 2013, 34, 2135–2145. [Google Scholar] [CrossRef]
- Vanommeslaeghe, K.; Hatcher, E.; Acharya, C.; Kundu, S.; Zhong, S.; Shim, J.; Darian, E.; Guvench, O.; Lopes, P.; Vorobyov, I.; et al. CHARMM General Force Field: A Force Field for Drug-like Molecules Compatible with the CHARMM All-atom Additive Biological Force Fields. J. Comput. Chem. 2010, 31, 671–690. [Google Scholar] [CrossRef] [PubMed]
- Onufriev, A.; Bashford, D.; Case, D.A. Exploring Protein Native States and Large-scale Conformational Changes with a Modified Generalized Born Model. Proteins Struct. Funct. Bioinform. 2004, 55, 383–394. [Google Scholar] [CrossRef] [PubMed]
- Weiser, J.; Shenkin, P.S.; Still, W.C. Approximate Atomic Surfaces from Linear Combinations of Pairwise Overlaps (LCPO). J. Comput. Chem. 1999, 20, 217–230. [Google Scholar] [CrossRef]
- Fogolari, F.; Brigo, A.; Molinari, H. Protocol for MM/PBSA Molecular Dynamics Simulations of Proteins. Biophys. J. 2003, 85, 159–166. [Google Scholar] [CrossRef]
- North, E.J.; Howard, A.L.; Wanjala, I.W.; Pham, T.C.T.; Baker, D.L.; Parrill, A.L. Pharmacophore Development and Application Toward the Identification of Novel, Small-Molecule Autotaxin Inhibitors. J. Med. Chem. 2010, 53, 3095–3105. [Google Scholar] [CrossRef]

 : hydrophobic interaction,
  : hydrogen bond donor,
  : hydrogen bond acceptor, and
  : positive ionizable area.
: hydrophobic interaction, : hydrogen bond donor, : hydrogen bond acceptor, and : positive ionizable area.
: positive ionizable area.
: hydrophobic interaction, : hydrogen bond donor, : hydrogen bond acceptor, and : positive ionizable area.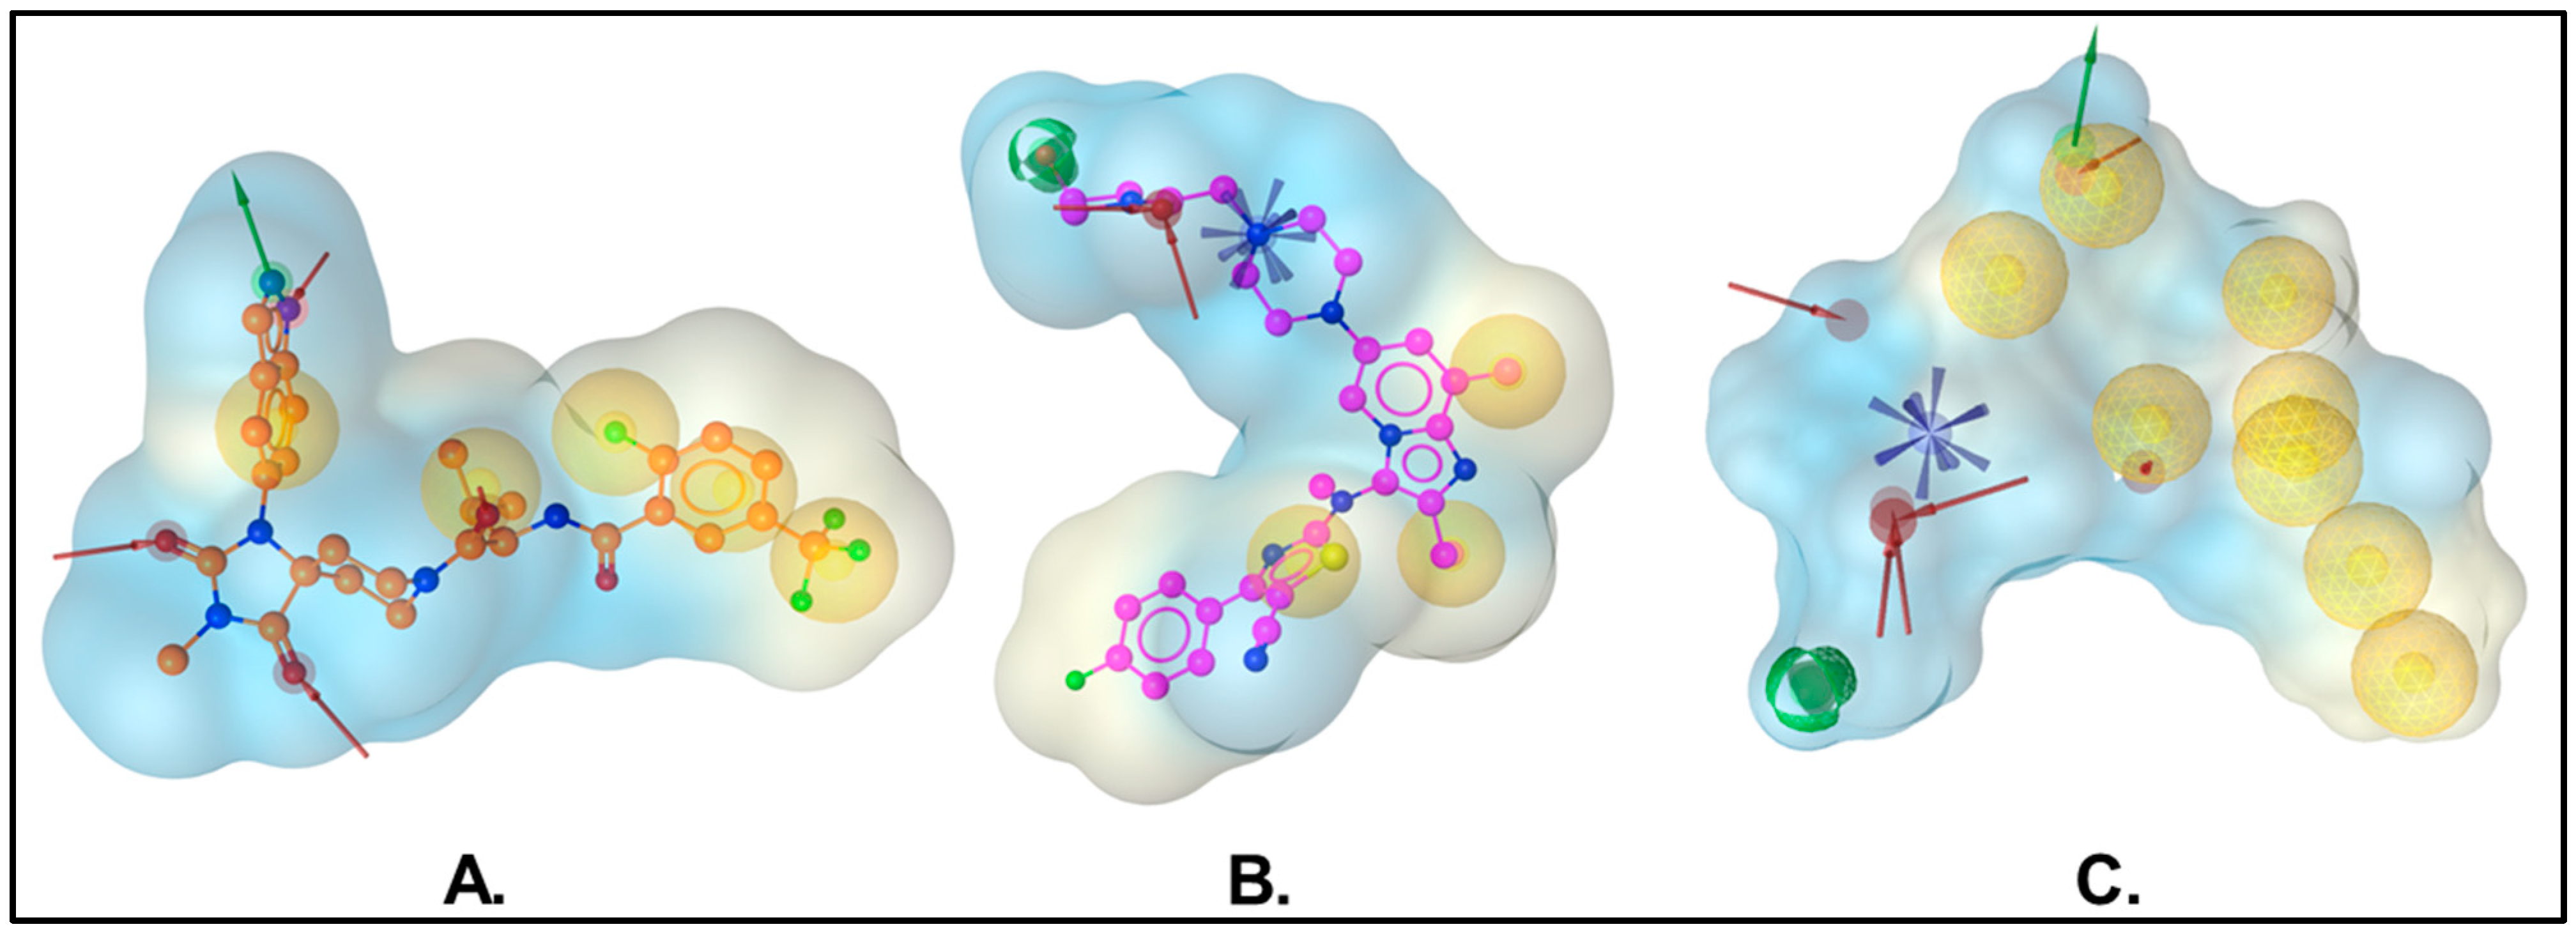


| Residues | Van Der Waals | Electrostatic | Polar Solv. | Non-Polar Solv. | TOTAL | |||||
|---|---|---|---|---|---|---|---|---|---|---|
| Avg. | Std. Err. of Mean | Avg. | Std. Err. of Mean | Avg. | Std. Err. of Mean | Avg. | Std. Err. of Mean | Avg. | Std. Err. of Mean | |
| LEU:79 | −1.01 | 0.00 | −0.19 | 0.00 | 0.42 | 0.00 | −0.88 | 0.00 | −1.67 | 0.01 |
| SER:82 | −0.27 | 0.00 | −0.15 | 0.00 | 0.13 | 0.00 | −0.24 | 0.00 | −0.54 | 0.00 |
| TYR:83 | −0.31 | 0.00 | −0.42 | 0.01 | 0.29 | 0.00 | −0.20 | 0.00 | −0.65 | 0.01 |
| PHE:211 | −1.36 | 0.00 | 0.01 | 0.00 | 0.30 | 0.00 | −1.09 | 0.00 | −2.14 | 0.00 |
| LEU:214 | −0.33 | 0.00 | 0.18 | 0.00 | −0.15 | 0.00 | −0.23 | 0.00 | −0.54 | 0.00 |
| TYR:215 | −1.14 | 0.00 | 0.20 | 0.00 | −0.08 | 0.00 | −0.78 | 0.00 | −1.80 | 0.00 |
| PHE:242 | −0.20 | 0.00 | 0.11 | 0.00 | −0.06 | 0.00 | −0.06 | 0.00 | −0.21 | 0.00 |
| LEU:244 | −0.94 | 0.00 | −0.17 | 0.00 | 0.33 | 0.00 | −0.83 | 0.00 | −1.62 | 0.00 |
| LYS:249 | −0.88 | 0.00 | −0.06 | 0.01 | −0.07 | 0.01 | −0.64 | 0.00 | −1.65 | 0.01 |
| PHE:250 | −2.05 | 0.01 | −0.16 | 0.00 | 0.36 | 0.00 | −1.47 | 0.00 | −3.32 | 0.01 |
| ASN:251 | −0.23 | 0.00 | −0.10 | 0.00 | 0.10 | 0.00 | −0.04 | 0.00 | −0.26 | 0.00 |
| HIS:252 | −1.63 | 0.01 | −0.89 | 0.01 | 0.41 | 0.01 | −1.47 | 0.01 | −3.57 | 0.01 |
| TRP:255 | −3.63 | 0.01 | −0.70 | 0.00 | 0.50 | 0.00 | −2.55 | 0.00 | −6.37 | 0.01 |
| PRO:259 | −1.02 | 0.00 | −0.18 | 0.00 | 0.40 | 0.00 | −0.61 | 0.00 | −1.41 | 0.01 |
| TRP:261 | −1.70 | 0.01 | −2.70 | 0.01 | 0.88 | 0.00 | −1.19 | 0.00 | −4.71 | 0.01 |
| ILE:262 | −1.19 | 0.01 | −0.32 | 0.00 | 0.47 | 0.00 | −0.98 | 0.01 | −2.02 | 0.01 |
| PHE:274 | −0.58 | 0.00 | −0.25 | 0.01 | 0.09 | 0.00 | −0.25 | 0.00 | −0.99 | 0.01 |
| PHE:275 | −1.51 | 0.00 | 0.17 | 0.00 | −0.03 | 0.00 | −1.16 | 0.00 | −2.53 | 0.01 |
| MDA-MB-231 Cells | HaCaT Keratinocytes | ||
|---|---|---|---|
| Compounds | GI50 | Compounds | GI50 |
| MolPort-137 | 27 ± 2 µM | MolPort-137 | >100 µM |
| PTX | 02 ± 0 nM | PTX | 02 ± 0 nM |
Disclaimer/Publisher’s Note: The statements, opinions and data contained in all publications are solely those of the individual author(s) and contributor(s) and not of MDPI and/or the editor(s). MDPI and/or the editor(s) disclaim responsibility for any injury to people or property resulting from any ideas, methods, instructions or products referred to in the content. |
© 2025 by the authors. Licensee MDPI, Basel, Switzerland. This article is an open access article distributed under the terms and conditions of the Creative Commons Attribution (CC BY) license (https://creativecommons.org/licenses/by/4.0/).
Share and Cite
Rai, P.; Clark, C.J.; Kardam, V.; Womack, C.B.; Thammathong, J.; Norman, D.D.; Tigyi, G.J.; Bicker, K.; Weissmiller, A.M.; Dubey, K.D.; et al. Structure-Based Discovery of MolPort-137: A Novel Autotaxin Inhibitor That Improves Paclitaxel Efficacy. Int. J. Mol. Sci. 2025, 26, 597. https://doi.org/10.3390/ijms26020597
Rai P, Clark CJ, Kardam V, Womack CB, Thammathong J, Norman DD, Tigyi GJ, Bicker K, Weissmiller AM, Dubey KD, et al. Structure-Based Discovery of MolPort-137: A Novel Autotaxin Inhibitor That Improves Paclitaxel Efficacy. International Journal of Molecular Sciences. 2025; 26(2):597. https://doi.org/10.3390/ijms26020597
Chicago/Turabian StyleRai, Prateek, Christopher J. Clark, Vandana Kardam, Carl B. Womack, Joshua Thammathong, Derek D. Norman, Gábor J. Tigyi, Kevin Bicker, April M. Weissmiller, Kshatresh Dutta Dubey, and et al. 2025. "Structure-Based Discovery of MolPort-137: A Novel Autotaxin Inhibitor That Improves Paclitaxel Efficacy" International Journal of Molecular Sciences 26, no. 2: 597. https://doi.org/10.3390/ijms26020597
APA StyleRai, P., Clark, C. J., Kardam, V., Womack, C. B., Thammathong, J., Norman, D. D., Tigyi, G. J., Bicker, K., Weissmiller, A. M., Dubey, K. D., & Banerjee, S. (2025). Structure-Based Discovery of MolPort-137: A Novel Autotaxin Inhibitor That Improves Paclitaxel Efficacy. International Journal of Molecular Sciences, 26(2), 597. https://doi.org/10.3390/ijms26020597