Article

Genome-Wide Analysis of the Aspartate Aminotransferase Family in Brassica rapa and the Role of BraASP1 in Response to Nitrogen Starvation

by
Yan Liu
1,2,
Zihan Gao
1,2,
Chuang Liang
1,2,
Yuting Wei
1,2,
Yuge Li
1,2,
Yan Zhang
1,2,* and
Yaowei Zhang
1,2,*
1
College of Horticulture and Landscape Architecture, Northeast Agricultural University, Harbin 150030, China
2
Key Laboratory of Biology and Genetic Improvement of Horticulture Crops (Northeast Region), Ministry of Agriculture and Rural Affairs, Northeast Agricultural University, Harbin 150030, China
*
Authors to whom correspondence should be addressed.
Int. J. Mol. Sci. 2025, 26(4), 1586; https://doi.org/10.3390/ijms26041586
Submission received: 6 January 2025 / Revised: 8 February 2025 / Accepted: 11 February 2025 / Published: 13 February 2025
(This article belongs to the Special Issue Advances in Plant Genomics and Genetics: 2nd Edition)

Abstract

:
Nitrogen (N) is the most important fertilizer for increasing crop production, as it is absorbed by various N transporters and metabolized by a series of enzymes. Aspartate aminotransferase (ASP) facilitates the conversion of Glu to Asp for N storage. Chinese cabbage is a typical leafy vegetable that requires a large amount of N for growth. To investigate the functions of BraASPs, 10 members of the ASP gene family in Brassica rapa (B. rapa) were identified. Phylogenetic analysis and collinearity comparisons of ASP members among B. rapa, Arabidopsis thaliana (A. thaliana), Oryza sativa (O. sativa), Brassica napus (B. napus), and Brassica oleracea (B. oleracea) were conducted to examine evolutionary associations and genome duplication events across species. Multiple cis-acting elements associated with stress responses were identified in the promoters of BraASPs, suggesting their diverse roles. Members of BraASPs were expressed in roots, stems, flowers, siliques, and leaves, with the highest expression in leaves. Their expression levels increased rapidly at 3 h under low N conditions, peaked at 6 h, and returned to low levels at 24 h. Based on transcriptomic data, BraASP1b was identified as a candidate gene in B. rapa under low N stress, localized in the nucleus and cytoplasm. Overexpression of BraASP1b in A. thaliana resulted in a higher biomass than Col-0 under low N conditions.

1. Introduction

Nitrogen (N) is the most demanded essential nutrient for crops and serves as a critical fertilizer for achieving high production levels. Therefore, the substantial input of N fertilizers in agricultural production has reached 115–120 million tons annually, resulting in significant financial expenditure. However, the nitrogen use efficiency (NUE) in major crops worldwide ranges from only 30% to 50%, leading to higher costs, energy waste, environmental issues, and food safety concerns [1,2]. The NUEs of crops are influenced by a complex interplay of different crop species and environmental factors. Therefore, understanding the complex regulatory networks of N uptake and metabolism is essential for improving crop NUE and balancing N inputs with utilization [3,4].
Multiple forms of N could be absorbed by plants, including inorganic nitrates (NO3) in high quantities and smaller amounts of ammonium (NH4+), as well as some organic nitrates such as amino acids, peptides, and proteins [5]. Ammonium (NH4+) is preferentially absorbed by plants through ammonium transporters (AMTs) and is directly assimilated for use. Studies have identified six AtAMTs in A. thaliana and 10 OsAMTs in rice, which belong to two gene families [3]. In contrast, four families of nitrate transporters are involved in the absorption of NO3 by plants, including the nitrate transporter 1 (NRT1)/peptide transporter family (NPF), NRT2 family, chloride channel (CLC) family, and slowly activating anion channels [6]. Research has reported 53 NPF genes in A. thaliana and 93 in rice, which play significant roles in nitrate uptake from the soil, root-to-shoot transport, nitrate allocation among leaves, and seed developments [4]. The NRT2 members are primarily associated with a high-affinity transport system, comprising seven AtNRT2 genes and four OsNRT2 transporters, which are induced by nitrate deficiency and repressed under high nitrate levels [4,7]. Following the assimilation of N through various transporters, a range of enzymes are involved in N metabolism across multiple steps. Ammonium is directly utilized and reduced into glutamine by glutamine synthetase (GS), a key enzyme in N metabolism, existing in two forms: cytosolic GS1 and plastidial GS2 [8]. Subsequently, glutamate 2-oxoglutarate aminotransferase (GOGAT) participates in the conversion of glutamine to glutamate in the GS/GOGAT cycle. Additionally, pyruvate and glutamate are produced by aspartate aminotransferase (ASP) and alanine aminotransferase (AlaAT) in the cytosol for amino acid biosynthesis pathways [8,9]. Furthermore, there are two primary steps involved in the utilization of NO3 in plants: it is first reduced to nitrite by nitrate reductase (NR) and then converted to ammonium by nitrite reductase within ammonium metabolic pathways [9,10].
ASP, also referred to as AAT, is recognized as a key enzyme in C and N metabolism, playing a vital role in the conversion of glutamate (Glu) to Asp during N assimilation in both animals and plants [11]. Various types of ASP members exist in A. thaliana, including cytosolic isozymes, plastidic forms, and prokaryotic types. Overexpression lines of ASP2 in Arabidopsis exhibited no noticeable morphological changes but demonstrated increased sensitivity to Botrytis cinerea [12]. Additionally, overexpression of three AAT genes (OsAAT1, OsAAT2, and OsAAT3) in rice resulted in higher AAT activities in leaves, along with increased amino acid and protein contents in seeds, without any evident phenotypic alterations [13]. However, the AAT of Medicago sativa did not exhibit high NUE under either high or low N conditions in overexpression transgenic Brassica napus (B. napus) lines [14]. As previously noted, the functions of the AAT family members in N metabolism warrant further investigation in plants [10].
Chinese cabbage, a globally popular leafy vegetable, is particularly favored in Asian countries such as China, South Korea, and Japan. A significant amount of N is required throughout its growth stages, especially for the formation of the primary commercial organ, the leaf head [15]. However, the total NUE of vegetables is typically less than 20% [2,16], highlighting the need to explore the regulatory networks of N metabolism in these crops to enhance their NUEs. In our prior study, focusing on the transcriptomic analysis of sensitive and insensitive Chinese cabbage inbred lines, a candidate gene, BraASP1, was identified as responsive to low N stresses [17]. Therefore, the ASP family of Brassica rapa (B. rapa) was analyzed, including the characteristics of each ASP, as well as the evolutionary associations and collinearity of ASP members among B. rapa, A. thaliana, Oryza sativa (O. sativa), B. napus, and B. oleracea. Furthermore, the expression patterns of BrASPs were examined across different tissues and in response to low N stresses. Ultimately, the biomass and phenotypes of BraASP1b transgenic A. thaliana were investigated under low N treatments, indicating that BraASP1b plays a positive role in responding to low N conditions in B. rapa.

2. Results

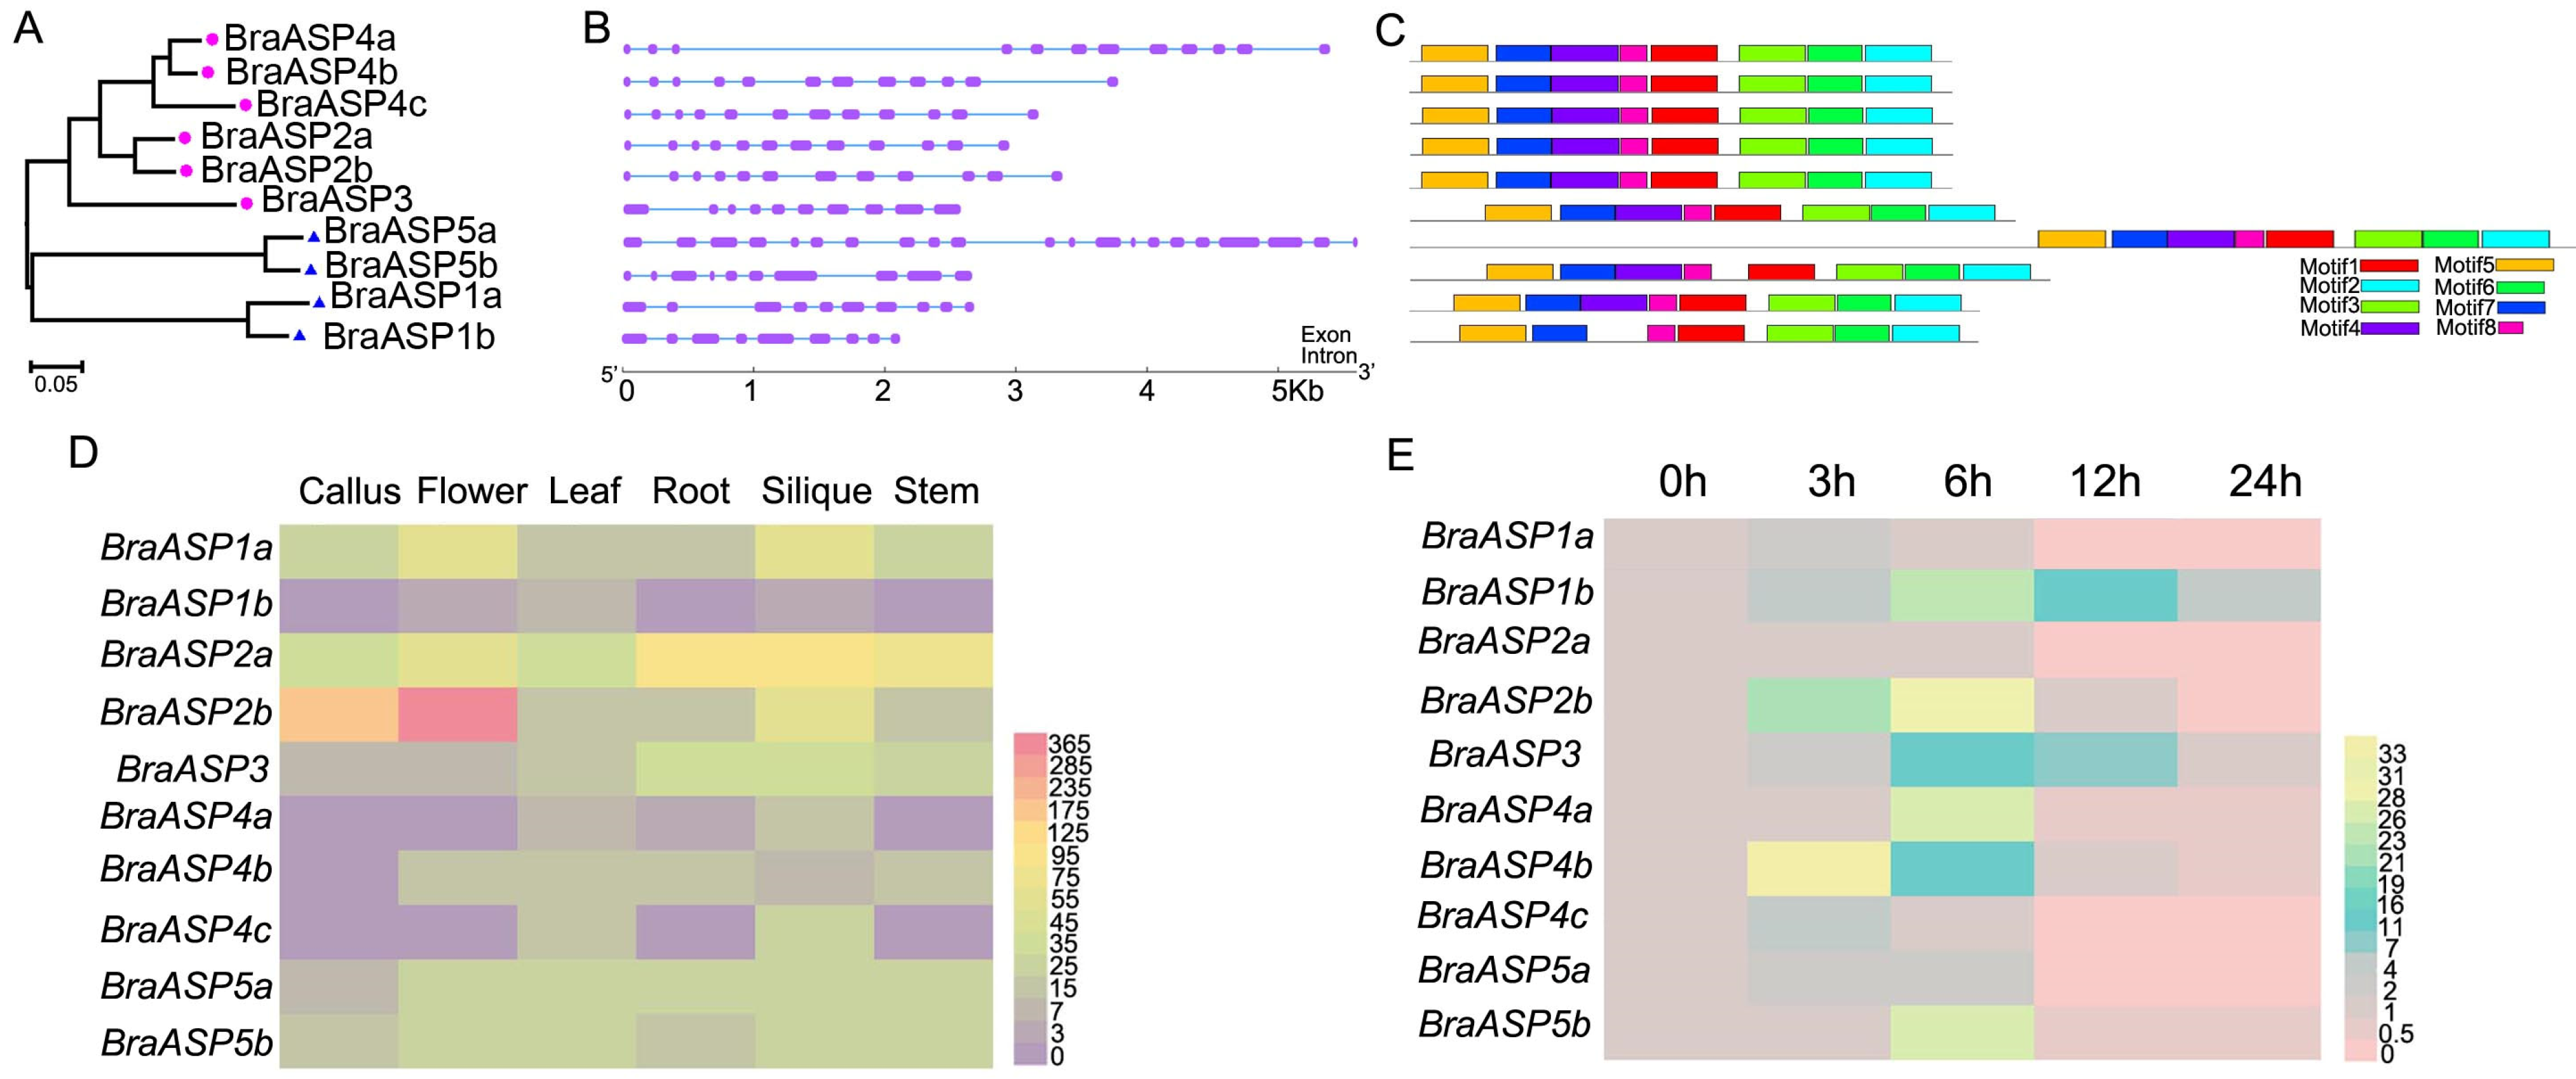
2.1. The Phylogenetic Associations and Collinearity Analysis of ASP Members Among B. rapa, A. thaliana, O. sativa, B. napus, and B. oleracea

All 13 predicted members of the ASP gene family in B. rapa were sourced from the BRAD database and subsequently validated for the presence of ASP domains using PfamScan and InterPro. A total of 10 members of the ASP family were isolated from the B. rapa genome and renaming was conducted from Bra1a to Bra5b based on their homology with A. thaliana (Table S1). Additionally, detailed information regarding the BraASP members was compiled and presented in Table S2, which includes genome positions, lengths of coding sequences (CDS) and proteins, exon counts, molecular weights, and isoelectric points. The lengths of the CDS and protein sequences exhibited similarities, ranging from 1218 to 2625 bp, encoding proteins of 405 to 874 amino acids. Notably, BraASP5a emerged as the longest member of the BraASP family, extending up to 2625 bp with 20 exons, while the remaining genes demonstrated a relatively uniform length of approximately 1200 to 1400 bp.
The phylogenetic associations of the ASP proteins among A. thaliana, B. rapa, B. napus, B. oleracea, and O. sativa were analyzed and constructed utilizing the maximum likelihood method. This analysis included six ATASPs, 5 OsASPs, 10 BraASPs, 17 BolASPs, and 27 BnASPs, which were categorized into five subgroups labeled Group A through Group E (Figure 1A), with Group E being the largest, including 29 members. Most ASPs clustered primarily according to species rather than homologies. However, two copies of BraASP1 (BraA04g022190.3C and BraA05g013640.3C) were grouped together in Group B (Figure 1A).
Synteny analysis of the BraASP family genes was conducted to investigate repetitive events. A total of nine collinear pairs of BraASPs were identified in B. rapa, including pairs such as BraASP1a and BraASP1b; BraASP2a and BraASP2b; and BraASP4a and BraASP4c, along with BraASP3b and BraA02g003960; and four collinear pairs involving BraASP5a: BraASP5b, BraA04g018650, BraA07g042860, and BraA10g027070 (Figure 1B). The majority of the collinear pairs corresponded to homologous genes. However, BraA04g018650.3C, BraA07g042860.3C, and BraA10g027070.3C encoded proteins belonging to the protein kinase superfamily. These findings indicate a higher frequency of repetitive events among ASPs in B. rapa.
Furthermore, collinearity analysis of ASP members between B. rapa and A. thaliana, O. sativa, B. oleracea, and B. napus was computed and displayed in Figure 1C. A significant number of collinear pairs were identified between B. rapa and other cruciferous plants, specifically 13 pairs with A. thaliana, 23 pairs with B. oleracea, and 24 pairs with B. napus (Figure 1C and Table S3).

2.2. The Cis-Acting Regulatory Elements of Promoters in BraASPs

The upstream 1500 bp sequence of each BraASP initiation codon was downloaded for the analysis of cis-acting regulatory elements, which were analyzed using the online tool PlantCARE. A total of 40 types of cis-acting elements were identified in the promoters of BraASP members, as depicted in Figure S1. The maximum number of cis-acting elements detected was 104 for the CAAT box, distributed among five BraASP members. Additionally, numerous stress-related cis-acting elements were found in the promoters of BraASPs, including ABRE for abscisic acid responsiveness, ARE for anaerobic induction, CGTCA-motif for MeJA responsiveness, MYB for abiotic stresses, MBS for drought-inducibility, and DRE for drought, salt, and low-temperature stresses, as well as LTR for low-temperature stresses, TC-rich repeats for defense and stress responsiveness, and TCA-element for salicylic acid responsiveness. These findings suggest that BraASPs may play significant roles in the plant’s response to stress.

2.3. The Structures and Expression Levels of BraASP Members

The protein sequences of BraASPs were obtained from the BRAD database, and their phylogenetic relationships were analyzed using MEGA11 with the Neighbor-Joining method, clustering BraASPs into five subgroups based on homology (Figure 2A). Based on their CDS and genome sequences, the gene structures of BraASP members were analyzed using the Gene Structure Display Server, revealing that BraASP genes contained between 9 and 20 exons, with half of them having more than 12 exons (Figure 2B). Protein motifs of BraASPs were analyzed using MEME (Figure 2C and Figure S2), identifying a total of eight motifs (Table S4). Among these, seven motifs (motifs 1–3 and 5–7) were highly conserved, whereas motif 4 was absent in BraASP1b. These findings indicate that the gene structures and protein motifs of BraASP family members are highly conserved.
To investigate the potential molecular functions of BraASPs, expression levels were examined across different tissues and under low N stress (Figure 2D,E). BraASP gene expression was first assessed in roots, stems, leaves, flowers, siliques, and callus (Figure 2D), showing that most BraASPs were highly expressed in leaves, with the lowest expression observed in callus. BraASP1a, BraASP2a, BraASP2b, BraASP5a, and BraASP5b exhibited high expression across all detected tissues, whereas BraASP1b had low expression in all tissues except leaves. BraASP4a, BraASP4b, and BraASP4c were induced in leaves and siliques. Additionally, BraASP expression under low N stress was analyzed by qPCR (Figure 2E). Most BraASP genes were markedly induced from 3 h after low N treatment, particularly BraASP2b and BraASP4b, which showed 21-fold and 33-fold increases, respectively, peaking at 6 h when BraASP2b reached a 30.8-fold increase. BraASP1b maintained high expression levels under low N conditions from 3 h to 24 h.

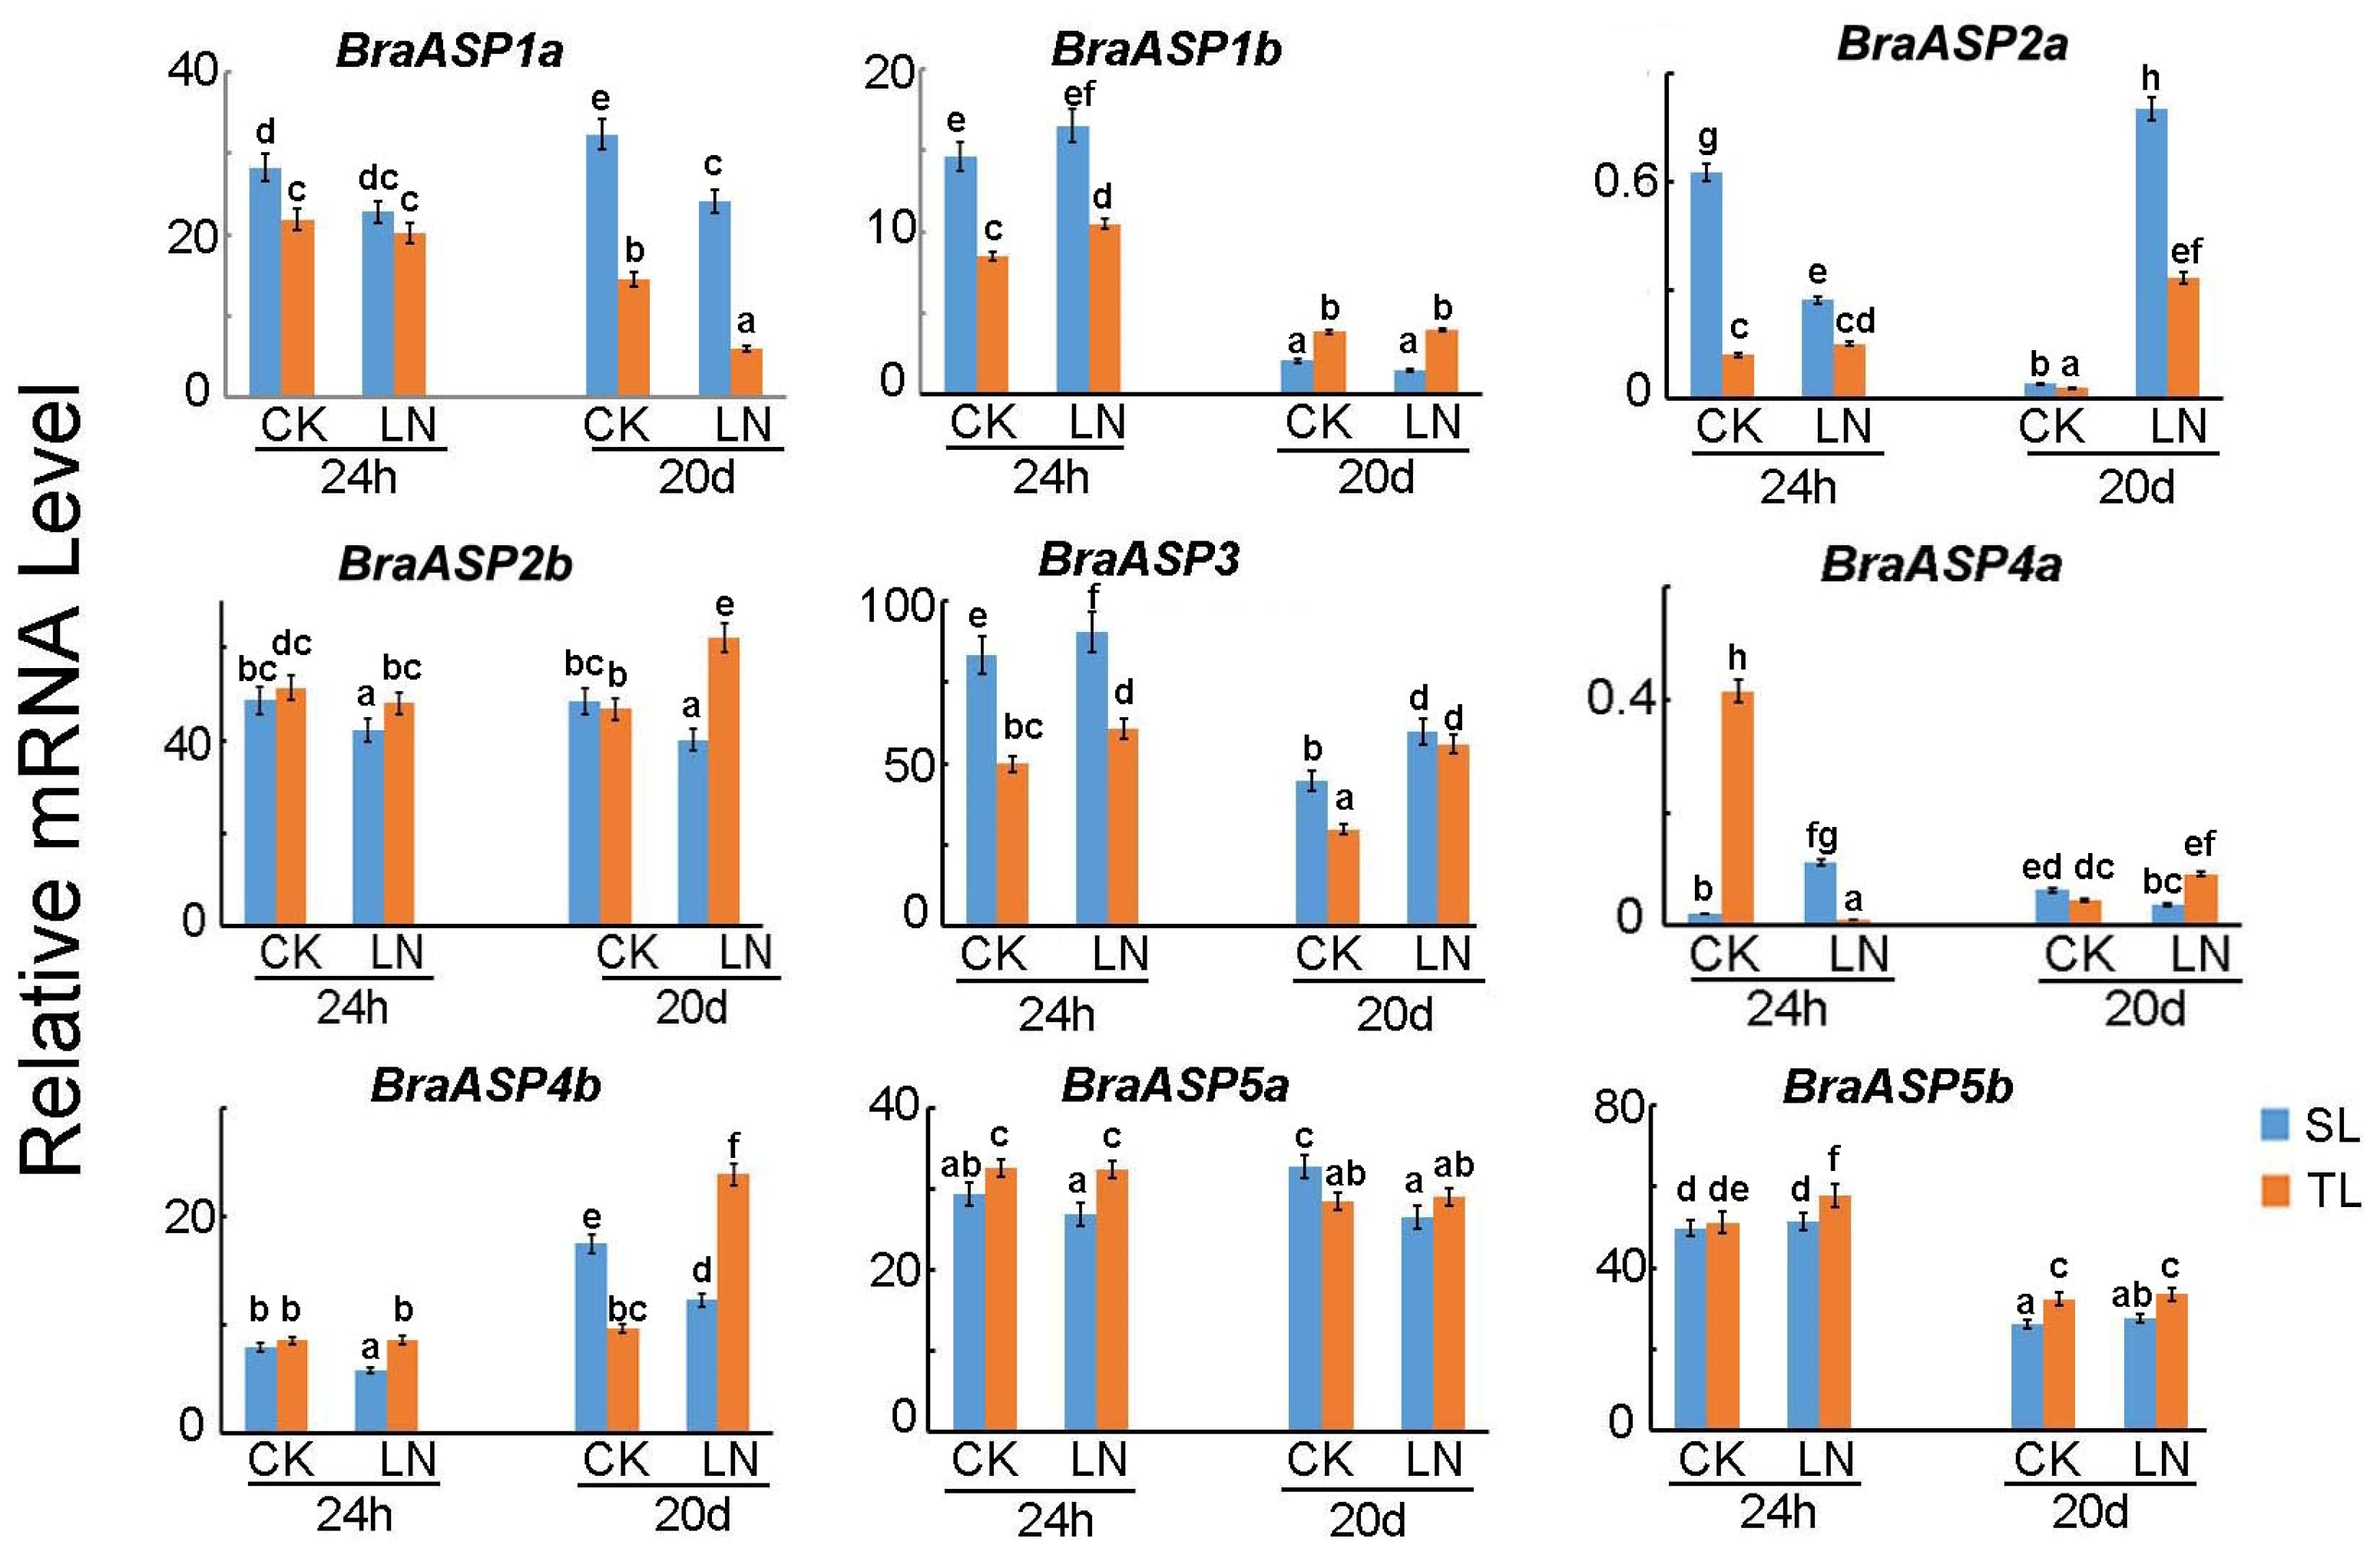
2.4. The Expressions of BraASPs in Sensitive and Insensitive Chinese Cabbage Inbred Lines Under Low N Stresses

A previous study identified sensitive (SL) and tolerant (TL) inbred lines of Chinese cabbage based on their responses to low N stress. Differentially expressed genes (DEGs) were analyzed through transcriptomic analysis over short (24 h) and long (20-day) treatment durations [17]. Most BraASP (9 of 10) members, except for BraASP4c, were identified from the RNA-Seq data, as shown in Figure 3. During the short-term low N stress, expression levels of BraASP1a, BraASP1b, BraASP2a, and BraASP3 were higher in SL compared to TL, while BraASP2b, BraASP4b, BraASP5a, and BraASP5b displayed lower expression in SL than in TL. For the long-term stress analysis, the expression patterns of most BraASP genes were consistent with those observed in the short-term analysis, with the exception of BraASP1b, which was significantly inhibited by low N and exhibited higher expression in TL compared to SL. In comparing the long-term and short-term conditions, four BraASP genes—BraASP1b, BraASP2a, BraASP4a, and BraASP5b—showed decreased expression, whereas three members—BraASP2b, BraASP3, and BraASP4—were induced.

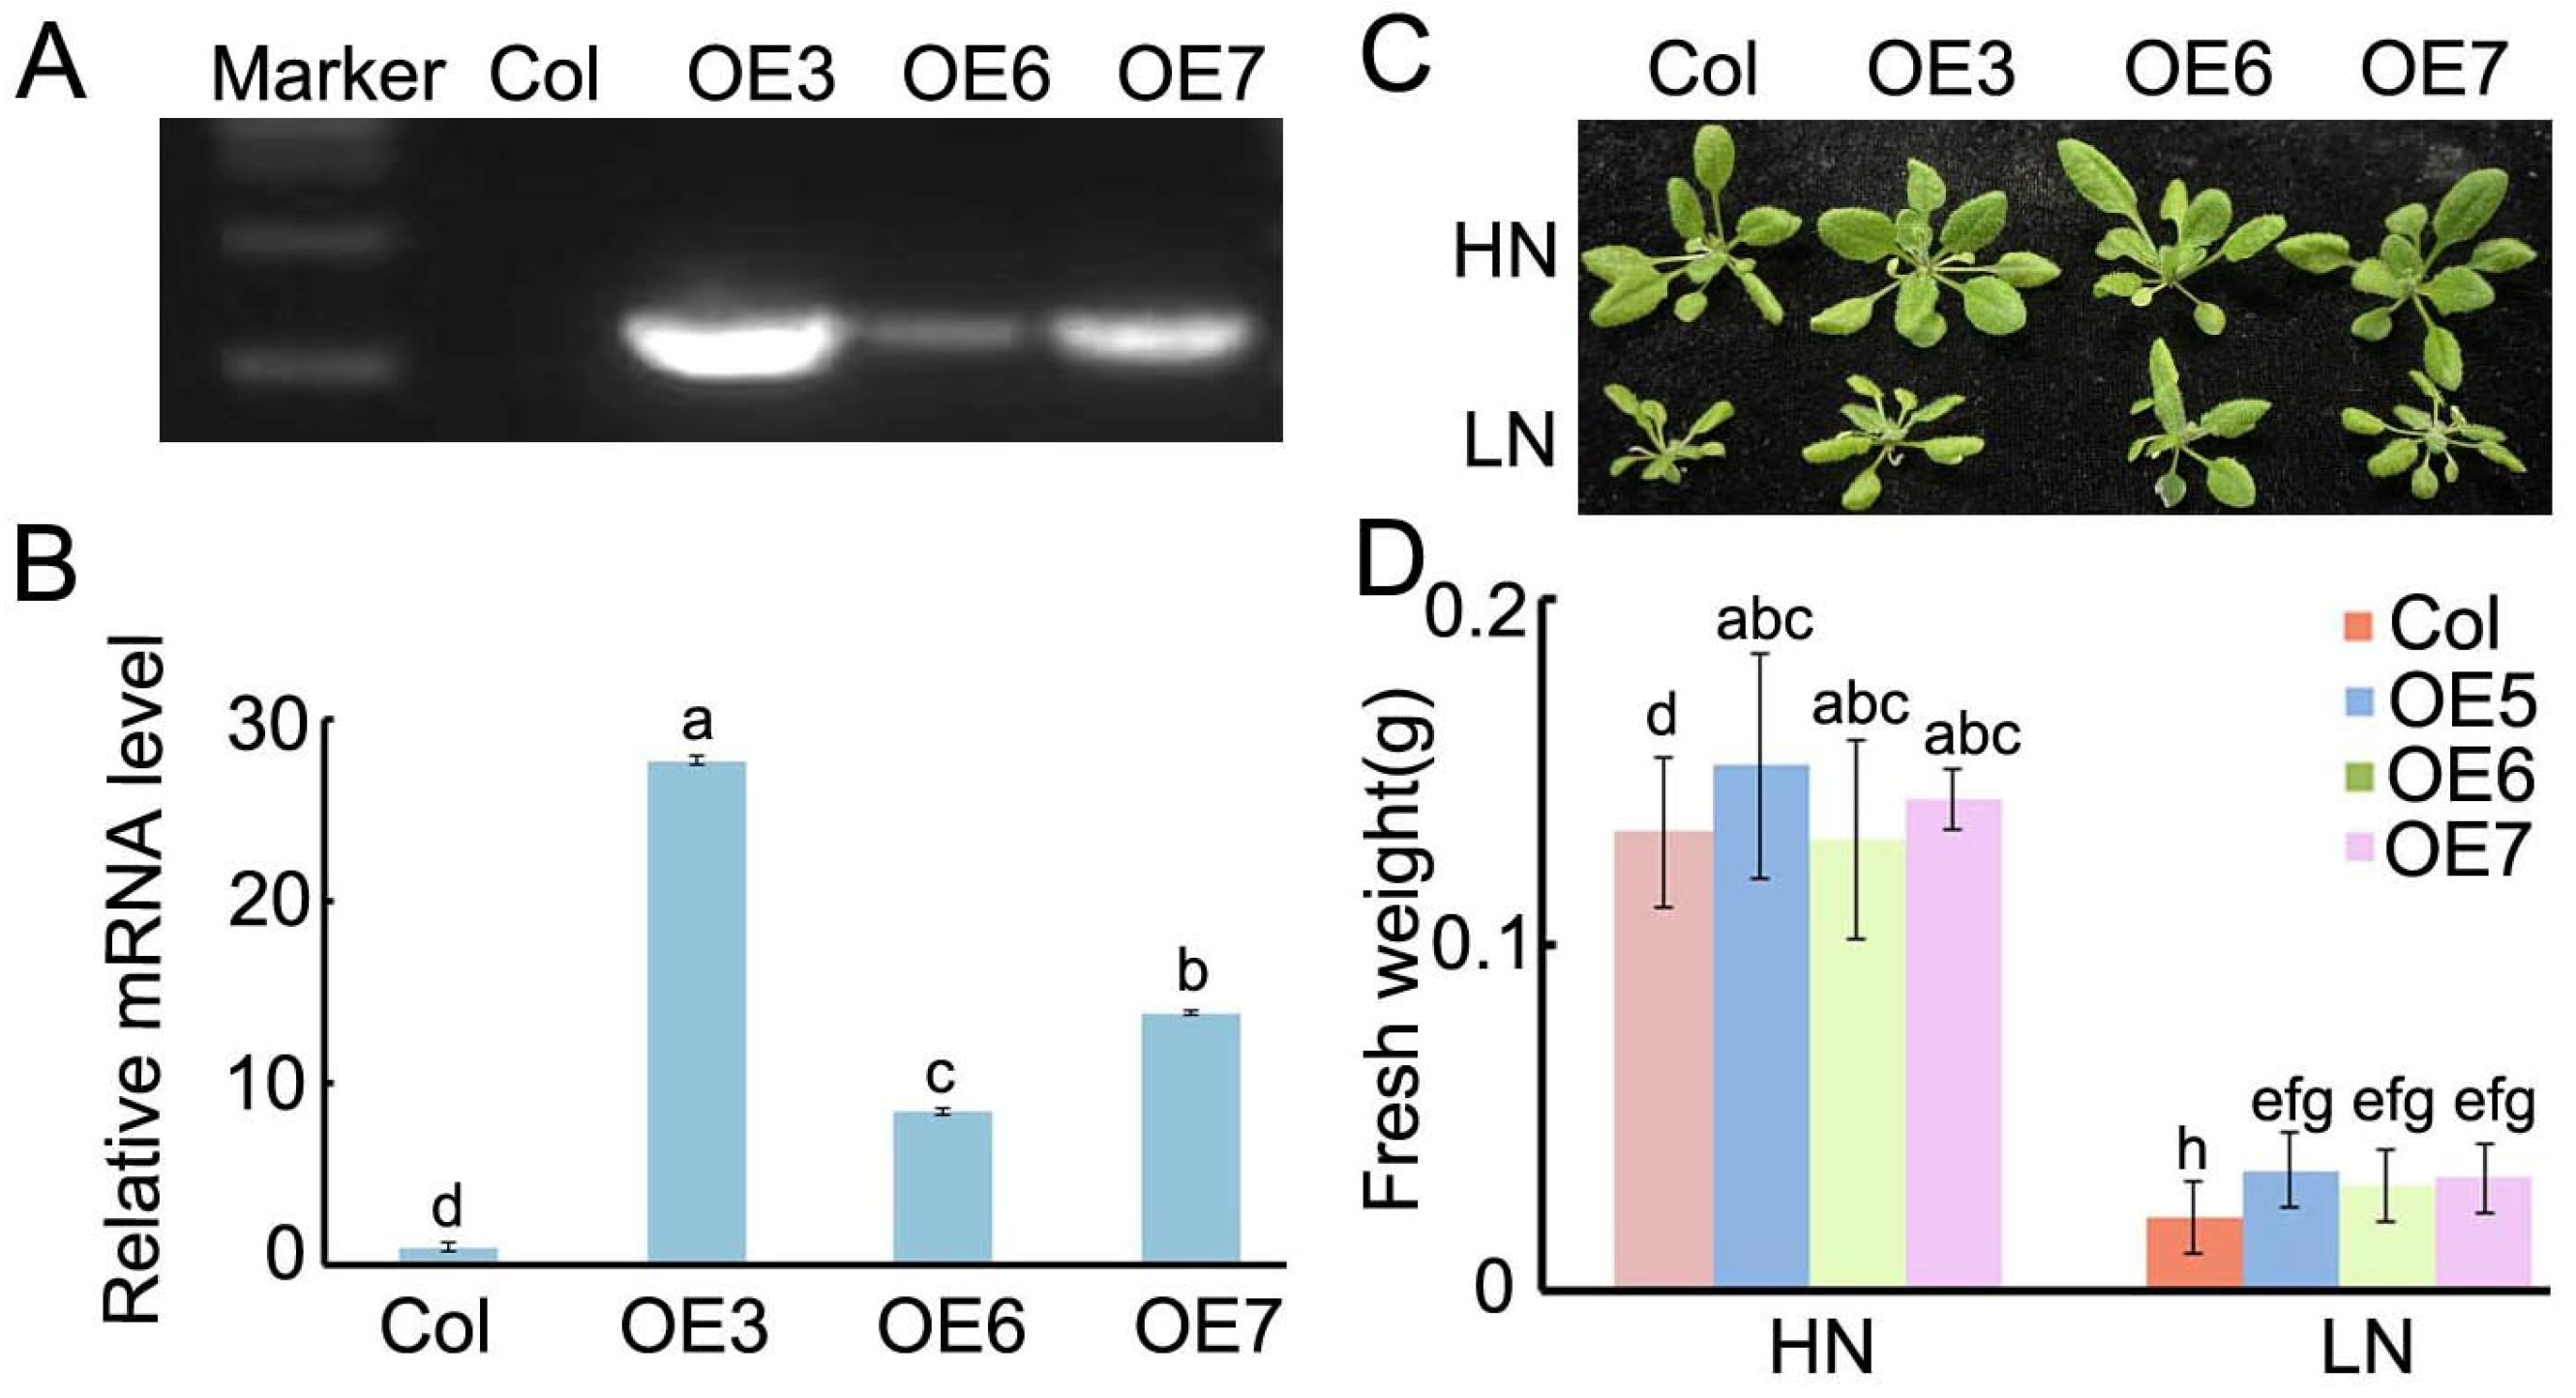
2.5. The Overexpression of BraASP1b in A. thaliana Under Low N Treatments

A previous study identified BraASP1b as a candidate gene in Chinese cabbage in response to low N conditions [17]. To further investigate its expression characteristics, BraASP1b was cloned and transfected into A. thaliana. Three positive transgenic lines (T3 progenies) were obtained following hygromycin screening and designated as OE5, OE6, and OE7. Specific primers for BraASP1b were designed to identify the transgenic lines using PCR, with Col-0 serving as a negative control, as depicted in Figure 4A. Subsequently, the expression levels of BraASP1b in the overexpressing lines were quantified using qPCR, revealing that, compared to Col-0, OE5, OE6, and OE7 exhibited upregulation by factors of 27.8, 8.5, and 13.8, respectively (Figure 4B).
The BraASP1b transgenic lines OE5, OE6, and OE7 were subjected to low N conditions for a duration of 20 days, with high N serving as a control for phenotypic investigations (Figure 4C). Under high N conditions, OE5, OE6, and OE7 were found to be larger than Col-0. Although all plants exhibited a reduced size under low N, these three overexpressing transgenic lines remained larger than Col-0 (Figure 4C). Further measurements of the fresh weights of each plant were taken, aligning with the observed phenotypes of the BraASP1b transgenic lines (Figure 4D). These results indicate that the overexpression of BraASP1b in A. thaliana enhances biomass under both high and low N treatments.

2.6. The Subcellular Localization of BraASP1b-GFP in Nicotiana benthamiana (N. benthamiana)

Additionally, the subcellular localization of 35S::BraASP1b-GFP was examined in N. benthamiana, as illustrated in Figure 5. The results indicated that BraASP1b-GFP is localized in both the cytoplasm and the nucleus, while 35S::GFP served as a control, demonstrating localization in both compartments.

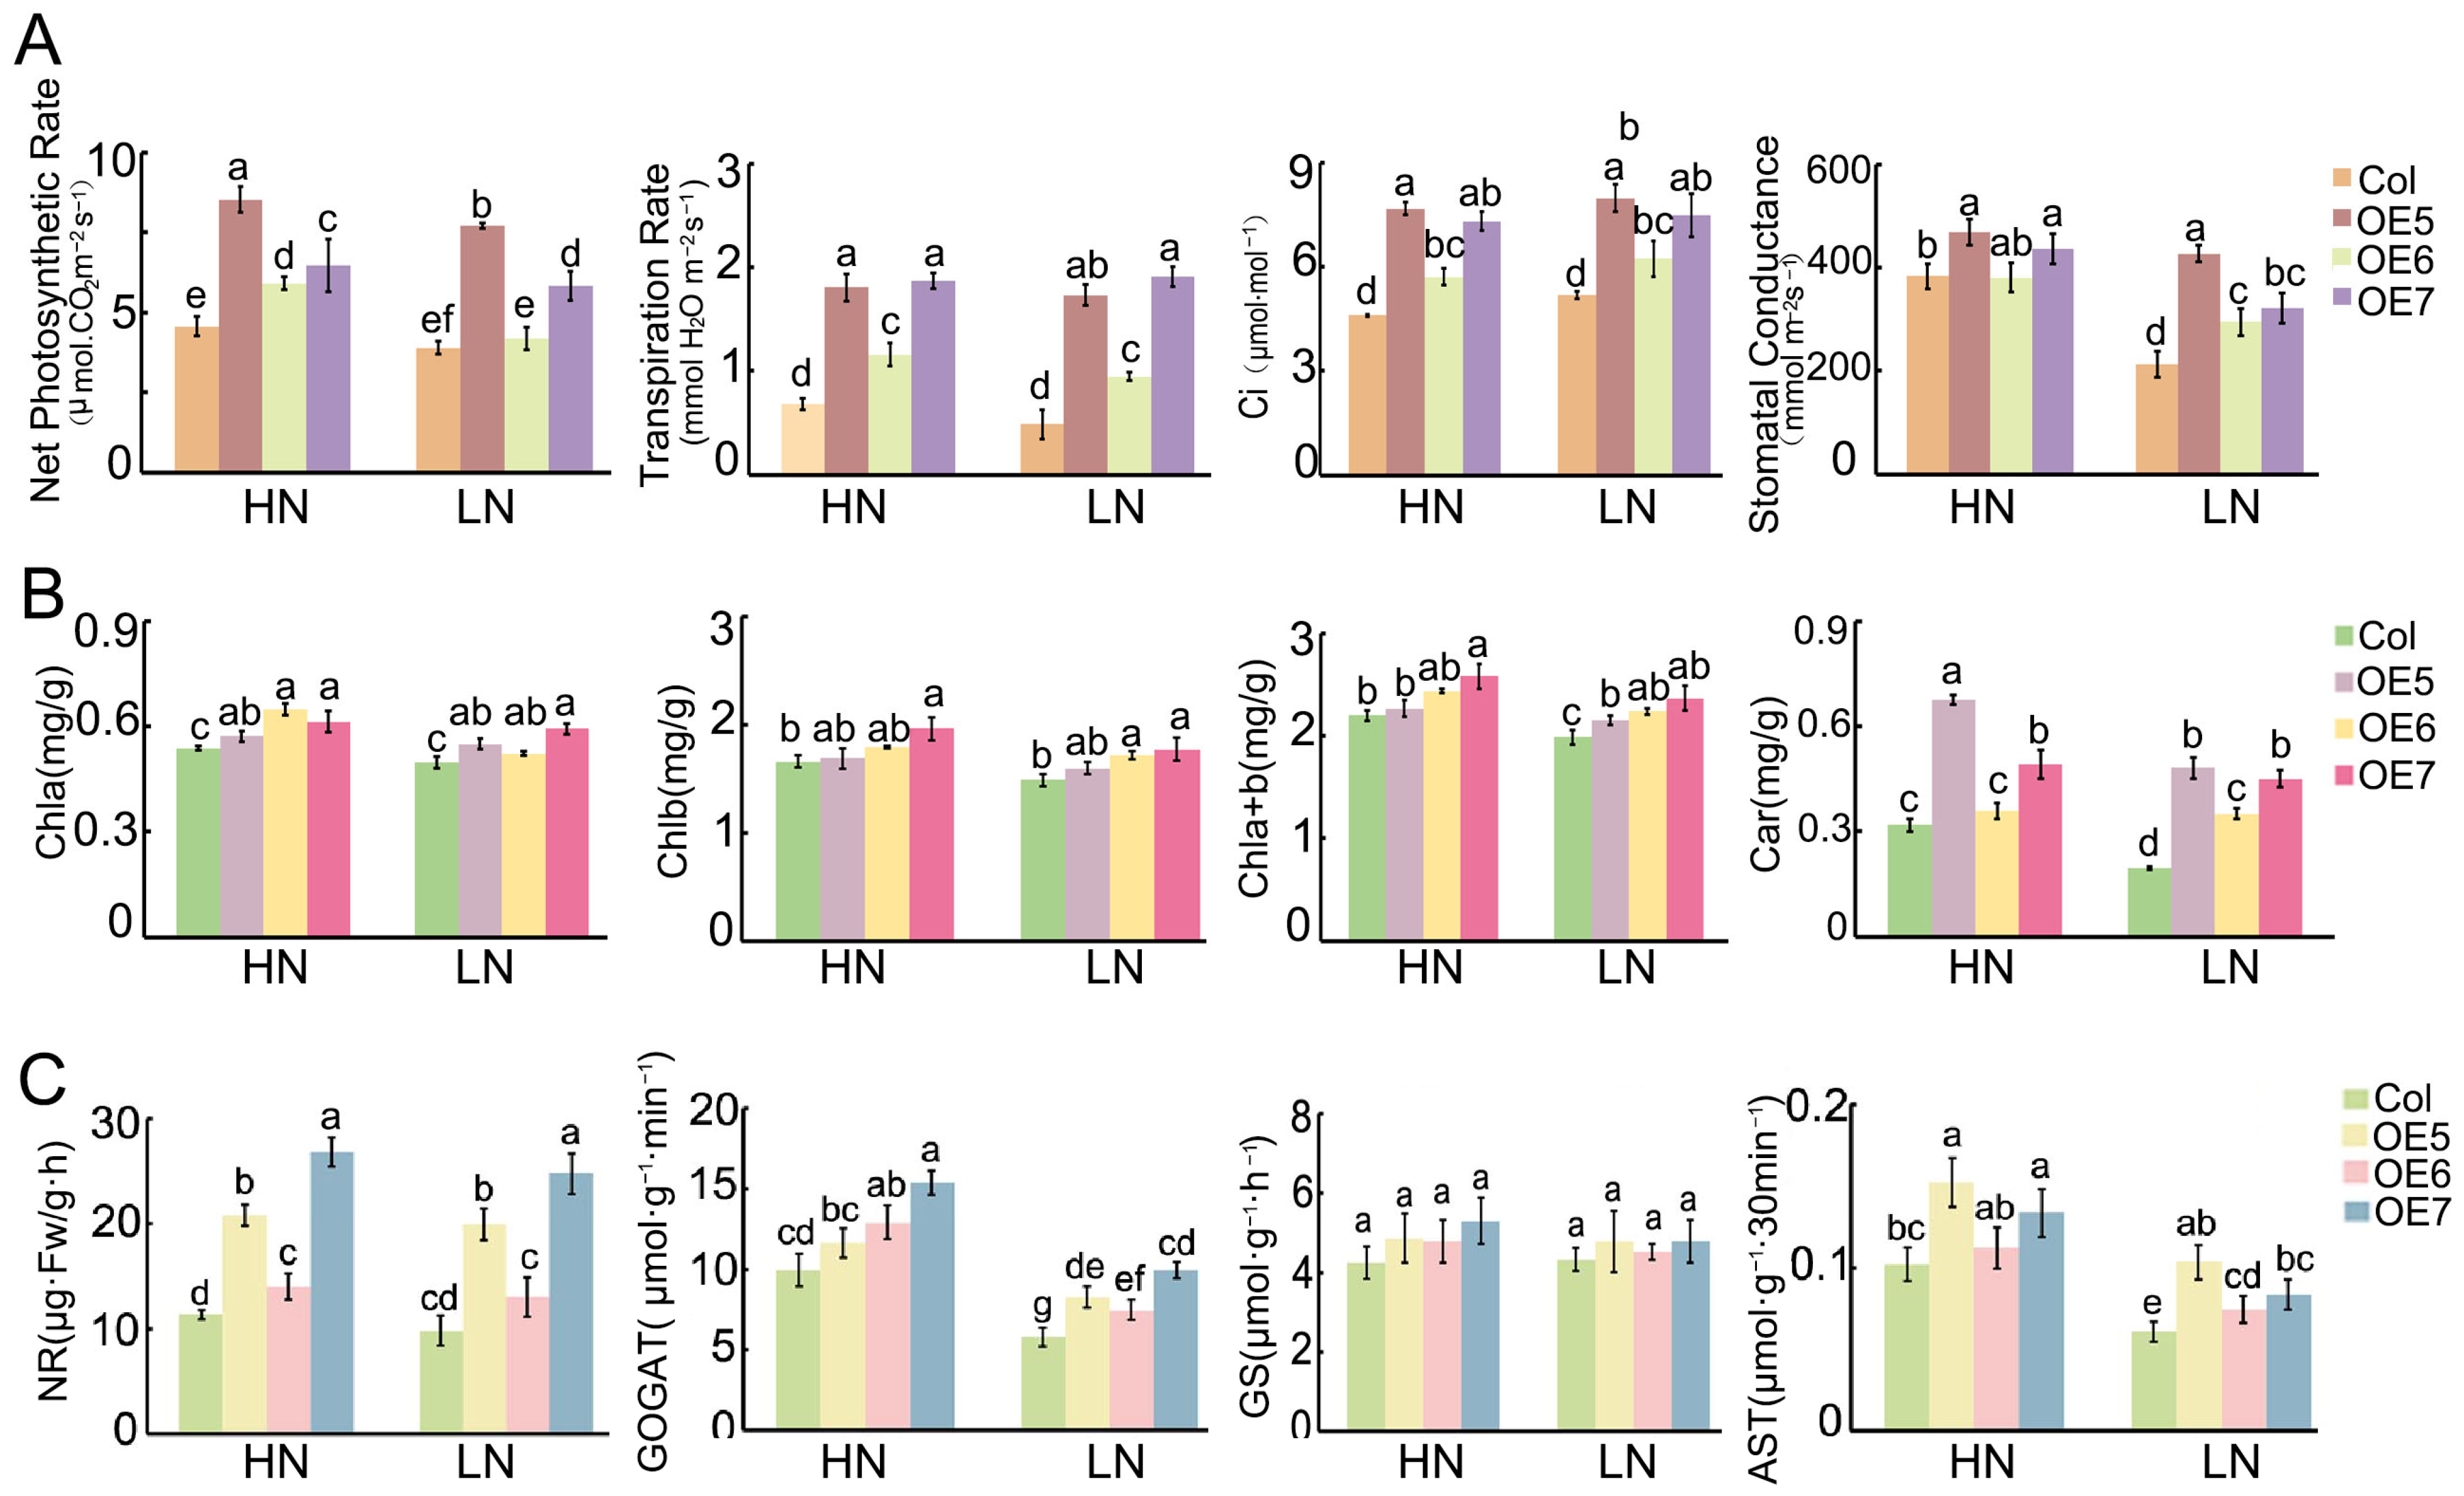
2.7. The Physiological Characteristics of BraASP1b Overexpressed Transgenic A. thaliana Lines Under Low N Stresses

Furthermore, the physiological characteristics of BraASP1b overexpressed transgenic A. thaliana and Col-0 were examined under both high and low N treatments, including photosynthetic characteristics, chlorophyll and carotenoid contents, and enzyme activities involved in N metabolism. Initially, the net photosynthetic rate, transpiration rate, intercellular carbon dioxide concentration, and stomatal conductance were measured after 20 days of low N conditions (Figure 6). Under HN conditions, all these metrics for Col-0 were significantly lower than those for the BraASP1b overexpressed transgenic A. thaliana lines. When subjected to low N treatment, all the photosynthetic metrics decreased; however, the BraASP1b transgenic A. thaliana lines exhibited higher values than Col-0 (Figure 6A), with line OE7 showing the highest performance. Subsequently, the contents of chlorophyll a (Chla), chlorophyll b (Chlb), and carotenoids were measured. The results indicated that the Chla/b contents were slightly higher in the BraASP1b transgenic lines compared to Col-0 under both HN and LN conditions (Figure 6B). The carotenoid levels in lines OE5 and OE7 were significantly higher than in Col-0 under HN (Figure 6B), and although these levels decreased under LN, they remained higher in the BraASP1b overexpressed transgenic lines compared to Col-0.
The activities of the enzymes NR, GOGAT, GS, and ASP were also measured in both the BraASP1b overexpressed transgenic A. thaliana lines and Col-0, all of which play key roles in N metabolism. These enzyme activities were suppressed under low N treatments, with GOGAT showing the most substantial reduction. The activities of NR and GOGAT remained higher in the transgenic A. thaliana lines compared to Col-0 under both HN and LN treatments; however, there were no significant differences in GS activity between the two lines (Figure 6C). Due to the overexpression of BraASP1b in the transgenic A. thaliana, the enzyme activities of ASP were elevated compared to Col-0 under both HN and LN conditions.

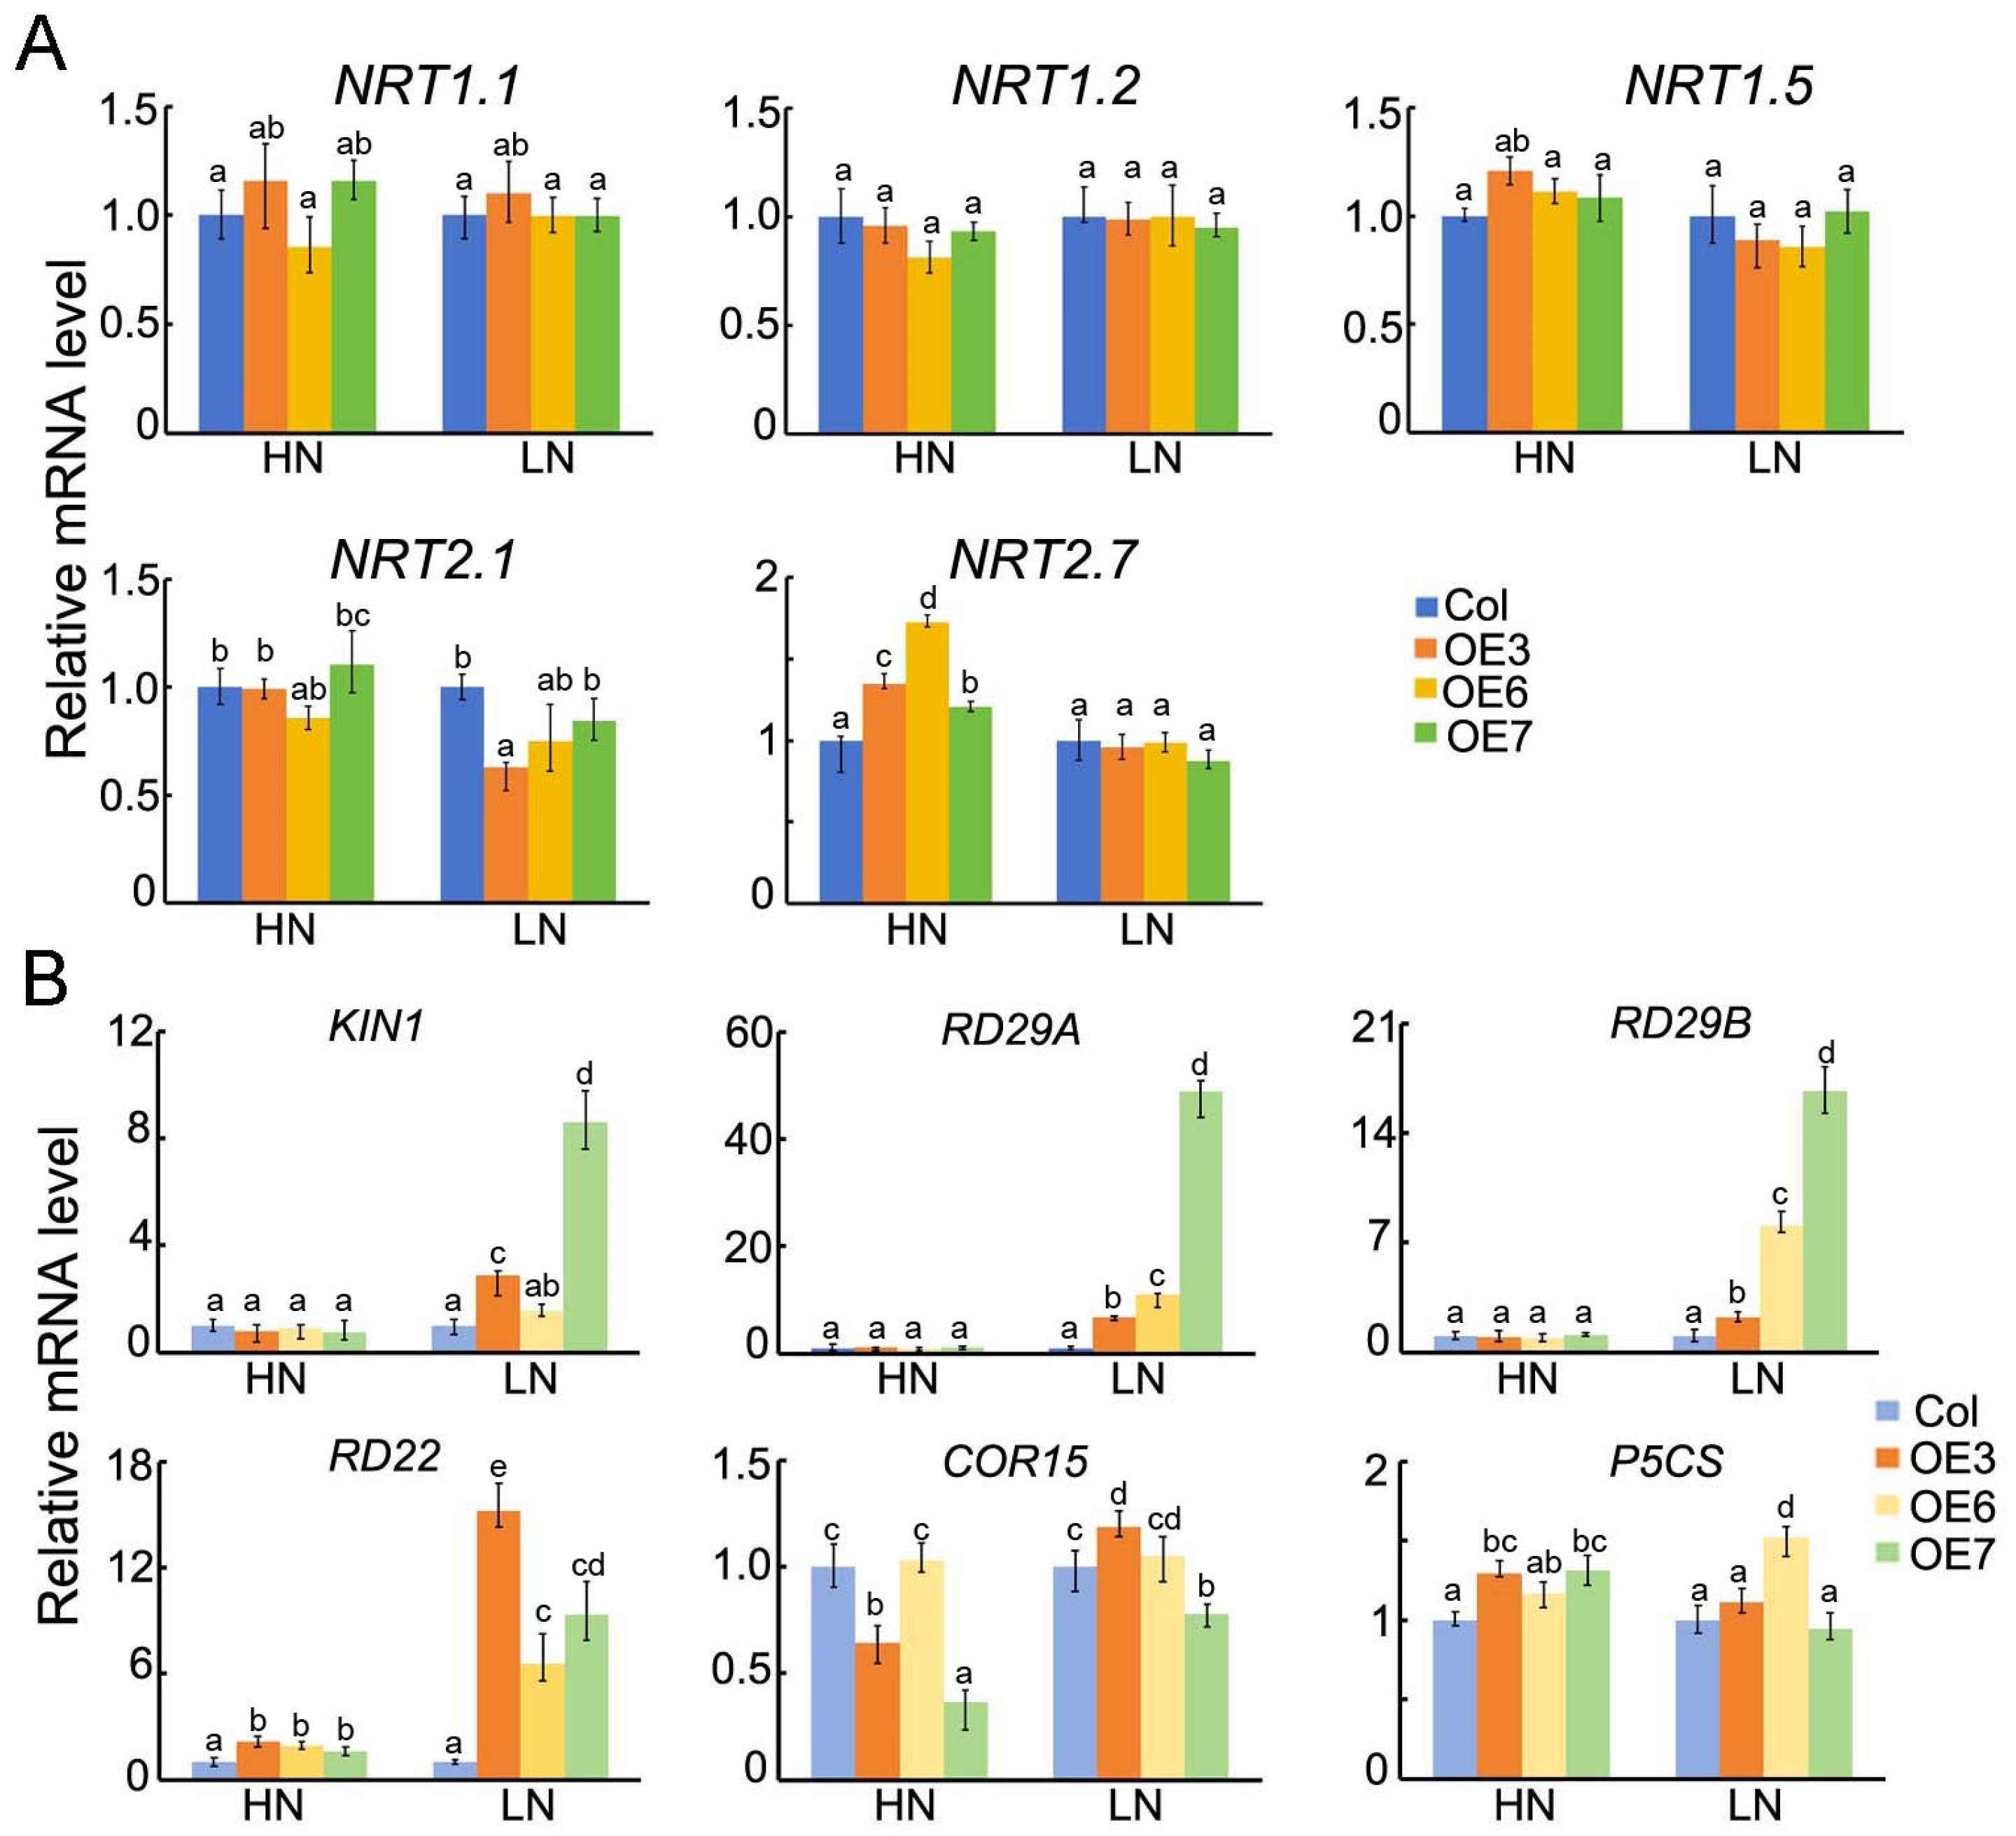
2.8. The Expression Levels of Abiotic Stress and N-Metabolism-Related Genes in Transgenic A. thaliana Lines of Overexpressed BraASP1b Under Low N Stresses

The results above indicate that BraASP1b overexpression enhances tolerance to low N conditions in transgenic A. thaliana. To investigate the involvement of BraASP1b in N-metabolism pathways, the transcription levels of NRT1.1, NRT1.2, NRT1.5, NRT2.1, and NRT2.7 were analyzed under low N conditions. No significant differences were observed between transgenic lines and Col-0 under either high or low N conditions (Figure 7A).
Since low N stress is considered an abiotic stressor, several abiotic stress-related genes, including KIN1, RD29A, RD29B, RD22, COR15, and P5CS, were analyzed under low N conditions. The expression of KIN1, RD29A, and RD29B was significantly upregulated in BraASP1b transgenic lines under low N stress (Figure 7B). Among these, OE3 exhibited the highest expression levels, with fold increases of 8.6, 19, and 15.2, respectively, followed by OE7 and OE6. Additionally, RD22 was upregulated in BraASP1b transgenic lines under both high and low N conditions, with even higher expression under low N. In contrast, no significant differences were observed in the expression of COR15 and P5CS.

3. Discussion

ASP family members have been identified in various plant species, including Panicum miliaceum and Neoporphyra haitanensis, as well as the model dicot A. thaliana and monocot O. sativa [10]. In this study, the ASP gene family of B. rapa (BraASP1 to BraASP5) was identified and characterized based on homology with A. thaliana, comprising 10 members. Structural analysis of their CDS, proteins, exons, molecular weights, and isoelectric points revealed high similarity among BraASP members, particularly in terms of sequence length, gene structure, and protein motifs. In A. thaliana, five classical ASP members belong to Class I [12]. Phylogenetic and collinearity analyses among B. rapa, A. thaliana, O. sativa, B. napus, and B. oleracea showed that ASP1 and ASP5 members in B. rapa, A. thaliana, B. napus, and B. oleracea clustered together. BraASP1a and BraASP1b, as well as BraASP5a and BraASP5b, were more closely related to AtASP1 and AtASP5 than to ASP members from B. napus and B. oleracea. BraASP3 exhibited greater similarity to Os01t0760600 rather than AtASP3, whereas AtASP3, AtASP2, and AtASP4 formed a separate cluster, grouping BraASP2a, BraASP2b, BraASP4a, and BraASP4b together. Collinearity analysis of BraASPs genes in the B. rapa genome identified nine collinear gene pairs. Additional collinearity associations were observed between B. rapa and A. thaliana, B. napus, and B. oleracea, with 13, 24, and 23 collinear gene pairs, respectively. These findings suggest frequent duplication events in B. rapa and other cruciferous species, but not in rice.
N is absorbed through various transporters and assimilated into Glu and Gln via the glutamine synthetase/glutamate synthase (GS/GOGAT) cycle. ASPs then convert these amino acids into Asp and asparagine (Asn), which serve as N transport and storage molecules [7,18]. To explore the molecular functions of BraASP genes, expression patterns were examined in different tissues and under low N stress in B. rapa seedlings. All BraASPs genes exhibited high expression levels in leaves. Notably, BraASP1b was highly expressed in all detected tissues. Most BraASP genes were significantly induced at 6 h after low N treatment, indicating early responsiveness to N deficiency. Furthermore, BraASP1b showed sustained induction under low N conditions, suggesting a crucial role in N metabolism.
Previous research identified BraASP1b as a candidate gene in a co-expression network analysis of different B. rapa seedlings responses to low N stress [17]. Overexpression of ASP2 in A. thaliana did not alter plant morphology but increased sensitivity to Botrytis cinerea [12]. In this study, BraASP1b was cloned based on the B. rapa genome sequence and introduced into A. thaliana Col-0. Three positive transgenic lines (OE5, OE6, OE7) were generated and exposed to low N stress. Each transgenic line exhibited greater biomass accumulation than Col-0 under both high and low N conditions (Figure 4C,D). These results indicate that BraASP1b overexpression enhances biomass production under varying N conditions. ASP isoenzymes localize to different subcellular compartments, including mitochondria, chloroplasts/plastids, and the cytosol [19]. Subcellular localization analysis in N. benthamiana revealed that BraASP1b is primarily localized in the cytoplasm and nucleus (Figure 5).
Next, the physiological characteristics of BraASP1b-overexpressing transgenic A. thaliana and Col-0 were analyzed, including photosynthetic traits, chlorophyll and carotenoid content, and enzyme activities involved in N metabolism. N supply is essential for photosynthesis through photosynthesis, photorespiration, and respiration [20]. Photosynthetic characteristics of Chinese cabbage seedlings decreased under low N stress; however, they remained higher in low N-insensitive inbred lines than in sensitive lines [17]. In this study, each detected photosynthetic characteristic in BraASP1b-overexpressing transgenic A. thaliana was higher than in Col-0, suggesting enhanced photosynthetic efficiency in transgenic lines. Various enzymes participate in plant N metabolism. NR converts NO3 to NO2, which is subsequently reduced to NH4. Ammonium is directly assimilated via the GS/GOGAT pathway and ultimately metabolized into aspartate by ASPs for storage [9]. Among these, GOGAT activity exhibited the most significant changes in BraASP1b-overexpressing transgenic A. thaliana under low N. Moreover, NR, GOGAT, and ASP activities were higher in transgenic lines than in Col-0 under both high N and low N conditions, contributing to enhanced N utilization efficiency in BraASP1b transgenic lines.
To investigate the regulatory pathways underlying biomass improvements in BraASP1b transgenic A. thaliana, the expression levels of N-transporter genes were analyzed under low N stress. Surprisingly, NRT1.1, NRT1.2, NRT1.5, NRT2.1, and NRT2.7 showed no significant differences between transgenic A. thaliana lines and Col-0 under low N, indicating that BraASP1b had no major effect on transporter gene expression. This may be due to ASP’s primary role in N assimilation rather than absorption and transport. In contrast, multiple studies have shown that asparagine synthetase, particularly Asn synthetase 1, plays a key role in stress responses and N metabolism. Since asparagine biosynthesis is crucial for N metabolism [21], stress can impair plant nutrient metabolism, particularly N metabolism. The N utilization of the rst1 loss-of-function mutant in rice salt tolerant1 improved due to increased Asn synthetase 1 expression, which prevented excessive NH4+ accumulation [22]. Similarly, Asn synthetase 2 mutants exhibited reduced salt stress tolerance and impaired N assimilation, whereas low salt stress induced Asn synthetase 1 expression [23]. Additionally, three ZmAS genes (ZmAS1, ZmAS2, and ZmAS3) were differentially regulated under post-silking drought stress in maize [24]. Drought stress also reduced total N levels in maize, but ZmAS3 and ZmAS4 were significantly induced [25]. Moreover, overexpression of pepper Asn synthetase 1 in A. thaliana enhanced resistance to Pst DC3000 and Hyaloperonospora arabidopsidis [21]. Given the association between N metabolism and stress responses, we also examined the expression of abiotic stress-related genes in BraASP1b transgenic A. thaliana. KIN1, RD29A, RD29B, and RD22 are involved in abiotic stress responses via the ABA-dependent pathway, particularly in cold, drought, and salt stress [26,27,28]. COR15 functions in cold and freezing tolerance [29], while P5CS participates in proline biosynthesis and serves as a stress marker [30]. Notably, RD29A, RD29B, and RD22 were significantly induced by low N in transgenic A. thaliana lines, whereas COR15 and P5CS showed no differences. These findings suggest that BraASP1b transgenic A. thaliana enhances N utilization by increasing the activity of N assimilation-related enzymes.

4. Materials and Methods

4.1. Plant Materials

The inbred lines C14 and A213 of Chinese cabbage were cultivated in a greenhouse under 16 h of light (28 °C) and 8 h of darkness (18 °C) until the development of four leaves. The seedlings were subjected to high N (15 mmol·L−1 NO3) and low N (5 mmol·L−1 NO3) treatments, as described in our previous study [17], for durations of 0, 3, 6, 12, and 24 h. The remaining seedlings underwent vernalization under 16 h of light (8 °C) and 8 h of darkness (4 °C) for 21 days before being cultured under normal conditions until flowering. Tissues from the root, stem, leaf, flower, and siliques were harvested, with three biological replicates collected for each tissue type.

4.2. Identification of ASP in Chinese Cabbage

All the ASP members of Chinese cabbage were identified using the BRAD database (http://brassicadb.cn/#/, accessed on 1 July 2023) and isolated from version 3.0 of the B. rapa genome. Each member was subsequently searched in the NCBI database (https://blast.ncbi.nlm.nih.gov, accessed on 10 July 2023) to identify the accessions PLN02397 and pfam00155, associated with aminotransferase classes I and II. The proteins were further confirmed using online tools such as InterPro (http://www.ebi.ac.uk/interpro/, accessed on 12 July 2023) and PfamScan (https://www.ebi.ac.uk/Tools/pfa/pfamscan/, accessed on 12 July 2023).

4.3. The Cis-Acting Elements in Promoters, Gene Structures, and Collinearity Analysis

The 1500 bp upstream of each initiation codon was retrieved from the BRAD database, presumed to represent the promoters of the BraASP genes. All sequences were analyzed using the PlantCARE online tool (http://bioinformatics.psb.ugent.be/webtools/plantcare/html/, accessed on 15 July 2023).
The CDS and genomic sequences of BraASP members were downloaded from the BRAD database, with gene structures constructed using the online tool Gene Structure Display Server (http://gsds.cbi.pku.edu.cn, accessed on 18 July 2023).
The genomic and coding sequences of A. thaliana, rice, B. napus, and B. oleracea were acquired from Tair (https://www.arabidopsis.org/, accessed on 15 July 2023), Gramene databases (http://rice.uga.edu/, accessed on 15 July 2023), Brassica napus and Brassica oleracea (http://brassicadb.cn/#/, accessed on 18 July 2023). The synteny associations of BraASP among A. thalian, rice, B. napus, and B. oleracea were analyzed by MCScanX [31], associated with TBtools (version 2.080) [32].

4.4. Phylogenetic Tree and Motifs Analysis of ASP Protein

The protein sequences of ASPs from A. thaliana, rice, B. napus, B. oleracea, and Chinese cabbage were compiled. Phylogenetic trees were constructed using the MAGE11 software through maximum likelihood methods. The protein sequences of BraASPs were input into the MEME online tool (https://meme-suite.org/meme/, accessed on 30 July 2023) to identify eight conserved motifs within each BraASP.

4.5. Total RNA Extraction and Real-Time PCR Analysis

The plants of A. thaliana and Chinese cabbage were harvested, and the total RNA was extracted using the Plant RNA Extraction Kit (Omega, Ya Anda Biotechnology Co., Ltd., Beijing, China). The RNA was then reverse-transcribed to cDNA using the HiScript III 1st Strand cDNA Synthesis Kit (Vazyme Biotech Co., Ltd., Nanjing, China). A total volume of 20 microliters was used for real-time PCR, which included 1 μL of specific primers, 3 μL of diluted samples, and 7.5 μL of ChamQ SYBR qPCR Master Mix (Vazyme Biotech Co., Ltd., Nanjing, China) on a qTower3G (Analytik Jena, Jena, Germany) under 40 cycles, with Tubulin serving as the internal reference, as outlined in Table S5.

4.6. Plasmid Construction and Plant Transformation

The sequence of BraASP1b was successfully synthesized following codon optimization and the addition of nucleotides at the 3′ UTR, including TGAATT and GGTGACC (BstEII), as depicted in Figure S3 (Azentz, Suzhou, China). The fragments of BraASP1b were constructed into pCAMBIA-1302 via homologous recombination using the ClonExpress II One Step Cloning Kit (Vazyme Biotech Co., Ltd., China). Recombinant clones were screened using kanamycin and sequenced with specific primers (BraASP1-ID) listed as follows: forward primer: 5′-ATGGCTATGATGGCTAGAAC-3′; reverse primer: 5′-AGACTTAGTAACCTCATGGA-3′. The recombinant plasmids were subsequently transformed into Agrobacterium GV3101 strains using an Eppendorf Eporator (Eppendorf, Hamburg, Germany). The Agrobacterium was then transformed into A. thaliana Col-0 via the floral-dip method [33] and into N. benthamiana using a semi-injection method [34]. Transgenic A. thaliana were screened using hygromycin to obtain T3 progeny for phenotype observations, enzyme activity detections, chlorophyll pigment analysis, and gene expression levels under low N (5 mmol·L−1 NO3) conditions, with high N (15 mmol·L−1 NO3) serving as a control. The BraASP1-GFP fusion protein was transferred into N. benthamiana for observation using Nikon A1R/A1 confocal microscopy (Nikon Corporation, Tokyo, Japan).

4.7. Physiological Assays

Col-0 and BraASP1b overexpressing A. thaliana lines were treated and harvested as previously described. The net photosynthetic rate, transpiration rate, intercellular carbon dioxide concentration (Ci), and stomatal conductance of the leaves were measured using a LI-6400 (LI-COR, Lincoln, NE, USA) platform. The enzymatic activities of NR, GS, and ASP were measured as previously described [17] and GOGAT [35]. Each experiment was repeated with three biological replicates.

5. Conclusions

N is essential for the growth of Chinese cabbage, necessitating an investigation into the function of ASPs in B. rapa. In this study, 10 BraASP genes were identified across the B. rapa genome, exhibiting similarities in coding sequence length, gene structure, and protein motifs. Phylogenetic analysis of ASP proteins in B. rapa, A. thaliana, O. sativa, B. napus, and B.oleracea revealed that BraASPs genes clustered with their homologs in A. thaliana, with closer evolutionary associations to B. napus and B. oleracea. Collinearity analysis of BraASP genes in the B. rapa genome identified nine collinear gene pairs, whereas comparative analysis revealed 13, 24, and 23 collinearity pairs between B. rapa and A. thaliana, B. napus, and B. oleracea, respectively, indicating frequent gene duplication events among these species. To examine the molecular functions of BraASP genes, their expression patterns were analyzed across various tissues, including roots, stems, leaves, flowers, siliques, and callus. Most BraASP genes were induced under low N conditions, with BraASP1b exhibiting consistent induction across all time points. Transcriptomic analysis showed that BraASP1b expression was suppressed during short-term low N treatment in low N-insensitive B. rapa lines but was induced under long-term low N conditions compared to sensitive lines. To further investigate BraASP1b function, transgenic A. thaliana lines overexpressing BraASP1b were generated. These lines exhibited increased biomass compared to Col-0 under both high and low N conditions, with higher enzyme activities of NR and GOGAT. Additionally, BraASP1b overexpression resulted in an increased net photosynthetic rate, transpiration rate, intercellular carbon dioxide concentration, stomatal conductance, and the activities of NR, GOGAT, and GS compared to Col-0. However, no significant changes were observed in the expression of nitrate transporter genes (NRT1.1, NRT1.2, NRT1.5, NRT2.1, and NRT2.7) between Col-0 and BraASP1b transgenic Arabidopsis lines. In contrast, several abiotic stress-related genes (RD29A, RD29B, and RD22) were significantly upregulated under low N conditions in BraASP1b transgenic A. thaliana, suggesting a role for BraASP1b in improving N utilization and stress response mechanisms.

Supplementary Materials

The following supporting information can be downloaded at: https://www.mdpi.com/article/10.3390/ijms26041586/s1.

Author Contributions

Conceptualization, Z.G. and C.L.; methodology, Z.G.; software, Y.W.; formal analysis, Y.L. (Yuge Li).; writing—original draft preparation, Y.L. (Yan Liu); writing—review and editing, Y.L. (Yan Liu). and Y.Z. (Yaowei Zhang); supervision, Y.Z. (Yan Zhang); funding acquisition, Y.L. (Yan Liu) and Y.Z. (Yaowei Zhang). All authors have read and agreed to the published version of the manuscript.

Funding

This study was funded by National Natural Science Foundation of China, grant number 32202483, and the Foundation for Key Research and Development Program of Heilongjiang Province, grant number SC2022ZX02C0202.

Institutional Review Board Statement

Not applicable.

Informed Consent Statement

Not applicable.

Data Availability Statement

The original contributions presented in this study are included in the article/Supplementary Material. Further inquiries can be directed to the corresponding author(s).

Conflicts of Interest

The authors declare no conflicts of interest.

References

  1. Ren, T.; Christie, P.; Wang, J.H.; Chen, Q.; Zhang, F.S. Root zone soil nitrogen management to maintain high tomato yields and minimum nitrogen losses to the environment. Sci. Hortic. 2010, 125, 25–33. [Google Scholar] [CrossRef]
  2. Lu, C.Q.; Tian, H.Q. Global nitrogen and phosphorus fertilizer use for agriculture production in the past half century: Shifted hot spots and nutrient imbalance. Earth Syst. Sci. Data 2017, 9, 181–192. [Google Scholar] [CrossRef]
  3. Xuan, W.; Beeckman, T.; Xu, G.H. Plant nitrogen nutrition: Sensing and signaling. Curr. Opin. Plant Biol. 2017, 39, 57–65. [Google Scholar] [CrossRef]
  4. Wang, Y.Y.; Cheng, Y.H.; Chen, K.E.; Tsay, Y.F. Nitrate Transport, Signaling, and Use Efficiency. Annu. Rev. Plant Biol. 2018, 69, 85–122. [Google Scholar] [CrossRef]
  5. Masclaux-Daubresse, C.; Daniel-Vedele, F.; Dechorgnat, J.; Chardon, F.; Gaufichon, L.; Suzuki, A. Nitrogen uptake, assimilation and remobilization in plants: Challenges for sustainable and productive agriculture. Ann. Bot. 2010, 105, 1141–1157. [Google Scholar] [CrossRef]
  6. Gojon, A.; Krouk, G.; Perrine-Walker, F.; Laugier, E. Nitrate transceptor(s) in plants. J. Exp. Bot. 2011, 62, 2299–2308. [Google Scholar] [CrossRef]
  7. Kant, S. Understanding nitrate uptake, signaling and remobilisation for improving plant nitrogen use efficiency. Semin. Cell Dev. Biol. 2018, 74, 89–96. [Google Scholar] [CrossRef]
  8. The, S.V.; Snyder, R.; Tegeder, M. Targeting Nitrogen Metabolism and Transport Processes to Improve Plant Nitrogen Use Efficiency. Front. Plant Sci. 2020, 11, 628366. [Google Scholar] [CrossRef]
  9. Kishorekumar, R.; Bulle, M.; Wany, A.; Gupta, K.J. An Overview of Important Enzymes Involved in Nitrogen Assimilation of Plants. Methods Mol. Biol. 2020, 2057, 1–13. [Google Scholar]
  10. Lebedev, V.G.; Popova, A.A.; Shestibratov, K.A. Genetic Engineering and Genome Editing for Improving Nitrogen Use Efficiency in Plants. Cells 2021, 10, 3303. [Google Scholar] [CrossRef]
  11. de la Torre, F.; El-Azaz, J.; Avila, C.; Cánovas, F.M. Deciphering the Role of Aspartate and Prephenate Aminotransferase Activities in Plastid Nitrogen Metabolism. Plant Physiol. 2014, 164, 92–104. [Google Scholar] [CrossRef] [PubMed]
  12. Brauc, S.; De Vooght, E.; Claeys, M.; Höfte, M.; Angenon, G. Influence of over-expression of cytosolic aspartate aminotransferase on amino acid metabolism and defence responses against infection in. J. Plant Physiol. 2011, 168, 1813–1819. [Google Scholar] [CrossRef] [PubMed]
  13. Zhou, Y.; Cai, H.M.; Xiao, J.H.; Li, X.H.; Zhang, Q.F.; Lian, X.M. Over-expression of aspartate aminotransferase genes in rice resulted in altered nitrogen metabolism and increased amino acid content in seeds. Theor. Appl. Genet. 2009, 118, 1381–1390. [Google Scholar] [CrossRef] [PubMed]
  14. Chandra, H.M.; Mark, W.; Allen, G.G. The impact on nitrogen-efficient phenotypes when aspartate aminotransferase is expressed tissue-specifically in Brassica napus. New Negat. Plant Sci. 2016, 3, 1–9. [Google Scholar]
  15. Liu, Y.; Guan, X.Y.; Liu, S.N.; Yang, M.; Ren, J.H.; Guo, M.; Huang, Z.H.; Zhang, Y.W. Genome-Wide Identification and Analysis of TCP Transcription Factors Involved in the Formation of Leafy Head in Chinese Cabbage. Int. J. Mol. Sci. 2018, 19, 847. [Google Scholar] [CrossRef]
  16. Padilla, F.M.; Gallardo, M.; Peña-Fleitas, M.T.; de Souza, R.; Thompson, R.B. Proximal Optical Sensors for Nitrogen Management of Vegetable Crops: A Review. Sensors 2018, 18, 2083. [Google Scholar] [CrossRef]
  17. Liu, Y.; Yang, Y.; Zhang, X.F.; Zhang, H.C.; Ren, Y.N.; Gu, R.; Zhang, Y.W. Dynamic transcriptome and coexpression network analysis of Chinese cabbage seedling responses to low-nitrogen stress. Sci. Hortic. 2024, 328, 112866. [Google Scholar] [CrossRef]
  18. Miesak, B.H.; Coruzzi, G.M. Molecular and physiological analysis of Arabidopsis mutants defective in cytosolic or chloroplastic aspartate aminotransferase. Plant Physiol. 2002, 129, 650–660. [Google Scholar] [CrossRef]
  19. Schultz, C.J.; Coruzzi, G.M. The aspartate aminotransferase gene family of Arabidopsis encodes isoenzymes localized to three distinct subcellular compartments. Plant J. Cell Mol. Biol. 1995, 7, 61–75. [Google Scholar] [CrossRef]
  20. Nunes-Nesi, A.; Fernie, A.R.; Stitt, M. Metabolic and signaling aspects underpinning the regulation of plant carbon nitrogen interactions. Mol. Plant 2010, 3, 973–996. [Google Scholar] [CrossRef]
  21. Hwang, I.S.; An, S.H.; Hwang, B.K. Pepper is required for plant nitrogen assimilation and defense responses to microbial pathogens. Plant J. 2011, 67, 749–762. [Google Scholar] [CrossRef] [PubMed]
  22. Deng, P.; Jing, W.; Cao, C.J.; Sun, M.F.; Chi, W.C.; Zhao, S.L.; Dai, J.Y.; Shi, X.Y.; Wu, Q.; Zhang, B.L.; et al. Transcriptional repressor RST1 controls salt tolerance and grain yield in rice by regulating gene expression of asparagine synthetase. Proc. Natl. Acad. Sci. USA 2022, 119, e2210338119. [Google Scholar] [CrossRef] [PubMed]
  23. Maaroufi-Dguimi, H.; Debouba, M.; Gaufichon, L.; Clement, G.; Gouia, H.; Hajjaji, A.; Suzuki, A. An Arabidopsis mutant disrupted in ASN2 encoding asparagine synthetase 2 exhibits low salt stress tolerance. Plant Physiol. Biochem. PPB 2011, 49, 623–628. [Google Scholar] [CrossRef] [PubMed]
  24. Li, Y.J.; Wang, M.L.; Zhang, F.X.; Xu, Y.D.; Chen, X.H.; Qin, X.L.; Wen, X.X. Effect of post-silking drought on nitrogen partitioning and gene expression patterns of glutamine synthetase and asparagine synthetase in two maize varieties. Plant Physiol. Biochem. 2016, 102, 62–69. [Google Scholar] [CrossRef]
  25. Yang, M.; Geng, M.Y.; Shen, P.F.; Chen, X.H.; Li, Y.J.; Wen, X.X. Effect of post-silking drought stress on the expression profiles of genes involved in carbon and nitrogen metabolism during leaf senescence in maize. Plant Physiol. Biochem. 2019, 135, 304–309. [Google Scholar] [CrossRef]
  26. Msanne, J.; Lin, J.S.; Stone, J.M.; Awada, T. Characterization of abiotic stress-responsive Arabidopsis thaliana RD29A and RD29B genes and evaluation of transgenes. Planta 2011, 234, 97–107. [Google Scholar] [CrossRef]
  27. Neves-Borges, A.C.; Guimaraes-Dias, F.; Cruz, F.; Mesquita, R.O.; Nepomuceno, A.L.; Romano, E.; Loureiro, M.E.; Grossi-de-Sá, M.D.; Alves-Ferreira, M. Expression pattern of drought stress marker genes in soybean roots under two water deficit systems. Genet. Mol. Biol. 2012, 35, 212–221. [Google Scholar] [CrossRef]
  28. Zhu, D.; Bai, X.; Zhu, Y.M.; Cai, H.; Li, Y.; Ji, W.; Chen, C.; An, L.; Zhu, Y. Isolation and functional analysis of GsTIFY11b relevant to salt and alkaline stress from Glycine soja. Yi Chuan = Hereditas 2012, 34, 230–239. [Google Scholar] [CrossRef]
  29. Artus, N.N.; Uemura, M.; Steponkus, P.L.; Gilmour, S.J.; Lin, C.; Thomashow, M.F. Constitutive expression of the cold-regulated Arabidopsis thaliana COR15a gene affects both chloroplast and protoplast freezing tolerance. Proc. Natl. Acad. Sci. USA 1996, 93, 13404–13409. [Google Scholar] [CrossRef]
  30. Strizhov, N.; Abraham, E.; Okresz, L.; Blickling, S.; Zilberstein, A.; Schell, J.; Koncz, C.; Szabados, L. Differential expression of two P5CS genes controlling proline accumulation during salt-stress requires ABA and is regulated by ABA1, ABI1 and AXR2 in Arabidopsis. Plant J. Cell Mol. Biol. 1997, 12, 557–569. [Google Scholar] [CrossRef]
  31. Wang, Y.P.; Tang, H.B.; DeBarry, J.D.; Tan, X.; Li, J.P.; Wang, X.Y.; Lee, T.H.; Jin, H.Z.; Marler, B.; Guo, H.; et al. MCScanX: A toolkit for detection and evolutionary analysis of gene synteny and collinearity. Nucleic Acids Res. 2012, 40, e49. [Google Scholar] [CrossRef] [PubMed]
  32. Chen, C.J.; Chen, H.; Zhang, Y.; Thomas, H.R.; Frank, M.H.; He, Y.H.; Xia, R. TBtools: An Integrative Toolkit Developed for Interactive Analyses of Big Biological Data. Mol. Plant 2020, 13, 1194–1202. [Google Scholar] [CrossRef] [PubMed]
  33. Clough, S.J.; Bent, A.F. Floral dip: A simplified method for Agrobacterium-mediated transformation of Arabidopsis thaliana. Plant J. Cell Mol. Biol. 1998, 16, 735–743. [Google Scholar] [CrossRef] [PubMed]
  34. Erickson, J.L.; Ziegler, J.; Guevara, D.; Abel, S.; Klösgen, R.B.; Mathur, J.; Rothstein, S.J.; Schattat, M.H. Agrobacterium-derived cytokinin influences plastid morphology and starch accumulation in Nicotiana benthamiana during transient assays. BMC Plant Biol. 2014, 14, 127. [Google Scholar] [CrossRef] [PubMed]
  35. Zeng, D.D.; Qin, R.; Li, M.; Alamin, M.; Jin, X.L.; Liu, Y.; Shi, C.H. The ferredoxin-dependent glutamate synthase (OsFd-GOGAT) participates in leaf senescence and the nitrogen remobilization in rice. Mol. Genet. Genom. MGG 2017, 292, 385–395. [Google Scholar] [CrossRef]
Figure 1. Whole phylogenetic tree and collinearity analysis of ASP members among A. thaliana, O. sativa, B. rapa, B. oleracea, and B. nap. (A) Whole phylogenetic tree of ASP protein among A. thaliana, O. sativa, B. rapa, B. oleracea, and B. nap; (B) The collinearity analysis of ASP members in B. rapa; (C) The collinearity analysis of ASP members among A. thaliana, O. sativa, B. rapa, B. oleracea, and B. nap.
Ijms 26 01586 g001
Figure 2. The structures and expression levels of BraASP members. (A) The phylogenetic tree of BraASP proteins; (B) The gene structures of BraASP members; (C) The protein motifs of BraASPs; (D) The expression levels of BraASPs in callus, flower, leaf, root, silique, stem; (E) The expression patterns of BraASPs under low N treatment for 0, 3, 6, 12, and 24 h.
Ijms 26 01586 g002
Figure 3. The expression levels of BraASP members in sensitive (SL) and tolerant inbred lines (TL) of Chinese cabbage in response to low N under short (24 h) and long (20d) treatments by transcriptome analysis. Data are means ± SD with three biological repetitions; different letters represent significant differences (p < 0.05) between all values.
Ijms 26 01586 g003
Figure 4. The identification and phenotypes of overexpressed BraASP1b transgenic A. thaliana lines under high and low N conditions. (A) The identification of overexpressed BraASP1b transgenic A. thaliana lines by PCR; (B) The expression levels of BraASP1b in overexpressed transgenic A. thaliana lines; (C) The phenotypes of overexpressed BraASP1b transgenic A. thaliana lines under high and low N conditions; (D) The fresh weights of BraASP1b transgenic A. thaliana lines under high and low N conditions. Data are means ± SD with three biological repetitions; different letters represent significant differences (p < 0.05) between all values.
Ijms 26 01586 g004
Figure 5. The subcellular localization of 35S::BraASP1b-GFP in N. benthamiana.
Ijms 26 01586 g005
Figure 6. The physiological characteristics of BraASP1b overexpressed transgenic A. thaliana lines under high and low N conditions. (A) The photosynthetic characteristics of net photosynthetic rate, respiration rate, intercellular carbon dioxide concentration (Ci) and stomatal conductance in Col-0 and BraASP1b overexpressed transgenic A. thaliana under high and low N; (B) The contents of chlorophylls and carotenoids in Col-0 and BraASP1b overexpressed transgenic A. thaliana under high and low N; (C) The activities of N-metabolism-related enzymes in Col-0 and overexpressed BraASP1b transgenic A. thaliana lines under high and low N conditions. Data are means ± SD with three biological repetitions; different letters represent significant differences (p < 0.05) between all values.
Ijms 26 01586 g006
Figure 7. The expression levels of abiotic stress and N-metabolism-related genes in overexpressed BraASP1b A. thaliana lines under low N stresses. (A) The expression levels of N-transporter genes in overexpressed BraASP1b transgenic lines under low N stresses; (B) The expression levels of abiotic stress-related genes in overexpressed BraASP1b A. thaliana lines under low N stresses. Data are means ± SD with three biological repetitions; different letters represent significant differences (p < 0.05) between all values.
Ijms 26 01586 g007
Disclaimer/Publisher’s Note: The statements, opinions and data contained in all publications are solely those of the individual author(s) and contributor(s) and not of MDPI and/or the editor(s). MDPI and/or the editor(s) disclaim responsibility for any injury to people or property resulting from any ideas, methods, instructions or products referred to in the content.

