Article

Machine Learning-Aided Optimization of In Vitro Tetraploid Induction in Cannabis

Department of Plant Agriculture, University of Guelph, Guelph, ON N1G 2W1, Canada
*
Author to whom correspondence should be addressed.
Int. J. Mol. Sci. 2025, 26(4), 1746; https://doi.org/10.3390/ijms26041746
Submission received: 11 December 2024 / Revised: 13 February 2025 / Accepted: 15 February 2025 / Published: 18 February 2025

Abstract

:
Polyploidy, characterized by an increase in the number of whole sets of chromosomes in an organism, offers a promising avenue for cannabis improvement. Polyploid cannabis plants often exhibit altered morphological, physiological, and biochemical characteristics with a number of potential benefits compared to their diploid counterparts. The optimization of polyploidy induction, such as the level of antimitotic agents and exposure duration, is essential for successful polyploidization to maximize survival and tetraploid rates while minimizing the number of chimeric mixoploids. In this study, three classification-based machine learning algorithms—probabilistic neural network (PNN), support vector classification (SVC), and k-nearest neighbors (KNNs)—were used to model ploidy levels based on oryzalin concentration and exposure time. The results indicated that PNN outperformed both KNNs and SVC. Subsequently, PNN was combined with a genetic algorithm (GA) to optimize oryzalin concentration and exposure time to maximize tetraploid induction rates. The PNN-GA results predicted that the optimal conditions were a concentration of 32.98 µM of oryzalin for 17.92 h. A validation study testing these conditions confirmed the accuracy of the PNN-GA model, resulting in 93.75% tetraploid induction, with the remaining 6.25% identified as mixoploids. Additionally, the evaluation of morphological traits showed that tetraploid plants were more vigorous and had larger leaf sizes compared to diploid or mixoploid plants in vitro.

Graphical Abstract

1. Introduction

Polyploidy, defined as the condition of having more than two complete sets of chromosomes per cell nucleus, plays a crucial role in plant evolution and diversification [1]. While diploid organisms possess two sets of chromosomes, polyploid organisms can have multiple sets, such as triploids with three, tetraploids with four, and octoploids with eight [2,3]. This phenomenon is notably prevalent in agriculture, with up to 40% of cultivated crops being polyploids, presumably due to the phenotypic implications such as larger leaves, flowers, and fruits [4]. For example, modern bananas are triploid [5], potatoes are generally tetraploid [6], wheat is hexaploid [7], and cultivated strawberries are octoploid [8], illustrating the diverse application and significance of polyploidy in crop development and improvement.
In cannabis, polyploidy induction has garnered significant attention for its potential to enhance cannabinoid production and overall plant vigor [9,10,11]. Cannabis is typically a diploid species; however, instances of naturally occurring triploids and tetraploids have been reported [12,13,14]. Despite the promise, research on artificial polyploid induction in cannabis is still in its early stages, with only a few studies conducted to date and conflicting results likely resulting from genotypic variability [15,16,17,18]. This highlights critical gaps in the literature that underscore the need for further investigation to fully understand and harness the benefits of polyploidy in this economically and medically important crop.
Generally, polyploidy results in several significant biological and agricultural advantages, including larger cell sizes that can translate into increased dimensions of stems, roots, leaves, flowers, and fruits [1,19,20,21]. It also alters secondary metabolite profiles, which can affect plant chemistry and interactions with their environment in various ways [22]. Additionally, polyploidy enhances tolerance to various abiotic stresses in some species, such as drought and salinity tolerance, contributing to plant resilience [23,24,25]. Further, multiple copies of each gene can result in more and different allelic combinations to generate a wide range of phenotypic diversity, which is beneficial for targeted selection in breeding programs [26,27]. This also increases the potential for heterosis, or hybrid vigor, potentially leading to more robust and productive hybrid plants [28,29]. Of particular relevance to cannabis, it can also facilitate the production of seedless plants, especially at odd levels of ploidy, which is valuable to facilitate the production of seedless cannabis flowers in environments where pollen may be present [5].
To generate artificial polyploids, antimitotic agents are used to disrupt the natural cell cycle [30,31]. During mitosis, chromosomes duplicate during interphase, align along the cell’s equator in metaphase, and are separated by spindle fibers during anaphase, resulting in the division of the cell into two daughter cells [32]. The application of antimitotic agents, such as oryzalin, can alter this process by inhibiting the formation of functional spindles [22]. As a result, proper chromosome segregation is disrupted, and following cell division, tetraploid cells are produced. This ability to induce polyploidy through antimitotic agents offers a valuable tool for plant breeding and genetic studies [22]. However, polyploidy induction faces several challenges, primarily due to the complex nature of meristems that consist of numerous cells in various stages of the cell cycle, and not all cells respond uniformly to antimitotic agents [33]. This can lead to the production of mixoploids, a chimeric form of polyploidy where cells within the same organism exhibit different levels of ploidy, such as both diploid and tetraploid cells [34]. This heterogeneity poses a significant hurdle, as mixoploids can revert to the diploid state, making it difficult to obtain stable polyploid lines [33]. Achieving consistent and uniform polyploidy is crucial to producing stable tetraploid clonal lines and for reliable use in plant breeding programs [35].
The concentration of antimitotic agents (e.g., oryzalin and colchicine) and the duration of exposure are critical factors influencing the success of polyploidy induction and can impact the rate of mixoploid production [22,36]. To optimize these conditions, it is essential to choose the appropriate oryzalin concentration and exposure time to maximize tetraploid induction with minimal mixoploid formation, which necessitates testing various combinations of oryzalin concentrations and exposure times [35]. Traditionally, this is done using a factorial experimental design, but this requires large numbers of treatments and is often logistically challenging. For instance, testing 10 concentrations at 10 different exposure times results in 100 treatments, making the process tedious, time-consuming, and costly. Moreover, there is a concern that the optimal combination might be among the levels excluded from the treatments. To address these challenges, the application of machine learning (ML) presents a promising avenue for optimizing these conditions more efficiently [37].
Machine learning, a subfield of artificial intelligence, involves the creation of predictive models using provided data and algorithms [38,39]. It encompasses supervised, unsupervised, and reinforcement learning methods [40]. In tissue culture, supervised ML is commonly employed to develop in vitro culture protocols [41]. This approach utilizes datasets containing features such as hormone concentrations and labels, including polyploidy level and regeneration rate. Labels in supervised machine learning are further categorized into quantitative parameters like shoot regeneration rate and qualitative parameters such as ploidy level. Depending on the type of label, supervised machine learning is further classified into regression for quantitative data and classification for qualitative data [37]. Previous studies have demonstrated the applicability and reliability of regression-based ML algorithms in predicting and optimizing various in vitro culture systems such as seed germination [42], direct organogenesis [43], shoot proliferation [44], callogenesis [45], androgenesis [46], somatic embryogenesis [47], rooting [48], and gene transformation [49].
In relation to polyploid induction, classification-based ML is suitable for predicting whether a micro-propagated plant is tetraploid, diploid, or mixoploid. This process involves training a model using labeled data, where each instance is associated with a class label indicating its ploidy level. The model learns patterns and features from the input data to make predictions about the class membership of new, unseen instances [41]. Classification algorithms, such as support vector machines, K-nearest neighbors, and neural networks, are commonly used in this context to achieve accurate and reliable classification results [37]. This application of ML offers a valuable tool for identifying and selecting tetraploids in polyploidy engineering studies.
The main objective of this study was the optimization of conditions for tetraploid induction in cannabis. Therefore, the current study was performed (i) to evaluate the effect of different concentrations of oryzalin at various exposure times on in vitro tetraploid induction, (ii) to evaluate and compare the applicability and reliability of different classification-based ML algorithms for modeling and predicting the level of ploidy, (iii) to optimize oryzalin concentrations and exposure durations to maximize tetraploid induction using an optimization algorithm, and finally (iv) to evaluate and compare different leaf-related morphological traits in diploid and tetraploid plants.

2. Results

2.1. Effects of Different Concentrations of Oryzalin and Different Exposure Times on Tetraploid Induction

Different treatments resulted in varying responses, including diploid, mixoploid, and tetraploid (Figure 1A).
For instance, 0, 2, and 5 µM of oryzalin for different exposure times, as well as 10 µM of oryzalin for 12 h produced only diploid plants, while 100 µM of oryzalin for 10 h resulted in the induction of mixoploid plants (Figure 2). The highest rate (87.5%) of tetraploid induction was observed in 60 µM of oryzalin + 36 h and 80 µM of oryzalin + 24 h, followed by 40 µM of oryzalin + 24 h, 40 µM of oryzalin + 36 h, and 60 µM of oryzalin + 24 h at 81.25% tetraploid induction rate (Figure 2).

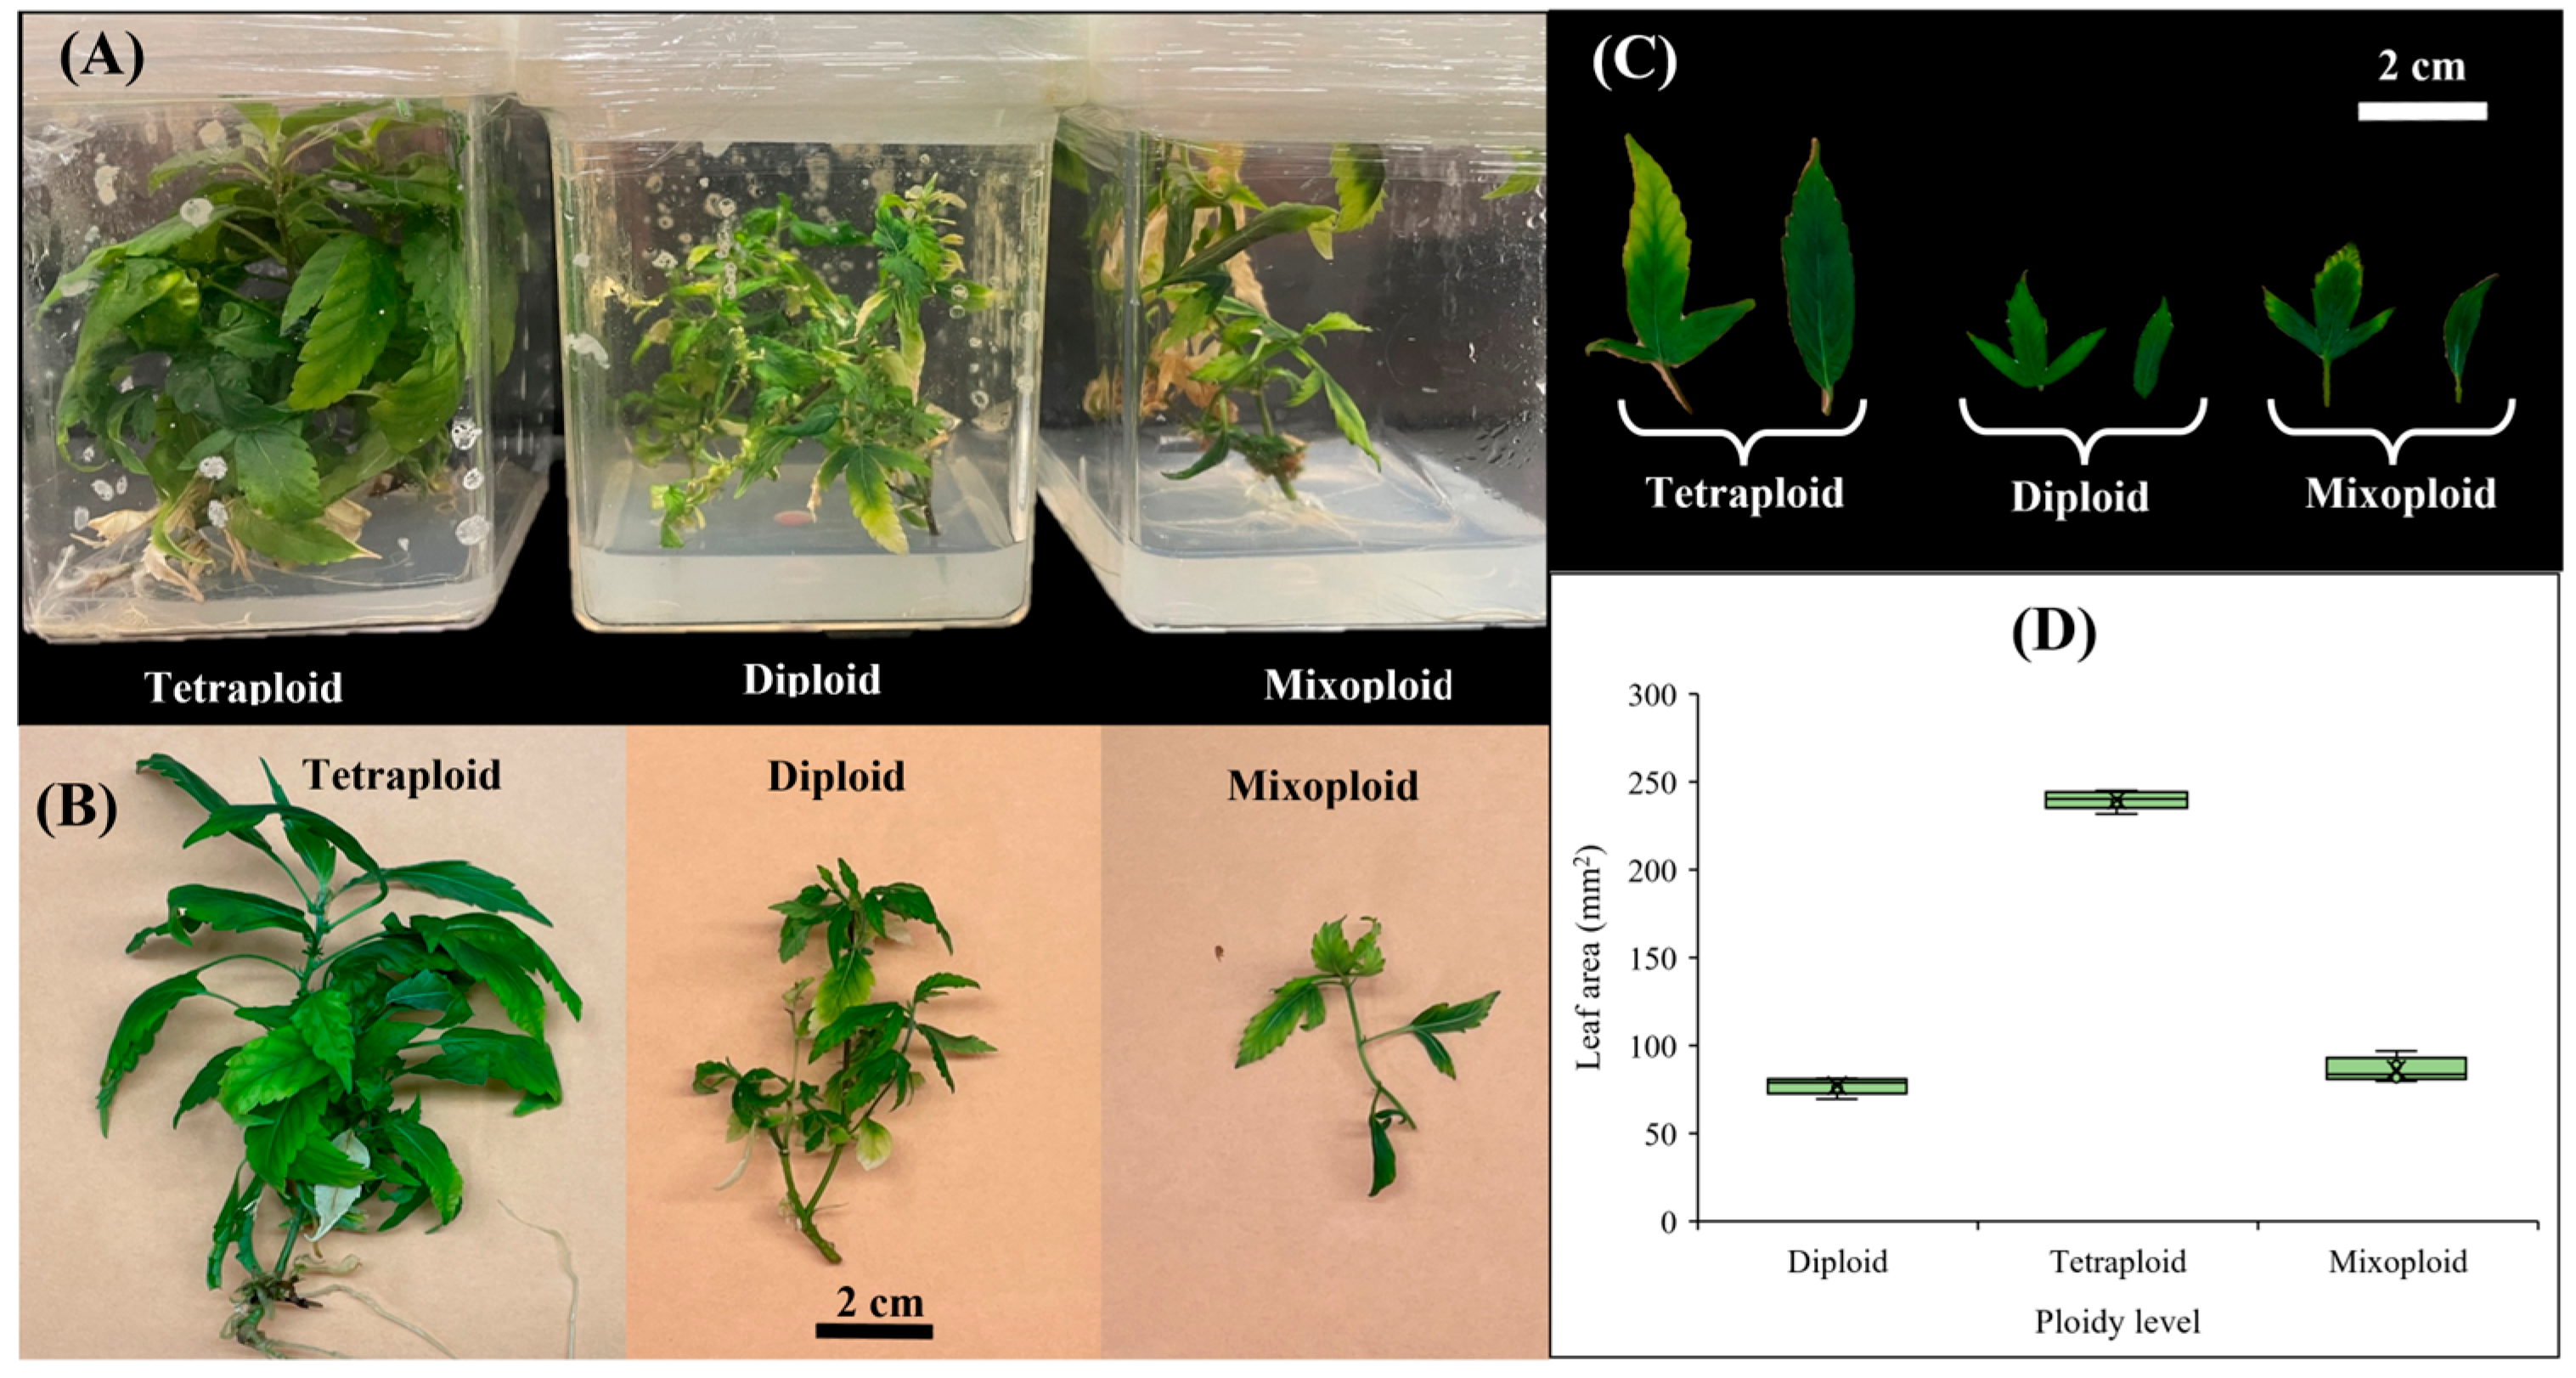
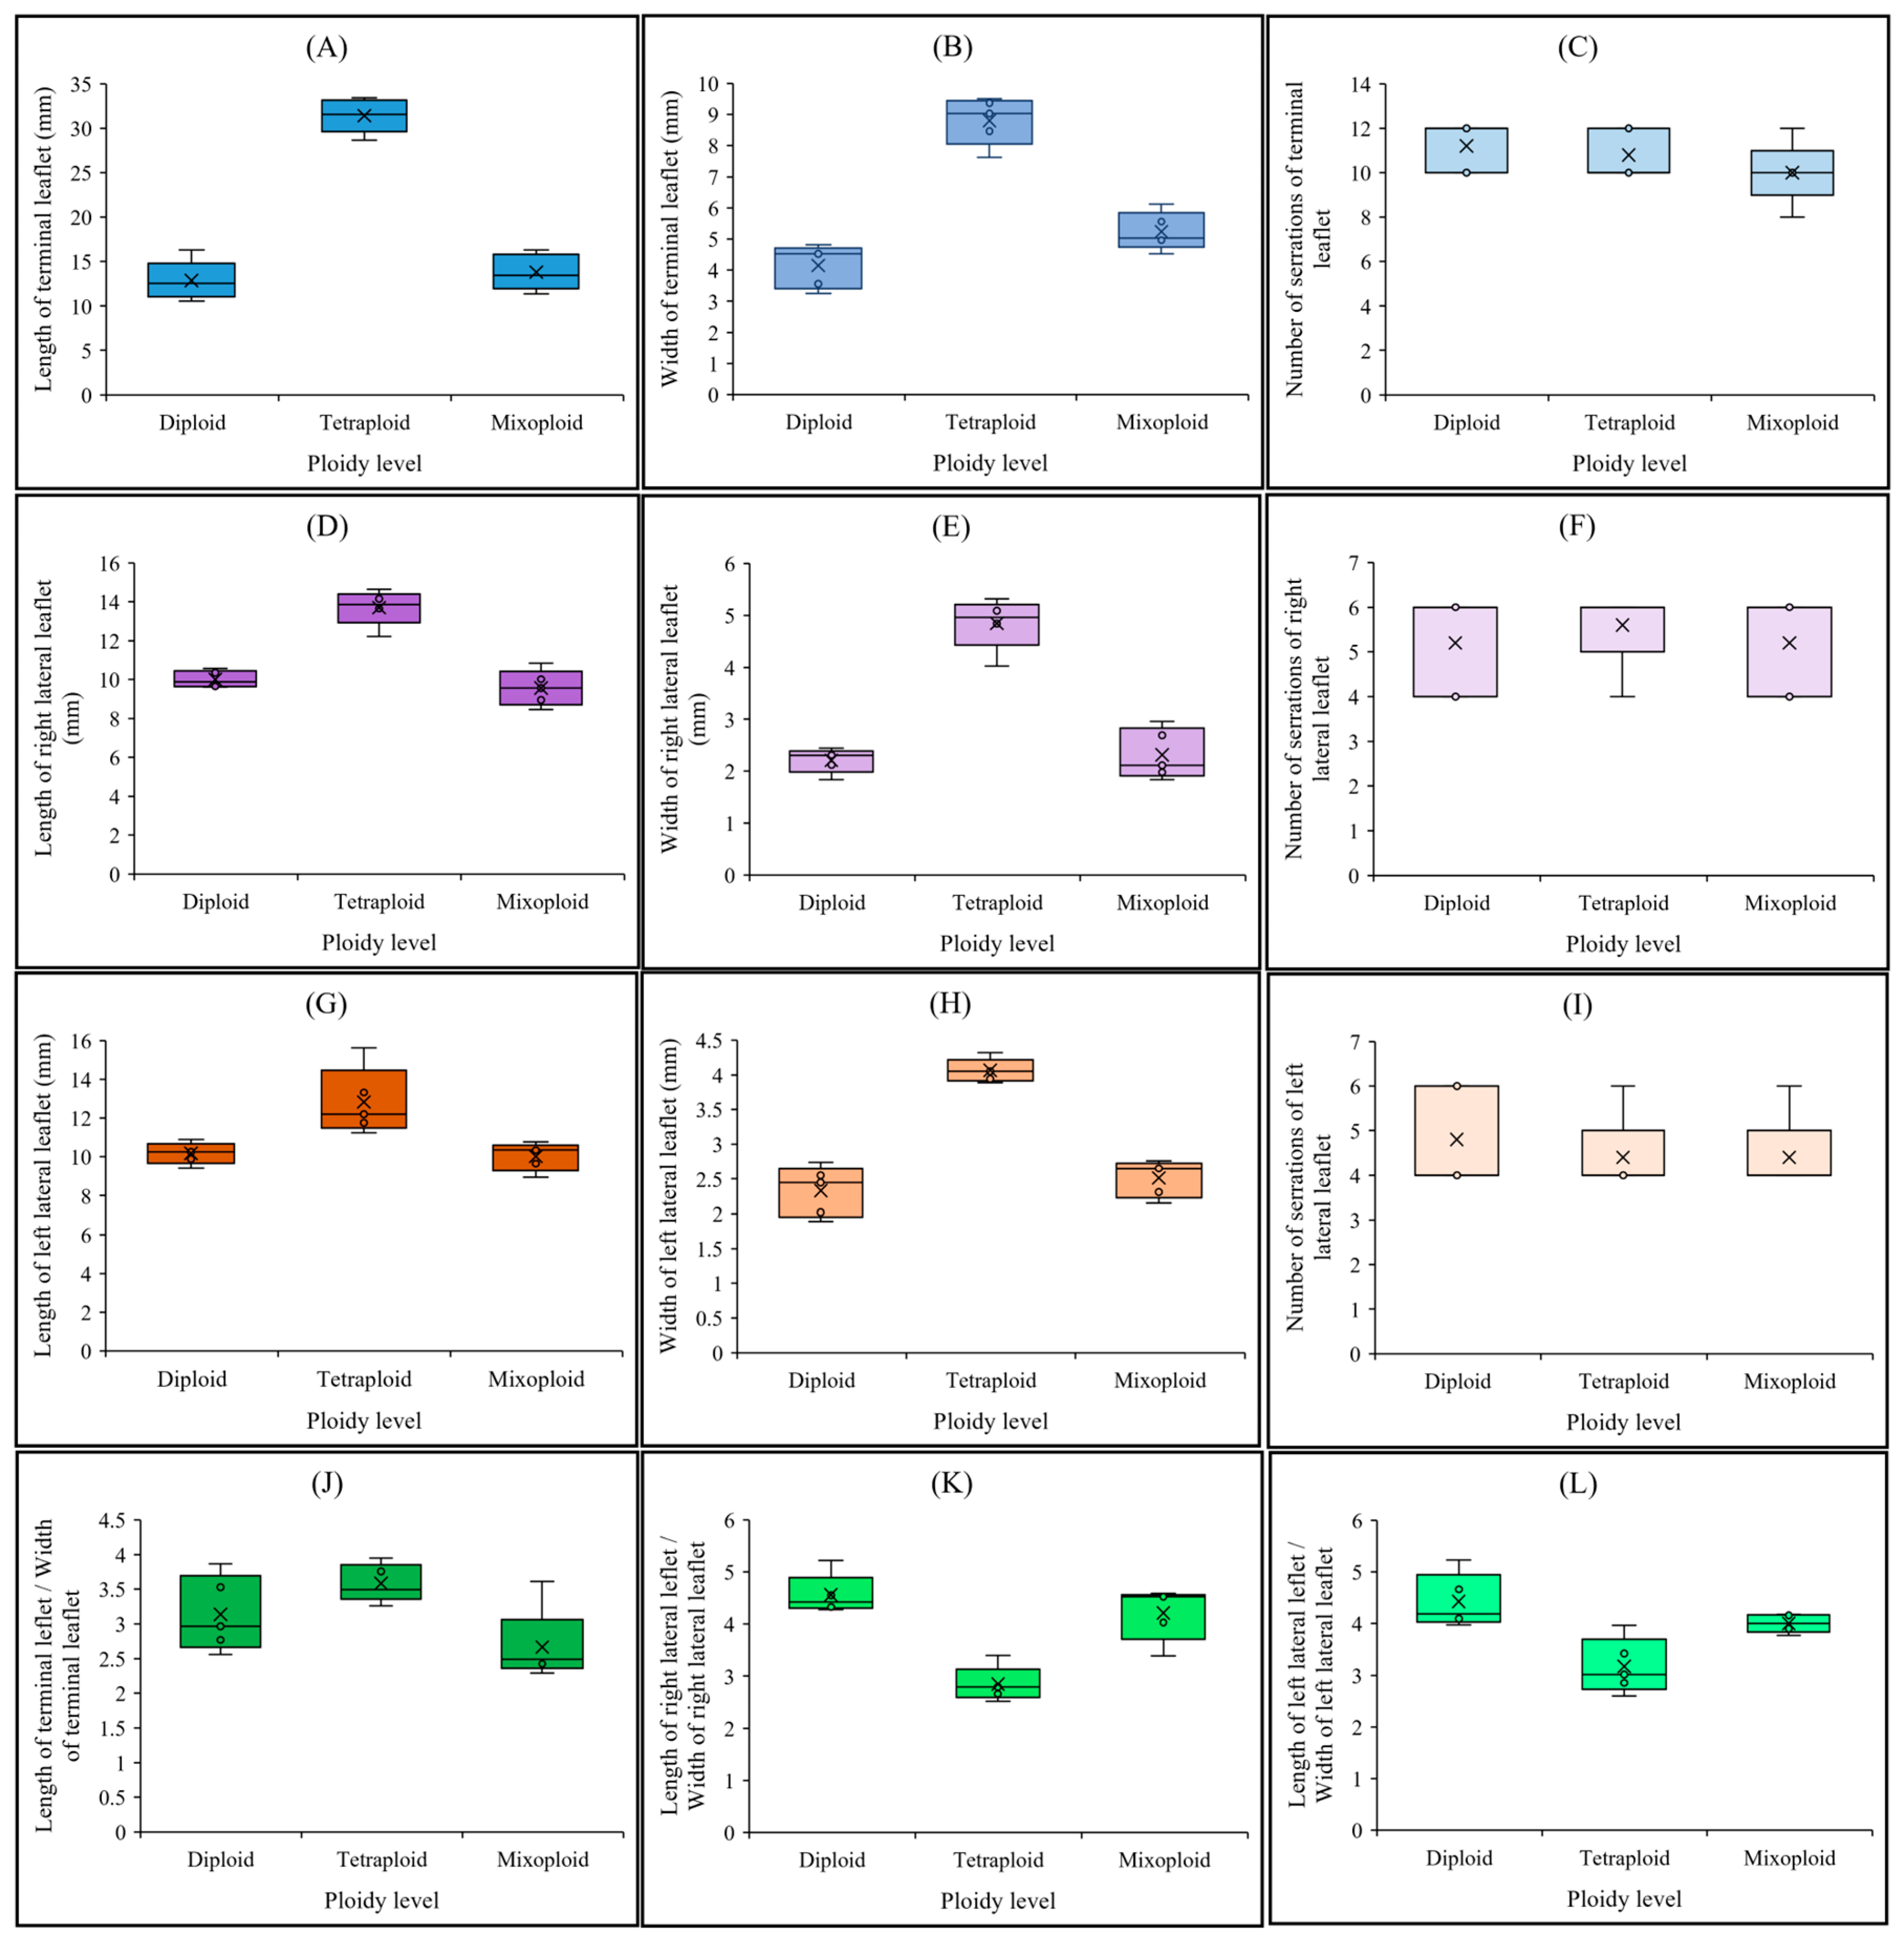
2.2. Leaf-Related Morphological Traits in Diploid, Mixoploid, and Tetraploid Plants

As shown in Figure 1B, there were significant differences between tetraploids and diploids. Tetraploids produce larger and more vigorous plants compared to diploids (Figure 1B). The leaves of tetraploid plants were nearly triple the size of those of diploid or mixoploid plants (Figure 1C). For instance, the leaf area of tetraploid plants (239.77 ± 5.24 mm2) was approximately three times larger than that of diploid (77.18 ± 4.90 mm2) or mixoploid (86.04 ± 6.88 mm2) plants (Figure 1D). The length of the terminal leaflet (Figure 3A) in tetraploid plants (31.42 ± 1.92 mm) was approximately twice that of diploid (12.86 ± 2.19 mm) or mixoploid (13.81 ± 2.02 mm) plants. A similar pattern was observed for the width of the terminal leaflet (Figure 3B), as well as the width of both the right (Figure 3E) and left (Figure 3H) lateral leaflets. Although the length of the right (Figure 3D) and left (Figure 3G) lateral leaflets in tetraploids was higher than in both diploid and mixoploid plants, there were negligible differences in the number of serrations in both the terminal (Figure 3C) and lateral leaflets (Figure 3F,I) across all ploidy levels. In addition, tetraploid plants showed no significant differences in the leaflet length-to-width ratios for the terminal (Figure 3J), right lateral (Figure 3K), and left lateral (Figure 3L) leaflets compared to diploid plants. This indicates that the lengths and widths of both terminal and lateral leaflets in diploid and tetraploid plants grew synchronously.
According to the correlation analysis (Figure 4), the ploidy level exhibited significant positive correlations with leaf area, the length of the terminal leaflet, the length of the right lateral leaflet, the length of the left lateral leaflet, the width of the terminal leaflet, the width of the right lateral leaflet, and the width of the left lateral leaflet. However, there were no significant correlations between ploidy levels and leaf marginal patterning (i.e., the number of serrations in the terminal leaflet and both the right and left lateral leaflets) (Figure 4).

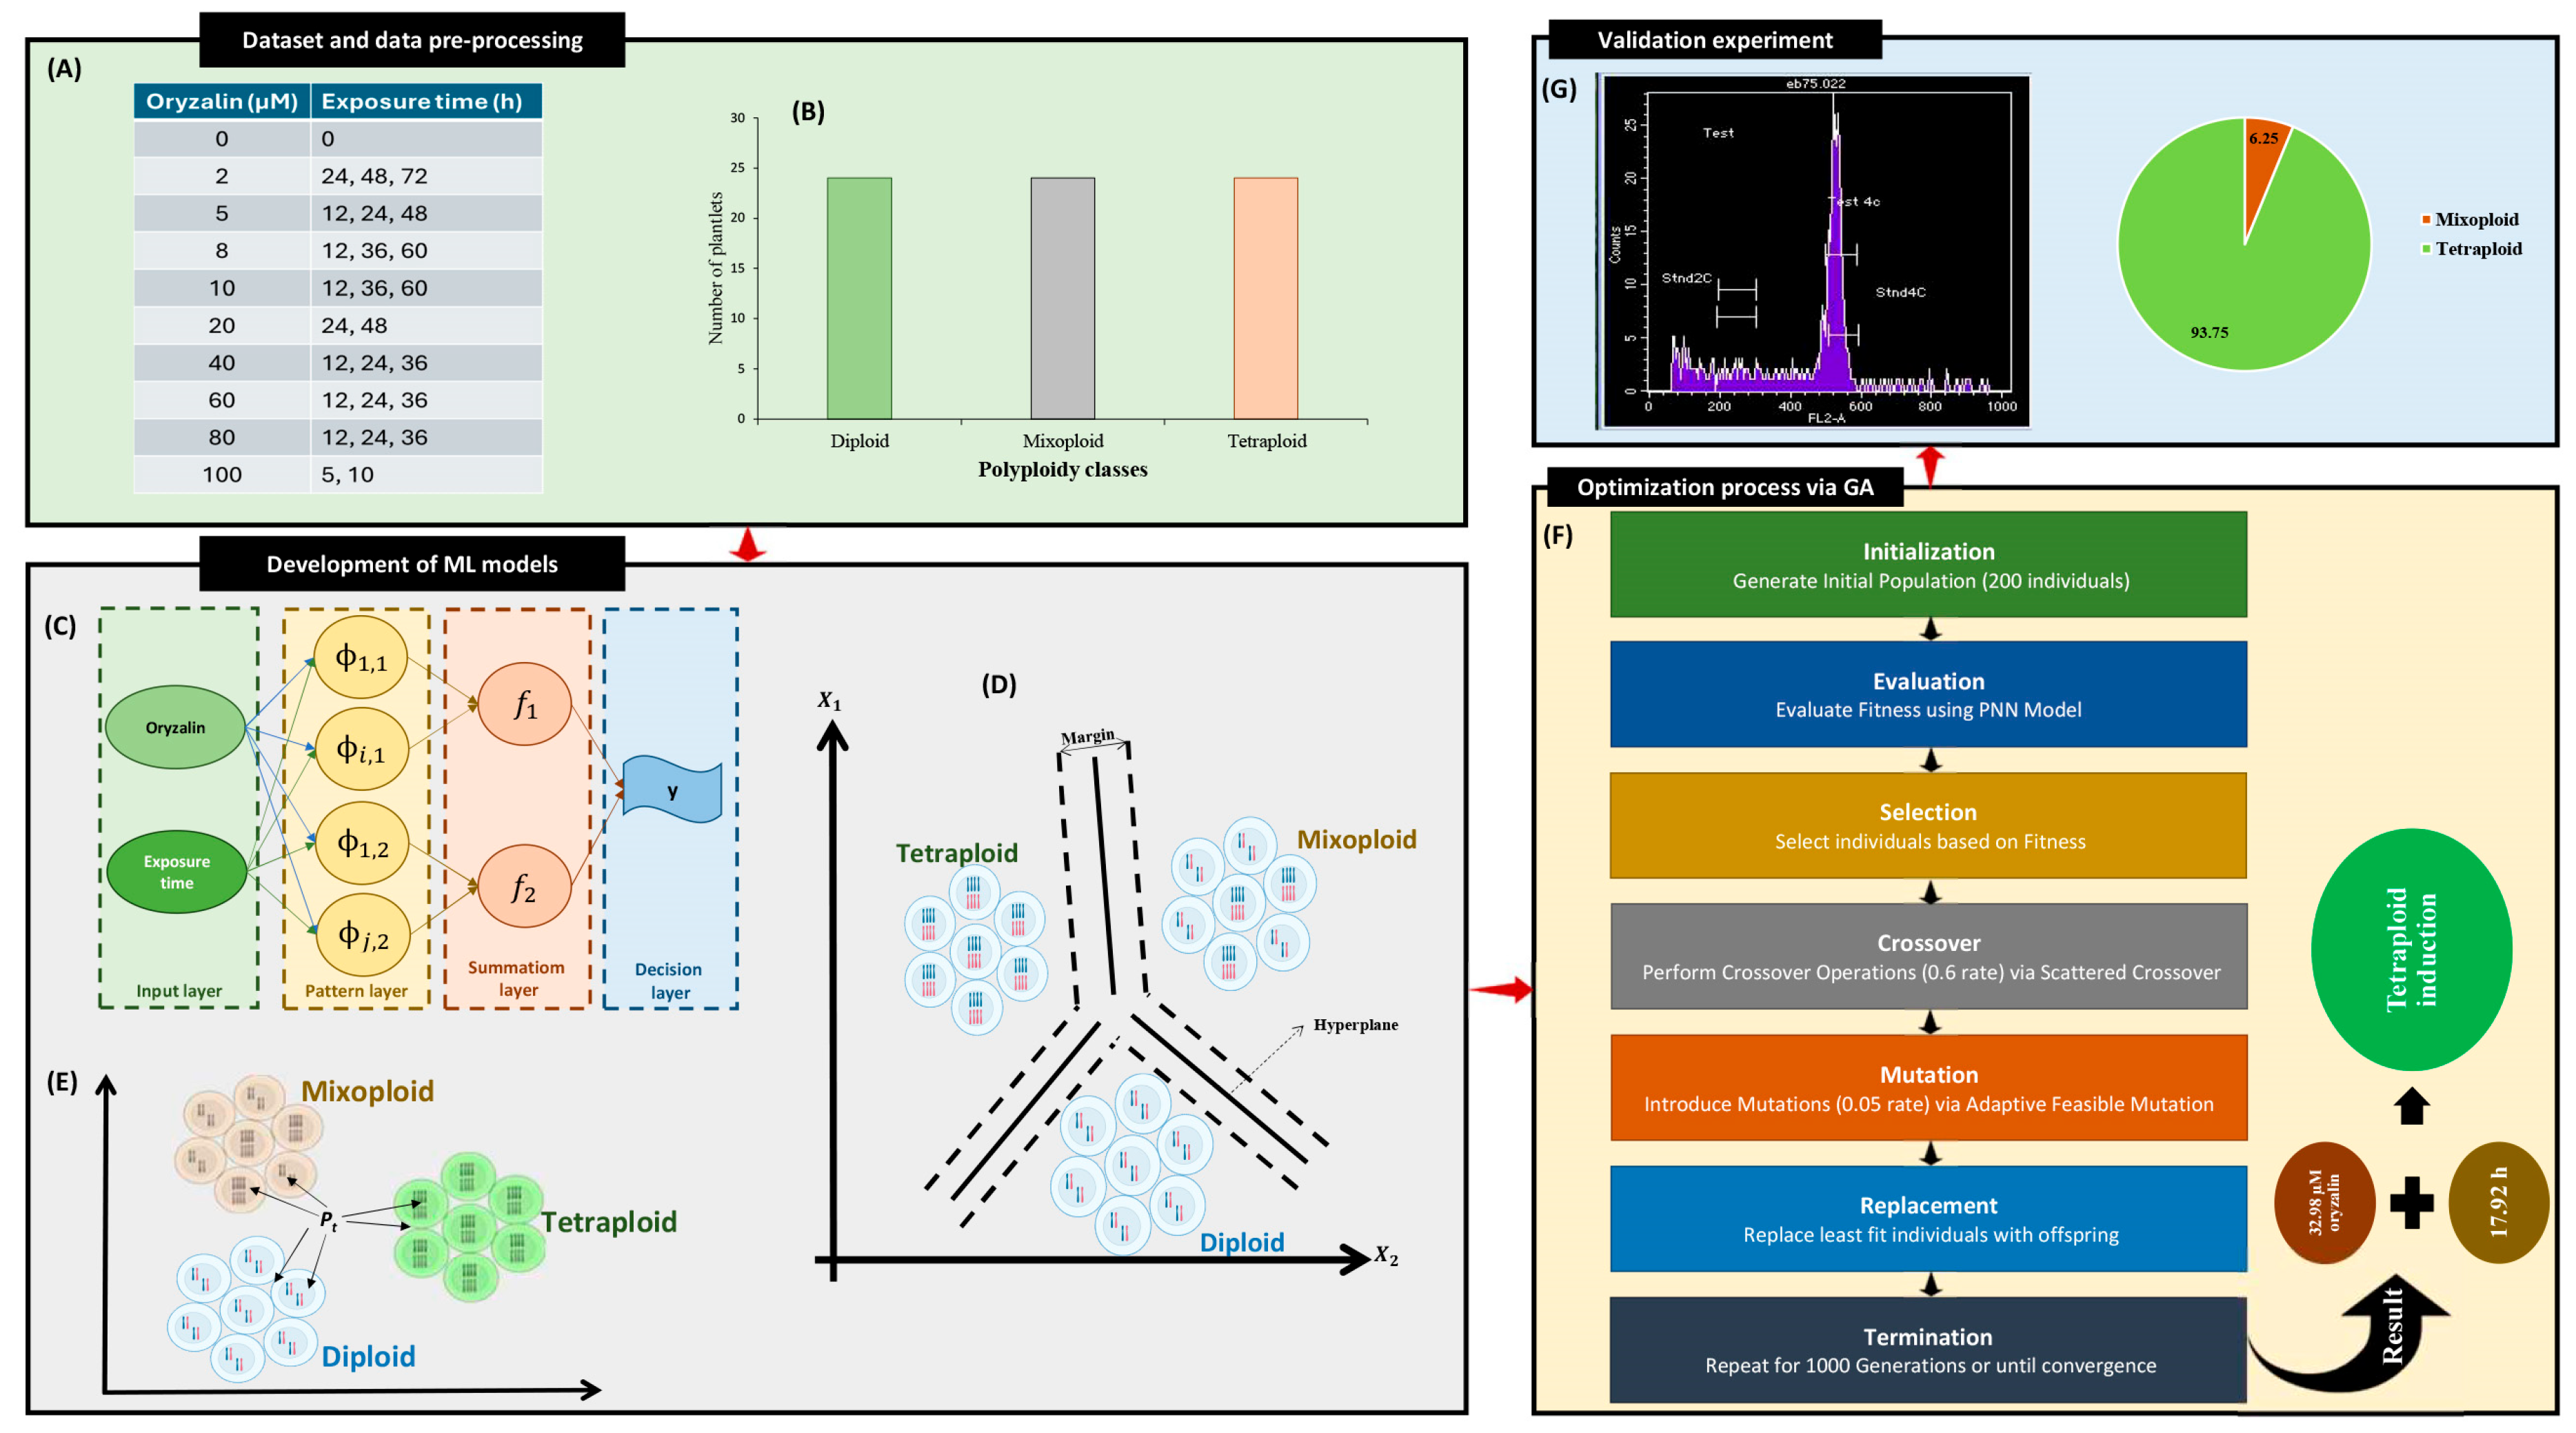
2.3. Evaluation and Comparison of the Developed Machine Learning Models

The performances of the PNN, SVC, and KNN models were evaluated using different performance criteria. The results of the training and testing phases of each model are detailed in Table 1. The PNN model demonstrated high performance during both the training and testing phases, achieving an accuracy of 96.4912% in training and 86.6667% in testing. The precision, recall, and F1-score values were consistently high, indicating a robust model with balanced performance metrics (Table 1). The KNN model achieved an accuracy of 92.9825% during training and 80% during testing. While the training phase exhibited strong performance, the testing phase indicated a drop in accuracy and consistency across precision, recall, and F1-score values, suggesting potential overfitting (Table 1). The SVC model showed an accuracy of 80.7018% in the training phase and maintained a similar accuracy of 80% during testing. However, the precision and recall values varied significantly between the training and testing phases, resulting in a lower F1-score value during testing, which indicates that the model might struggle with generalization (Table 1). Among the three models, the PNN exhibited the highest overall performance, with superior accuracy, precision, recall, and F1-score values in both the training and testing phases (Table 1).

2.4. Optimization Process and Experimental Confirmation of Predicted-Optimized Conditions

Since the PNN model proved to be the most effective, the developed PNN model was linked to GA to optimize the oryzalin concentration and exposure duration to maximize tetraploid induction. The optimization process using GA indicated that a concentration of 32.98 µM of oryzalin for approximately 18 h would result in optimal tetraploid induction (Figure 5F). To validate the predictions of the PNN-GA hybrid model, a laboratory experiment was conducted. The validation experiment confirmed the model’s predictions, showing a 93.75% tetraploid induction rate and 6.25% mixoploidy (Figure 5G). As a result, the developed PNN-GA model demonstrated precise predictive and optimization capability for polyploid induction.

3. Discussion

Inducing polyploidy through antimitotic agents (e.g., colchicine and oryzalin) is a widely recognized method for chromosome duplication [22]. This technique is employed to generate polyploid strains, investigate the gigas effect, develop seedless fruits in triploid varieties, and potentially increase the production of secondary metabolites in medicinal plants [26,50]. In the specific case of cannabis, polyploid lines have been used to explore its potential to enhance cannabinoid production, overall plant vigor, and seedlessness [9,10,11,15,18]. The success rate of polyploid induction using oryzalin or colchicine is frequently low due to the mixoploid production and has been reported in both hemp varieties [16,17] and drug-type cannabis [18].
Indeed, the efficiency of polyploidy induction in cannabis, like many other crops, can be negatively affected by mixoploid induction [15,16,17,18]. It is thus necessary to develop methods that minimize mixoploidy to improve the success rate and utility of tetraploid induction. One promising strategy to address this bottleneck is the application of ML methods [37]. With the application of supervised ML techniques (i.e., regression- and classification-based supervised ML models) for detecting the complex patterns and relationships among the factors impacting in vitro culture systems, more efficient and productive in vitro culture systems can be established [41]. Various regression-based ML techniques have been employed to develop a predictive model in different cannabis in vitro culture systems, such as callogenesis [51], in vitro sterilization [52], in vitro shoot growth and development [53], and in vitro seed germination [54,55,56]. These studies highlight the robustness and reliability of using ML techniques in this context.
In the case of polyploidy induction, where the output is categorical, regression-based ML techniques are not well suited. However, classification-based ML algorithms provide a powerful alternative computational strategy for enhancing the efficiency of tetraploid induction [9]. Classification-based ML models identify ploidy levels (diploid, mixoploid, and tetraploid) in response to associated factors (level of oryzalin and exposure duration) by developing predictive models based on patterns within the dataset [41]. The developed models can then be employed to generate adaptive practices to maximize the induction of tetraploid plants while minimizing mixoploid production.
In this study, three different classification-based ML algorithms (SVC, KNNs, and PNN) were used to model and predict in vitro tetraploid induction based on associated factors (oryzalin concentration and exposure duration). The results showed that the PNN model outperformed both SVC and KNNs in terms of accuracy, error rate, precision, recall, and F1 score. One potential reason for the superior performance of PNN is its greater flexibility and adaptability compared to SVC and KNNs [57]. In contrast to KNNs, which depend on a set number of nearest neighbors for predictions [58,59,60], PNN can integrate a significantly larger number of data points into its decision-making process [61]. This capability enables PNN to identify more complex patterns and relationships within the dataset, leading to enhanced predictive accuracy [62]. As a probabilistic model, PNN assigns probabilities to each class based on the input data. This approach allows PNN to better account for noise and uncertainty within the dataset, potentially leading to more precise predictions [62].
Enhancing the efficiency of in vitro culture systems through the optimization of plant tissue culture procedures is pivotal, and GA, as a single-objective optimization algorithm, presents numerous advantages in this regard [63,64]. The efficiency of polyploid induction can vary widely depending on the plant species, type of explant, type and concentration of antimitotic agents, exposure duration, and desired goals [22]. GA offers adaptability and customization to address specific optimization challenges through the delineation of suitable genetic representations, fitness functions, and genetic operators [53]. GA can be regarded as a potent optimization algorithm for customizing the optimization process to meet the specific requirements of in vitro culture systems such as polyploid induction [37]. One particular benefit of employing GA for in vitro optimization is its capacity to effectively navigate through extensive search spaces [65]. In vitro culture systems such as tetraploid induction frequently encompass numerous variables, such as concentration of antimitotic agents, exposure time, and environmental factors. The interplay among these variables can give rise to intricate optimization challenges [22]. GA utilizes a method based on populations, where a collection of potential solutions, referred to as individuals, undergoes evolution over successive generations [66]. Through this population-based exploration, GA can simultaneously investigate a broad spectrum of parameter combinations, facilitating the identification of optimal solutions within a practical timeframe [37]. Another benefit of GA is its capability to address non-convexity and nonlinearity within the optimization landscape [53]. This characteristic renders GA especially well suited for discovering optimal solutions in non-convex and intricate optimization challenges linked with in vitro tetraploid induction.
Given that PNN proved to be the most accurate predictive model in our study, it was subsequently linked to a GA to optimize oryzalin concentration and exposure duration. This integration aimed to enhance the efficiency of tetraploid induction in cannabis. The results of the validation experiment illustrated that employing the predicted optimized condition (32.98 µM oryzalin for 18 h) through PNN-GA yielded a tetraploid induction rate of 93.75% in the validation experiment. Notably, this conversion rate is higher than reported in many previous studies. For instance, Parsons, Martin, James, Golenia, Boudko and Hepworth [18] reported a maximum tetraploid induction of 66.7% in drug-type cannabis utilizing 40 µM for 24 h. Kurtz, Brand and Lubell-Brand [16] demonstrated a maximum tetraploid induction of 64% in hemp cultivars employing 0.05% colchicine for 12 h. Further, it is worth highlighting that the conversion rate of 93.75% observed experimentally was greater than the treatments used in this study to develop the model. Hence, the validation experiment confirmed that the PNN-GA approach is a powerful and precise method for predicting in vitro polyploid induction in cannabis.
In addition to developing the in vitro tetraploid induction protocol, we investigated leaf-related morphological traits across diploid, mixoploid, and tetraploid plants. The principal attribute linked with polyploidy is the enlargement of plant organs, commonly referred to as the ‘gigas’ effect [67]. In this study, we found that not only was the plant more vigorous, but the leaf size was also larger in tetraploids than in diploids. In line with our results, Fernandes, et al. [68] reported that tetraploid cannabis plants exhibited significantly increased leaflet size compared to diploid plants, emphasizing the substantial impact of ploidy on plant morphology. Furthermore, our findings align with those of Parsons, Martin, James, Golenia, Boudko and Hepworth [18], who also reported that tetraploid plants have larger leaves than diploid plants. Specifically, the central leaflet on tetraploid leaves was significantly wider compared to that on diploid leaves [18]. These morphological changes were notable and have been documented across various plant species, such as Citrus limonia [69], Malus × domestica [67], Anemone sylvestris [70], Brassica species [71], and Sorbus pohuashanensis [72].
Our results showed that the leaf area of tetraploids was considerably higher than that of diploid plants. Although the length and width of terminal and lateral leaflets were significantly higher than that of diploids, the length and width of terminal and lateral leaflets in both diploid and tetraploid plants grew synchronously. Therefore, tetraploid plants exhibited no significant alteration in leaflet length-to-width ratios, aligning with findings from prior studies like those in birch [73]. It has been shown that the growth rate during the middle to late stages of leaf development dictates their eventual size [73]. Consequently, tetraploid leaves possessed a heightened growth rate compared to their diploid counterparts, which was an important reason for the large leaf size of tetraploid plants [74]. Studies in Arabidopsis showed that polyploidization would lead to larger cell areas [23]. Additionally, it was shown that there were no significant differences in cell proliferation ability among different ploidy levels, as assessed through the measurement of relative expression levels of cell division-related genes [23,74]. Hence, cell expansion stands out as a significant factor contributing to the increased size of tetraploid leaves. Indeed, the alteration primarily stems from the heightened DNA content, leading to an enlargement of the nucleus [75,76].

4. Materials and Methods

4.1. Plant Materials

Stem segments with two nodes from in vitro-grown drug-type cannabis (Cannabis sativa L. cv. Super Sherb) plantlets were selected as explant materials (Figure 6).
DKW [77] medium (D2470, PhytoTech Labs, Lenexa, KS, USA) supplemented with 30 g/L sucrose was used as the basal medium for this experiment. The pH of the medium was adjusted to 5.7 before autoclaving at 121 °C and 15 psi for 20 min. The explants were placed in a 500 mL Pyrex® round media storage bottle (06-414-1C, Thermo Fisher Scientific, Waltham, MA, USA) containing 200 mL of liquid basal DKW medium supplemented with varying concentrations (0, 2, 5, 8, 10, 20, 40, 60, 80, and 100 µM) of oryzalin (O630, PhytoTech Labs, KS, USA). The inoculated media were then placed on an orbital shaker (160 rpm) and subjected to different exposure times (Figure 6). A total of 26 treatments were tested (Figure 5A), with each treatment having 4 replicates. Each replicate consisted of 4 explants. Following the oryzalin treatment, the explants were transferred into a Magenta GA7 vessel (50-255-176, Thermo Fisher Scientific, Waltham, MA, USA) containing solid DKW medium (containing 6 g/L agar) and kept at 27 °C, under an 18 h photoperiod, 50 µmol m−2 s−1 PPFD (photosynthetic photon flux density), comprised of 12.5% W (400–700 nm), 12.5% B (400–500 nm), and 75% R (600–700 nm) for 6 weeks in the growth room (Figure 6). After 6 weeks, polyploid levels in the treated explants were assessed using flow cytometry (Figure 6).
To assess ploidy level using flow cytometry, small leaf segments (approximately 1 cm2) were collected and kept on ice throughout preparation. The tissue was finely chopped with a sharp razor blade in a Petri plate containing 1000 µL of ice-cold LB01 buffer [78] composed of 15 mM Tris, 2 mM Na2EDTA, 0.5 mM spermine tetrahydrochloride, 80 mM KCl, 20 mM NaCl, 0.1% (v/v) Triton X-100, 25 µL of propidium iodide stock with a pH of 8.0. The resulting suspension was filtered through a 50 µm nylon mesh to remove large debris. The interval between sample preparation and flow cytometric analysis (FCM) was approximately 5 min. The stained nuclei were analyzed using a BD FACSCalibur flow cytometer (BD Biosciences, San Jose, CA, USA.) with an FL2 voltage setting of 486 V. Data for a minimum of 1000 nuclei per sample were captured within a maximum duration of 120 s. Relative DNA content was determined by measuring the fluorescence peak area using a 585/42 nm detector. Fluorescence peak means coefficients of variation and nuclei counts were recorded and analyzed using BD Accuri™ C6 Software 1.0.264.21. To ascertain ploidy levels, plant tissues with confirmed diploid status were used as a reference standard.

4.2. Leaf-Related Morphological Traits in Diploid, Mixoploid, and Tetraploid Plants

Leaf-related morphological traits of tetraploid, diploid, and mixoploid micro-propagated shoots were recorded using five replications, with each replicate consisting of eight leaves (Figure 6). Different leaf-related morphological traits, including length of lateral leaflets (left and right sides), length of terminal leaflets, width of lateral leaflets (left and right sides), width of terminal leaflets, number of serrations on terminal and lateral leaflets, and leaf area, were measured using ImageJ 1.53e based on the methodology of Hesami, et al. [79].

4.3. Dataset Description

After detecting outliers using principal component analysis (PCA), 72 data lines, each representing an experimental instance, were selected for further analyses. As shown in Figure 5B, the ploidy levels were divided into three classes (diploid, mixoploid, and tetraploid) with equal numbers of data lines. The dataset was partitioned into a training set comprising 70% of the data and a testing set comprising the remaining 30%. This partitioning facilitated model training on a subset of the data while allowing for independent validation of unseen data. Two input variables were considered for the ML models: oryzalin concentrations and exposure time. The output of the ML models consisted of three classes of polyploidy: diploid, mixoploid, and tetraploid. These classes were determined based on the observed polyploidy levels in the experimental instances.

4.4. Machine Learning Algorithms

Three classification-based machine learning algorithms—probabilistic neural network (PNN), support vector classification (SVC), and k-nearest neighbors (KNN)—were used to predict ploidy levels.

4.4.1. Probabilistic Neural Network (PNN)

The probabilistic neural network (PNN) is a type of artificial neural network particularly suited for pattern classification tasks. It comprises four layers: input, pattern, summation, and output (Figure 5C).
The PNN architecture can be described by the following equations:
Input Layer: The input layer receives the input variables, x 1 and x 2 , corresponding to oryzalin concentrations and exposure time, respectively.
Pattern Layer: The pattern layer computes the Euclidean distance between the input vector xxx and each training sample x i in the training set, i = 1 ,   2 ,   3 ,   ,   n . This layer is represented by the equation:
f x , x i = exp   ( x x i 2 2 σ 2 )
where x x i 2 denotes the squared Euclidean distance between the input vector x and the training sample x i , and σ is a smoothing parameter.
Summation Layer: The summation layer sums the outputs of the pattern layer for each class, weighted by the corresponding class probabilities. This layer is represented by the equation:
S j = i = 1 N j f x , x i
where S j is the summed activation for class j , N j is the number of training samples in class j , and f x , x i is the output of the pattern layer for the i t h   training sample in class f x , x i .
Output Layer: The output layer computes the posterior probability of each class given the input vector xxx. This layer is represented by the equation:
P   C j | x = S j k = 1 K S k
where P   C j | x is the posterior probability of class j given the input vector x , S j is the summed activation for class j , and K is the total number of classes.
The PNN model was trained using the training set, where the input variables and corresponding class labels were used to adjust the network parameters. Subsequently, the model was evaluated using the testing set to assess its performance in classifying polyploidy levels.

4.4.2. Support Vector Classification (SVC)

Support vector classification (SVC) is a supervised learning algorithm used for classification tasks. It aims to find the hyperplane that best separates instances of different classes in a high-dimensional space (Figure 5D). The Radial Basis Function (RBF) kernel is commonly used in SVC to map input data into a higher-dimensional space, allowing for nonlinear decision boundaries.
The decision function for the SVC model with the RBF kernel can be represented as follows:
f x = s i g n   ( i = 1 n S V a i y i K x i ,   x + b )
where f x is the decision function, a i are the coefficients determined during training, y i are the class labels, b is the bias term, n S V is the number of support vectors, and is the RBF kernel function, given by:
K x i ,   x = exp   ( γ x x i ) 2
where γ is the kernel coefficient.
The SVC model with the RBF kernel was trained using the training set. During training, the algorithm identified the optimal hyperplane that separates the data into the three polyploidy classes based on the input variables: oryzalin concentrations and exposure time. Following training, the performance of the trained SVC model was evaluated using the testing set. The input variables from the testing set were fed into the trained model, and the predicted polyploidy classes were compared against the actual class labels to assess the model’s accuracy and generalization ability.

4.4.3. K-Nearest Neighbors (KNNs)

K-nearest neighbors (KNNs) is a non-parametric supervised learning algorithm used for classification tasks. It operates by classifying an instance based on the majority class among its k-nearest neighbors in the feature space (Figure 5E). In this study, cosine distance was employed to calculate the similarity between instances, allowing for robust classification in high-dimensional spaces. The cosine distance between two vectors u and v is given by the following equation:
c o s i n e d i s t a n c e u ,   v = u   .   v u   .   v
where u   .   v denotes the dot product and u and v are the magnitudes of vectors u and v , respectively.
The KNN model with cosine distance was trained using the training set. During training, the algorithm calculated the cosine distance between each instance in the training set and all other instances in the feature space. Following training, the performance of the trained KNN model was evaluated using the testing set. For each instance in the testing set, the algorithm identified its k-nearest neighbors from the training set using cosine distance and assigned the majority class label among those neighbors as the predicted class label.

4.5. Model Performance

The following performance criteria were used for evaluating and comparing the performance of the developed KNN, SVC, and PNN models:
P r e c i s i o n = T P T P + F P
A c c u r a c y = T P + T N T P + T N + F P + F N
R e c a l l = T P T P + F N
E r r o   r a t e = F P + F N T P + T N + F P + F N
F 1 S c o r e = 2 × P r e c i s i o n × R e c a l l P r e c i s i o n + R e c a l l
where FN is false negative, FP is false positive, TN is true negative, and TP is true positive.

4.6. Genetic Optimization Algorithm

In this study, the developed PNN model was utilized in conjunction with a genetic algorithm (GA) to determine the optimal levels of oryzalin and exposure time to produce tetraploid plants. The PNN model served as the fitness function for the GA, guiding the optimization process towards configurations that yield desired polyploidy outcomes.
The GA employed in this study was configured with specific parameters to govern its operation. These parameters were set as follows: (i) the initial population size was set to 200 individuals, representing candidate solutions, (ii) the GA iterated through 1000 generations (generation number) to evolve and refine the population towards optimal solutions, (iii) a mutation rate of 0.05 was applied to introduce variability in the population, promoting diversity and exploration of the solution space, (iv) the crossover rate, set at 0.6, determined the likelihood of crossover events between individuals during reproduction, (v) the creation function initialized the initial population uniformly within specified bounds, (vi) the crossover function implemented scattered crossover, allowing for diverse recombination of genetic information between individuals, (vii) the selection function employed stochastic uniform selection to probabilistically select individuals for reproduction, favoring individuals with higher fitness, and (viii) the mutation function adapted feasible mutation, ensuring that mutated individuals remained within predefined feasible bounds (Figure 5F).
MATLAB software (version R2023a) was employed to develop ML models and GA.

4.7. Validation Experiment

The predicted-optimized result obtained by PNN-GA was subjected to laboratory testing to assess the reliability and accuracy of the ML-assisted tetraploid induction in cannabis. The validation experiment comprised 4 replicates, each consisting of 4 explants. To do this, explants were first cultured in liquid DKW medium with 32.98 µM oryzalin for around 18 h (predicted-optimized condition). Subsequently, the treated explants were transferred to a solid DKW medium and kept in the growth room for 6 weeks. The leaves of the micro-propagated plants were then used for ploidy assessment using flow cytometry.

5. Conclusions

Artificial polyploid induction is a complex biological process influenced by various factors, including genotype, type and age of explants, type and concentration of antimitotic agents such as oryzalin, and exposure duration. Particularly, selecting the optimal oryzalin concentration and exposure time is the main prerequisite for successful polyploidization. Achieving a high rate of tetraploid induction with minimal mixoploid formation necessitates testing different combinations of oryzalin concentrations and exposure times through a factorial experiment that would be a tedious, cost- and time-consuming experiment; additionally, there is a risk that the optimal combination might lie outside the tested treatments. Data-driven approaches using ML can provide a powerful and reliable solution to this challenge. The results of the current study indicated that PNN outperformed both KNNs and SVC in predicting ploidy levels. Additionally, the hybrid PNN-GA accurately optimized oryzalin concentration and exposure duration to maximize tetraploid induction in the drug-type cannabis cultivar ‘Super Sherb’. Future studies should evaluate the suitability of this model and the optimized conditions for tetraploid induction in other commercial fiber-type and drug-type cannabis varieties.

Author Contributions

Conceptualization, M.J. and A.M.P.J.; methodology, M.J.; software, M.H.; validation, M.J., N.P. and A.M.P.J.; formal analysis, M.J.; investigation, M.J. and N.P.; resources, A.M.P.J.; data curation, A.M.P.J.; writing—original draft preparation, M.J.; writing—review and editing, M.J., N.P., M.H. and A.M.P.J.; visualization, M.J. and M.H.; supervision, A.M.P.J.; project administration, A.M.P.J.; funding acquisition, A.M.P.J. All authors have read and agreed to the published version of the manuscript.

Funding

This research was funded by Dycar Pharmaceuticals Ltd., Cranbrook, Canada and NSERC Alliance, grant number ALLRP 576989-22.

Institutional Review Board Statement

Not applicable.

Informed Consent Statement

Not applicable.

Data Availability Statement

All relevant data are included in the paper.

Conflicts of Interest

The authors declare no conflicts of interest. The funders had no role in the design of the study; in the collection, analyses, or interpretation of data; in the writing of the manuscript; or in the decision to publish the results.

References

  1. Heslop-Harrison, J.S.; Schwarzacher, T.; Liu, Q. Polyploidy: Its consequences and enabling role in plant diversification and evolution. Ann. Bot. 2023, 131, 1–10. [Google Scholar] [CrossRef] [PubMed]
  2. Wang, J.; Song, B.; Yang, M.; Hu, F.; Qi, H.; Zhang, H.; Jia, Y.; Li, Y.; Wang, Z.; Wang, X. Deciphering recursive polyploidization in Lamiales and reconstructing their chromosome evolutionary trajectories. Plant Physiol. 2024, 195, 2143–2157. [Google Scholar] [CrossRef]
  3. Morris, J.P.; Baslan, T.; Soltis, D.E.; Soltis, P.S.; Fox, D.T. Integrating the Study of Polyploidy Across Organisms, Tissues, and Disease. Annu. Rev. Genet. 2024, 58, 297–318. [Google Scholar] [CrossRef] [PubMed]
  4. Akagi, T.; Jung, K.; Masuda, K.; Shimizu, K.K. Polyploidy before and after domestication of crop species. Curr. Opin. Plant Biol. 2022, 69, 102255. [Google Scholar] [CrossRef] [PubMed]
  5. Li, X.; Yu, S.; Cheng, Z.; Chang, X.; Yun, Y.; Jiang, M.; Chen, X.; Wen, X.; Li, H.; Zhu, W.; et al. Origin and evolution of the triploid cultivated banana genome. Nat. Genet. 2024, 56, 136–142. [Google Scholar] [CrossRef]
  6. Bradshaw, J.E. A brief history of the impact of potato genetics on the breeding of tetraploid potato cultivars for tuber propagation. Potato Res. 2022, 65, 461–501. [Google Scholar] [CrossRef]
  7. Juery, C.; Concia, L.; De Oliveira, R.; Papon, N.; Ramírez-González, R.; Benhamed, M.; Uauy, C.; Choulet, F.; Paux, E. New insights into homoeologous copy number variations in the hexaploid wheat genome. Plant Genome 2021, 14, e20069. [Google Scholar] [CrossRef] [PubMed]
  8. Whitaker, V.M.; Knapp, S.J.; Hardigan, M.A.; Edger, P.P.; Slovin, J.P.; V Bassil, N.; Hytönen, T.; Mackenzie, K.K.; Lee, S.; Jung, S.; et al. A roadmap for research in octoploid strawberry. Hortic. Res. 2020, 7, 33. [Google Scholar] [CrossRef] [PubMed]
  9. Hesami, M.; Baiton, A.; Alizadeh, M.; Pepe, M.; Torkamaneh, D.; Jones, A.M. Advances and perspectives in tissue culture and genetic engineering of cannabis. Int. J. Mol. Sci. 2021, 22, 5671. [Google Scholar] [CrossRef]
  10. Suchoff, D.H.; Inoa, S.H.; Stack, G.M.; Wares, A.J.; Snyder, S.I.; Murdock, M.J.; Rose, J.K.C.; Smart, L.B.; Caton, T.A.; Pearce, R.C. Characterization of agronomic performance and sterility in triploid and diploid cannabinoid hemp. Agron. J. 2024, 116, 2470–2482. [Google Scholar] [CrossRef]
  11. Crawford, S.; Rojas, B.M.; Crawford, E.; Otten, M.; Schoenenberger, T.A.; Garfinkel, A.R.; Chen, H. Characteristics of the diploid, triploid, and tetraploid versions of a cannabigerol-dominant F1 hybrid industrial hemp cultivar, Cannabis sativa ‘Stem Cell CBG’. Genes 2021, 12, 923. [Google Scholar] [CrossRef] [PubMed]
  12. Philbrook, R.; Jafari, M.; Gerstenberg, S.; Say, K.L.; Warren, J.; Jones, A.M. Naturally occurring triploidy in cannabis. Plants 2023, 12, 3927. [Google Scholar] [CrossRef]
  13. Balant, M.; Rodríguez González, R.; Garcia, S.; Garnatje, T.; Pellicer, J.; Vallès, J.; Vitales, D.; Hidalgo, O. Novel insights into the nature of intraspecific genome size diversity in Cannabis sativa L. Plants 2022, 11, 2736. [Google Scholar] [CrossRef]
  14. Sharma, V.; Srivastava, D.K.; Gupta, R.C.; Singh, B. Abnormal meiosis in tetraploid (4x) Cannabis sativa (L.) from Lahaul-Spiti (cold desert higher altitude Himalayas): A neglected but important herb. J. Biol. Chem. Chron 2015, 2, 38–42. [Google Scholar]
  15. Bagheri, M.; Mansouri, H. Effect of induced polyploidy on some biochemical parameters in Cannabis sativa L. Appl. Biochem. Biotechnol. 2015, 175, 2366–2375. [Google Scholar] [CrossRef] [PubMed]
  16. Kurtz, L.E.; Brand, M.H.; Lubell-Brand, J.D. Production of tetraploid and triploid hemp. HortScience 2020, 55, 1703–1707. [Google Scholar] [CrossRef]
  17. McLeod, A.; Contreras, R.; Halstead, M.; Vining, K. In vivo and in vitro chromosome doubling of ‘I3’ hemp. HortScience 2023, 58, 1018–1022. [Google Scholar] [CrossRef]
  18. Parsons, J.L.; Martin, S.L.; James, T.; Golenia, G.; Boudko, E.A.; Hepworth, S.R. Polyploidization for the genetic improvement of Cannabis sativa. Front. Plant Sci. 2019, 10, 476. [Google Scholar] [CrossRef] [PubMed]
  19. Abubakar, M.A.; Gennadievna, N.E.; Mikhailovna, S.O.; Mikhailovna, K.E. Effect of Induced Polyploidy on Morphology, Antioxidant Activity, and Dissolved Sugars in Allium cepa L. Horticulturae 2025, 11, 154. [Google Scholar] [CrossRef]
  20. Madani, H.; Escrich, A.; Hosseini, B.; Sanchez-Muñoz, R.; Khojasteh, A.; Palazon, J. Effect of Polyploidy Induction on Natural Metabolite Production in Medicinal Plants. Biomolecules 2021, 11, 899. [Google Scholar] [CrossRef]
  21. Gantait, S.; Mukherjee, E. Induced autopolyploidy—A promising approach for enhanced biosynthesis of plant secondary metabolites: An insight. J. Genet. Eng. Biotechnol. 2021, 19, 4. [Google Scholar] [CrossRef]
  22. Niazian, M.; Nalousi, A.M. Artificial polyploidy induction for improvement of ornamental and medicinal plants. Plant Cell Tissue Organ Cult. 2020, 142, 447–469. [Google Scholar] [CrossRef]
  23. Del Pozo, J.C.; Ramirez-Parra, E. Deciphering the molecular bases for drought tolerance in Arabidopsis autotetraploids. Plant Cell Environ. 2014, 37, 2722–2737. [Google Scholar] [CrossRef] [PubMed]
  24. Harun, A.; Fang, Z.; Chen, C. The contributions of cytogenetics, genetics, and epigenetics to the stability of plants polyploidy. Discov. Plants 2024, 1, 11. [Google Scholar] [CrossRef]
  25. Tossi, V.E.; Martínez Tosar, L.J.; Laino, L.E.; Iannicelli, J.; Regalado, J.J.; Escandón, A.S.; Baroli, I.; Causin, H.F.; Pitta-Álvarez, S.I. Impact of polyploidy on plant tolerance to abiotic and biotic stresses. Front. Plant Sci. 2022, 13, 869423. [Google Scholar] [CrossRef]
  26. Yoosefzadeh Najafabadi, M.; Hesami, M.; Rajcan, I. Unveiling the mysteries of non-mendelian heredity in plant breeding. Plants 2023, 12, 1956. [Google Scholar] [CrossRef] [PubMed]
  27. Basit, A.; Lim, K.-B. Systematic approach of polyploidy as an evolutionary genetic and genomic phenomenon in horticultural crops. Plant Sci. 2024, 348, 112236. [Google Scholar] [CrossRef] [PubMed]
  28. Trojak-Goluch, A.; Kawka-Lipińska, M.; Wielgusz, K.; Praczyk, M. Polyploidy in industrial crops: Applications and perspectives in plant breeding. Agronomy 2021, 11, 2574. [Google Scholar] [CrossRef]
  29. Chu, Y.; Lyrene, P.M. Artificial Induction of Polyploidy in Blueberry Breeding: A Review. HortScience 2025, 60, 100–110. [Google Scholar] [CrossRef]
  30. Obando-González, R.I.; Martínez-Hernández, L.E.; Núñez-Muñoz, L.A.; Calderón-Pérez, B.; Ruiz-Medrano, R.; Ramírez-Pool, J.A.; Xoconostle-Cázares, B. Plant growth Enhancement in Colchicine-Treated Tomato Seeds without Polyploidy Induction. Plant Mol. Biol. 2024, 115, 3. [Google Scholar] [CrossRef] [PubMed]
  31. Fomicheva, M.; Kulakov, Y.; Alyokhina, K.; Domblides, E. Spontaneous and Chemically Induced Genome Doubling and Polyploidization in Vegetable Crops. Horticulturae 2024, 10, 551. [Google Scholar] [CrossRef]
  32. Liu, B.; Lee, Y.-R.J. Spindle Assembly and Mitosis in Plants. Annu. Rev. Plant Biol. 2022, 73, 227–254. [Google Scholar] [CrossRef] [PubMed]
  33. Neenu, M.G.; Aswathi, A.; Prasath, D. Synthetic polyploidy in spice crops: A review. Crop Sci. 2024, 64, 2–23. [Google Scholar] [CrossRef]
  34. Kunakh, V.A.; Adonin, V.I.; Ozheredov, S.P.; Blyum, Y.B. Mixoploidy in wild and cultivated species of Cruciferae capable of hybridizing with rapeseed Brassica napus. Cytol. Genet. 2008, 42, 204–209. [Google Scholar] [CrossRef]
  35. Eng, W.-H.; Ho, W.-S. Polyploidization using colchicine in horticultural plants: A review. Sci. Hortic. 2019, 246, 604–617. [Google Scholar] [CrossRef]
  36. Vilcherrez-Atoche, J.A.; Iiyama, C.M.; Cardoso, J.C. Polyploidization in Orchids: From Cellular Changes to Breeding Applications. Plants 2022, 11, 469. [Google Scholar] [CrossRef] [PubMed]
  37. Hesami, M.; Jones, A.M.P. Application of artificial intelligence models and optimization algorithms in plant cell and tissue culture. Appl. Microbiol. Biotechnol. 2020, 104, 9449–9485. [Google Scholar] [CrossRef]
  38. Jafari, M.; Shahsavar, A. The application of artificial neural networks in modeling and predicting the effects of melatonin on morphological responses of citrus to drought stress. PLoS ONE 2020, 15, e0240427. [Google Scholar] [CrossRef]
  39. Ramezanpour, M.R.; Farajpour, M. Application of artificial neural networks and genetic algorithm to predict and optimize greenhouse banana fruit yield through nitrogen, potassium and magnesium. PLoS ONE 2022, 17, e0264040. [Google Scholar] [CrossRef]
  40. Hesami, M.; Alizadeh, M.; Jones, A.M.P.; Torkamaneh, D. Machine learning: Its challenges and opportunities in plant system biology. Appl. Microbiol. Biotechnol. 2022, 106, 3507–3530. [Google Scholar] [CrossRef]
  41. Niazian, M.; Niedbała, G. Machine learning for plant breeding and biotechnology. Agriculture 2020, 10, 436. [Google Scholar] [CrossRef]
  42. Rezaei, H.; Mirzaie-asl, A.; Abdollahi, M.R.; Tohidfar, M. Comparative analysis of different artificial neural networks for predicting and optimizing in vitro seed germination and sterilization of petunia. PLoS ONE 2023, 18, e0285657. [Google Scholar] [CrossRef]
  43. Özcan, E.; Atar, H.H.; Ali, S.A.; Aasim, M. Artificial neural network and decision tree–based models for prediction and validation of in vitro organogenesis of two hydrophytes—Hemianthus callitrichoides and Riccia fluitans. Vitr. Cell. Dev. Biol. Plant 2023, 59, 547–562. [Google Scholar] [CrossRef]
  44. Aasim, M.; Katırcı, R.; Acar, A.Ş.; Ali, S.A. A comparative and practical approach using quantum machine learning (QML) and support vector classifier (SVC) for Light emitting diodes mediated in vitro micropropagation of black mulberry (Morus nigra L.). Ind. Crops Prod. 2024, 213, 118397. [Google Scholar] [CrossRef]
  45. Rezaei, H.; Mirzaie-asl, A.; Abdollahi, M.R.; Tohidfar, M. Enhancing petunia tissue culture efficiency with machine learning: A pathway to improved callogenesis. PLoS ONE 2023, 18, e0293754. [Google Scholar] [CrossRef]
  46. Niazian, M.; Shariatpanahi, M.E.; Abdipour, M.; Oroojloo, M. Modeling callus induction and regeneration in an anther culture of tomato (Lycopersicon esculentum L.) using image processing and artificial neural network method. Protoplasma 2019, 256, 1317–1332. [Google Scholar] [CrossRef] [PubMed]
  47. Hesami, M.; Naderi, R.; Tohidfar, M. Introducing a hybrid artificial intelligence method for high-throughput modeling and optimizing plant tissue culture processes: The establishment of a new embryogenesis medium for chrysanthemum, as a case study. Appl. Microbiol. Biotechnol. 2020, 104, 10249–10263. [Google Scholar] [CrossRef] [PubMed]
  48. Jafari, M.; Daneshvar, M.H.; Jafari, S.; Hesami, M. Machine learning-assisted in vitro rooting optimization in Passiflora caerulea. Forests 2022, 13, 2020. [Google Scholar] [CrossRef]
  49. Hesami, M.; Alizadeh, M.; Naderi, R.; Tohidfar, M. Forecasting and optimizing Agrobacterium-mediated genetic transformation via ensemble model- fruit fly optimization algorithm: A data mining approach using chrysanthemum databases. PLoS ONE 2020, 15, e0239901. [Google Scholar] [CrossRef]
  50. Becker, F.W.; Oberlander, K.C.; Trávníček, P.; Dreyer, L.L. Inconsistent expression of the gigas effect in polyploid Oxalis. Am. J. Bot. 2022, 109, 1607–1621. [Google Scholar] [CrossRef] [PubMed]
  51. Hesami, M.; Jones, A.M.P. Modeling and optimizing callus growth and development in Cannabis sativa using random forest and support vector machine in combination with a genetic algorithm. Appl. Microbiol. Biotechnol. 2021, 105, 5201–5212. [Google Scholar] [CrossRef] [PubMed]
  52. Pepe, M.; Hesami, M.; Jones, A.M. Machine learning-mediated development and optimization of disinfection protocol and scarification method for improved in vitro germination of cannabis seeds. Plants 2021, 10, 2397. [Google Scholar] [CrossRef]
  53. Pepe, M.; Hesami, M.; Small, F.; Jones, A.M.P. Comparative analysis of machine learning and evolutionary optimization algorithms for precision micropropagation of Cannabis sativa: Prediction and validation of in vitro shoot growth and development based on the optimization of light and carbohydrate sources. Front. Plant Sci. 2021, 12, 757869. [Google Scholar] [CrossRef]
  54. Hesami, M.; Pepe, M.; Monthony, A.S.; Baiton, A.; Phineas Jones, A.M. Modeling and optimizing in vitro seed germination of industrial hemp (Cannabis sativa L.). Ind. Crops Prod. 2021, 170, 113753. [Google Scholar] [CrossRef]
  55. Aasim, M.; Katırcı, R.; Akgur, O.; Yildirim, B.; Mustafa, Z.; Nadeem, M.A.; Baloch, F.S.; Karakoy, T.; Yılmaz, G. Machine learning (ML) algorithms and artificial neural network for optimizing in vitro germination and growth indices of industrial hemp (Cannabis sativa L.). Ind. Crops Prod. 2022, 181, 114801. [Google Scholar] [CrossRef]
  56. Aasim, M.; Yıldırım, B.; Say, A.; Ali, S.A.; Aytaç, S.; Nadeem, M.A. Artificial intelligence models for validating and predicting the impact of chemical priming of hydrogen peroxide (H2O2) and light emitting diodes on in vitro grown industrial hemp (Cannabis sativa L.). Plant Mol. Biol. 2024, 114, 33. [Google Scholar] [CrossRef] [PubMed]
  57. Vieira, R.G.; Dhimish, M.; de Araújo, F.M.U.; da Silva Guerra, M.I. Comparing multilayer perceptron and probabilistic neural network for PV systems fault detection. Expert Syst. Appl. 2022, 201, 117248. [Google Scholar] [CrossRef]
  58. Uddin, S.; Haque, I.; Lu, H.; Moni, M.A.; Gide, E. Comparative performance analysis of K-nearest neighbour (KNN) algorithm and its different variants for disease prediction. Sci. Rep. 2022, 12, 6256. [Google Scholar] [CrossRef] [PubMed]
  59. Sadat-Hosseini, M.; Arab, M.M.; Soltani, M.; Eftekhari, M.; Soleimani, A.; Vahdati, K. Predictive modeling of Persian walnut (Juglans regia L.) in vitro proliferation media using machine learning approaches: A comparative study of ANN, KNN and GEP models. Plant Methods 2022, 18, 48. [Google Scholar] [CrossRef] [PubMed]
  60. Aasim, M.; Ali, S.A.; Bekiş, P.; Nadeem, M.A. Light-emitting diodes induced in vitro regeneration of Alternanthera reineckii mini and validation via machine learning algorithms. In Vitro Cell. Dev. Biol. Plant 2022, 58, 816–825. [Google Scholar] [CrossRef]
  61. Vinothkumar, T.; Deepa, S.N.; Raj, F.V.A. Adaptive probabilistic neural network based on hybrid PSO–ALO for predicting wind speed in different regions. Neural Comput. Appl. 2023, 35, 19997–20011. [Google Scholar] [CrossRef]
  62. Omer, N.; Samak, A.H.; Taloba, A.I.; Abd El-Aziz, R.M. A novel optimized probabilistic neural network approach for intrusion detection and categorization. Alex. Eng. J. 2023, 72, 351–361. [Google Scholar] [CrossRef]
  63. Sadat-Hosseini, M.; Arab, M.M.; Soltani, M.; Eftekhari, M.; Soleimani, A. Applicability of soft computing techniques for in vitro micropropagation media simulation and optimization: A comparative study on Salvia macrosiphon Boiss. Ind. Crops Prod. 2023, 199, 116750. [Google Scholar] [CrossRef]
  64. Arab, M.M.; Yadollahi, A.; Ahmadi, H.; Eftekhari, M.; Maleki, M. Mathematical modeling and optimizing of in vitro hormonal combination for G × N15 vegetative rootstock proliferation using artificial neural network-genetic algorithm (ANN-GA). Front. Plant Sci. 2017, 8, 1853. [Google Scholar] [CrossRef]
  65. Jafari, M.; Daneshvar, M.H. Machine learning-mediated Passiflora caerulea callogenesis optimization. PLoS ONE 2024, 19, e0292359. [Google Scholar] [CrossRef]
  66. Jafari, M.; Daneshvar, M.H. Prediction and optimization of indirect shoot regeneration of Passiflora caerulea using machine learning and optimization algorithms. BMC Biotechnol. 2023, 23, 27. [Google Scholar] [CrossRef] [PubMed]
  67. Xue, H.; Zhang, B.; Tian, J.-R.; Chen, M.-M.; Zhang, Y.-Y.; Zhang, Z.-H.; Ma, Y. Comparison of the morphology, growth and development of diploid and autotetraploid ‘Hanfu’ apple trees. Sci. Hortic. 2017, 225, 277–285. [Google Scholar] [CrossRef]
  68. Fernandes, H.P.; Choi, Y.H.; Vrieling, K.; de Bresser, M.; Sewalt, B.; Tonolo, F. Cultivar-dependent phenotypic and chemotypic responses of drug-type Cannabis sativa L. to polyploidization. Front. Plant Sci. 2023, 14, 1233191. [Google Scholar] [CrossRef]
  69. Allario, T.; Brumos, J.; Colmenero-Flores, J.M.; Tadeo, F.; Froelicher, Y.; Talon, M.; Navarro, L.; Ollitrault, P.; Morillon, R. Large changes in anatomy and physiology between diploid Rangpur lime (Citrus limonia) and its autotetraploid are not associated with large changes in leaf gene expression. J. Exp. Bot. 2011, 62, 2507–2519. [Google Scholar] [CrossRef]
  70. Zahumenická, P.; Fernández, E.; Šedivá, J.; Žiarovská, J.; Ros-Santaella, J.L.; Martínez-Fernández, D.; Russo, D.; Milella, L. Morphological, physiological and genomic comparisons between diploids and induced tetraploids in Anemone sylvestris L. Plant Cell Tissue Organ Cult. 2018, 132, 317–327. [Google Scholar] [CrossRef]
  71. Baker, R.L.; Yarkhunova, Y.; Vidal, K.; Ewers, B.E.; Weinig, C. Polyploidy and the relationship between leaf structure and function: Implications for correlated evolution of anatomy, morphology, and physiology in Brassica. BMC Plant Biol. 2017, 17, 3. [Google Scholar] [CrossRef] [PubMed]
  72. Zhang, Z.; Zhang, Y.; Di, Z.; Zhang, R.; Mu, Y.; Sun, T.; Tian, Z.; Lu, Y.; Zheng, J. Tetraploid induction with leaf morphology and sunburn variation in Sorbus pohuashanensis (Hance) Hedl. Forests 2023, 14, 1589. [Google Scholar] [CrossRef]
  73. Zhang, X.; Chen, K.; Wang, W.; Liu, G.; Yang, C.; Jiang, J. Differences in leaf morphology and related gene expression between diploid and tetraploid birch (Betula pendula). Int. J. Mol. Sci. 2022, 23, 12966. [Google Scholar] [CrossRef]
  74. Chen, Y.; Xu, H.; He, T.; Gao, R.; Guo, G.; Lu, R.; Chen, Z.; Liu, C. Comparative analysis of morphology, photosynthetic physiology, and transcriptome between diploid and tetraploid barley derived from microspore culture. Front. Plant Sci. 2021, 12, 626916. [Google Scholar] [CrossRef]
  75. Šímová, I.; Herben, T. Geometrical constraints in the scaling relationships between genome size, cell size and cell cycle length in herbaceous plants. Proc. R. Soc. B Biol. Sci. 2011, 279, 867–875. [Google Scholar] [CrossRef] [PubMed]
  76. Fujimoto, S.; Ito, M.; Matsunaga, S.; Fukui, K. An upper limit of the ratio of DNA volume to nuclear volume exists in plants. Genes Genet. Syst. 2005, 80, 345–350. [Google Scholar] [CrossRef] [PubMed]
  77. Driver, J.A.; Kuniyuki, A.H. In vitro propagation of paradox walnut rootstock. HortScience 1984, 19, 507–509. [Google Scholar] [CrossRef]
  78. Dpooležel, J.; Binarová, P.; Lcretti, S. Analysis of Nuclear DNA content in plant cells by Flow cytometry. Biol. Plant. 1989, 31, 113–120. [Google Scholar] [CrossRef]
  79. Hesami, M.; Pepe, M.; Jones, A.M. Morphological characterization of Cannabis sativa L. Throughout its complete life cycle. Plants 2023, 12, 3646. [Google Scholar] [CrossRef]
Figure 1. In vitro polyploidy induction in cannabis: (A) in vitro-grown plantlets with different ploidy levels, (B) plantlets with different ploidy levels after 6 weeks, (C) leaves of tetraploid, diploid, and mixoploid plantlets, and (D) leaf area (mm2) of tetraploid, diploid, and mixoploid plantlets.
Ijms 26 01746 g001
Figure 2. Effect of different oryzalin concentrations at various exposure times on in vitro polyploidy induction in cannabis.
Ijms 26 01746 g002
Figure 3. Leaf-related morphological traits in cannabis with different ploidy levels, including diploid, tetraploid, and mixoploid; (A) length of the terminal leaflet, (B) width of the terminal leaflet, (C) number of serrations of the terminal leaflet, (D) length of the right lateral leaflet, (E) width of the right lateral leaflet, (F) number of serrations of the right lateral leaflet, (G) length of the left lateral leaflet, (H) width of the left lateral leaflet, (I) number of serrations of the left lateral leaflet, (J) length of the terminal leaflet/width of terminal leaflet ratio, (K) length of the right lateral leaflet/width of right lateral leaflet ratio, (L) length of the left lateral leaflet/width of left lateral leaflet ratio.
Ijms 26 01746 g003
Figure 4. Correlation between cannabis leaf-related morphological traits and ploidy levels. LA: leaf area; LLLL: left lateral leaflet length; LLLSN: left lateral leaflet serration number; LLLW: left lateral leaflet width; PL: ploidy level; RLLL: right lateral leaflet length; RLLSN: right lateral leaflet serration number; RLLW: right lateral leaflet width; TLL: terminal leaflet length; TLSN: terminal leaflet serration number; TLW: terminal leaflet width.
Ijms 26 01746 g004
Figure 5. Schematic representation of the data-driven approach for modeling and optimizing in vitro tetraploid induction in cannabis; (A) different treatments for generating the dataset, (B) the distribution of the plantlets in each ploidy level, (C) probabilistic neural network, (D) support vector classification, (E) k-nearest neighbors, (F) genetic algorithm, and (G) validation experiment.
Ijms 26 01746 g005
Figure 6. Schematic representation of the experimental methodology for in vitro tetraploid induction in cannabis, assessment of ploidy level, and measurement of leaf-related morphological traits. The scheme was created using BioRender.com.
Ijms 26 01746 g006
Table 1. Evaluation of k-nearest neighbors (KNNs), probabilistic neural network (PNN), and support vector classification (SVC) for predicting the level of ploidy in cannabis.
Performance CriteriaTraining SetTesting Set
KNN PNN SVC KNN PNN SVC
Accuracy92.9825%96.4912%80.7018%80%86.6667%80%
Error rate7.0175%3.5088%19.2982%20%13.3333%20%
Precision0.912380.952380.912730.80.932540.89599
Recall0.872380.952380.740740.80.897250.57143
F1 Score0.891930.952380.817790.80.915140.69782
Disclaimer/Publisher’s Note: The statements, opinions and data contained in all publications are solely those of the individual author(s) and contributor(s) and not of MDPI and/or the editor(s). MDPI and/or the editor(s) disclaim responsibility for any injury to people or property resulting from any ideas, methods, instructions or products referred to in the content.

