CD133+CD24+ Renal Tubular Progenitor Cells Drive Hypoxic Injury Recovery via Hypoxia-Inducible Factor-1A and Epidermal Growth Factor Receptor Expression

 , ,
, ,
Abstract

1. Introduction
2. Results
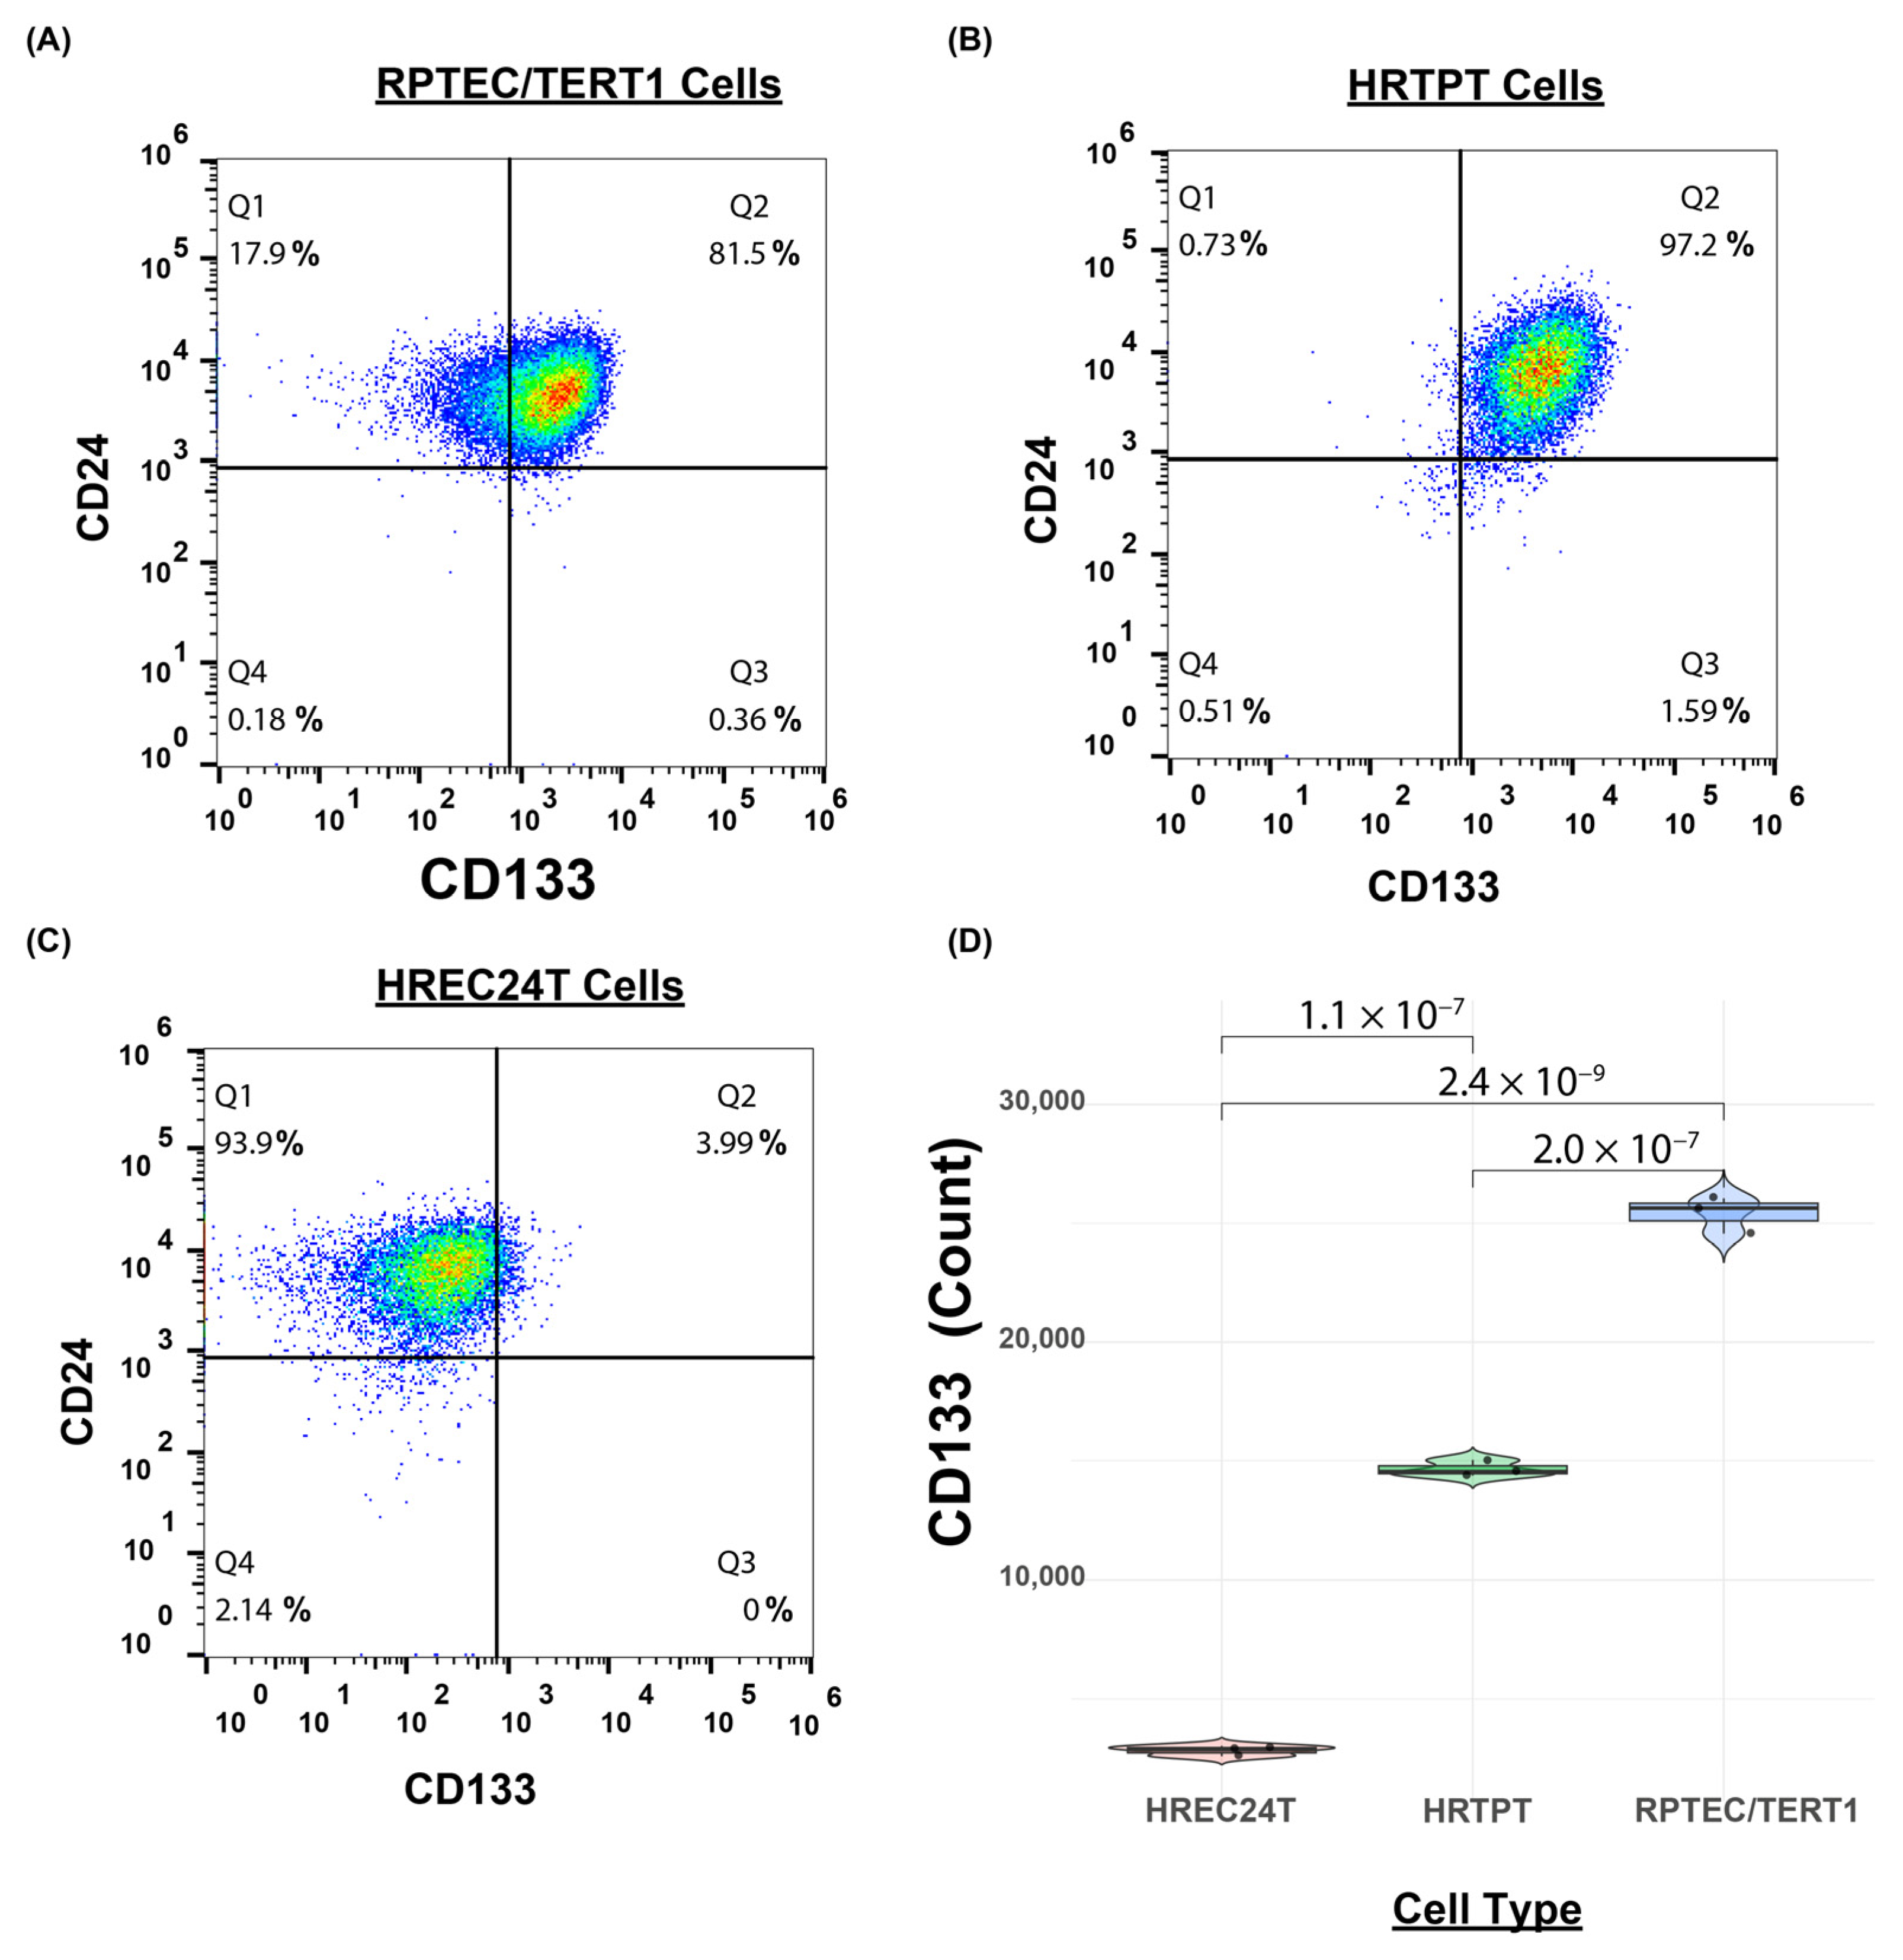
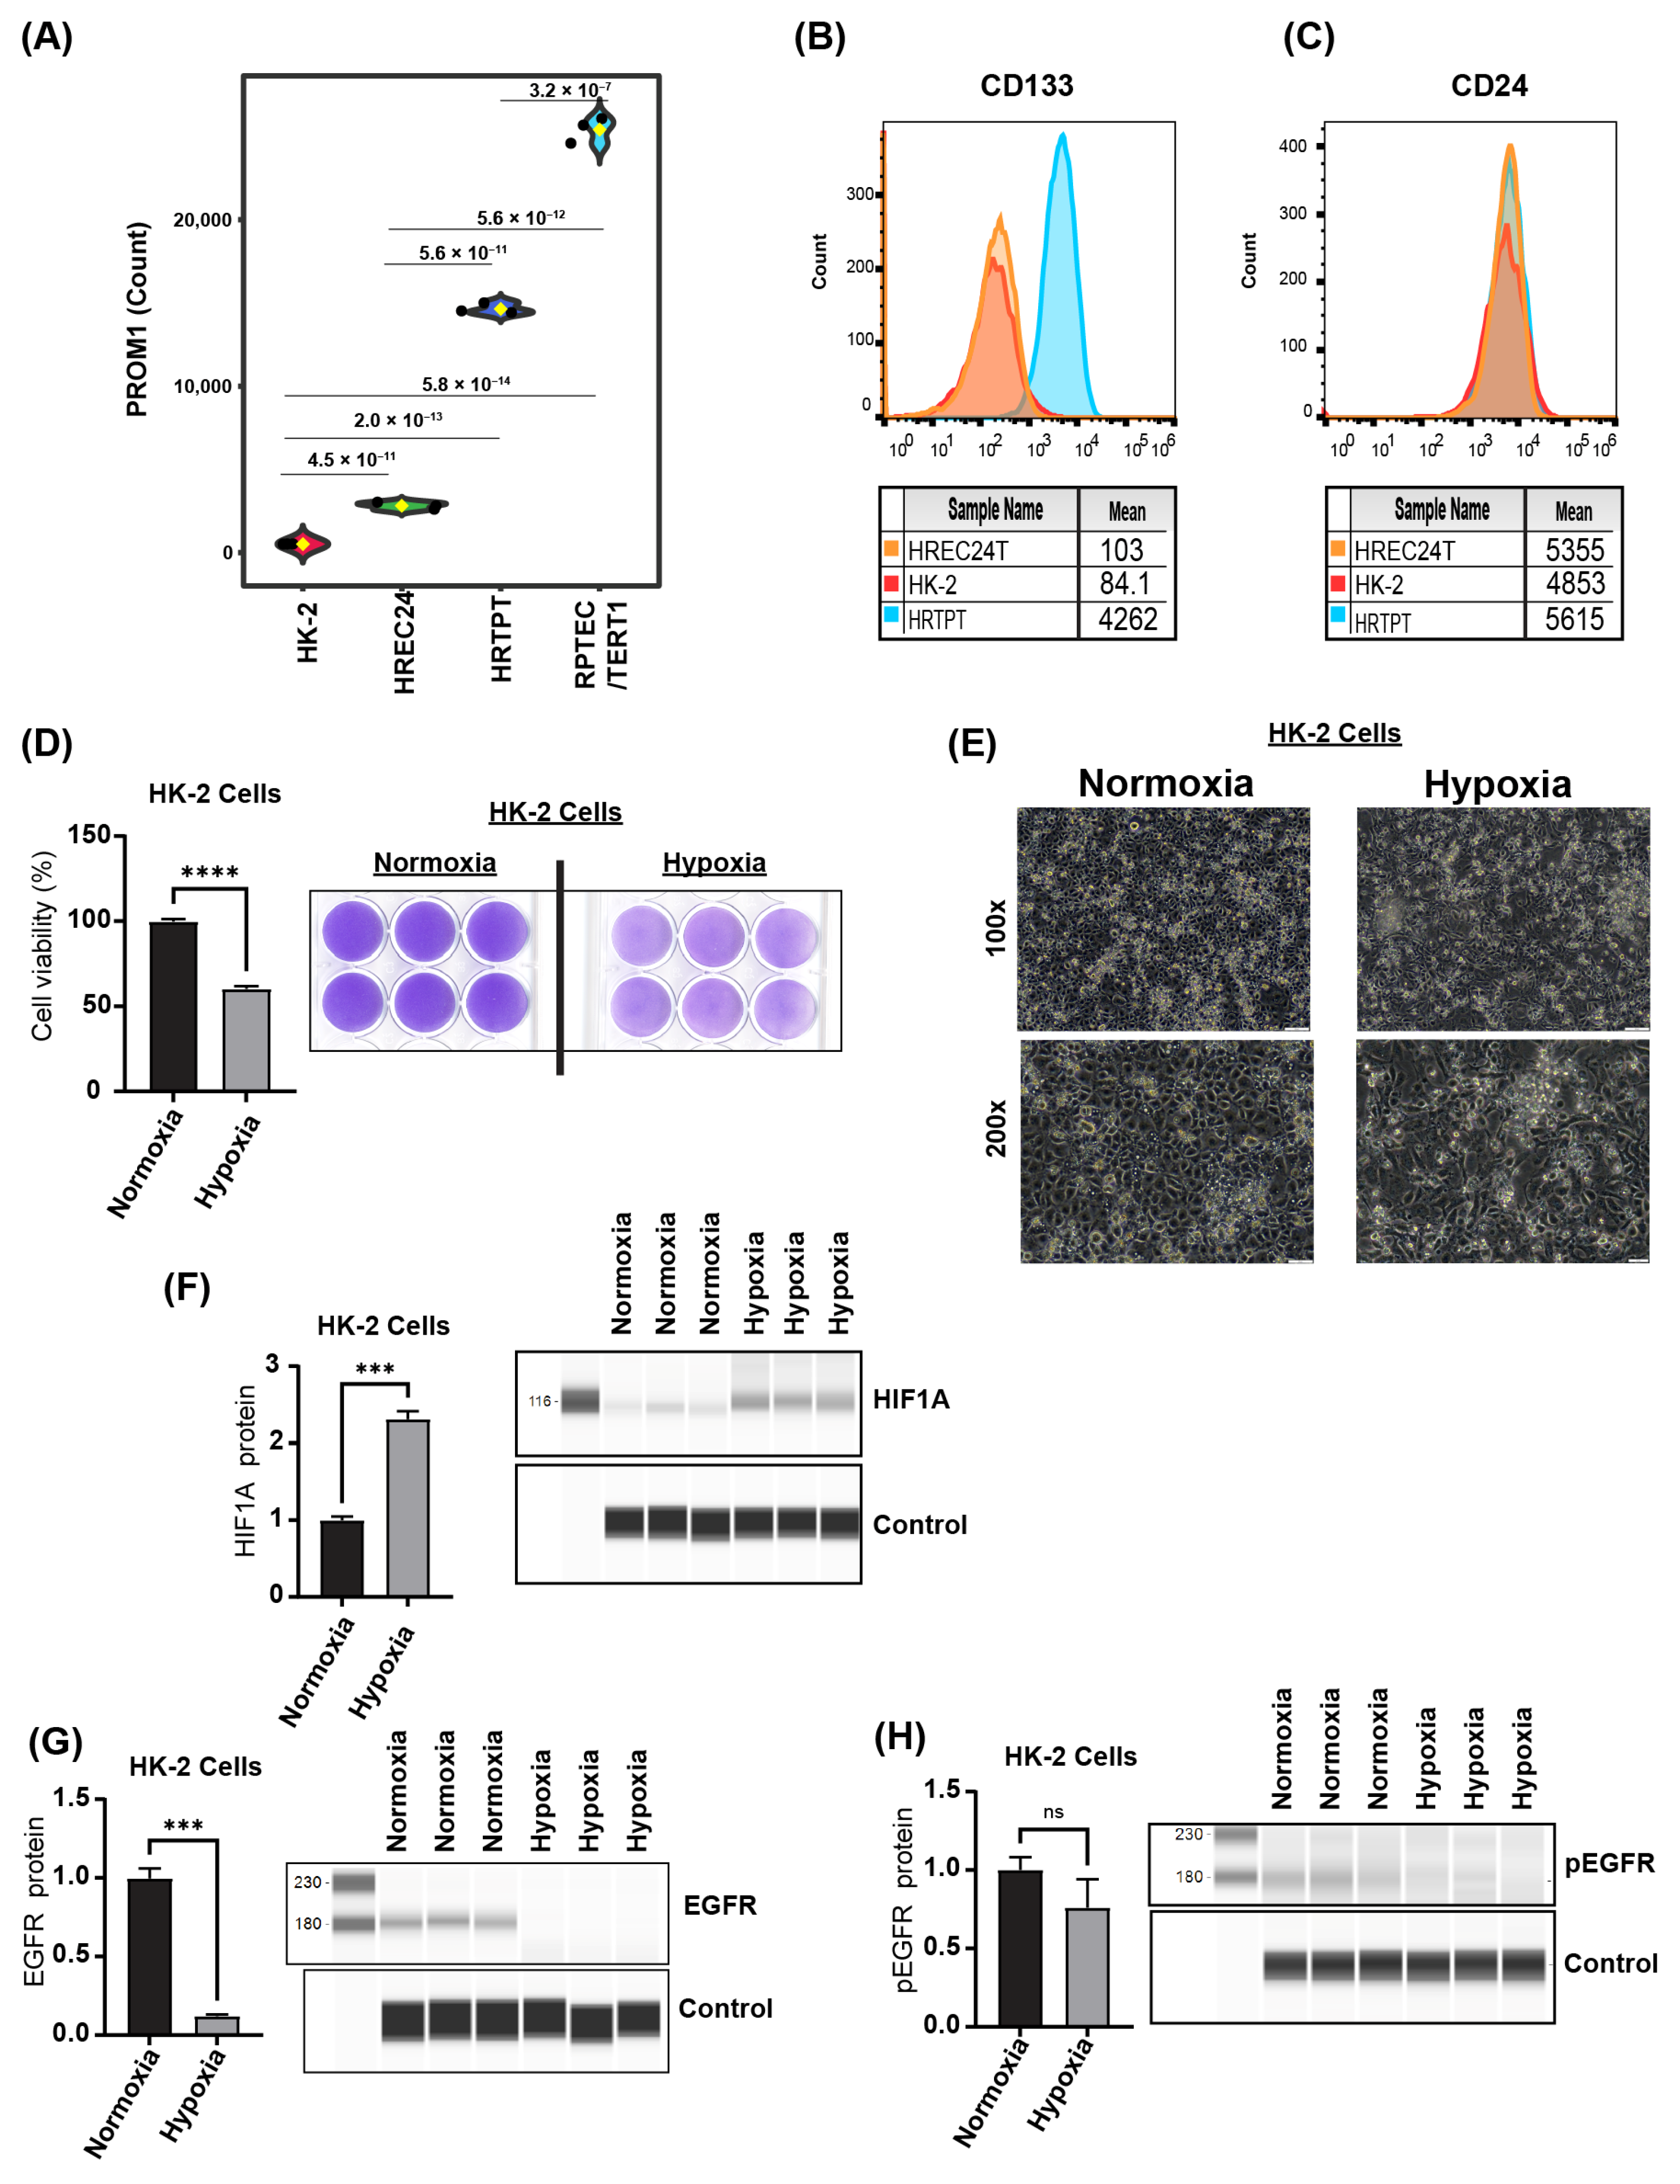
2.1. Immortalized HRTPT Kidney Progenitor Cells Express PROM1 (CD133) and CD24
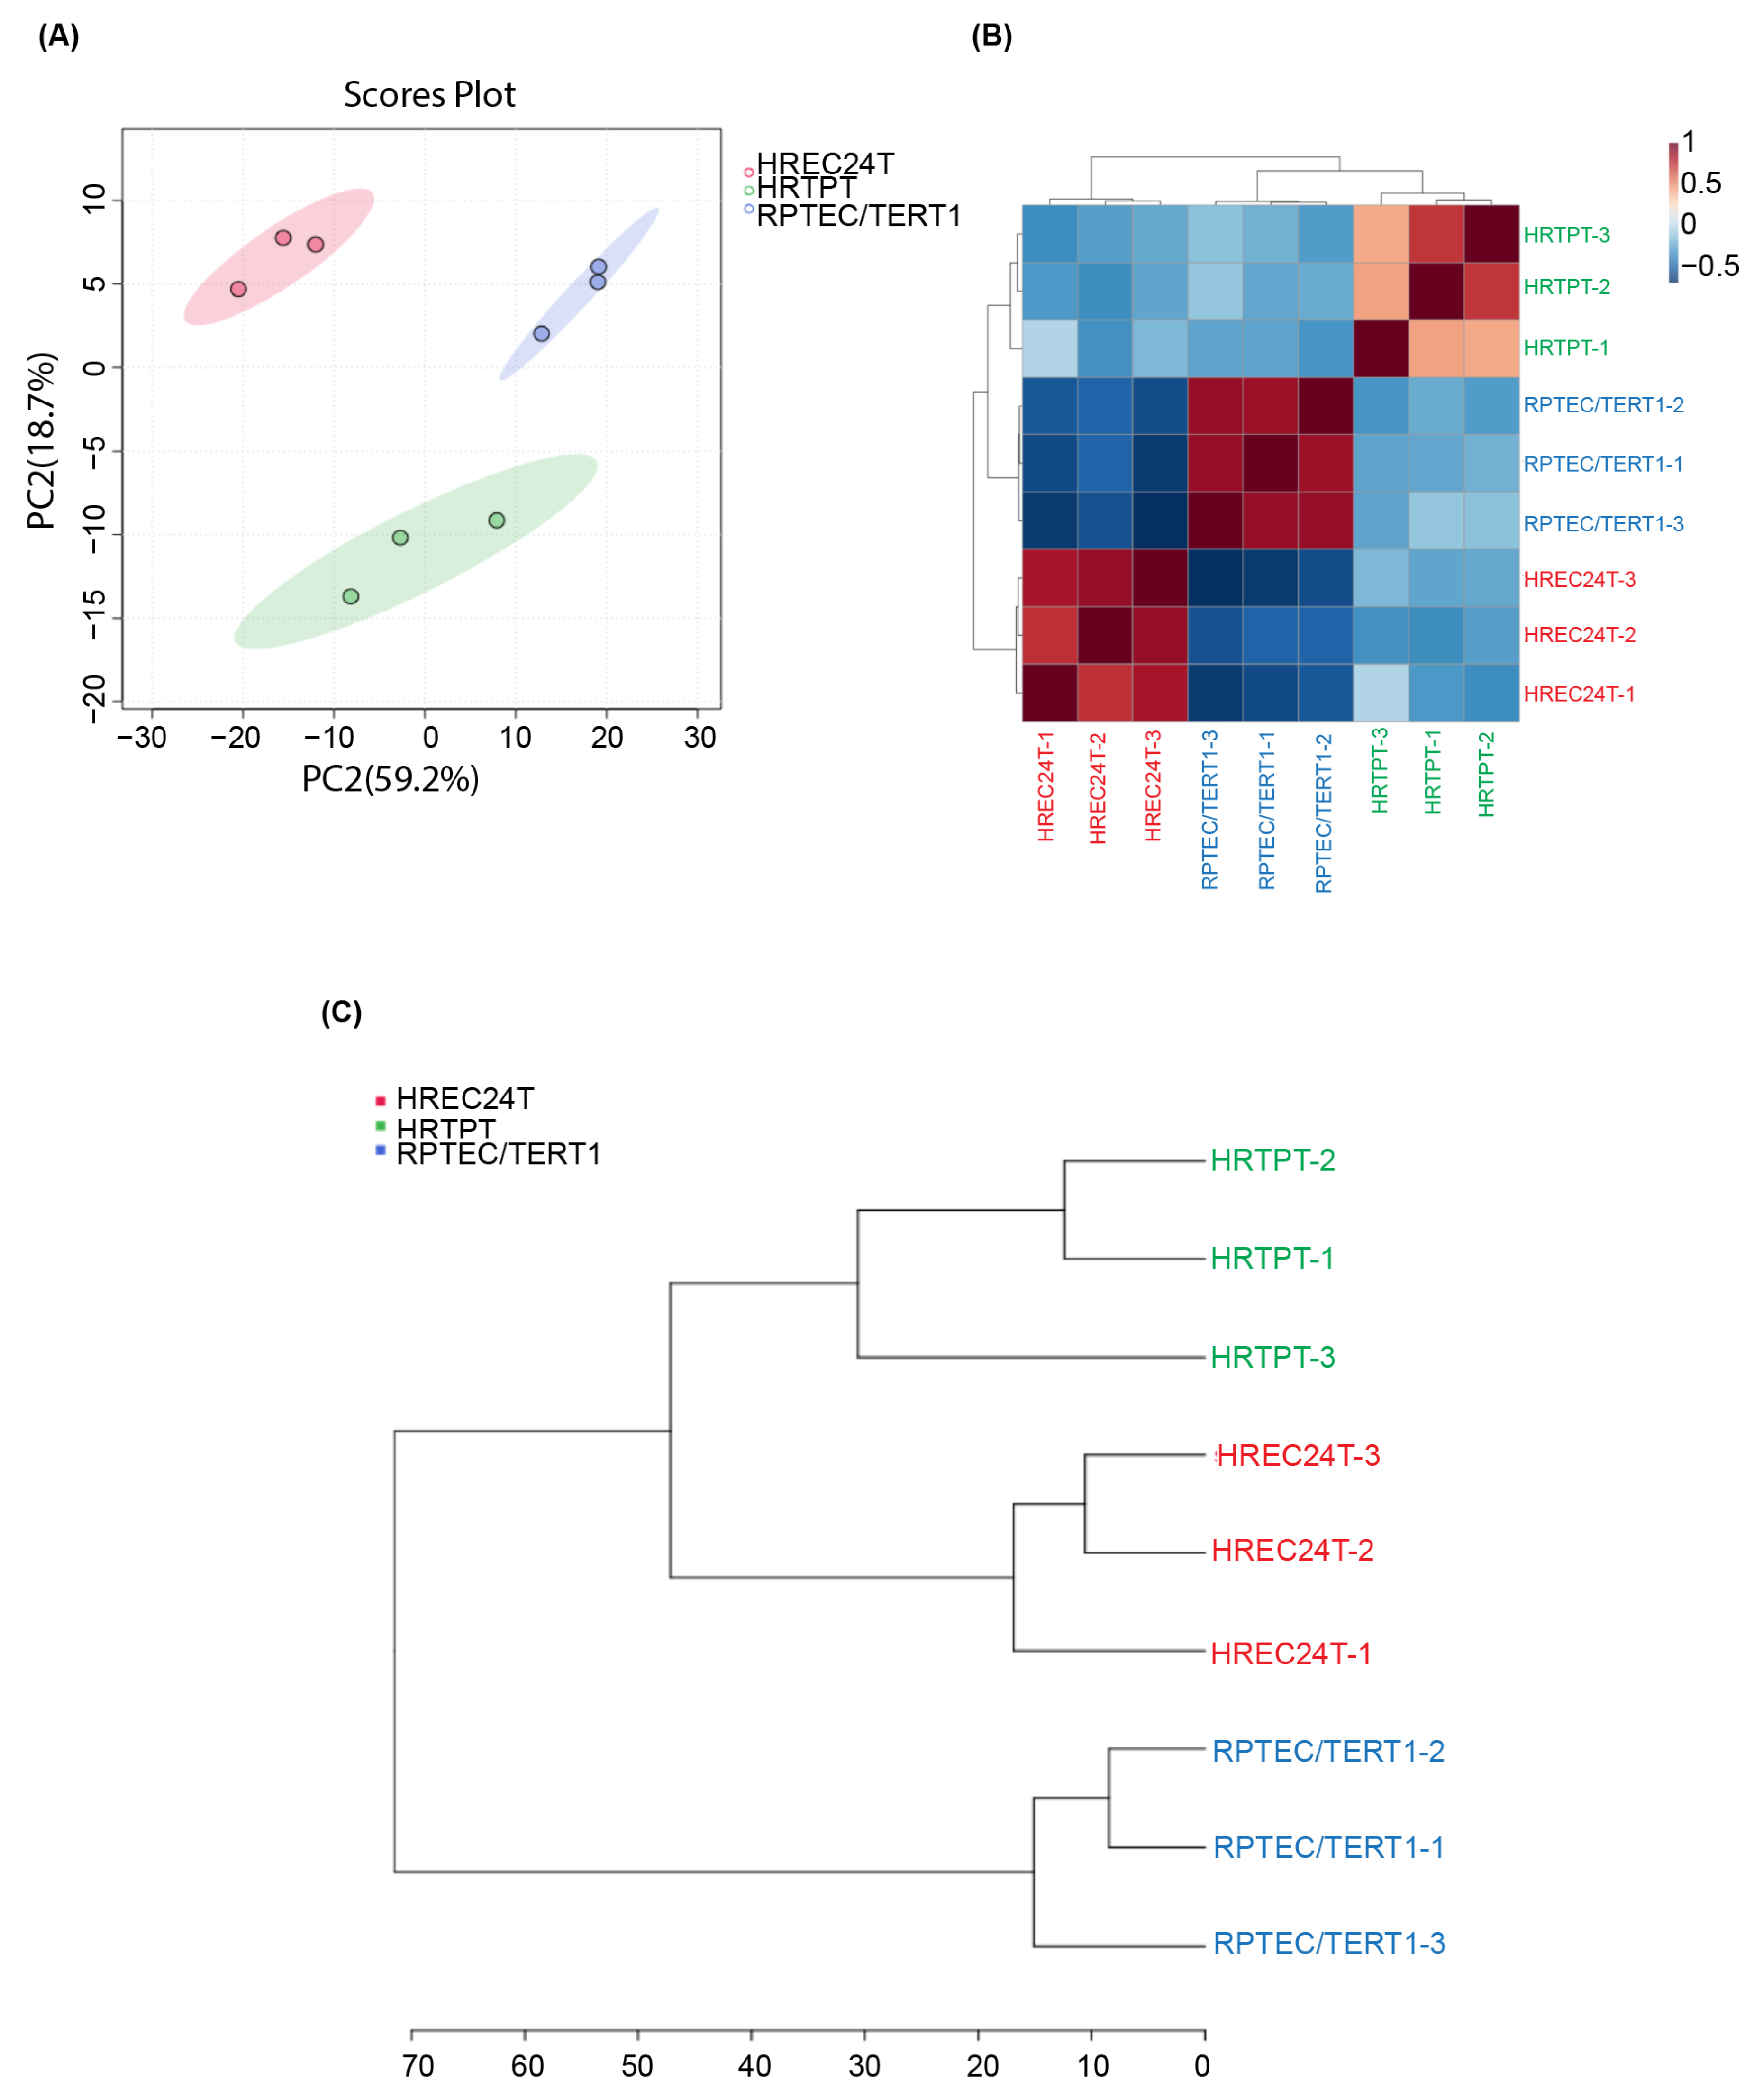
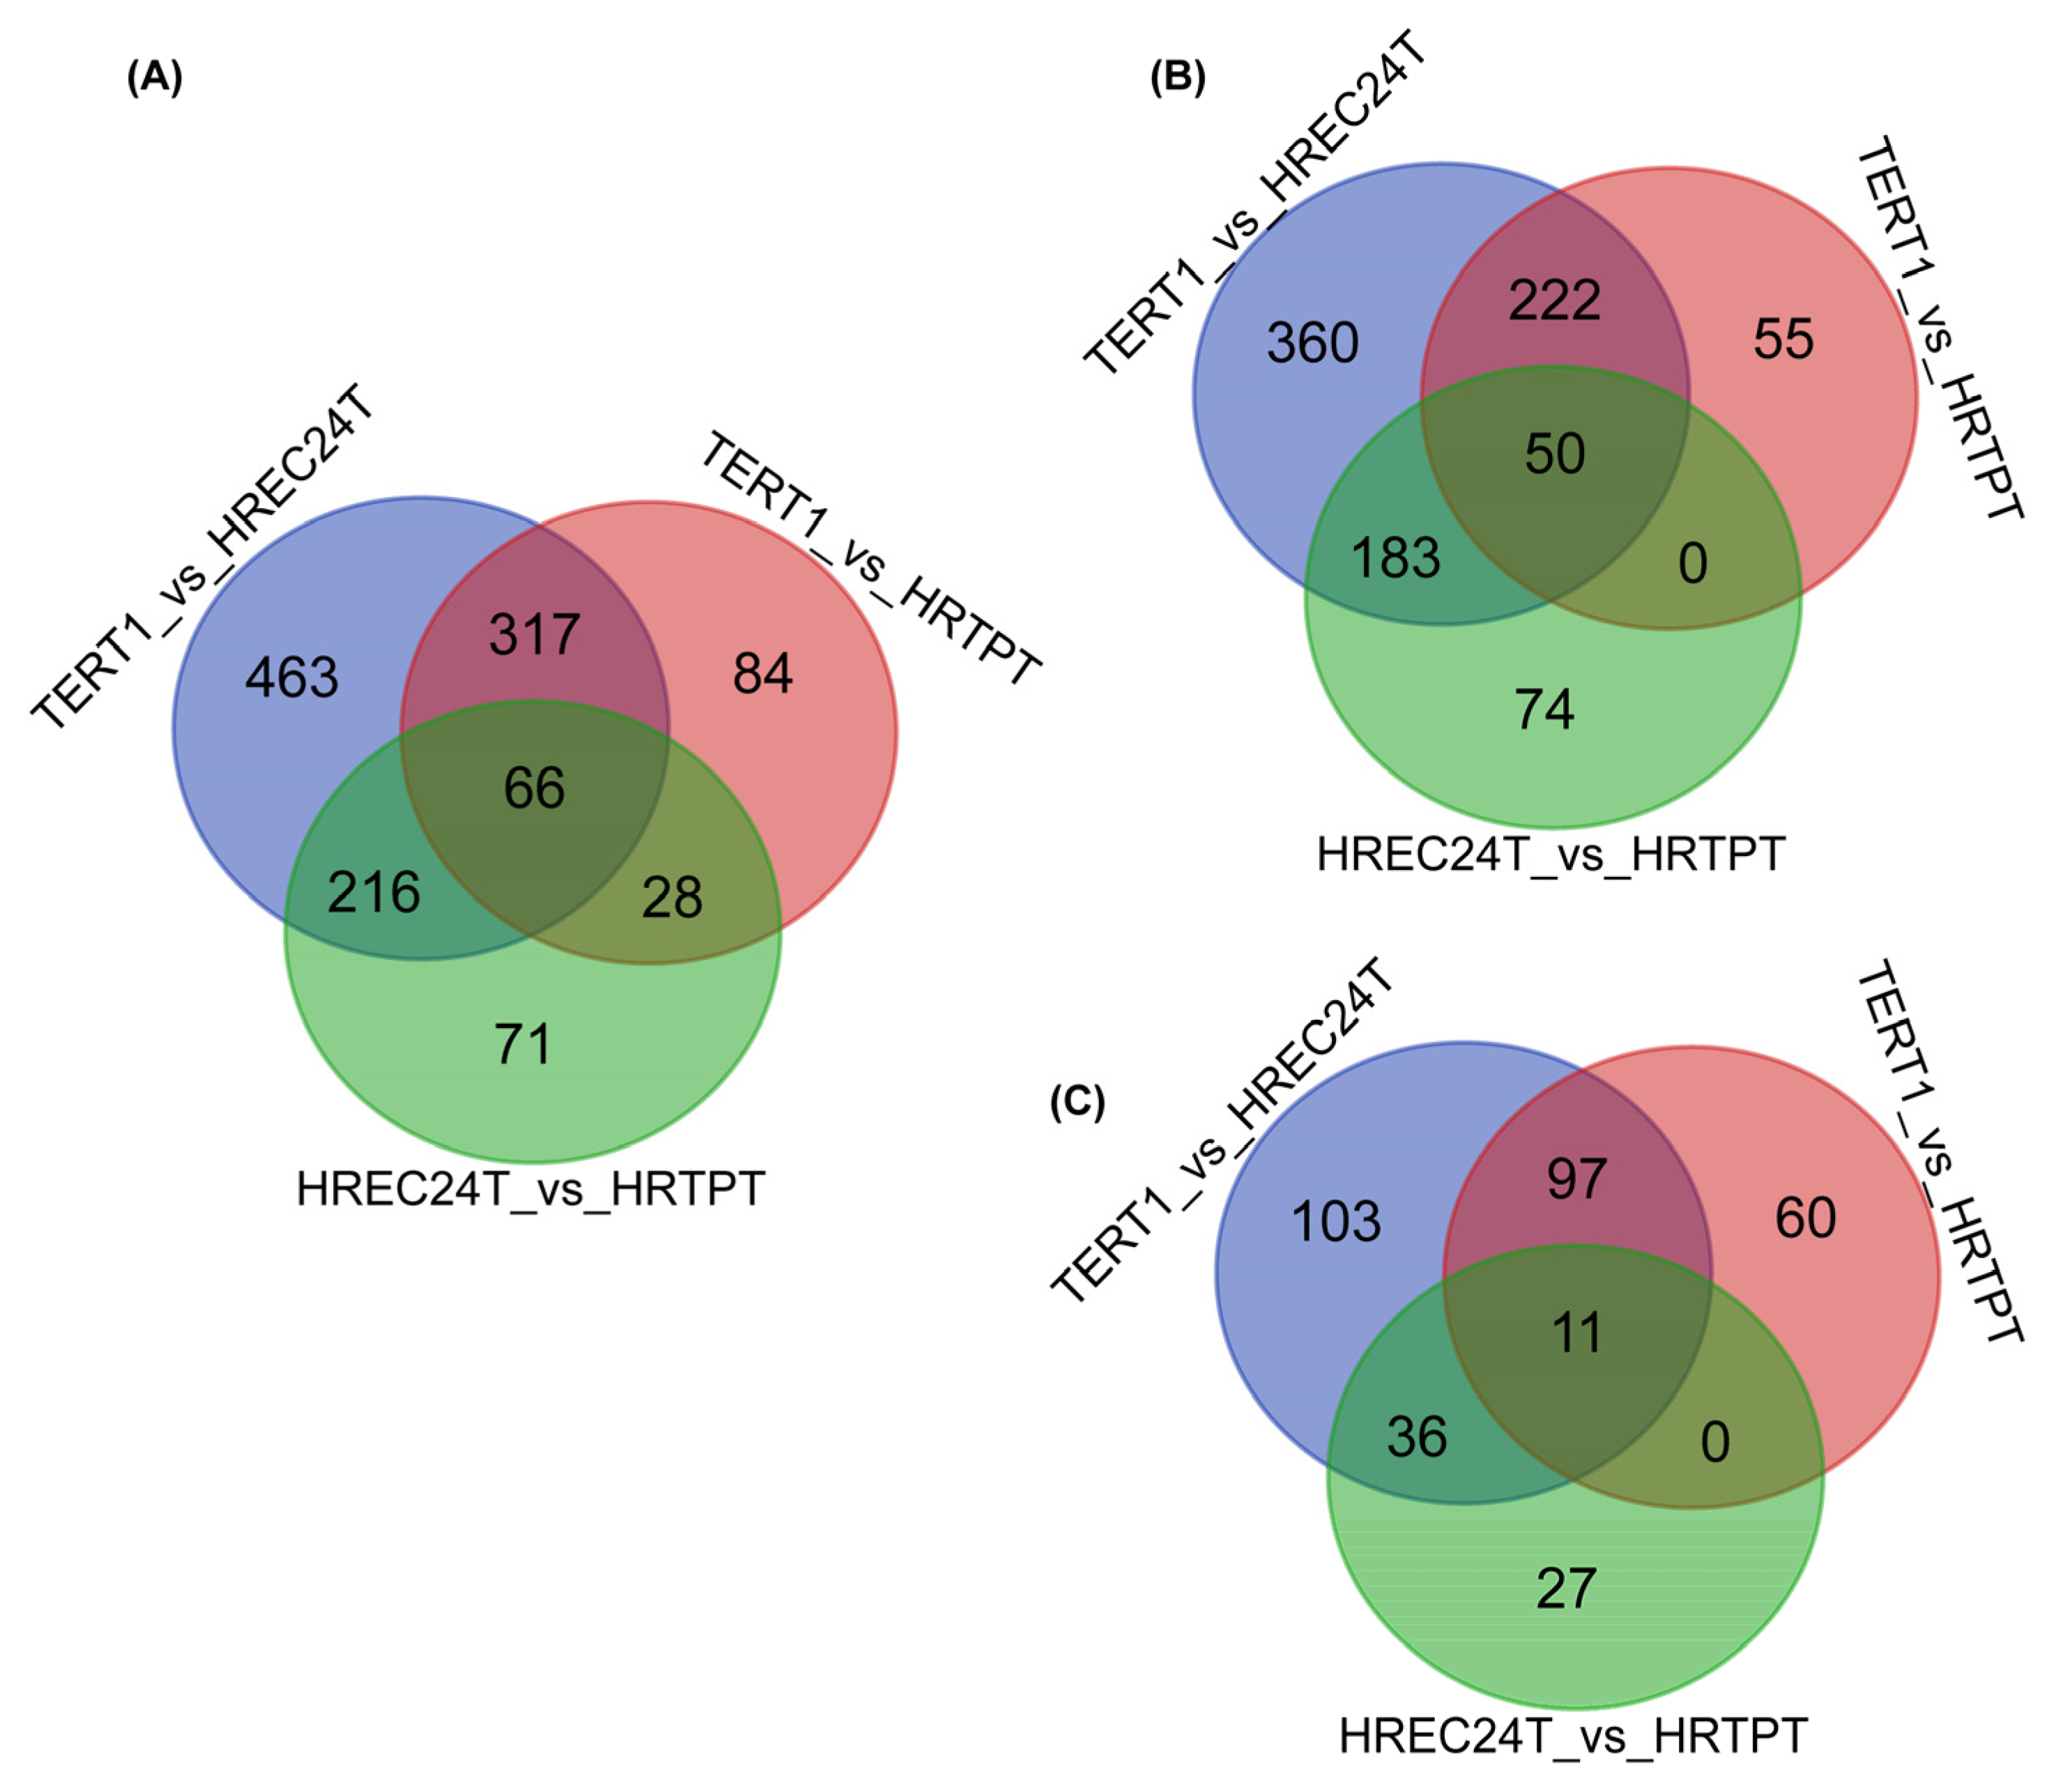
2.2. Global Gene Expression Analysis of HRTPT, HREC24T, and RPTEC/TERT1 Cells
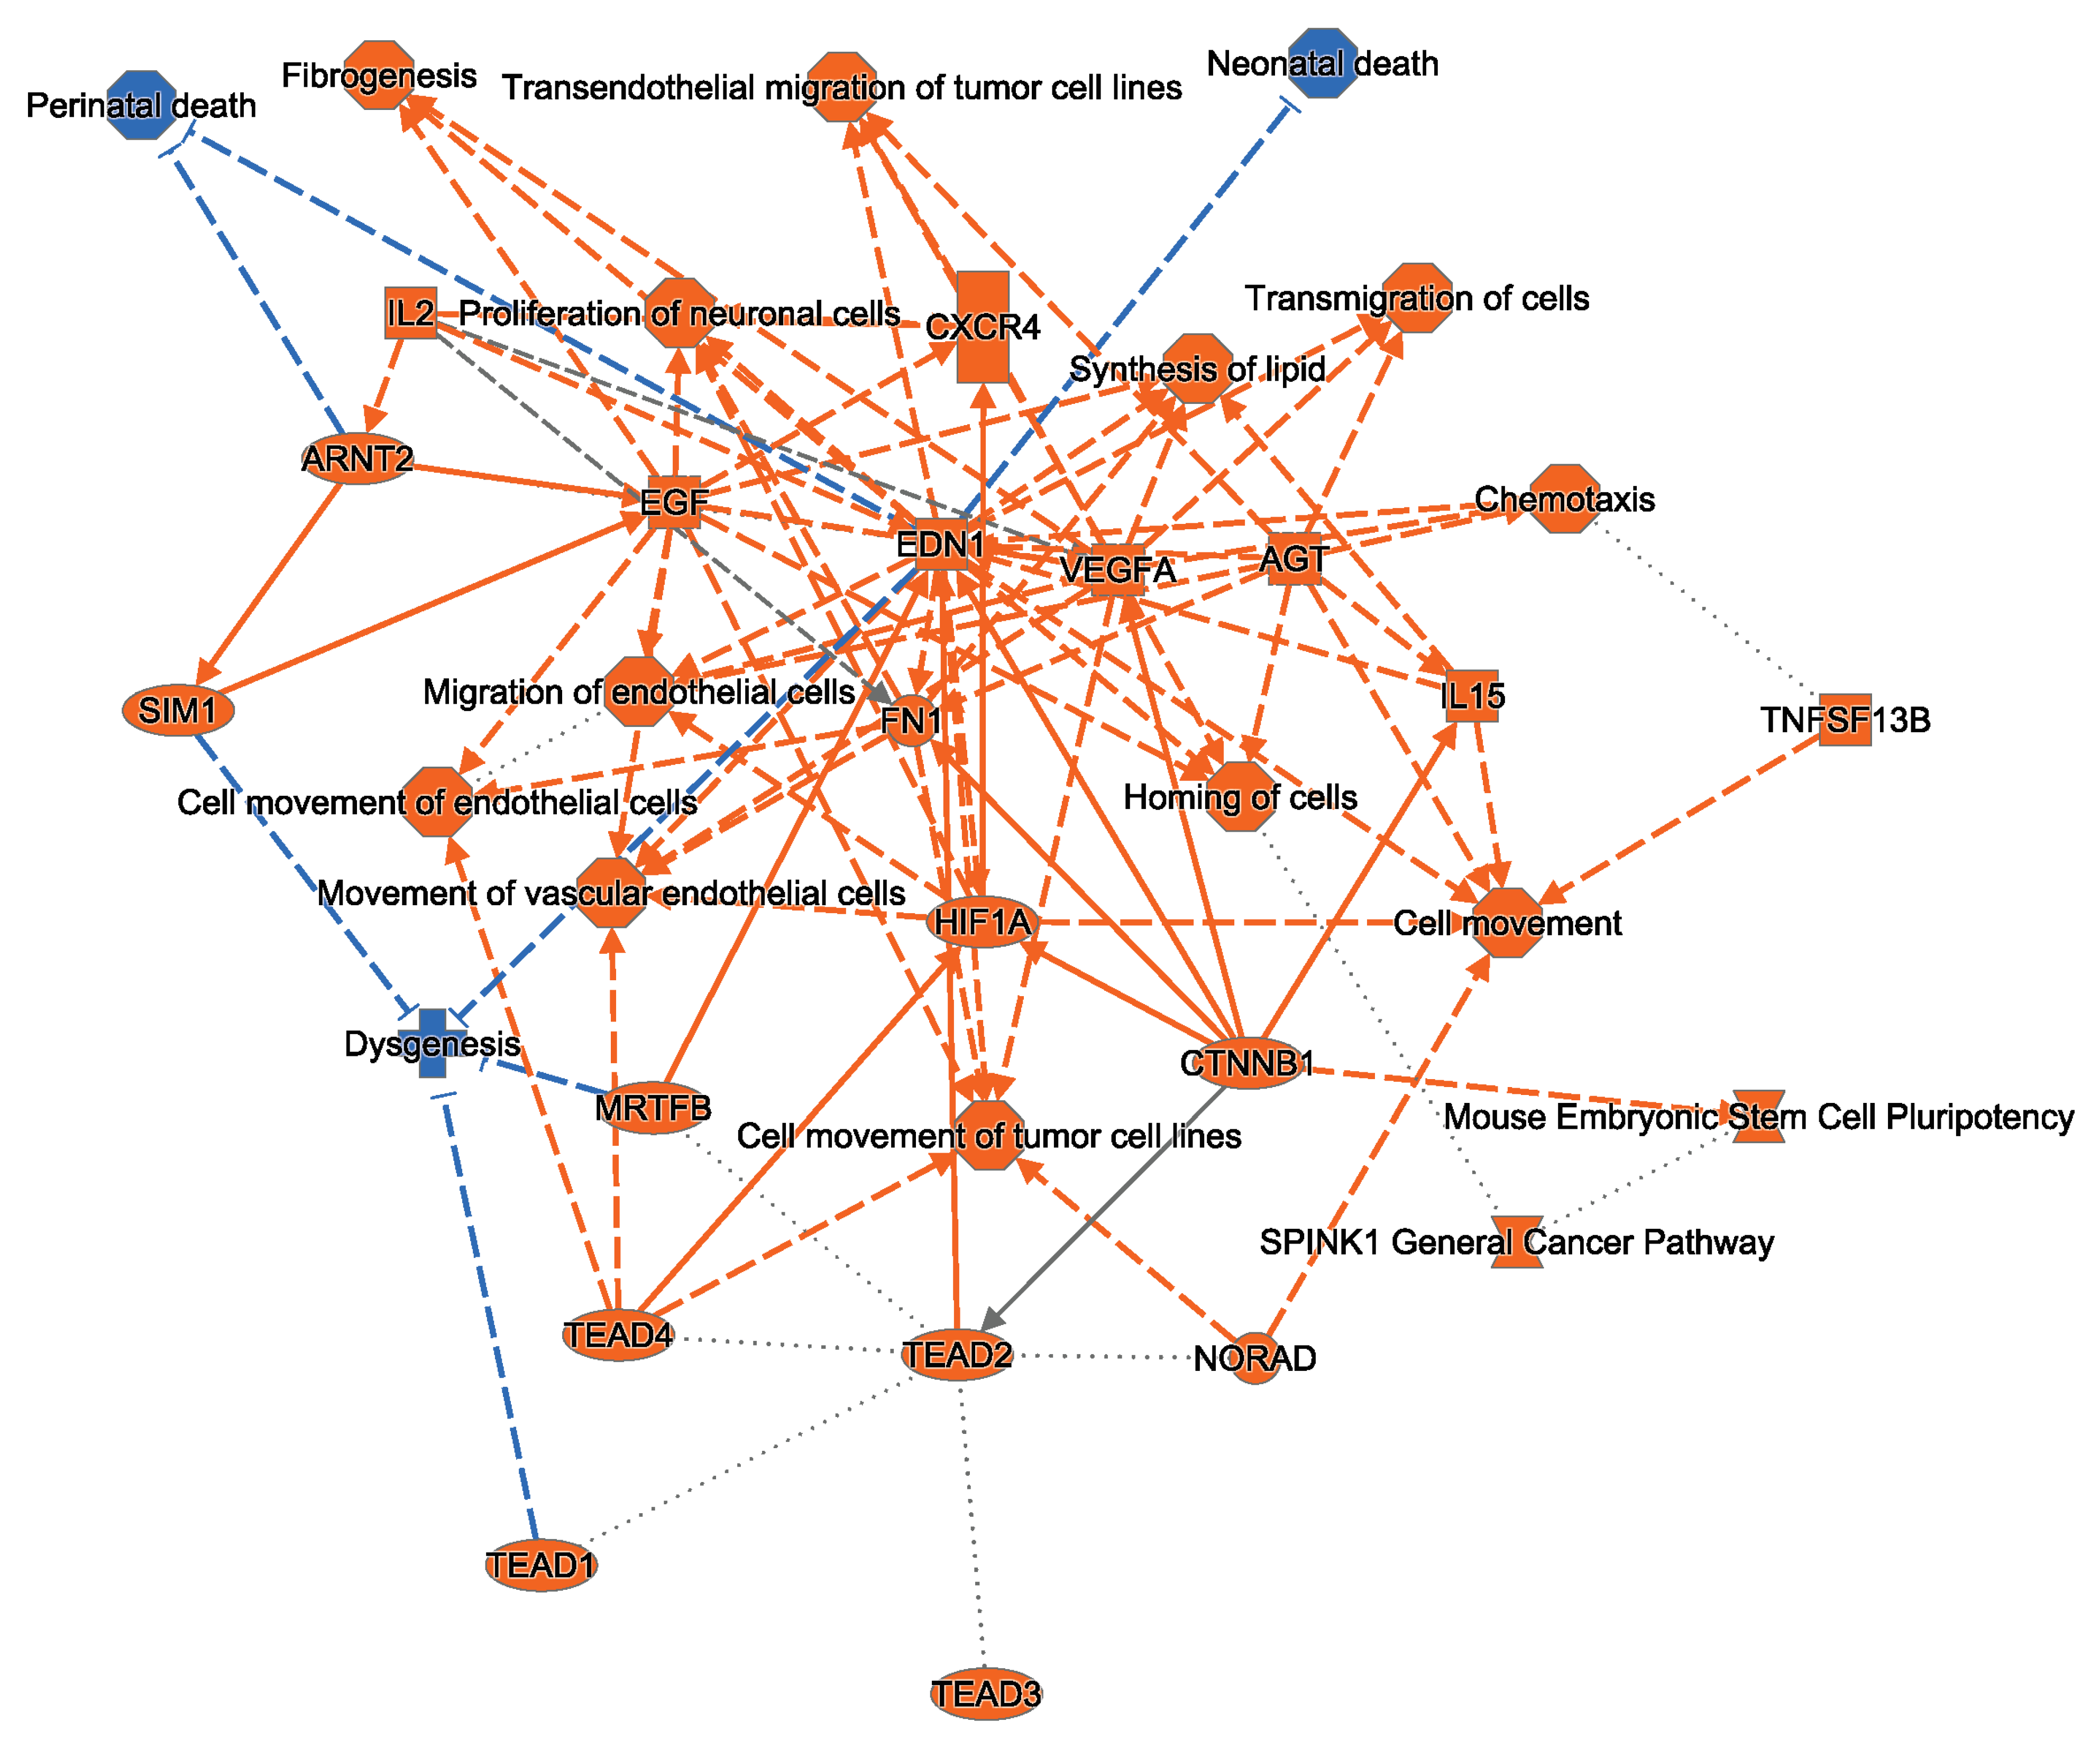
2.3. Ingenuity Pathway Analysis Indicates That HRTPT Cells Are Enriched with Hypoxia Response Elements
2.4. HRTPT CD133+CD24+ Kidney Progenitor Cells Are Resistant to Hypoxic Cell Death
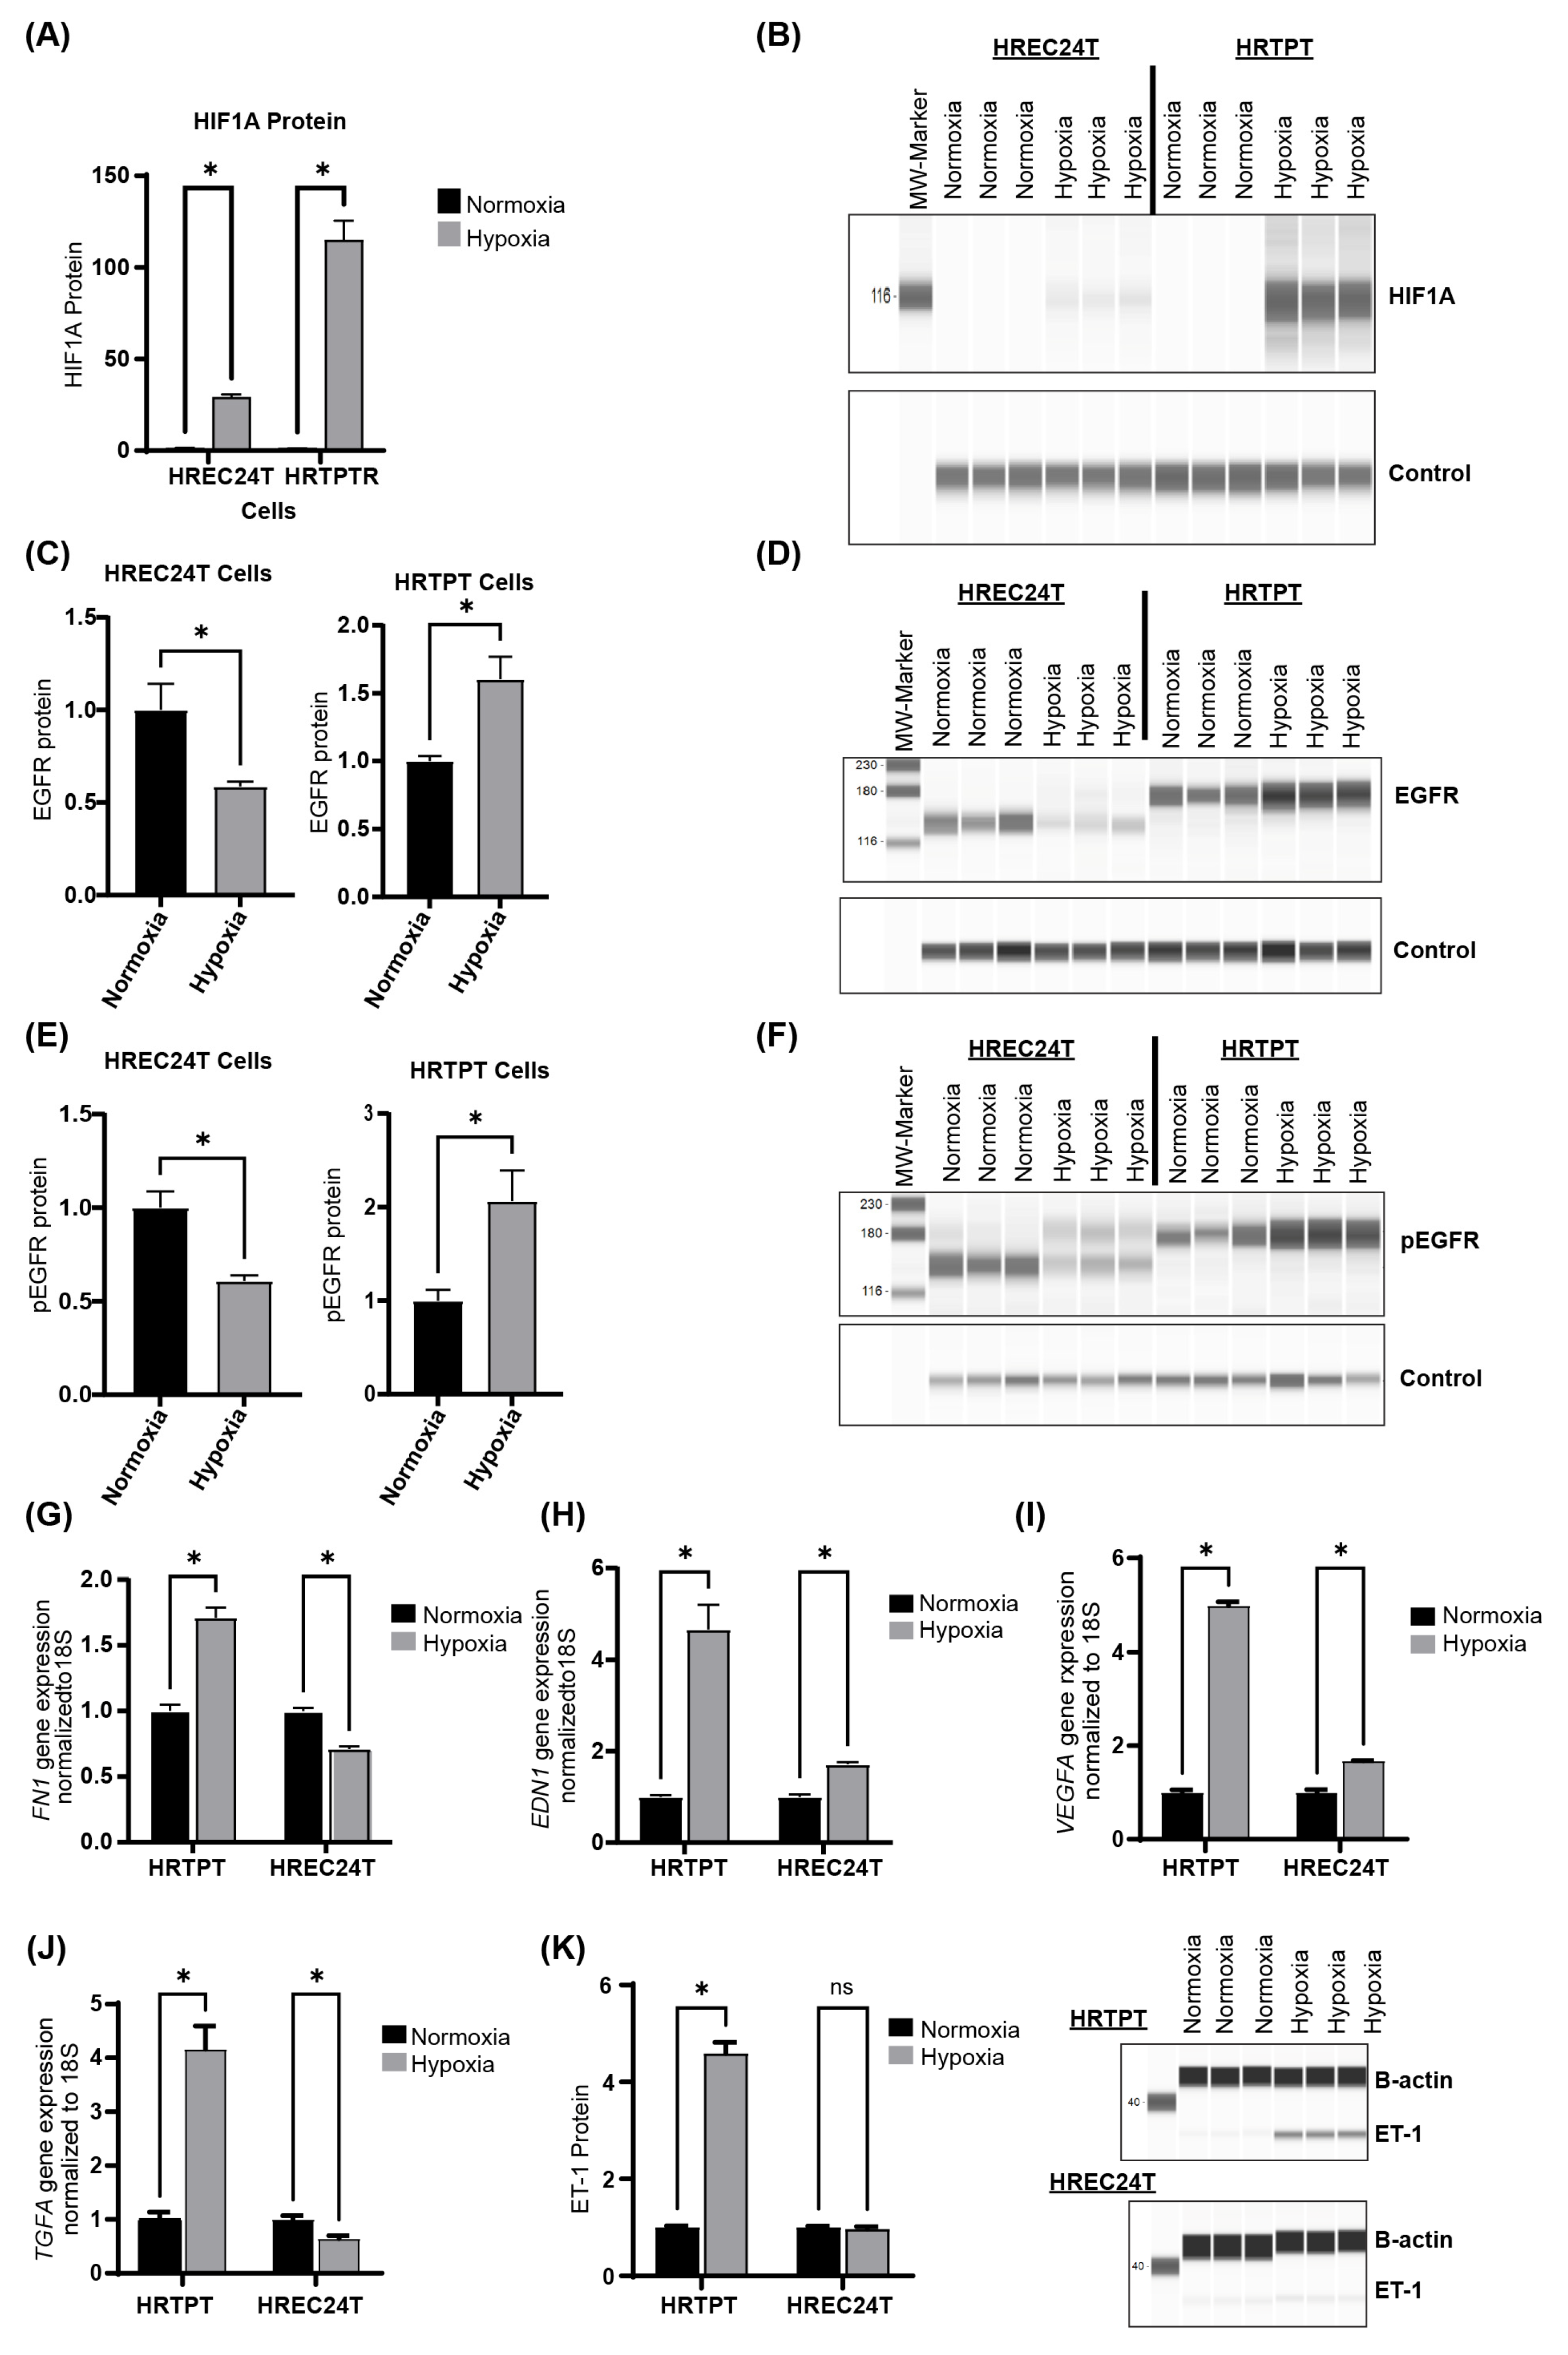
2.5. Hypoxia Upregulates HIF1A and EGFR Expression in HRTPT Progenitor Cells
2.6. HREC24T and HK-2 Cells Have Comparable Responses to Hypoxic Stress
3. Discussion
4. Limitations of the Study
5. Conclusions
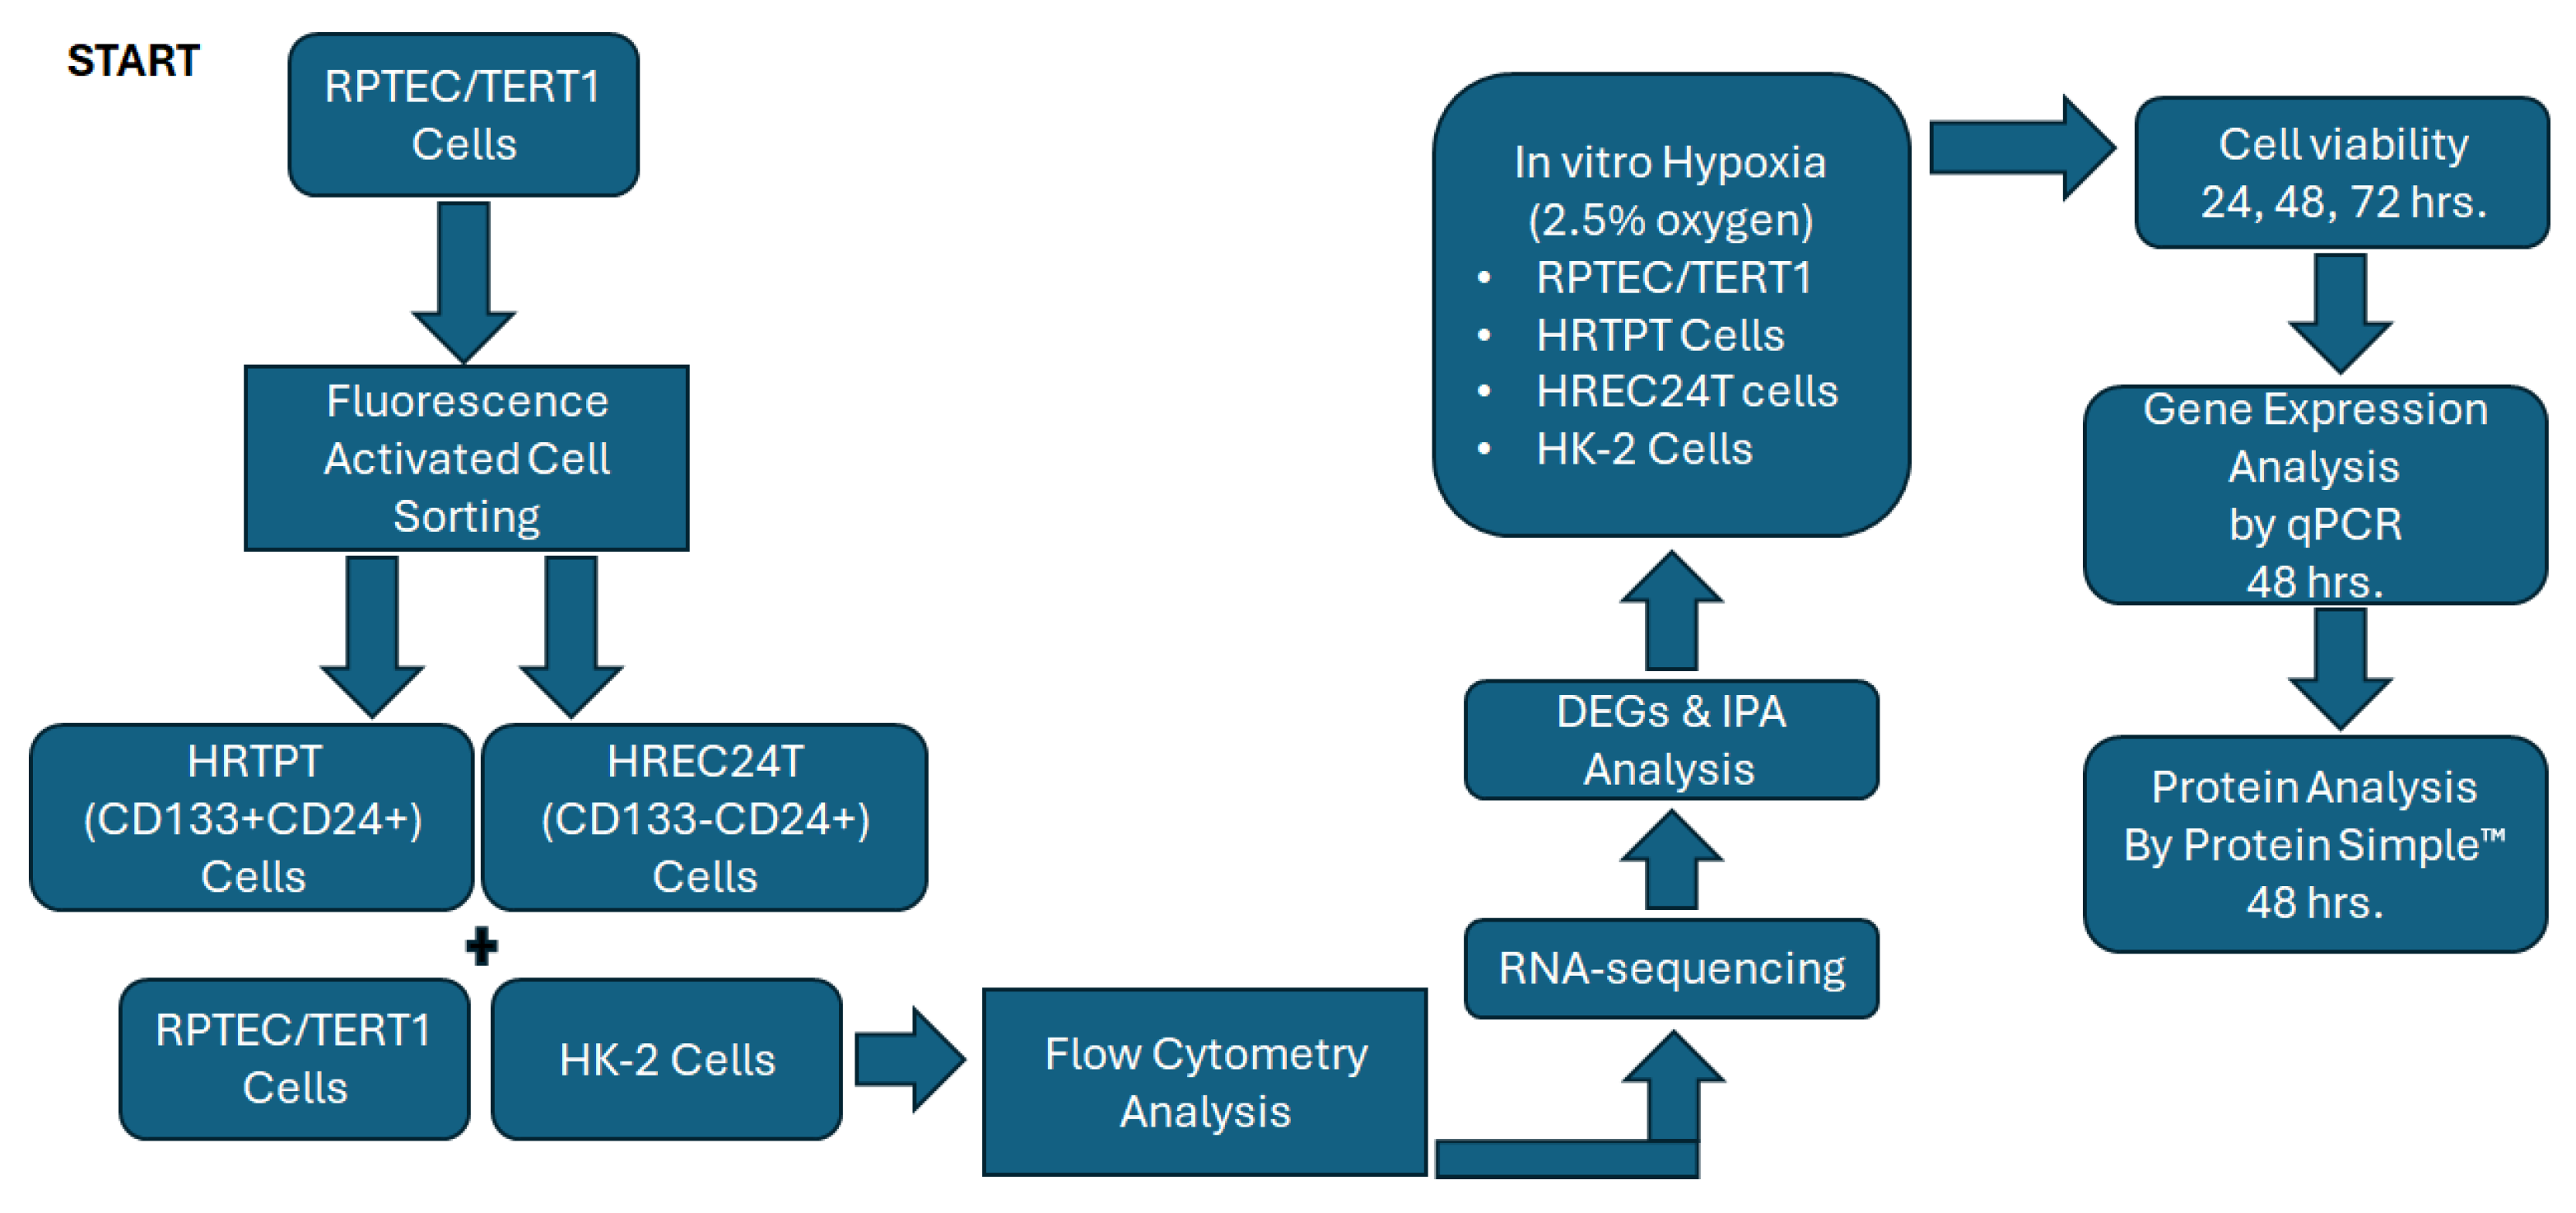
6. Methods
6.1. Cell Culture and Reagents
6.2. Flow Cytometry Analysis
6.3. RNA Extraction and RT-qPCR
6.4. RNA Sequencing and Analysis
6.5. Hypoxic Cell Culture
6.6. Crystal Violet Cell Viability
6.7. Protein Analysis
6.8. Statistical Analysis
Supplementary Materials
Author Contributions
Funding
Institutional Review Board Statement
Informed Consent Statement
Data Availability Statement
Acknowledgments
Conflicts of Interest
Abbreviations
| HRTPT | Human renal tubular precursor TERT. |
| HREC24T | Human renal epithelial cell 24 TERT. |
| RPTEC/TERT1 | Renal proximal tubular epithelial cells-TERT1. |
| EGFR | Epidermal growth factor receptor |
| EDN1 | Endothelin-1 |
| ET-1 | Endothelin-1 protein. |
| HIF1A | Hypoxia-Inducible Factor 1A. |
References
- Kidney Disease Statistics for the United States—NIDDK. Available online: https://www.ncbi.nlm.nih.gov/pubmed/ (accessed on 5 October 2024).
- Chronic Kidney Disease (CKD) Treatment & Management: Approach Considerations, Delaying or Halting Progression of Chronic Kidney Disease, Treating Pathologic Manifestations of Chronic Kidney Disease. Available online: https://emedicine.medscape.com/article/238798-treatment (accessed on 1 October 2024).
- Berger, K.; Moeller, M.J. Mechanisms of epithelial repair and regeneration after acute kidney injury. Semin. Nephrol. 2014, 34, 394–403. [Google Scholar] [CrossRef] [PubMed]
- Humphreys, B.D.; Valerius, M.T.; Kobayashi, A.; Mugford, J.W.; Soeung, S.; Duffield, J.S.; McMahon, A.P.; Bonventre, J.V. Intrinsic epithelial cells repair the kidney after injury. Cell Stem Cell 2008, 2, 284–291. [Google Scholar] [CrossRef] [PubMed]
- Andrianova, N.V.; Buyan, M.I.; Zorova, L.D.; Pevzner, I.B.; Popkov, V.A.; Babenko, V.A.; Silachev, D.N.; Plotnikov, E.Y.; Zorov, D.B. Kidney Cells Regeneration: Dedifferentiation of Tubular Epithelium, Resident Stem Cells and Possible Niches for Renal Progenitors. Int. J. Mol. Sci. 2019, 20, 6326. [Google Scholar] [CrossRef] [PubMed]
- Humphreys, B.D. Kidney injury, stem cells and regeneration. Curr. Opin. Nephrol. Hypertens. 2014, 23, 25–31. [Google Scholar] [CrossRef]
- Angelotti, M.L.; Ronconi, E.; Ballerini, L.; Peired, A.; Mazzinghi, B.; Sagrinati, C.; Parente, E.; Gacci, M.; Carini, M.; Rotondi, M.; et al. Characterization of renal progenitors committed toward tubular lineage and their regenerative potential in renal tubular injury. Stem Cells 2012, 30, 1714–1725. [Google Scholar] [CrossRef]
- Langworthy, M.; Zhou, B.; de Caestecker, M.; Moeckel, G.; Baldwin, H.S. NFATc1 identifies a population of proximal tubule cell progenitors. J. Am. Soc. Nephrol. 2009, 20, 311–321. [Google Scholar] [CrossRef]
- Aggarwal, S.; Grange, C.; Iampietro, C.; Camussi, G.; Bussolati, B. Human CD133(+) Renal Progenitor Cells Induce Erythropoietin Production and Limit Fibrosis After Acute Tubular Injury. Sci. Rep. 2016, 6, 37270. [Google Scholar] [CrossRef]
- Shrestha, S.; Garrett, S.H.; Sens, D.A.; Zhou, X.D.; Guyer, R.; Somji, S. Characterization and determination of cadmium resistance of CD133(+)/CD24(+) and CD133(−)/CD24(+) cells isolated from the immortalized human proximal tubule cell line, RPTEC/TERT1. Toxicol. Appl. Pharmacol. 2019, 375, 5–16. [Google Scholar] [CrossRef]
- Osafune, K. iPSC technology-based regenerative medicine for kidney diseases. Clin. Exp. Nephrol. 2021, 25, 574–584. [Google Scholar] [CrossRef]
- Sarker, D.B.; Xue, Y.; Mahmud, F.; Jocelyn, J.A.; Sang, Q.A. Interconversion of Cancer Cells and Induced Pluripotent Stem Cells. Cells 2024, 13, 125. [Google Scholar] [CrossRef]
- Shrestha, S.; Haque, M.E.; Ighofose, E.; McMahon, M.; Kalyan, G.; Guyer, R.; Kalonick, M.; Kochanowski, J.; Wegner, K.; Somji, S.; et al. Primary and Immortalized Cultures of Human Proximal Tubule Cells Possess Both Progenitor and Non-Progenitor Cells That Can Impact Experimental Results. J. Pers. Med. 2023, 13, 613. [Google Scholar] [CrossRef] [PubMed]
- Shrestha, S.; Singhal, S.; Sens, D.A.; Somji, S.; Davis, B.A.; Guyer, R.; Breen, S.; Kalonick, M.; Garrett, S.H. Elevated glucose represses lysosomal and mTOR-related genes in renal epithelial cells composed of progenitor CD133+ cells. PLoS ONE 2021, 16, e0248241. [Google Scholar] [CrossRef]
- Shrestha, S.; Somji, S.; Sens, D.A.; Slusser-Nore, A.; Patel, D.H.; Savage, E.; Garrett, S.H. Human renal tubular cells contain CD24/CD133 progenitor cell populations: Implications for tubular regeneration after toxicant induced damage using cadmium as a model. Toxicol. Appl. Pharmacol. 2017, 331, 116–129. [Google Scholar] [CrossRef] [PubMed]
- Shrestha, S.; Singhal, S.; Kalonick, M.; Guyer, R.; Volkert, A.; Somji, S.; Garrett, S.H.; Sens, D.A.; Singhal, S.K. Role of HRTPT in kidney proximal epithelial cell regeneration: Integrative differential expression and pathway analyses using microarray and scRNA-seq. J. Cell. Mol. Med. 2021, 25, 10466–10479. [Google Scholar] [CrossRef]
- Lindgren, D.; Bostrom, A.K.; Nilsson, K.; Hansson, J.; Sjolund, J.; Moller, C.; Jirstrom, K.; Nilsson, E.; Landberg, G.; Axelson, H.; et al. Isolation and characterization of progenitor-like cells from human renal proximal tubules. Am. J. Pathol. 2011, 178, 828–837. [Google Scholar] [CrossRef]
- Bussolati, B.; Bruno, S.; Grange, C.; Buttiglieri, S.; Deregibus, M.C.; Cantino, D.; Camussi, G. Isolation of renal progenitor cells from adult human kidney. Am. J. Pathol. 2005, 166, 545–555. [Google Scholar] [CrossRef]
- Wanyan, P.; Wang, X.; Li, N.; Huang, Y.; She, Y.; Zhang, L. Mesenchymal stem cells therapy for acute kidney injury: A systematic review with meta-analysis based on rat model. Front. Pharmacol. 2023, 14, 1099056. [Google Scholar] [CrossRef] [PubMed]
- Fu, Z.; Zhang, Y.; Geng, X.; Chi, K.; Liu, C.; Song, C.; Cai, G.; Chen, X.; Hong, Q. Optimization strategies of mesenchymal stem cell-based therapy for acute kidney injury. Stem Cell Res. Ther. 2023, 14, 116. [Google Scholar] [CrossRef]
- Grange, C.; Tritta, S.; Tapparo, M.; Cedrino, M.; Tetta, C.; Camussi, G.; Brizzi, M.F. Stem cell-derived extracellular vesicles inhibit and revert fibrosis progression in a mouse model of diabetic nephropathy. Sci. Rep. 2019, 9, 4468. [Google Scholar] [CrossRef]
- Abumoawad, A.; Saad, A.; Ferguson, C.M.; Eirin, A.; Herrmann, S.M.; Hickson, L.J.; Goksu, B.B.; Bendel, E.; Misra, S.; Glockner, J.; et al. In a Phase 1a escalating clinical trial, autologous mesenchymal stem cell infusion for renovascular disease increases blood flow and the glomerular filtration rate while reducing inflammatory biomarkers and blood pressure. Kidney Int. 2020, 97, 793–804. [Google Scholar] [CrossRef]
- Xiao, Y.; Zheng, L.; Zou, X.; Wang, J.; Zhong, J.; Zhong, T. Extracellular vesicles in type 2 diabetes mellitus: Key roles in pathogenesis, complications, and therapy. J. Extracell. Vesicles 2019, 8, 1625677. [Google Scholar] [CrossRef] [PubMed]
- Correa, R.R.; Juncosa, E.M.; Masereeuw, R.; Lindoso, R.S. Extracellular Vesicles as a Therapeutic Tool for Kidney Disease: Current Advances and Perspectives. Int. J. Mol. Sci. 2021, 22, 5787. [Google Scholar] [CrossRef]
- Ashcroft, J.; Leighton, P.; Elliott, T.R.; Hosgood, S.A.; Nicholson, M.L.; Kosmoliaptsis, V. Extracellular vesicles in kidney transplantation: A state-of-the-art review. Kidney Int. 2022, 101, 485–497. [Google Scholar] [CrossRef]
- Oh, S.; Kwon, S.H. Extracellular Vesicles in Acute Kidney Injury and Clinical Applications. Int. J. Mol. Sci. 2021, 22, 8913. [Google Scholar] [CrossRef]
- Loor, G.; Schumacker, P.T. Role of hypoxia-inducible factor in cell survival during myocardial ischemia-reperfusion. Cell Death Differ. 2008, 15, 686–690. [Google Scholar] [CrossRef]
- Xu, Z.H.; Wang, C.; He, Y.X.; Mao, X.Y.; Zhang, M.Z.; Hou, Y.P.; Li, B. Hypoxia-inducible factor protects against acute kidney injury via the Wnt/beta-catenin signaling pathway. Am. J. Physiol. Renal Physiol. 2022, 322, F611–F624. [Google Scholar] [CrossRef] [PubMed]
- Bussolati, B.; Moggio, A.; Collino, F.; Aghemo, G.; D’Armento, G.; Grange, C.; Camussi, G. Hypoxia modulates the undifferentiated phenotype of human renal inner medullary CD133+ progenitors through Oct4/miR-145 balance. Am. J. Physiol. Renal Physiol. 2012, 302, F116–F128. [Google Scholar] [CrossRef] [PubMed]
- Tang, J.; Liu, N.; Zhuang, S. Role of epidermal growth factor receptor in acute and chronic kidney injury. Kidney Int. 2013, 83, 804–810. [Google Scholar] [CrossRef]
- Wang, Z.; Chen, J.K.; Wang, S.W.; Moeckel, G.; Harris, R.C. Importance of functional EGF receptors in recovery from acute nephrotoxic injury. J. Am. Soc. Nephrol. 2003, 14, 3147–3154. [Google Scholar] [CrossRef]
- Norman, J.; Tsau, Y.K.; Bacay, A.; Fine, L.G. Epidermal growth factor accelerates functional recovery from ischaemic acute tubular necrosis in the rat: Role of the epidermal growth factor receptor. Clin. Sci. 1990, 78, 445–450. [Google Scholar] [CrossRef]
- Humes, H.D.; Cieslinski, D.A.; Coimbra, T.M.; Messana, J.M.; Galvao, C. Epidermal growth factor enhances renal tubule cell regeneration and repair and accelerates the recovery of renal function in postischemic acute renal failure. J. Clin. Investig. 1989, 84, 1757–1761. [Google Scholar] [CrossRef] [PubMed]
- Chen, J.; Chen, J.K.; Harris, R.C. Deletion of the epidermal growth factor receptor in renal proximal tubule epithelial cells delays recovery from acute kidney injury. Kidney Int. 2012, 82, 45–52. [Google Scholar] [CrossRef]
- Kefaloyianni, E.; Muthu, M.L.; Kaeppler, J.; Sun, X.; Sabbisetti, V.; Chalaris, A.; Rose-John, S.; Wong, E.; Sagi, I.; Waikar, S.S.; et al. ADAM17 substrate release in proximal tubule drives kidney fibrosis. JCI Insight 2016, 1, e87023. [Google Scholar] [CrossRef]
- Zhuang, S.; Liu, N. EGFR signaling in renal fibrosis. Kidney Int. Suppl. 2014, 4, 70–74. [Google Scholar] [CrossRef]
- Cao, S.; Pan, Y.; Terker, A.S.; Arroyo Ornelas, J.P.; Wang, Y.; Tang, J.; Niu, A.; Kar, S.A.; Jiang, M.; Luo, W.; et al. Epidermal growth factor receptor activation is essential for kidney fibrosis development. Nat. Commun. 2023, 14, 7357. [Google Scholar] [CrossRef]
- Harris, R.C. The epidermal growth factor receptor axis and kidney fibrosis. Curr. Opin. Nephrol. Hypertens. 2021, 30, 275–279. [Google Scholar] [CrossRef]
- Melenhorst, W.B.; Mulder, G.M.; Xi, Q.; Hoenderop, J.G.; Kimura, K.; Eguchi, S.; van Goor, H. Epidermal growth factor receptor signaling in the kidney: Key roles in physiology and disease. Hypertension 2008, 52, 987–993. [Google Scholar] [CrossRef] [PubMed]
- Hallman, M.A.; Zhuang, S.; Schnellmann, R.G. Regulation of dedifferentiation and redifferentiation in renal proximal tubular cells by the epidermal growth factor receptor. J. Pharmacol. Exp. Ther. 2008, 325, 520–528. [Google Scholar] [CrossRef] [PubMed]
- Chen, J.; Chen, J.K.; Nagai, K.; Plieth, D.; Tan, M.; Lee, T.C.; Threadgill, D.W.; Neilson, E.G.; Harris, R.C. EGFR signaling promotes TGFbeta-dependent renal fibrosis. J. Am. Soc. Nephrol. 2012, 23, 215–224. [Google Scholar] [CrossRef]
- Stow, L.R.; Jacobs, M.E.; Wingo, C.S.; Cain, B.D. Endothelin-1 gene regulation. FASEB J. 2011, 25, 16–28. [Google Scholar] [CrossRef]
- Hansson, J.; Hultenby, K.; Cramnert, C.; Ponten, F.; Jansson, H.; Lindgren, D.; Axelson, H.; Johansson, M.E. Evidence for a morphologically distinct and functionally robust cell type in the proximal tubules of human kidney. Hum. Pathol. 2014, 45, 382–393. [Google Scholar] [CrossRef] [PubMed]
- Al-Marsoummi, S.; Mehus, A.A.; Shrestha, S.; Rice, R.; Rossow, B.; Somji, S.; Garrett, S.H.; Sens, D.A. Proteasomes Are Critical for Maintenance of CD133+CD24+ Kidney Progenitor Cells. Int. J. Mol. Sci. 2023, 24, 13303. [Google Scholar] [CrossRef] [PubMed]


Disclaimer/Publisher’s Note: The statements, opinions and data contained in all publications are solely those of the individual author(s) and contributor(s) and not of MDPI and/or the editor(s). MDPI and/or the editor(s) disclaim responsibility for any injury to people or property resulting from any ideas, methods, instructions or products referred to in the content. |
© 2025 by the authors. Licensee MDPI, Basel, Switzerland. This article is an open access article distributed under the terms and conditions of the Creative Commons Attribution (CC BY) license (https://creativecommons.org/licenses/by/4.0/).
Share and Cite
Al-Marsoummi, S.; Singhal, S.; Garrett, S.H.; Somji, S.; Sens, D.A.; Singhal, S.K. CD133+CD24+ Renal Tubular Progenitor Cells Drive Hypoxic Injury Recovery via Hypoxia-Inducible Factor-1A and Epidermal Growth Factor Receptor Expression. Int. J. Mol. Sci. 2025, 26, 2472. https://doi.org/10.3390/ijms26062472
Al-Marsoummi S, Singhal S, Garrett SH, Somji S, Sens DA, Singhal SK. CD133+CD24+ Renal Tubular Progenitor Cells Drive Hypoxic Injury Recovery via Hypoxia-Inducible Factor-1A and Epidermal Growth Factor Receptor Expression. International Journal of Molecular Sciences. 2025; 26(6):2472. https://doi.org/10.3390/ijms26062472
Chicago/Turabian StyleAl-Marsoummi, Sarmad, Sonalika Singhal, Scott H. Garrett, Seema Somji, Donald A. Sens, and Sandeep K. Singhal. 2025. "CD133+CD24+ Renal Tubular Progenitor Cells Drive Hypoxic Injury Recovery via Hypoxia-Inducible Factor-1A and Epidermal Growth Factor Receptor Expression" International Journal of Molecular Sciences 26, no. 6: 2472. https://doi.org/10.3390/ijms26062472
APA StyleAl-Marsoummi, S., Singhal, S., Garrett, S. H., Somji, S., Sens, D. A., & Singhal, S. K. (2025). CD133+CD24+ Renal Tubular Progenitor Cells Drive Hypoxic Injury Recovery via Hypoxia-Inducible Factor-1A and Epidermal Growth Factor Receptor Expression. International Journal of Molecular Sciences, 26(6), 2472. https://doi.org/10.3390/ijms26062472