Abstract
Satyrinae, one of the most species-rich groups within the Nymphalidae family, has traditionally relied on morphological characteristics for classification. However, this approach encounters challenges due to issues such as cryptic species and paraphyletic groups. Recent molecular phylogenetic studies have revealed the complex evolutionary history of Satyrinae, leading to the reclassification of the originally polyphyletic Satyrini into multiple independent tribes and confirming the monophyletic status of groups such as Amathusiini. Nevertheless, the phylogenetic relationships and divergence times of certain tribes remain contentious. This study focuses on three species of the Amathusiini tribe (Faunis aerope, Stichophthalma howqua, and Aemona lena), constructing a phylogenetic tree by sequencing the complete mitochondrial genome and integrating 13 protein-coding genes, including COI and ND5. The results indicate that the mitogenome lengths for the three satyrid species are 15,512 bp for Faunis aerope, 13,914 bp for Stichophthalma howqua, and 15,288 bp for Aemona lena. The genetic composition and sequencing of the newly obtained mitogenomes exhibit high conservation and are distinctive to this group of butterflies. Each of the three mitogenomes contains a characteristic collection of 37 genes along with an AT-rich region. Notably, the tRNA genes across these mitogenomes display a conventional cloverleaf configuration; however, the tRNASer stem (AGN) lacks the dihydrouridine (DHU) arm. The three species exhibit varying lengths of AT-rich regions, resulting in differences in their mitochondrial genome sizes. Finally, the phylogenetic analysis supports the relationships among the four tribes of Satyrinae as: (Satyrini + (Amathusiini + Elymniini)) + Melanitini.
1. Introduction
Satyrinae is the most diverse group of butterflies within the family Nymphalidae (Lepidoptera), comprising approximately 400 genera and 3000 species. This subfamily is found on all continents except Antarctica [1]. Traditionally, Satyrinae is divided into nine tribes and 16 subtribes [2,3]. However, the higher-level classification within this family remains a subject of controversy [2]. Amathusiini, previously classified under Amathusiidae, has been reassessed based on modern research indicating a closer evolutionary relationship with the satyrid lineage [4]. Currently, Amathusiini is recognized as a tribe within Satyrinae. Nonetheless, not all species of Amathusiini are classified within Satyrinae; for instance, Hyantis and Morphopsis are categorized under Elymniini. Given the complex nature of these relationships, it is essential to utilize mitochondrial genome (mitogenome) sequences for taxonomic and phylogenetic investigations.
The mitochondrial genome of insects is a circular DNA structure, generally measuring between 15,000 and 18,000 base pairs long. It consists of thirty-seven genes, which include thirteen that code for proteins, twenty-two tRNA genes, and two rRNA genes [5]. This genome is essential for evolutionary studies of insects at a systematic level, as its considerable variability and maternal inheritance render it an excellent marker for investigating population genetics and evolutionary connections [5]. In addition, the structural and sequence features of the insect mitochondrial genome provide valuable information regarding mitochondrial functions and adaptive evolution [6,7,8,9,10,11].
In this research, we obtained three new sequences from the Amathusiini tribe. To enhance our understanding of the functions of associated genes, we analyzed the relative synonymous codon usage (RSCU) as well as the AT skew values of protein-coding genes (PCGs), making comparisons with sequences from other Lepidopteran species. Moreover, we constructed a phylogenetic tree for Satyrinae and related groups, investigating the relationships among these taxa. Furthermore, we evaluated the divergence times of three species within the Amathusiini tribe.
2. Results
2.1. Mitochondrial Genome Assembly and Annotation
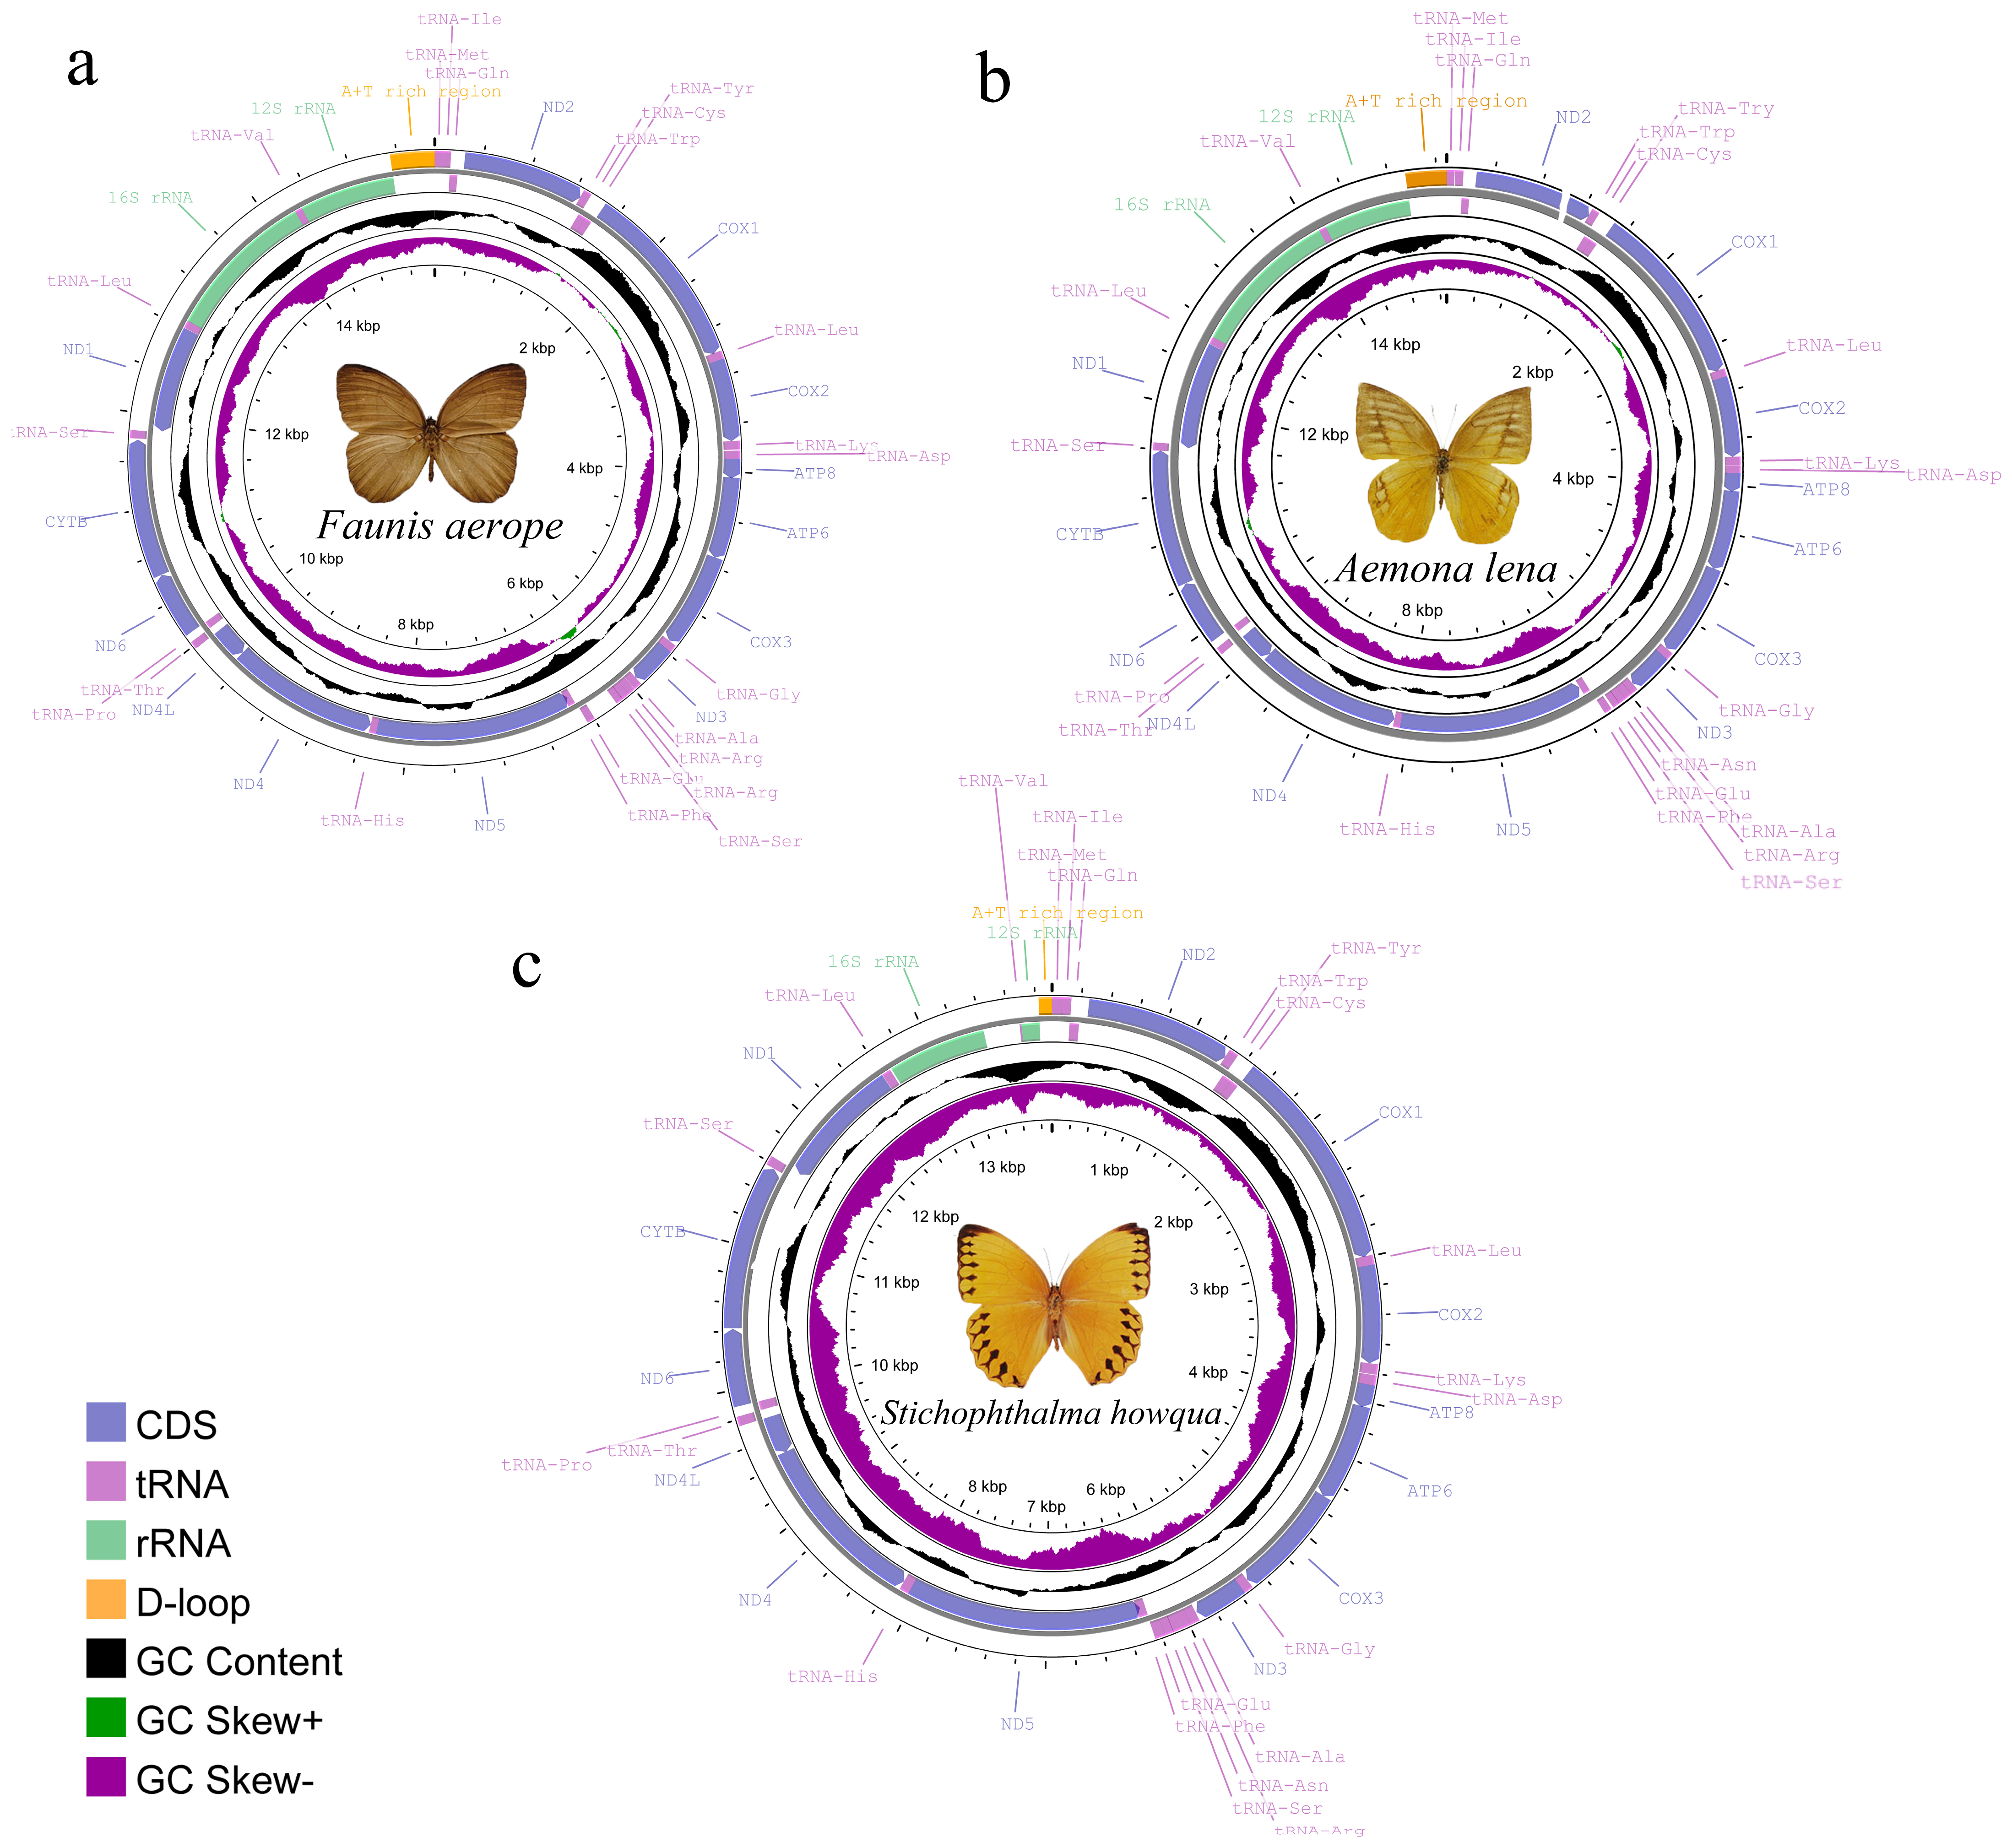
The complete mitogenomes of Faunis aerope, Stichophthalma howqua, and Aemona lena were determined to be 15,512 bp, 13,914 bp, and 15,288 bp in length, respectively. Each genome comprises thirteen protein-coding genes (PCGs), twenty-two tRNA genes, and two rRNA genes, along with an AT rich region (see Figure 1, Table S1). Among the 42 currently published Satyrinae genomes, the mitogenome of Faunis aerope is noted as the largest, while Stichophthalma howqua also ranks similarly in size. The size of Aemona lena’s mitogenome falls within the spectrum of the 42 Satyrinae genomes, ranging from 15,122 bp for Melanitis leda to the 15,512 bp of Faunis aerope (refer to Table S2). Of the thirty-seven genes encoded by the mitochondrial genome, fourteen are identified as being encoded by the N-strand (the minority strand), which encompasses four PCGs, eight tRNA genes, and two rRNA genes; the remaining twenty-three genes are attributed to the J-strand. Additionally, the AT-rich region was observed to be located between the rrnS and tRNAMet genes.
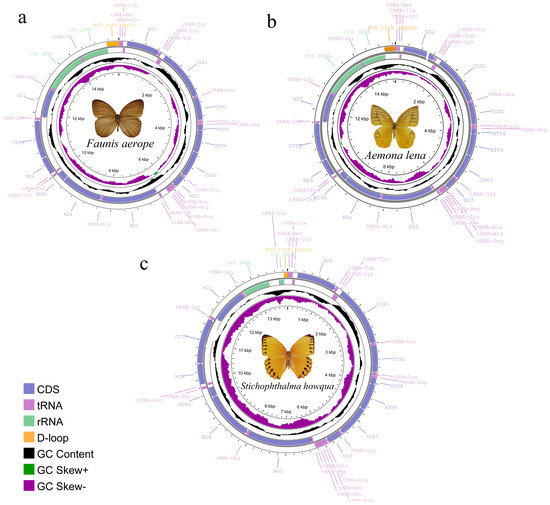
Figure 1.
Mitochondrial gene map of three satyrid. (a) Faunis aerope, (b) Aemona lena, and (c) Stichophthalma howqua.
The A + T content in the mitogenomes of the three satyrid species was 80%, 80%, and 77.9%, respectively, indicating a strong bias toward adenine and thymine over guanine and cytosine. This observation highlights a significant A + T bias within these genomes, as evidenced by the comparison with the G + C content (see Table S2 for detailed data). Moreover, when examining the AT content across various gene components, a consistent decreasing trend emerges. Specifically, the AT-rich region exhibits the highest content, followed by ribosomal RNA (rRNA), transfer RNA (tRNA), and protein-coding genes (PCGs), in that order. In terms of AT skew, the values recorded for the three mitogenomes were −0.050, −0.025, and −0.024, respectively. These negative AT skew values across the PCGs and the first through third codons further corroborate the observation that thymine is more abundant than adenine in these regions. The AT skew metrics for all three mitogenomes are consistent with the broader range found in other Satyrinae species, where values span from −0.055 in Neope muirheadii to −0.017 in Hipparchia autonoe, as presented in Table S2. These findings suggest a characteristic genetic feature shared among satyrid mitogenomes, emphasizing a notable trend in nucleotide composition.
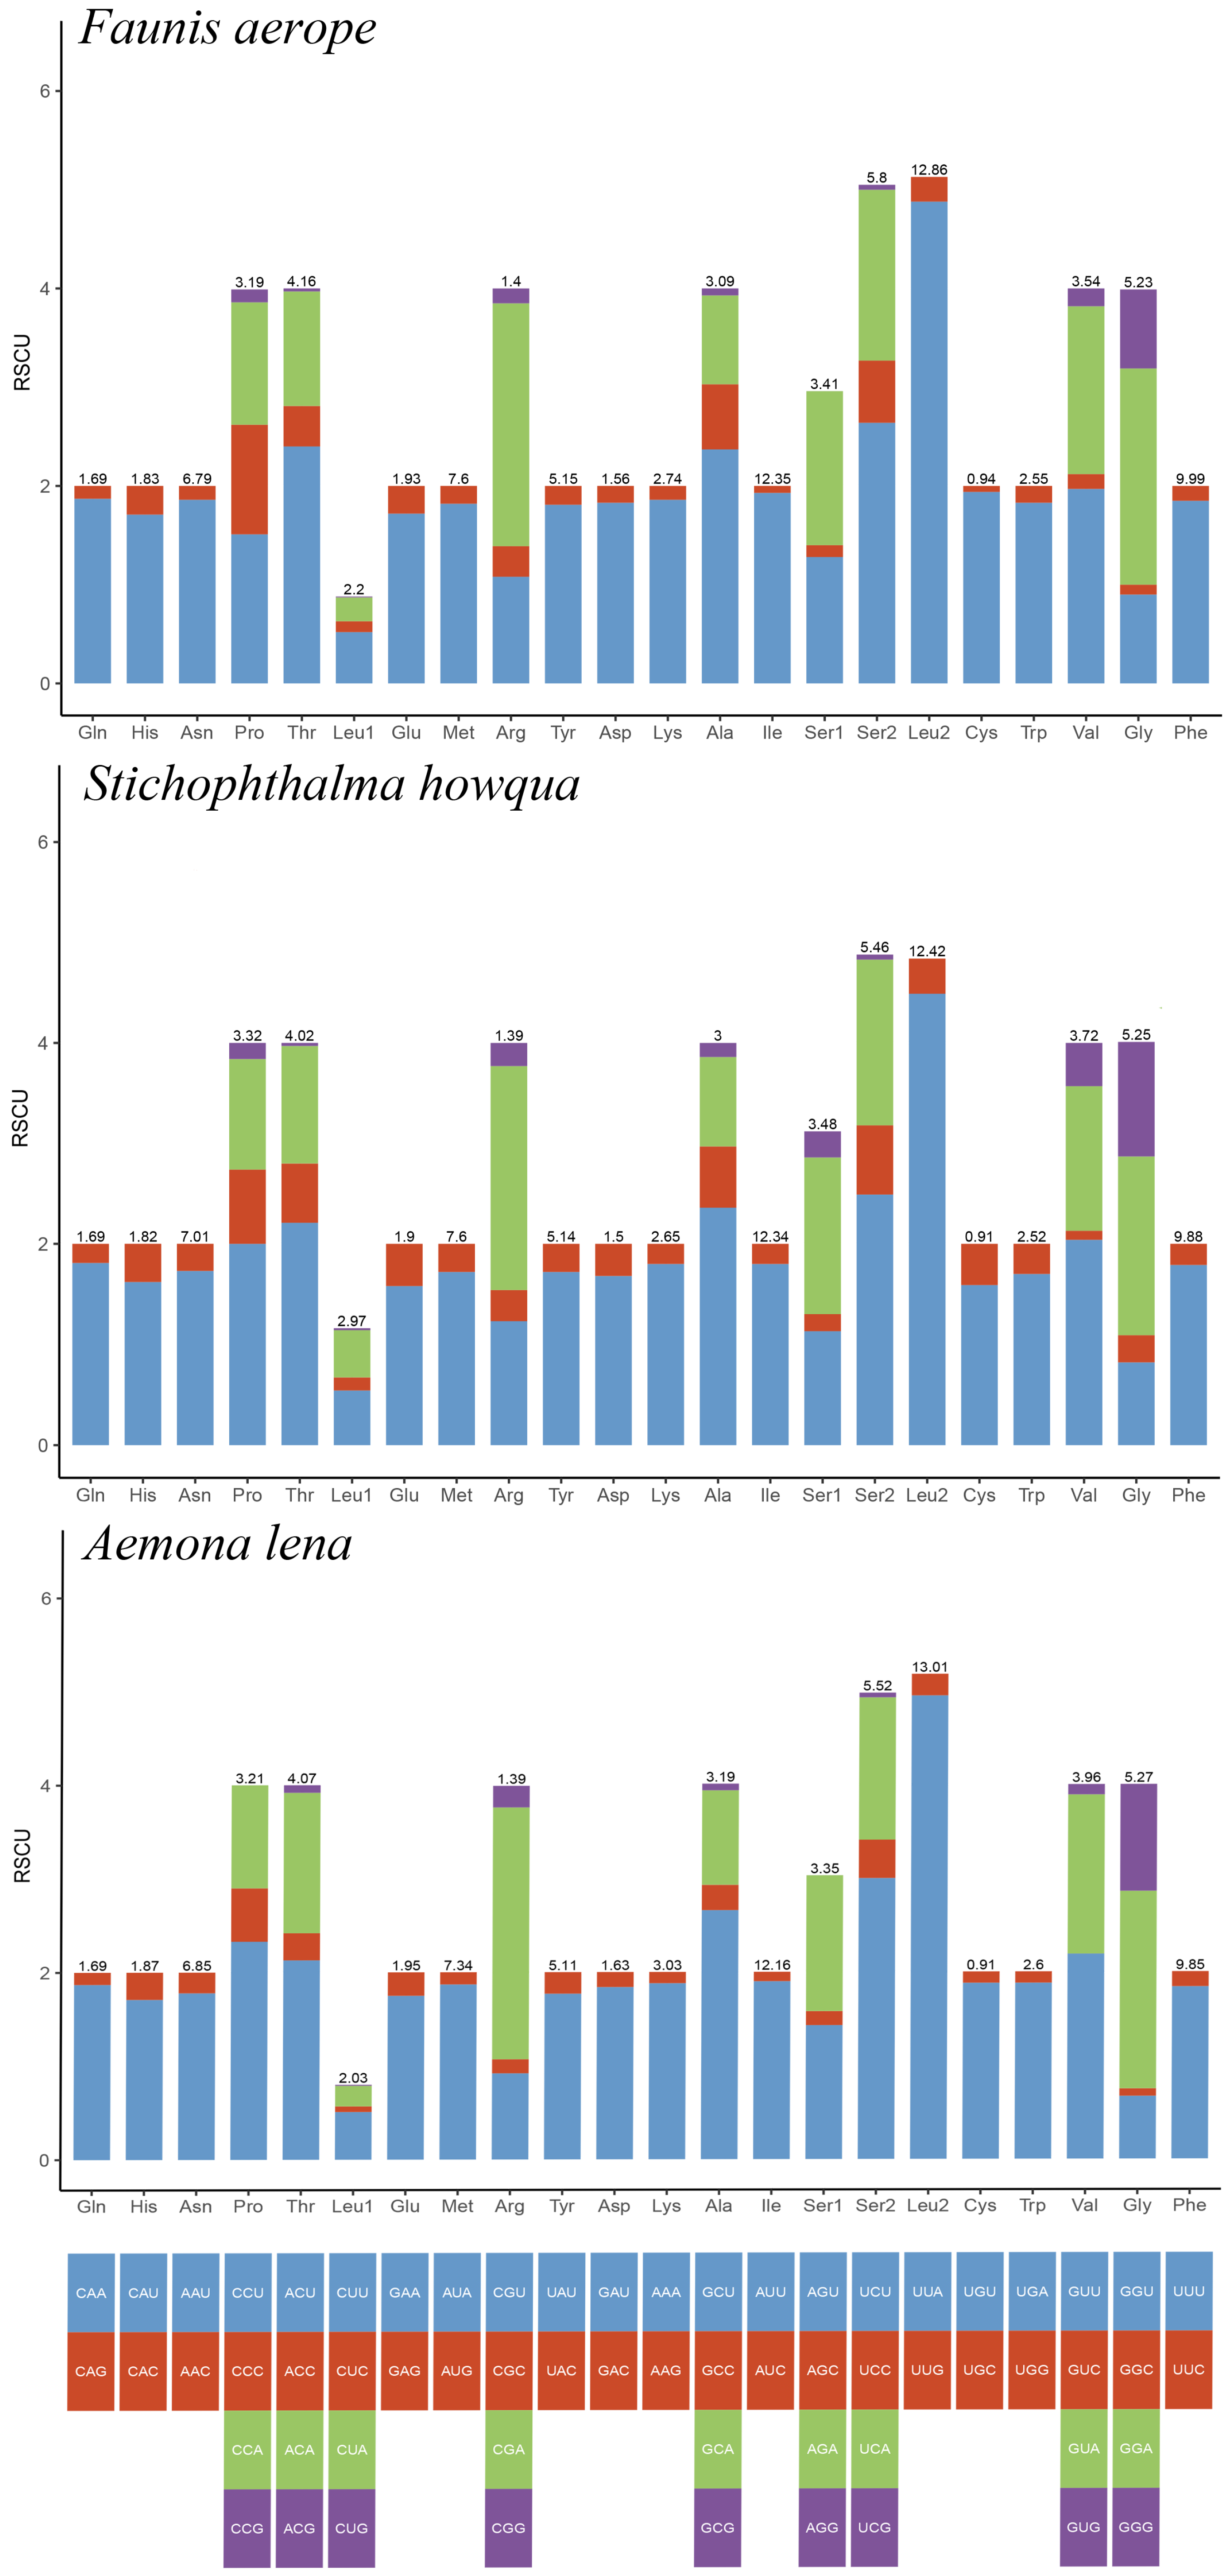
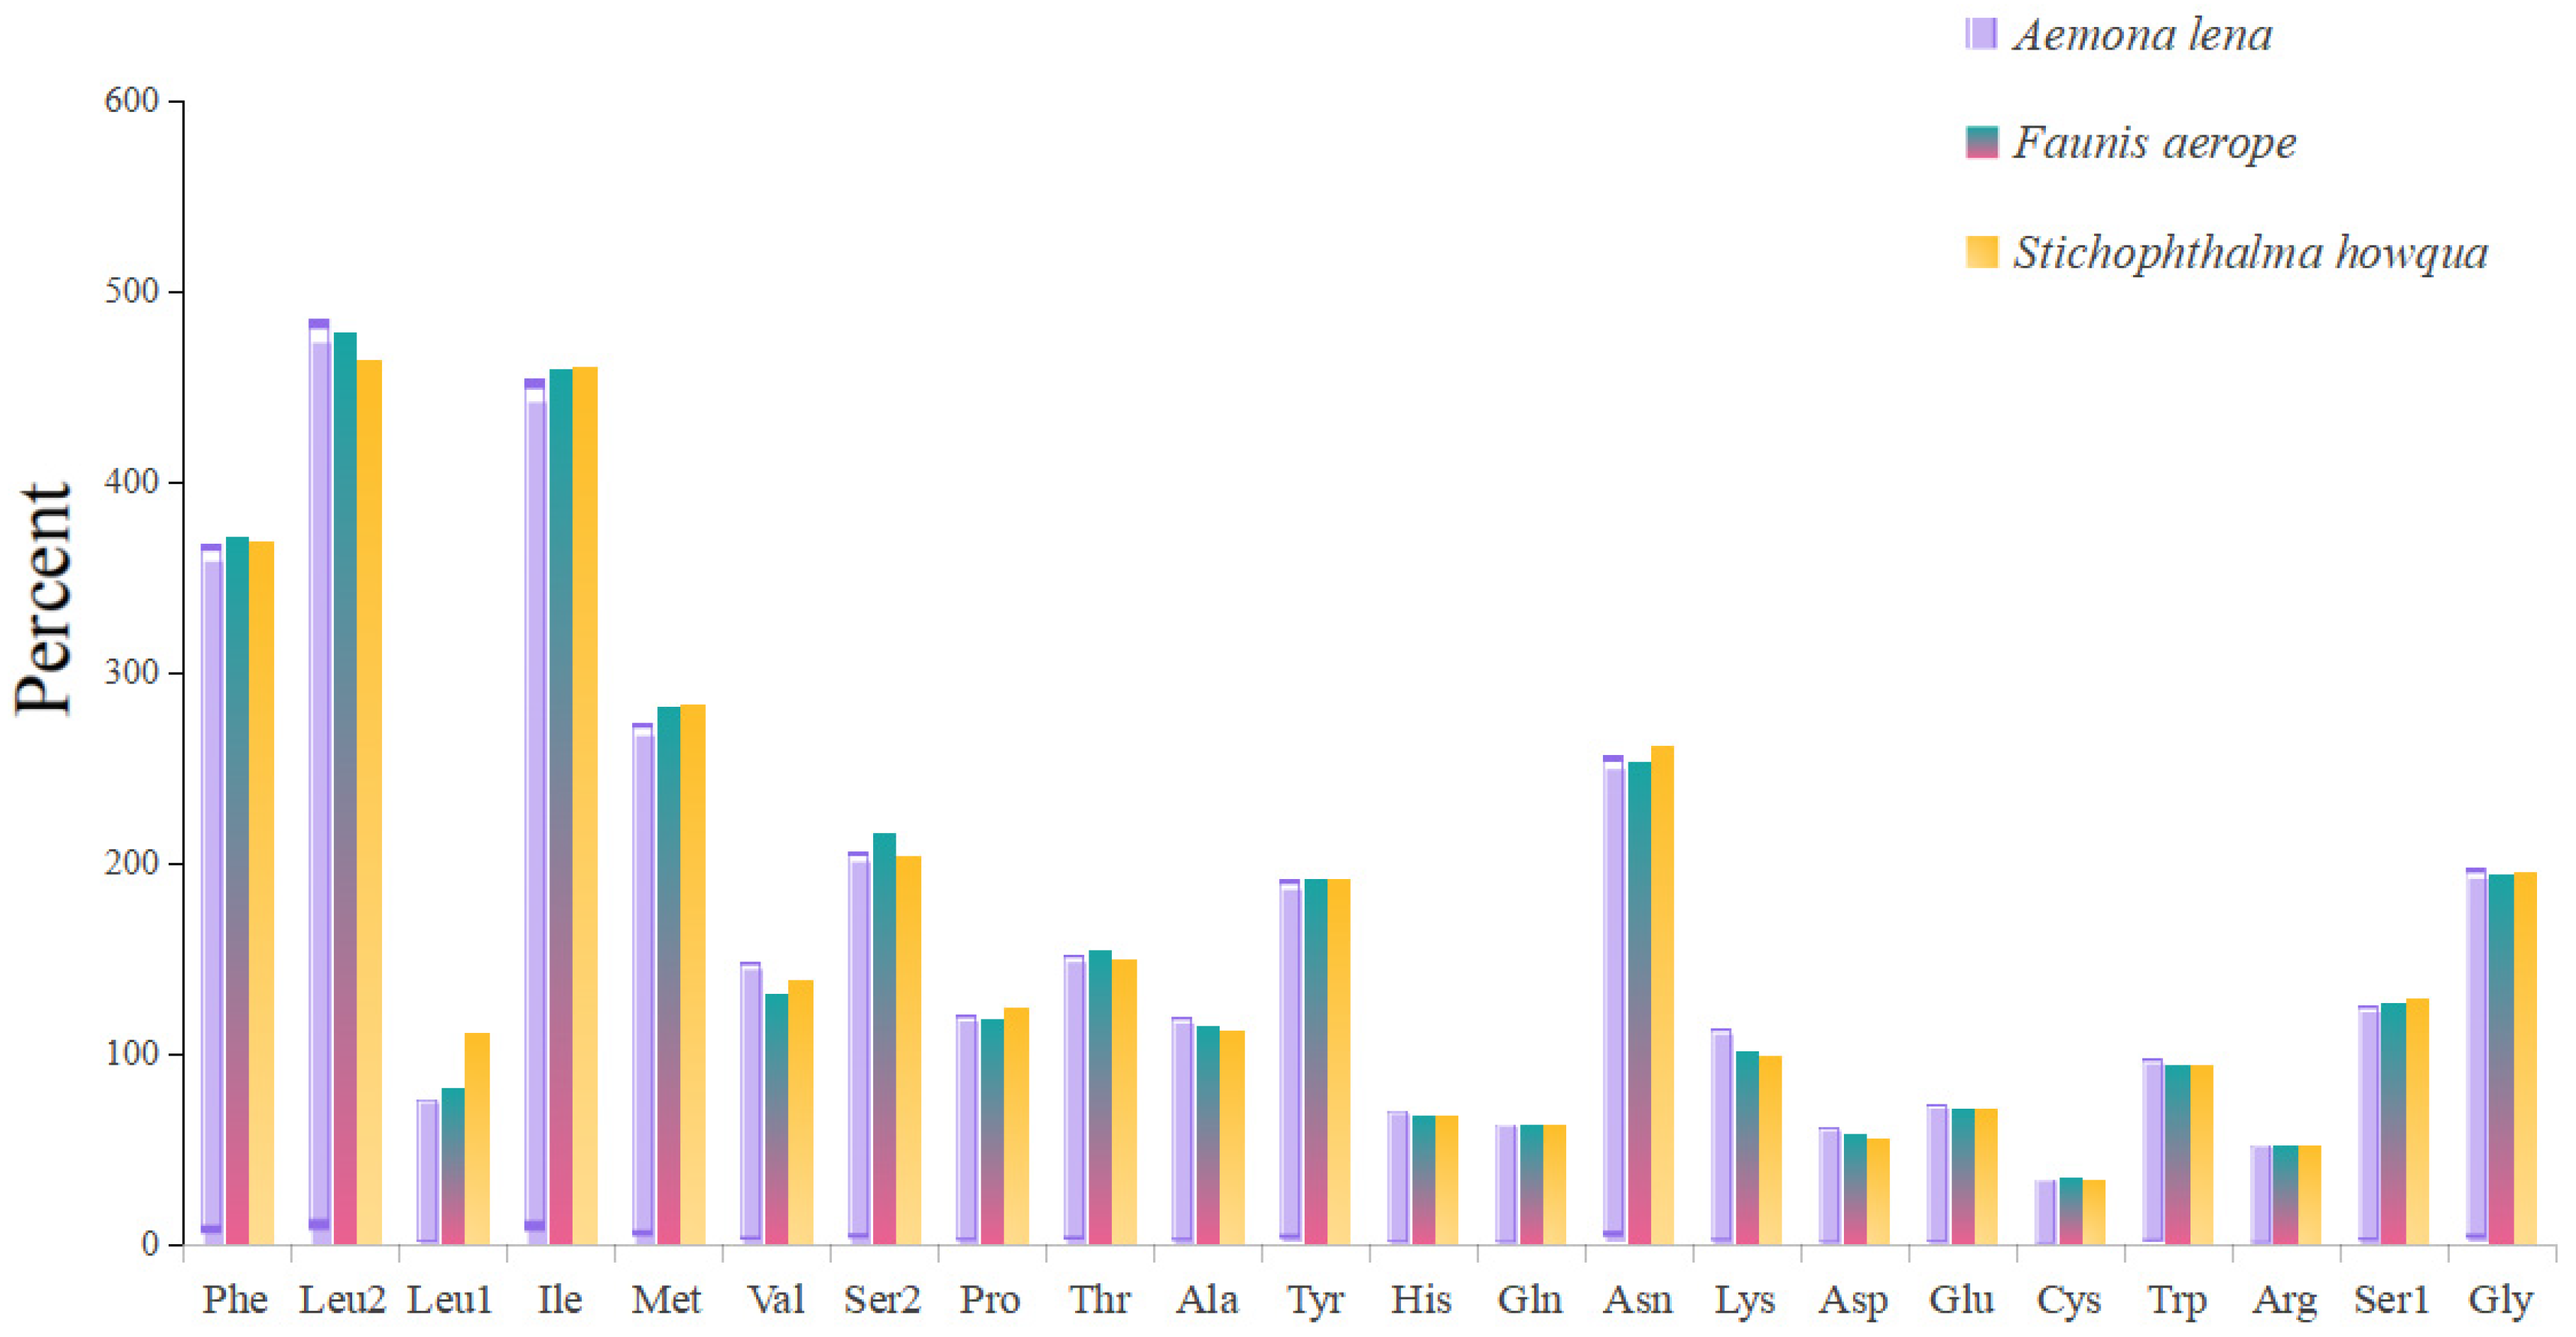
The lengths of the 13 protein-coding genes (PCGs) in Faunis aerope, Stichophthalma howqua, and Aemona lena were found to be 11,210 bp, 11,170 bp, and 11,246 bp, respectively. The mitochondrial genomes of these species encode 3736, 3722, and 3748 amino acids (excluding stop codons). This amino acid count falls within the range observed in other Lepidoptera species, aligning closely with counts from 3691 in Mycalesis intermedia to 3748 in Aemona lena (see Table S2). Figure 2 displays the relative values for codon usage. Notably, AUU (isoleucine; Ile), UUU (phenylalanine; Phe), and UUA (leucine; Leu) were identified as the most commonly utilized codons across the three mitogenomes (Figure 3).
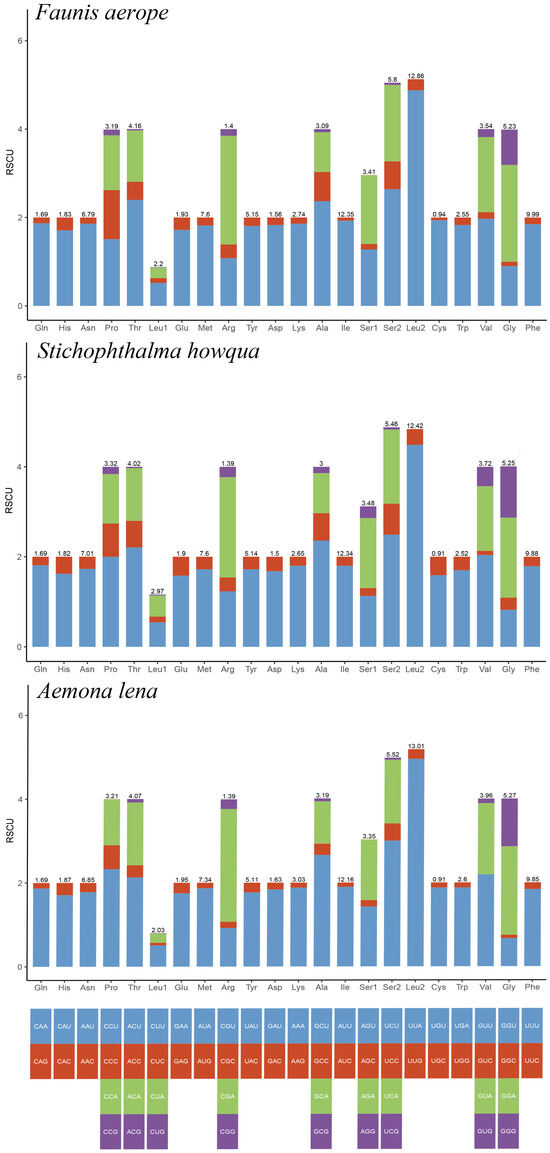
Figure 2.
RSCU of Faunis aerope, Stichophthalma howqua, and Aemona lena mitogenome. The bar length represents the accumulated scores of all codons for each amino acid (AA). The numbers on each bar represent the AA ratios of all amino acids in the mitochondral genome.
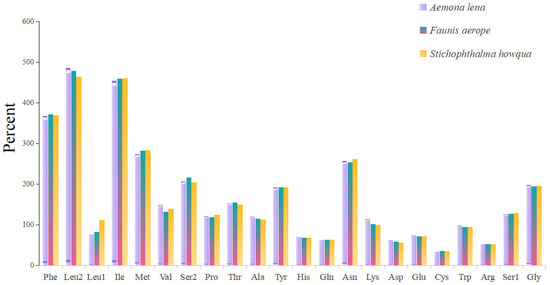
Figure 3.
Amino acid composition of protein-coding genes in mitochondrial genome.
A total of twenty-two standard tRNA genes were discovered in the mitogenomes of three Amathusiini species, with lengths varying between 60 to 72 bp. All identified tRNAs were able to adopt a standard clover-leaf configuration, with the exception of tRNASer (AGN), where the dihydrouridine (DHU) arm instead created a loop. The shortened DHU stem observable in tRNASer (AGN) is often observed in the mitogenomes of various other insects, including all currently accessible mitogenomes of Satyrinae.
In line with other mitogenomes belonging to the Satyrinae subfamily, the mitogenomes of the three examined species displayed the presence of two ribosomal RNA genes (rrnL and rrnS). These genes were situated between tRNALeu (CUN) and tRNAVal, as well as between tRNAVal and the AT rich region, respectively. The length of the rrnL gene was measured at 1356 bp for Faunis aerope, 983 bp for Stichophthalma howqua, and 1392 bp for Aemona lena. The AT content of the rrnL genes was recorded as 83.8% for Faunis aerope, 84.8% for Stichophthalma howqua, and 81.4% for Aemona lena. The rrnS gene exhibited lengths of 849 bp in Faunis aerope, 179 bp in Stichophthalma howqua, and 803 bp in Aemona lena, with the corresponding AT contents being 84.4%, 92.1%, and 85.8%, respectively. These findings were consistent with those reported for other Satyrinae mitogenomes (Table 1 and Table S2).

Table 1.
Nucleotide composition of Faunis aerope (Fa), Aemona lena (Ae), and Stichophthalma howqua (St).
2.2. Phylogenetic Analyses
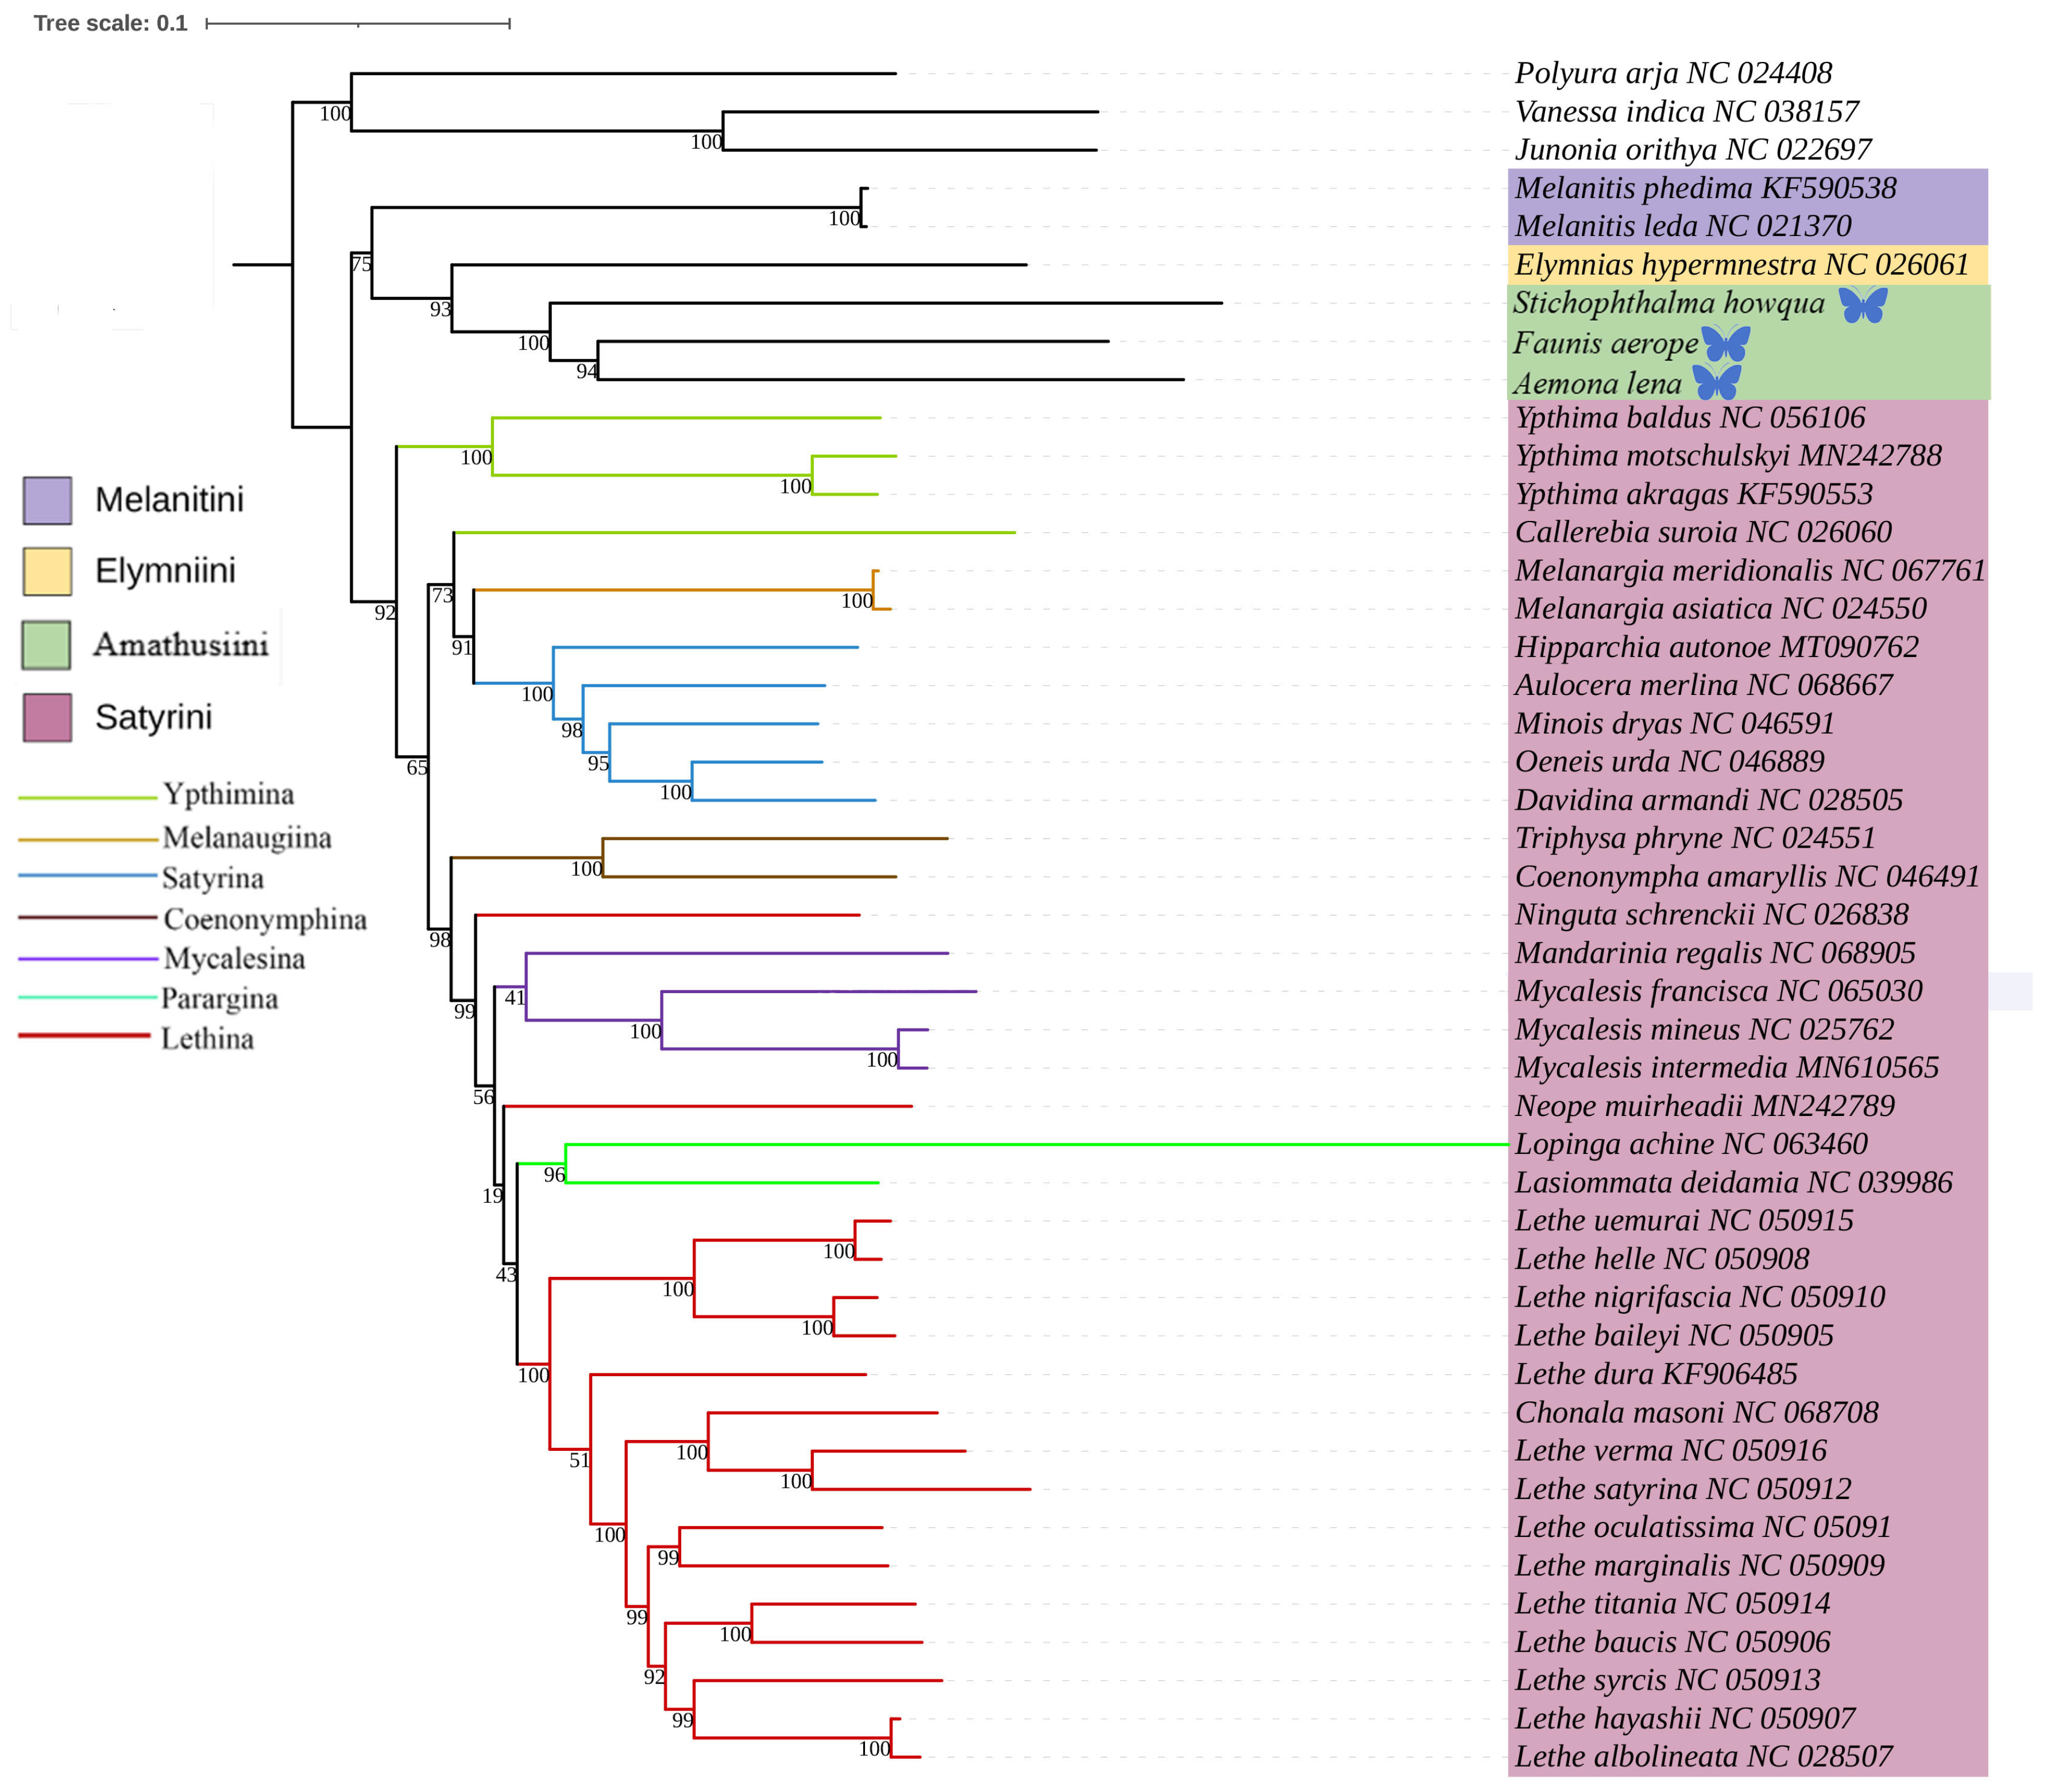
This study was based on the aforementioned three newly acquired species of Satyrinae, combined with the known complete mitochondrial genome sequences of 42 other Satyrinae species, whereas the mitogenomes of Nymphalidae (Junonia orithya, Polyura arja, and Vanessa indica) were used as outgroups to reconstruct the phylogenetic relationships of the Satyrinae (see Figure 4 and Figure 5). Both maximum likelihood (ML) and Bayesian inference (BI) methodologies produced consistent topologies concerning relationships at the tribal level. The monophyly of Satyrini received strong support in both ML and BI evaluations.
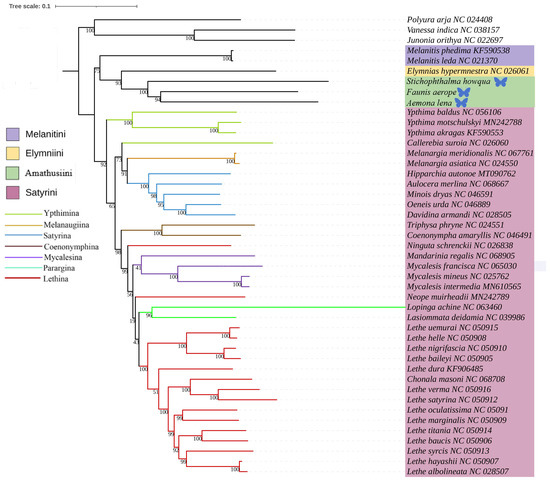
Figure 4.
Phylogenetic tree inferred using ML based on nucleotide sequences of thirteen PCG genes and two rRNA genes. Bootstrap supports values expressed in branches. In the phylogenetic tree, species newly sequenced in this study are marked with butterfly-shaped symbols (Stichophthalma howana, Faunis aerope, Aemona lena), while sequence data for all other species were obtained from the NCBI GenBank database.
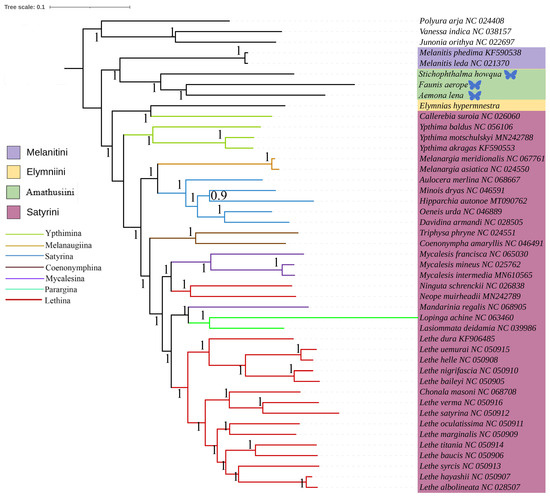
Figure 5.
Phylogenetic tree inferred using BI based on nucleotide sequences of thirteen PCG genes and yep rRNA genes. Posterior probabilities are indicated on branches. In the phylogenetic tree, species newly sequenced in this study are marked with butterfly-shaped symbols (Stichophthalma howana, Faunis aerope, Aemona lena), while sequence data for all other species were obtained from the NCBI GenBank database.
The phylogenetic relationships among the four tribes of Satyrinae were found to be consistent and are arranged as follows: (Satyrini + (Amathusiini + Elymniini)) + Melanitini. Within the Satyrini, the seven subtribes identified through maximum likelihood (ML) and Bayesian inference (BI) analyses exhibited high similarity, although some differences were noted. The seven subtribes of Satyrini are organized into three branches: Ypthimina is positioned alone, while Melanaugiina and Satyrina are grouped together, and Coenonymphina, Mycalesina, Parargina, and Lethina form a separate cluster. At the gene level, Lasiommata and Lopinga were found to cluster into a single group, subsequently becoming sister taxa to Lethe.
2.3. Divergence Time Estimation of Satyrinae Species
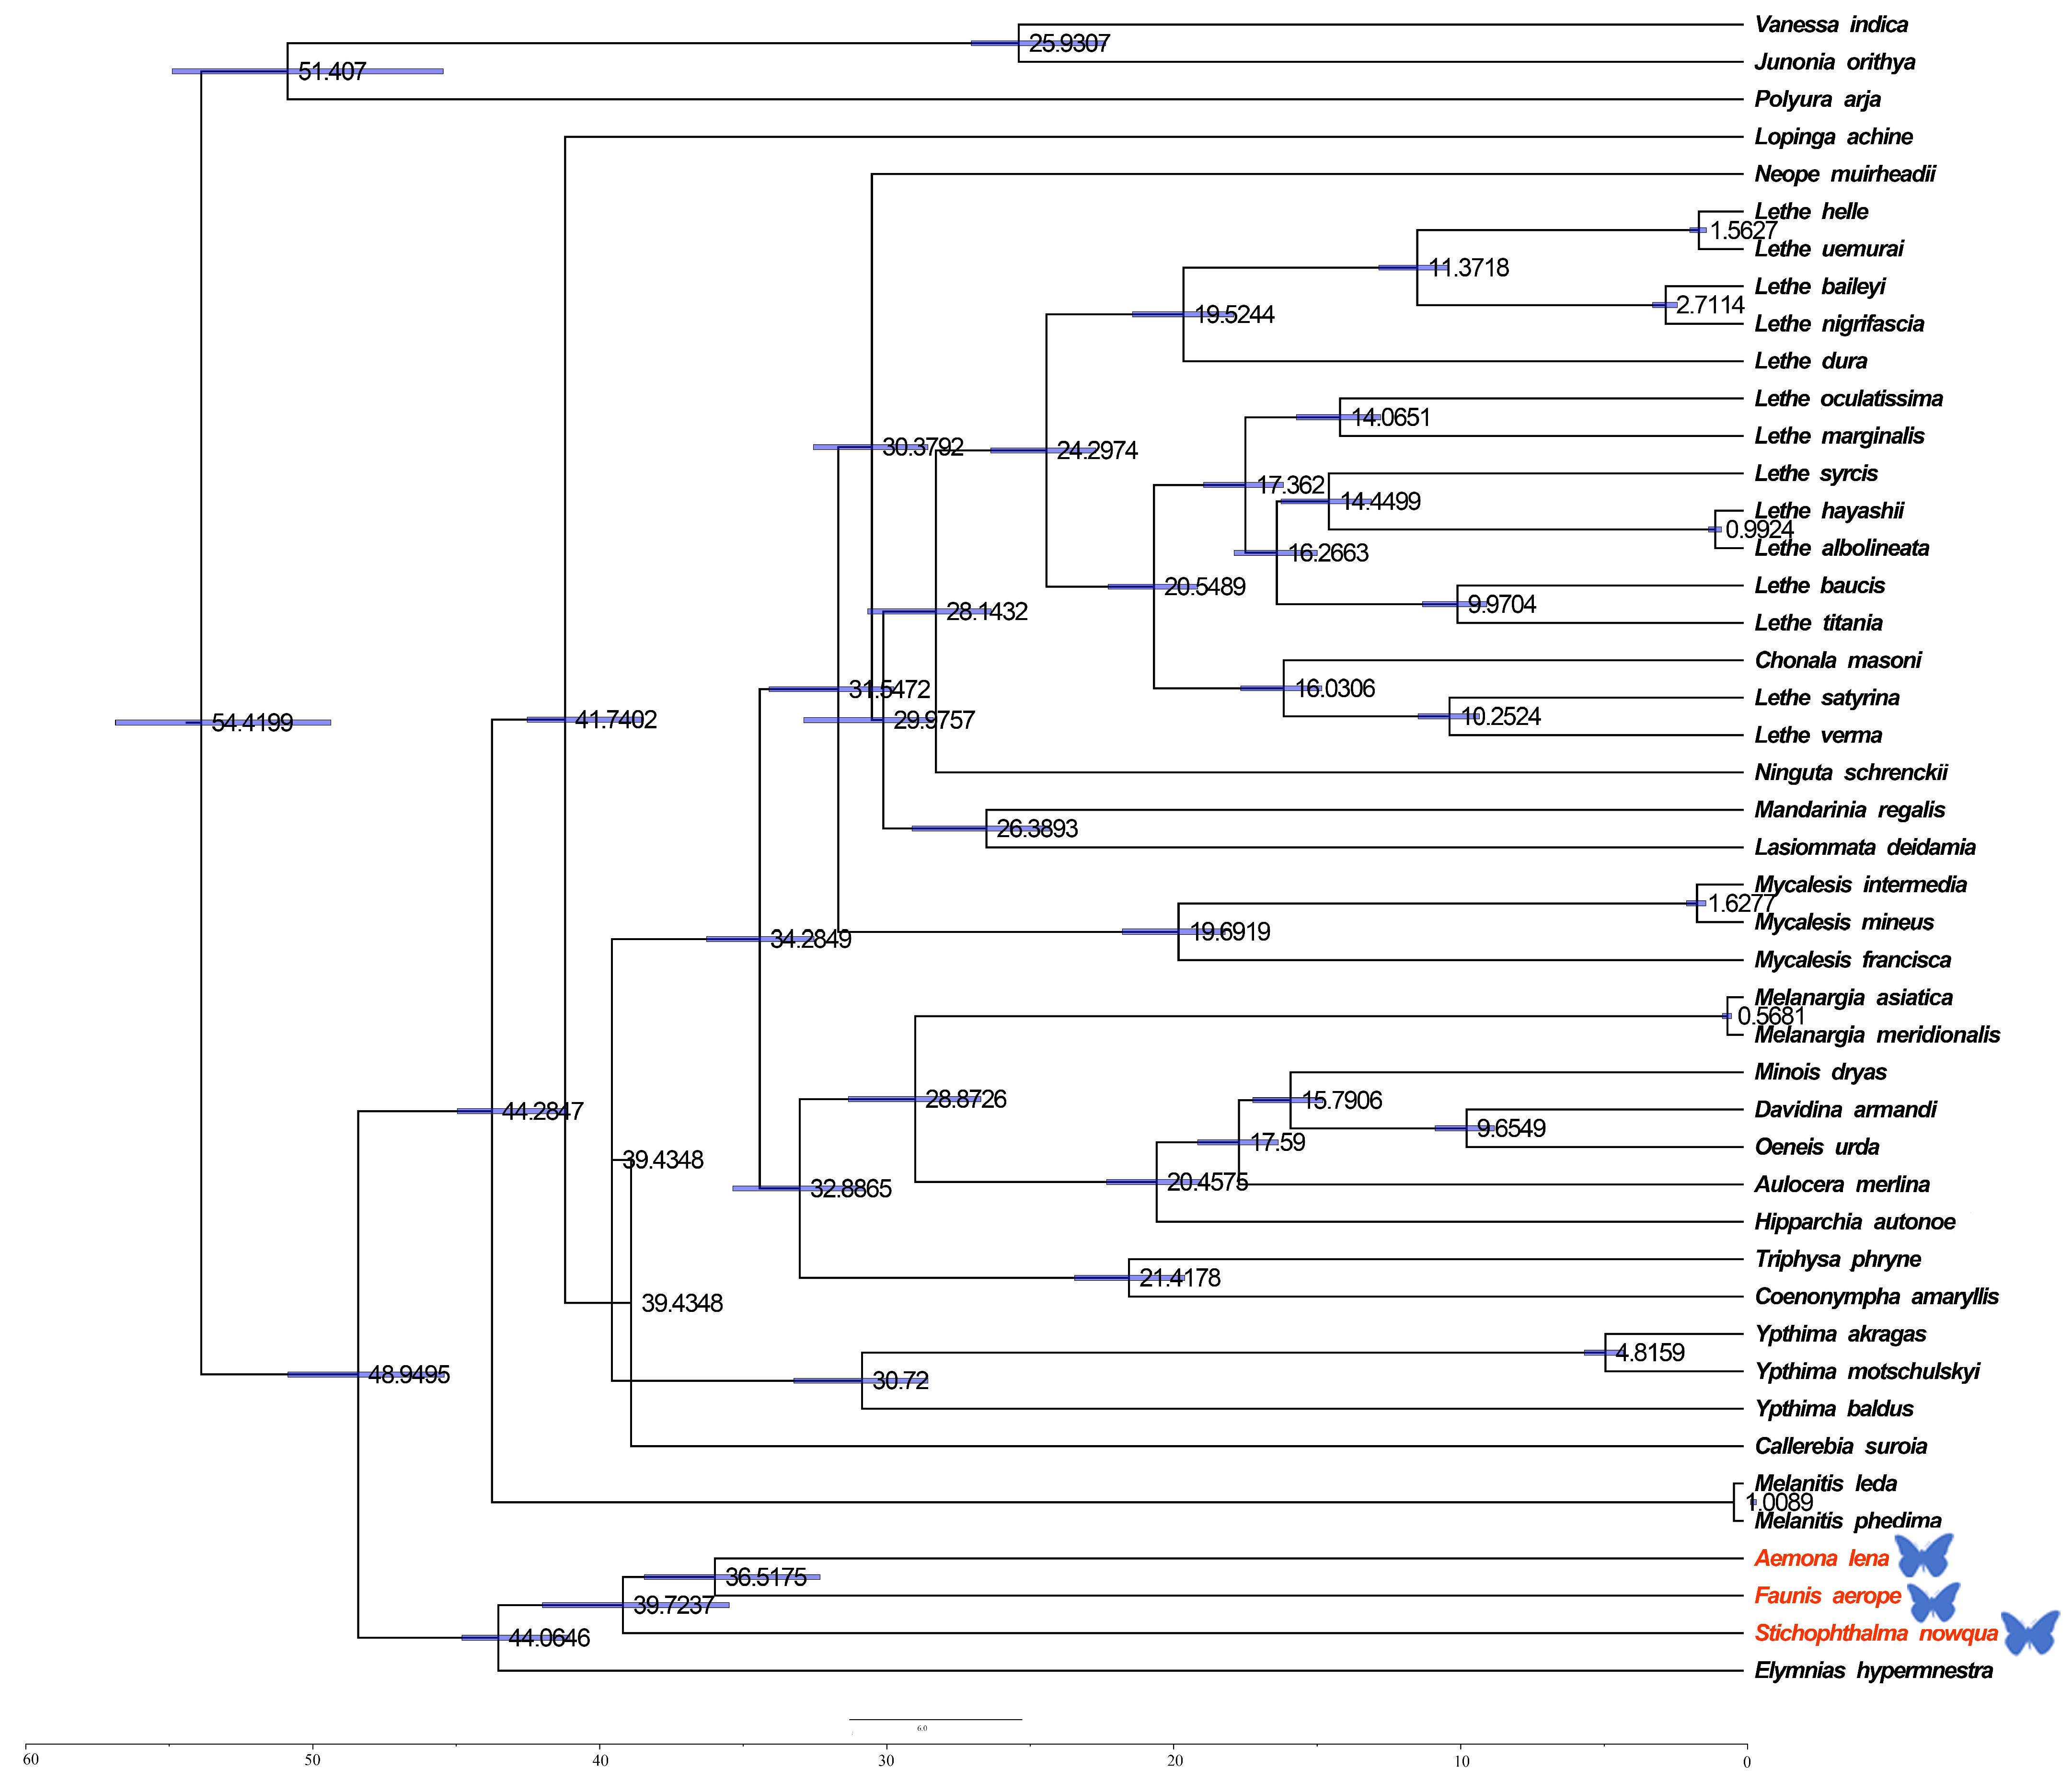
The estimation of divergence times among Satyrinae was carried out via a Bayesian method applied within BEAST (see Figure 6). The divergence of Satyrinae is dated to the end of the Paleocene in the Paleogene, approximately 48.9495 million years ago (Mya), after which it diverged into two primary branches. One of these clades includes Melanitini, Elymniini, and Amathusiini, with a total divergence time occurring in the Eocene of the Paleogene, approximately 44.0646 Mya. The divergence of Melanitini is estimated to have occurred during the Middle Miocene of the Neogene, around 1.0089 Mya, while the origin of Amathusiini is dated to the Eocene of the Paleogene, approximately 39.7237 Mya. The second major branch, Satyrini, is estimated to have differentiated during the Oligocene of the Paleogene, around 44.2847 Mya.
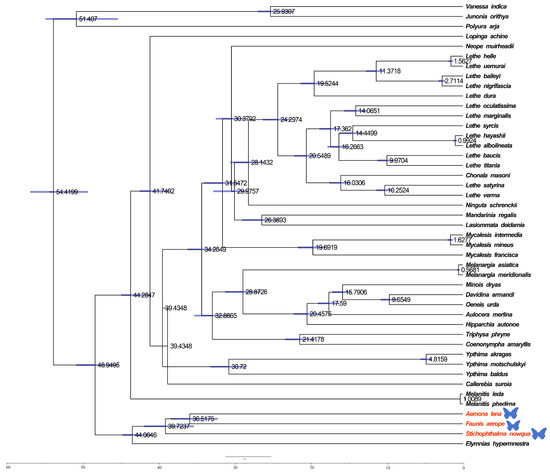
Figure 6.
Divergence times for Satyrinae: the maximum clade credibility tree featuring the median age and a 95% confidence interval was estimated through a Bayesian uncorrelated relaxed clock as implemented in BEAST. In the phylogenetic tree, species newly sequenced in this study are marked with butterfly-shaped symbols (Stichophthalma howana, Faunis aerope, Aemona lena).
The results of this study indicate that the Satyrinae subfamily originated at the end of the Paleocene in the Palaeoproterozoic era, followed by the differentiation of various tribes. This group rapidly spread and diversified during the Oligocene epoch, a process significantly influenced by the geological changes and climate variations of that period. The climate of the Paleogene period (66–23 Mya) exhibited a general trend from warm to cold conditions. Early temperatures fluctuated slightly and rose, peaking in the early Eocene epoch (53–33.7 Mya), before transitioning to a cooling phase in the late Eocene epoch. During the middle and late Paleogene, temperatures declined primarily due to an increase in global ice volume, a decrease in sea level, the expansion of grasslands, and the reduction of vegetation coverage, including the area occupied by tropical broad-leaved forests. The findings of this study suggest that the differentiation of the Satyrinae subfamily, as well as the variations within it, were closely associated with geological events and the distribution of host plants during that time.
2.4. Mitogenomic Gene Rearrangements
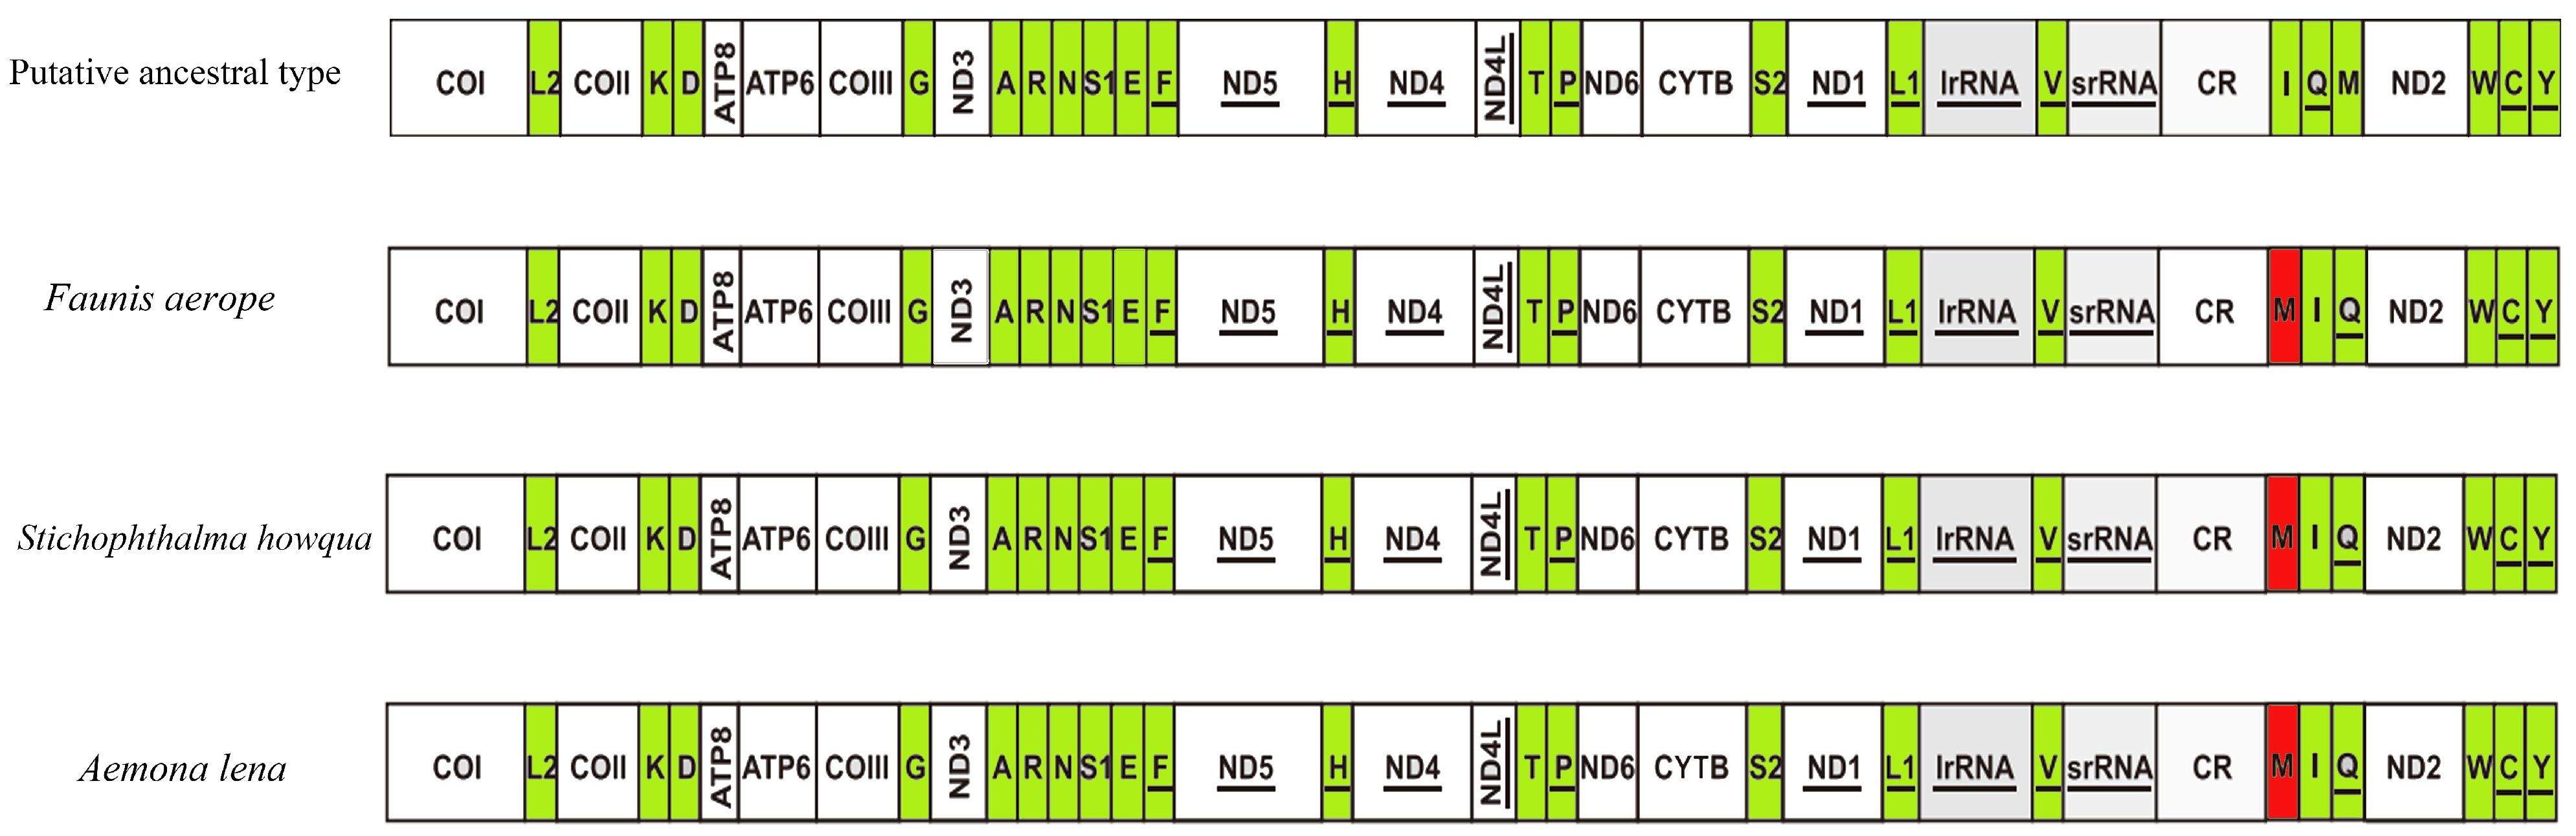
The first hexapod to have its mitochondrial genome sequenced was the fruit fly, which exhibits a mitochondrial genome arrangement of trnI-trnQ-trnM. This arrangement is considered the hypothetical ancestral mitochondrial gene arrangement for insects. In the present study, the mitochondrial gene arrangements of the three species of Satyrinae butterflies were found to be trnM-trnI-trnQ, aligning with the gene arrangements observed in other sequenced Satyrinae butterflies (see Figure 7).
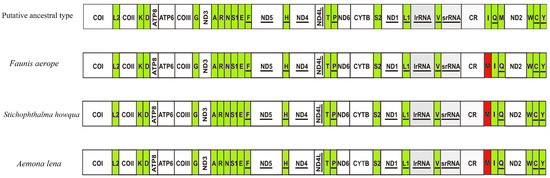
Figure 7.
Gene arrangements of Faunis aerope, Aemona lena, and Stichophthalma howqua mitochondrial genomes. The mitochondrial genome is color-coded as follows: white corresponds to protein-coding regions, green designates tRNA genes, and red marks structural rearrangement sites.
3. Discussion
3.1. Three Satyrid Mitochondrial Genome Structure
The mitochondrial genomes of the three Satyrid species are all typical circular double-stranded structures, with genes highly conserved in terms of length, arrangement order, and nucleotide composition. Among the tRNA secondary structures, except for tRNASer (AGN), which lacks the dihydroureoside (DHU) arm and forms a simple loop. The tRNAs form cloverleaf shaped secondary structures, which is consistent with what is seen in other lepidopteran insects. The tRNASer (AGN) lacking the DHU arm is a common feature in Lepidoptera mitogenomes [6,7], and this phenomenon has also been found in studies of other insect mitochondrial genomes [8,11]. Mismatches may simply arise from aberrant pairings or be corrected during RNA editing, and it has also been suggested that this particular class of mismatches may increase the efficiency of tRNA work.
In the three Satyrid mitochondrial genomes, a non-standard start codon CGA and a few hexameric start codons were found; the phenomenon of non-standard start codon CGA occurs in the COX1 of most butterflies [9], and not only insects, but the specificity of the mitochondrial genome’s COX1 start codon is prevalent across species of the phylum Arthropoda [10], making COX1 the most variable gene in the arthropod mitochondrial genome; a few hexameric start codons also occur in other butterflies. With the exception of a few genes, the most common termination codon for the three species of satyrid in this study was TAA, while COX2 and ND4 terminated with a single nucleotide, T. In many insects, single nucleotide T as a termination codon is often present in their mitochondrial genomes [11], and during transcription, these single nucleotide termination codons can be used to form a complete termination codon by adding the polyadenylate poly-A at the end again, thus ending the transcription process.
3.2. Phylogenetic Analysis of Satyrinae
Among the four tribes of Satyrinae, Satyrini is distinguished by a long branch, consistent with the findings of Peña (2006) [1]. However, the phylogenetic relationships of the remaining three tribes were slightly different from the results derived from previous studies. The phylogenetic relationships in this study consistently resolved their relationship as (Elymniini + Amathusiini) + Melanitini, whereas in other studies, it resolved as (Elymniini + Melanitini) + Amathusiini (ML and BI trees, Wahlberg, 2009) [3]; Elymniini + Melanitini + Amathusiini (MP tree, Wahlberg, 2009) [3]; Melanitini + (Elymniini + Amathusiini) (BI tree, Peña, 2008) [4].
The Satyrinae subfamily comprises various clades, including Elymniini, Amathusiini, Zetherini, Melanitini, and Satyrini [2]. This research reports the determination of three new mitochondrial genomes belonging to Satyrinae, thereby enhancing the total number of available published mitogenomes for this subfamily. Prior investigations have confirmed the close phylogenetic relationships among the Elymniini, Amathusiini, Melanitini, and Satyrini groups, findings that align with our results [4]. However, the subclades within Satyrini exhibited instability across different analyses, indicating the necessity for further molecular sampling and the incorporation of additional genetic markers to establish a more robust phylogenetic relationship for the subfamily.
3.3. Mitogenomic Gene Rearrangements in Satyrinae
This study describes a unique rearrangement of the trnM-trnI-trnQ genes in the mitochondrial genomes of the Satyrinae subfamily, which is distinctly different from the arrangement observed in other Hexapoda (trnI-trnQ-trnM). Specifically, trnM has been translocated to a position 5′-upstream of trnI, resulting in the gene order M-I-Q. This rearrangement pattern is highly conserved among three Amathusiini species: Faunis aerope, Stichophthalma howqua, and Aemona lena, and is prevalent in other tribes within Satyrinae [12,13,14,15]. Despite the altered gene order, the tRNAs maintain the standard cloverleaf structure, with the exception of tRNASer (AGN), which lacks the DHU arm. This finding indicates that the rearrangement does not significantly impact functionality and may be associated with the high AT bias (with an AT content ranging from 77.9% to 80%) and the mechanisms of replication repair.
4. Materials and Methods
4.1. Sample Collection and DNA Extraction
Adult specimens of Faunis aerope, Stichophthalma howqua, and Aemona lena were collected in 2021 from Mount Fanjing located in Guizhou Province, China. Initially, these samples were immersed in 100% ethyl alcohol and subsequently stored at −20 °C (School of Life Sciences, Qinghai Normal University, Xi’ning, China). The specimens were identified based on «Chinese Butterfly Fauna (Volumes I and II)» and «BUTTERFLIES OF CHINA (Complete 4 Volumes)» [16,17]. The specimen was photographed using a Nikon D850 (Nikon Corporation, Tokyo, Japan). Utilizing a TIANamp Genomic DNA Kit (Tiangen, Beijing, China), total DNA was extracted from the complete bodies of three specimens, in accordance with the manufacturer’s guidelines. The quality of the DNA extracts was assessed using 1% agarose gel electrophoresis, and the concentrations were determined with a NanoDrop™ 2000 spectrophotometer (Thermo Fisher, Waltham, MA, USA).
4.2. Mitogenome Assembly, Annotation, and Analysis
The complete mitogenomes were sequenced using the HiSeq 2500 platform (Illumina, San Diego, CA, USA). This sequencing endeavor was carried out by Biomarker Biotechnologies Inc., located in Beijing, China. The mitochondrial genomes (mitogenomes) of three distinct species were meticulously assembled through the application of the GetOrganell pipeline, version 1.7.5.3 [18]. This robust pipeline facilitated the processing of sequences that were later organized into mitogenomic contigs through the utilization of the Denovo assembly software known as Spades v3.15.5. To predict the thirteen protein-coding genes (PCGs) present within the mitogenomes, a comparative approach was adopted, involving the analysis of homologous sequences derived from reference mitogenomes. This process was complemented by the identification of open reading frames, which was conducted in accordance with the invertebrate mitochondrial genetic code. Furthermore, the positioning of twenty-two transfer RNA (tRNA) genes was accurately identified through the MITOS web server, a tool specifically designed for mitochondrial genome annotation, which was accessed on 20 October 2024 [19]. In addition, the identification of the two ribosomal RNA genes, rrnS and rrnL, along with the AT-rich region, was accomplished by examining the positions of adjacent genes, specifically trnL1 and trnV. This approach was further supported by aligning these sequences with homologous sequences found in reference mitogenomes, ensuring a high level of accuracy in the determination of these genomic elements.
The nucleotide composition, analysis of skew, usage of codons for protein-coding genes (PCGs), and the corresponding values of relative synonymous codon usage for each PCG were assessed using PhyloSuite v1.2.1 [20]. Simultaneously, the tandem repeat units within the AT-control region were examined using the Tandem Repeats Finder online tool (http://tandem.bu.edu/trf/trf.html (accessed on 20 October 2024)) [21]. The shifts in nucleotide composition (composition skew) were determined with the formulas: AT-skew = [(A − T)/(A + T)] and GC-skew = [(G − C)/(G + C)] [22]. Mitochondrial DNA (mtDNA) maps were generated via CGView Server v1.0 [23].
4.3. Phylogenetic Analyses and Estimation of Divergence Time
We created a dataset that includes the novel mitogenome of three newly sequenced insect species, along with the complete mitogenomes of 45 additional species obtained from NCBI GenBank (refer to Table 2 and Table S2). The outgroup taxa selected for our analysis were J. orithya, P. arja, and V. indica. To analyze this dataset, we conducted phylogenetic analyses employing both Bayesian inference (BI) and maximum likelihood (ML) methodologies. The alignment of nucleotide sequences was performed using the G-INS-I (accurate) method in codon alignment mode, whereas the amino acid sequences were aligned by employing the auto strategy in normal alignment mode. Furthermore, we leveraged the multiple sequence alignment tool MAFFT available in PhyloSuite v1.2.1 [24] to align nucleotide and amino acid sequences from 13 PCGs present in each mitogenome. The optimal partitioning scheme and nucleotide substitution model for BI and ML phylogenetic analyses with PartitionFinder-2.1.1 were incorporated into PhyloSuite v1.2.1 [25].
In our study, we employed the BEAST v1.8.3 software to estimate divergence times [26]. For the analysis, we utilized a phylogenetic tree constructed from the consensus topology and branch lengths derived from the MrBayes analysis [27]. Three known divergence times were used as calibration points (Melanitis leda with Elymnias hypermnestra: 57 Mya [28]; Minois dryas with Oeneis urda: 15.86 Mya [28]; and Mycalesis intermedia with Melanargia asiatica: 31.5 Mya [29]).
Table 2.
List of taxa used for phylogenetic analyses in this study.
Table 2.
List of taxa used for phylogenetic analyses in this study.
| Taxon | Mitogenome Size (bp) | GenBank Accession No. | References | |
|---|---|---|---|---|
| Satyrinae | ||||
| Elymniini | ||||
| Elymnias hypermnestra | 15,167 | KF906484 | ||
| Melanitini | ||||
| Melanitis phedima | 15,142 | KF590538 | [30] | |
| Melanitis leda | 15,122 | JF905446 | [14] | |
| Satyrini | ||||
| Callerebia suroia | 15,208 | NC026060 | [31] | |
| Coenonympha amaryllis | 15,125 | NC046491 | [32] | |
| Davidina armandi | 15,214 | KF881046 | ||
| Hipparchia autonoe | 15,489 | OK094488 | [33] | |
| Lasiommata deidamia | 15,244 | MG880214 | [34] | |
| Lethe albolineata | 15,248 | NC028507 | [35] | |
| Lethe baileyi | 15,225 | NC050905 | [7] | |
| Lethe baucis | 15,251 | NC050906 | [7] | |
| Lethe dura | 15,259 | KF906485 | ||
| Lethe hayashii | 15,246 | NC050907 | [7] | |
| Lethe helle | 15,253 | NC050908 | [7] | |
| Lethe marginalis | 15,229 | NC050909 | [7] | |
| Lethe nigrifascia | 15,239 | NC050910 | [7] | |
| Lethe oculatissima | 15,243 | NC050911 | [7] | |
| Lethe satyrina | 15,271 | NC050912 | [7] | |
| Lethe syrcis | 15,252 | NC050913 | [7] | |
| Lethe titania | 15,257 | NC050914 | [7] | |
| Lethe uemurai | 15,272 | NC050915 | [7] | |
| Lethe verma | 15,239 | NC050916 | [7] | |
| Minois dryas | 15,194 | NC046591 | [36] | |
| Mycalesis francisca | 15,279 | MN242790 | [36] | |
| Mycalesis intermedia | 15,386 | MN610565 | [13] | |
| Mycalesis mineus | 15,267 | KM244676 | [37] | |
| Neope muirheadii | 15,217 | MN242789 | [36] | |
| Oeneis urda | 15,248 | NC046889 | [38] | |
| Triphysa phryne | 15,143 | KF906487 | [39] | |
| Ypthima akragas | 15,227 | KF590553 | [30] | |
| Ypthima motschulskyi | 15,232 | MN242788 | [36] | |
| Ypthima baldus | 15,304 | MN708051 | [6] | |
| Aulocera merlina | 15,259 | NC068667 | [40] | |
| Lopinga achine | 15,284 | NC063460 | [41] | |
| Mandarinia regalis | 15,267 | NC068905 | ||
| Melanargia asiatica | 15,142 | NC024550 | [42] | |
| Melanargia meridionalis | 15,442 | NC067761 | ||
| Ninguta schrenckii | 15,261 | NC026838 | [43] | |
| Chonala masoni | 15,278 | NC068708 | ||
| Aemona lena | 15,288 | This study | ||
| Faunis aerope | 15,512 | This study | ||
| Stichophthalma howqua | 13,914 | This study | ||
| Outgroup | Polyura arja | 15,363 | NC024408 | [44] |
| Junonia orithya | 15,241 | NC022697 | [45] | |
| Vanessa indica | 15,191 | NC038157 | [46] |
5. Conclusions
In this research, we successfully identified three new mitochondrial whole genomes, including Faunis aerope, Stichophthalma howqua, and Aemona lena. Our analysis revealed that their mitochondrial genomes exhibit a remarkable degree of conservation in several key areas. This includes the consistency of base content and composition, the overall size and sequence of the genomes, the presence of protein-coding genes and their corresponding codon usage, as well as the structural characteristics of tRNA secondary structures. To further explore the phylogenetic relationships among these species, we conducted phylogenetic analyses using thirteen protein-coding genes (PCGs) and two ribosomal RNA (rRNA) genes via Bayesian inference (BI) and maximum likelihood (ML) methods. The resulting phylogenetic tree displayed a well-resolved topological structure, with high support for each branch. Our results show that both ML and BI methods produced similar topologies, strongly supporting the identification of well-defined monophyletic groups at the tribe level. These results also elucidate the relationships within the Satyrinae subfamily, specifically supporting the grouping of (Satyrini + (Amathusiini + Elymniini)) + Melanitini. Furthermore, our analysis suggests that the divergence of the Satyrinae subfamily occurred at the end of the Paleocene epoch during the Paleogene period. This temporal insight contributes significantly to the understanding of the evolutionary timeline for these species. Overall, the results of this study offer crucial information that will aid in future investigations regarding the phylogenetic relationships within the Satyrinae subfamily, paving the way for further inquiries and discussions in this area of research.
Supplementary Materials
The following supporting information can be downloaded at: https://www.mdpi.com/article/10.3390/ijms26062609/s1.
Author Contributions
Conceptualization, Z.C.; formal analysis, Z.D. and Y.Z.; writing—original draft preparation, Z.D.; writing—review and editing, Z.C. All authors have read and agreed to the published version of the manuscript.
Funding
This research was supported by the Qinghai Province ‘High-end Innovative Talent Thousand Plan’ High-level Talent Project (No. 005024014).
Institutional Review Board Statement
Not applicable.
Informed Consent Statement
Not applicable.
Data Availability Statement
The data are contained within the article or Supplementary Materials.
Conflicts of Interest
The authors declare no conflicts of interest.
References
- Peña, C.; Wahlberg, N.; Weingartner, E.; Kodandaramaiah, U.; Nylin, S.; Freitas, A.V.; Brower, A.V. Higher level phylogeny of Satyrinae butterflies (Lepidoptera: Nymphalidae) based on DNA sequence data—ScienceDirect. Mol. Phylogenet. Evol. 2006, 40, 29–49. [Google Scholar] [CrossRef] [PubMed]
- Marín, M.; Peña, C.; Freitas, A.; Wahlberg, N.; Uribe, S. From the Phylogeny of the Satyrinae Butterflies to the Systematics of Euptychiina (Lepidoptera: Nymphalidae): History, Progress and Prospects. Neotrop. Entomol. 2011, 40, 1–13. [Google Scholar] [CrossRef] [PubMed]
- Wahlberg, N.; Leneveu, J.; Kodandaramaiah, U.; Pena, C.; Nylin, S.; Freitas, A.V.L.; Brower, A.V. Nymphalid butterflies diversify following near demise at the Cretaceous/Tertiary boundary. Proc. R. Soc. B Biol. Sci. 2009, 276, 4295–4302. [Google Scholar] [CrossRef]
- Peña, C.; Wahlberg, N. Prehistorical climate change increased diversification of a group of butterflies. Biol. Lett. 2008, 4, 274–278. [Google Scholar] [CrossRef]
- Cameron, S.L. Insect mitochondrial genomics: Implications for evolution and phylogeny. Annu. Rev. Entomol. 2014, 59, 95–117. [Google Scholar] [CrossRef]
- Li, X.D.; Hu, H.W.; Zhang, S.L.; Wang, J.W.; Li, R. Characterization of the complete mitochondrial genome of Ypthima baldus (Lepidoptera: Satyrinae) with phylogenetic analysis. Mitochondrial Dna Part B-Resour. 2020, 5, 1019–1020. [Google Scholar] [CrossRef]
- Chen, L.; Wahlberg, N.; Liao, C.Q.; Wang, C.B.; Ma, F.Z.; Huang, G.H. Fourteen complete mitochondrial genomes of butterflies from the genus Lethe (Lepidoptera, Nymphalidae, Satyrinae) with mitogenome-based phylogenetic analysis. Genomics 2020, 112, 4435–4441. [Google Scholar] [CrossRef] [PubMed]
- Zhang, W.; Li, R.; Zhou, C. Complete mitochondrial genomes of Epeorus carinatus and E. dayongensis (Ephemeroptera: Heptageniidae): Genomic comparison and phylogenetic inference. Gene 2021, 777, 145467. [Google Scholar] [CrossRef] [PubMed]
- Jiang, K.; Su, T.; He, B.; Zhao, F.; Huang, Z. Complete mitochondrial genome of Casmara patrona (Lepidoptera: Oecophoridae). Mitochondrial DNA Part B 2021, 6, 325–326. [Google Scholar] [CrossRef]
- Yang, J.; Ren, Q.; Huang, Y. Complete mitochondrial genomes of three crickets (Orthoptera: Gryllidae) and comparative analyses within Ensifera mitogenomes. Zootaxa 2016, 4092, 529. [Google Scholar] [CrossRef]
- Liu, B.; Sun, H.; Zhan, Q.; Gai, Y. The complete mitochondrial genome of Orthaga achatina (Lepidoptera: Pyralidae). Mitochondrial DNA Part B 2021, 6, 821–823. [Google Scholar] [CrossRef] [PubMed]
- Tian, X.; Su, X.; Li, C.; Zhou, Y.; Li, S.; Guo, J.; Fan, Q.; Lü, S.; Zhang, Y. Draft genome of the blister beetle, Epicauta chinensis. Int. J. Biol. Macromol. 2021, 193 Pt B, 1694–1706. [Google Scholar] [CrossRef]
- Wu, Y.P.; Lu, J.J.; Yang, J.; Wang, J.P.; Cao, T.W.; Fan, R.J. Complete mitochondrial genome of Mycalesis intermedia (Lepidoptera: Nymphalidae). Mitochondrial DNA Part B Resour. 2020, 5, 703–704. [Google Scholar] [CrossRef]
- Shi, Q.H.; Zhao, F.; Hao, J.S.; Yang, Q. Complete mitochondrial genome of the Common Evening Brown, Melanitis leda Linnaeus (Lepidoptera: Nymphalidae: Satyrinae). Mitochondrial DNA 2013, 24, 492–494. [Google Scholar] [CrossRef] [PubMed]
- Liu, G.; Chang, Z.; Chen, L.; He, J.; Li, X. Genome size variation in butterflies (Insecta, Lepidotera, Papilionoidea): A thorough phylogenetic comparison. Syst. Entomol. 2020, 45, 571–582. [Google Scholar] [CrossRef]
- Xu, C.W.Y. Butterflies of China (Complete 4 Volumes); Straits Publishing House: Fuzhou, China, 2017. [Google Scholar]
- Zhou, Y. Chinese Butterfly Fauna; Henan Science and Technology Press: Zhengzhou, China, 1999. [Google Scholar]
- Jin, J.J.; Yu, W.B.; Yang, J.B.; Song, Y.; dePamphilis, C.W.; Yi, T.S.; Li, D.Z. GetOrganelle: A fast and versatile toolkit for accurate de novo assembly of organelle genomes. Genome Biol. 2020, 21, 241. [Google Scholar] [CrossRef]
- Bernt, M.; Donath, A.; Juehling, F.; Stadler, P. MITOS: Improved de novo Metazoan Mitochondrial Genome Annotation. Mol. Phylogenet. Evol. 2013, 69, 313–319. [Google Scholar] [CrossRef] [PubMed]
- Zhang, D.; Gao, F.; Jakovlić, I.; Zou, H.; Zhang, J.; Li, W.X.; Wang, G.T. PhyloSuite: An integrated and scalable desktop platform for streamlined molecular sequence data management and evolutionary phylogenetics studies. Mol. Ecol. Resour. 2020, 20, 348–355. [Google Scholar] [CrossRef]
- Benson, G. Tandem repeats finder: A program to analyze DNA sequences. Nucleic Acids Res. 1999, 27, 573–580. [Google Scholar] [CrossRef]
- Perna, N.T.; Kocher, T.D. Patterns of nucleotide composition at fourfold degenerate sites of animal mitochondrial genomes. J. Mol. Evol. 1995, 41, 353–358. [Google Scholar] [CrossRef]
- Grant, J.R.; Stothard, P. The CGView Server: A comparative genomics tool for circular genomes. Nucleic Acids Res. 2008, 36, 181–184. [Google Scholar] [CrossRef] [PubMed]
- Standley, D.M. MAFFT multiple sequence alignment software version 7: Improvements in performance and usability. Mol. Biol. Evol. 2013, 30, 772. [Google Scholar]
- Lanfear, R.; Frandsen, P.B.; Wright, A.M.; Senfeld, T.; Calcott, B. PartitionFinder 2: New Methods for Selecting Partitioned Models of Evolution for Molecular and Morphological Phylogenetic Analyses. Mol. Biol. Evol. 2017, 34, 772–773. [Google Scholar] [CrossRef] [PubMed]
- Drummond, A.J.; Rambaut, A. BEAST: Bayesian evolutionary analysis by sampling trees. BMC Evol. Biol. 2007, 7, 214. [Google Scholar] [CrossRef]
- Ronquist, F.; Huelsenbeck, J. MrBayes 3: Bayesian phylogenetic inference under mixed models. Bioinformatics 2003, 19, 1572–1574. [Google Scholar] [CrossRef] [PubMed]
- Wiemers, M.; Chazot, N.; Wheat, C.W.; Schweiger, O.; Wahlberg, N. A complete time-calibrated multi-gene phylogeny of the European butterflies. ZooKeys 2020, 938, 97–124. [Google Scholar] [CrossRef]
- Chazot, N.; Wahlberg, N.; Freitas, A.; Eacute Lucci, V.; Mitter, C.; Labandeira, C.; Sohn, J.C.; Sahoo, R.K.; Seraphim, N.; de Jong, R.; et al. Priors and Posteriors in Bayesian Timing of Divergence Analyses: The Age of Butterflies Revisited. Syst. Biol. 2019, 68, 797–813. [Google Scholar] [CrossRef]
- Wu, L.W.; Lin, L.H.; Lees, D.C.; Hsu, Y.F. Mitogenomic sequences effectively recover relationships within brush-footed butterflies (Lepidoptera: Nymphalidae). BMC Genom. 2014, 15, 468. [Google Scholar] [CrossRef]
- Shi, Q.; Zhang, W.; Hao, J. The complete mitochondrial genome of Callerebia suroia (Lepidoptera: Nymphalidae: Satyrinae). Mitochondrial DNA Part A DNA Mapp. Seq. Anal. 2016, 27, 1463–1465. [Google Scholar] [CrossRef]
- Zhou, L.; Yang, C.; Zhai, Q.; Zhang, Y. The complete mitochondrial genome sequence of Coenonympha amaryllis and monophyly of Satyrinae (Lepidoptera: Nymphalidae). Mitochondrial DNA Part B Resour. 2020, 5, 1223–1224. [Google Scholar] [CrossRef]
- Dan, Z.; Lei_Duan Chen, Z.; Xu, S. Mitogenomes of Three Satyrid Butterfly Species (Nymphalidae: Lepidoptera) and Reconstructed Phylogeny of Satyrinae. Diversity 2021, 13, 468. [Google Scholar] [CrossRef]
- Sun, Y.; Chen, C.; Geng, X.; Li, J. Complete mitochondrial genome of Lasiommata deidamia and its phylogenetic implication to subfamily Satyrinae (Lepidoptera: Nymphalidae). Mitochondrial DNA Part B Resour. 2021, 6, 2943–2945. [Google Scholar] [CrossRef] [PubMed]
- Li, J.; Xu, C.; Lei, Y.; Fan, C.; Gao, Y.; Xu, C.; Wang, R. Complete mitochondrial genome of a satyrid butterfly, Lethe albolineata (Lepidoptera: Nymphalidae). Mitochondrial DNA Part A DNA Mapp. Seq. Anal. 2016, 27, 4195–4196. [Google Scholar] [CrossRef]
- Yang, M.; Song, L.; Zhou, L.; Shi, Y.; Song, N.; Zhang, Y. Mitochondrial genomes of four satyrine butterflies and phylogenetic relationships of the family Nymphalidae (Lepidoptera: Papilionoidea). Int. J. Biol. Macromol. 2020, 145, 272–281. [Google Scholar] [CrossRef] [PubMed]
- Ling, Y.F.; Bonebrake, T.C. Consistent heat tolerance under starvation across seasonal morphs in Mycalesis mineus (Lepidoptera: Nymphalidae). Comp. Biochem. Physiol. Part A Mol. Integr. Physiol. 2022, 271, 111261. [Google Scholar] [CrossRef] [PubMed]
- Zhou, Y.; Liang, Z.; Wang, S.; Zhong, H.; Wang, N.; Liang, B.J. A mitogenomic phylogeny of satyrid butterflies and complete mitochondrial genome of Oeneis urda (Lepidoptera: Nymphalidae: Satyrinae). Mitochondrial DNA Part B 2020, 5, 1344–1345. [Google Scholar] [CrossRef]
- Zhang, W.; Gan, S.; Zuo, N.; Chen, C.; Wang, Y.; Hao, J. The complete mitochondrial genome of Triphysa phryne (Lepidoptera: Nymphalidae: Satyrinae). Mitochondrial DNA Part A DNA Mapp. Seq. Anal. 2016, 27, 474–475. [Google Scholar] [CrossRef]
- Shi, Q.; Xie, J.; Wu, J.; Chen, S.; Sun, G.; Zhang, J. Characterization of the complete mitochondrial genome of an endemic species in China, Aulocera merlina (Lepidoptera: Nymphalidae: Satyrinae) and phylogenetic analysis within Satyrinae. Ecol. Evol. 2024, 14, e11355. [Google Scholar] [CrossRef]
- Wu, J.L.; Bao, T.; Sun, G.; Xiao, Y.; Fang, Y.; Shi, Q.H. Complete mitochondrial genome of the Woodland Brown, Lopinga achine Scopoli, 1763 (Nymphalidae: Satyrinae) and its phylogenetic analysis. Mitochondrial DNA B Resour 2022, 7, 747–749. [Google Scholar] [CrossRef]
- Huang, D.; Hao, J.; Zhang, W.; Su, T.; Wang, Y.; Xu, X. The complete mitochondrial genome of Melanargia asiatica (Lepidoptera: Nymphalidae: Satyrinae). Mitochondrial DNA Part A 2016, 27, 806–808. [Google Scholar] [CrossRef]
- Fan, C.; Xu, C.; Li, J.; Lei, Y.; Gao, Y.; Xu, C.; Wang, R. Complete mitochondrial genome of a satyrid butterfly, Ninguta schrenkii (Lepidoptera: Nymphalidae). Mitochondrial DNA Part A 2016, 27, 80–81. [Google Scholar] [CrossRef] [PubMed]
- Xu, R.; Duan, L.; Hao, X.; Xiao, J.; Yuan, X. Characterization of complete mitochondrial genome of Polyura narcaeus (Lepidoptera: Nymphalidae: Charaxinae). Mitochondrial DNA Part B Resour. 2021, 6, 1654–1655. [Google Scholar] [CrossRef] [PubMed]
- Shi, Q.; Huang, D.; Wang, Y.; Hao, J. The complete mitochondrial genome of Blue Pansy, Junonia orithya (Lepidoptera: Nymphalidae: Nymphalinae). Mitochondrial DNA 2015, 26, 245–246. [Google Scholar] [CrossRef] [PubMed]
- Lu, Y.; Liu, N.; Xu, L.; Fang, J.; Wang, S. The complete mitochondrial genome of Vanessa indica and phylogenetic analyses of the family Nymphalidae. Genes Genom. 2018, 40, 1011–1022. [Google Scholar] [CrossRef]

Disclaimer/Publisher’s Note: The statements, opinions and data contained in all publications are solely those of the individual author(s) and contributor(s) and not of MDPI and/or the editor(s). MDPI and/or the editor(s) disclaim responsibility for any injury to people or property resulting from any ideas, methods, instructions or products referred to in the content. |
© 2025 by the authors. Licensee MDPI, Basel, Switzerland. This article is an open access article distributed under the terms and conditions of the Creative Commons Attribution (CC BY) license (https://creativecommons.org/licenses/by/4.0/).