Article

Genome-Wide Analysis of the PERK Gene Family in Brassica napus L. and Their Potential Roles in Clubroot Disease

The Key Laboratory of Biology and Genetic Improvement of Oil Crops, The Ministry of Agriculture and Rural Affairs of the PRC, Oil Crops Research Institute, Chinese Academy of Agricultural Sciences, Wuhan 430062, China
*
Author to whom correspondence should be addressed.
These authors contributed equally to this work.
Int. J. Mol. Sci. 2025, 26(6), 2685; https://doi.org/10.3390/ijms26062685
Submission received: 28 December 2024 / Revised: 2 March 2025 / Accepted: 11 March 2025 / Published: 17 March 2025
(This article belongs to the Section Molecular Plant Sciences)

Abstract

:
The proline-rich extensin-like receptor kinase (PERK) gene family is crucial to various molecular and cellular processes in plants. We identified 50 PERK genes in Brassica napus to explore their evolutionary dynamics, structural diversity, and functional roles. These genes were grouped into four classes and unevenly distributed across 18 chromosomes. Phylogenetic studies and Ka/Ks ratios revealed purifying selection during the evolution process. They exhibited significant diversification in gene length, molecular weight, and isoelectric points, suggesting specialized function. Gene structure and motif analyses revealed variations among the BnPERK family members, with conserved tyrosine kinase domains suggesting functional importance. Cis-element analysis predicted the involvement in hormone signaling and stress responses. Expression profiling showed diverse patterns across tissues and hormone treatments, highlighting potential roles in growth regulation and hormone signaling. Protein–protein interaction networks suggested BnPERK proteins interact with a wide array of proteins, implicating them in multiple biological processes. The transcriptional downregulation of four BnPERK genes upon Plasmodiophora brassicae infection implied a role in clubroot disease response. Furthermore, the Arabidopsis perk9 mutant displayed relieved disease severity and enhanced basal immune response, suggesting the negative role of PERK9 in plant immunity. The study highlighted the potential role of BnPERKs in crop improvement strategies against clubroot disease.

1. Introduction

Receptor-like kinases (RLKs) constitute the largest plant receptor family and are located on the cell surface to perceive and transduce a wide range of signals [1]. By initiating intracellular signaling cascades, RLKs play pivotal roles in various molecular and cellular processes, including plant development, stress response, and signal transduction [2]. These versatile receptors are capable of sensing plant hormones, secreted peptides, and molecules derived from pathogens involved in plant defense response [3]. For example, RLKs recognize pathogen-associated molecular patterns (PAMPs), which trigger the Pattern-Triggered Immunity (PTI) response, activating signaling pathways that defend against pathogen invasion.
RLKs typically consist of three key domains: an extracellular domain, a transmembrane domain, and an intracellular kinase domain [4]. The extracellular domain, characterized by significant structural diversity, forms the basis for classifying RLKs into different subclasses based on their motif structures. Among these, the proline-rich extensin-like receptor kinases (PERKs) represent a distinct group characterized by a proline-rich extracellular domain [5]. Interestingly, while some PERKs like BnPERK1 and AtPERK4 locate on the plasma membrane, AtPERK13 has been demonstrated to anchor to the cell wall [6,7,8,9]. Functionally, the intracellular kinase domain of RLKs contains conserved motifs that exhibit kinase activity, which has been observed in BnPERK1 and AtPERK4 [7,10].
In Arabidopsis thaliana, the PERK gene family consists of 15 members, some of which show specific expression patterns in roots and floral organs [11]. However, some AtPERK genes exhibit broad expression patterns across various tissues, such as AtPERK1, which is ubiquitously expressed, suggesting its involvement in diverse molecular and cellular processes. Recent studies have elucidated the regulation of PERKs in response to different stress conditions [5]. For example, the expression of TaPERKs in wheat and GhPERKs in cotton is significantly influenced by abiotic stresses such as heat, drought, and salinity [12,13]. In A. thaliana, AtPERK13 has been shown to respond to nutrient deficiencies such as phosphate, nitrogen, and iron deprivation, highlighting the role of PERKs in maintaining nutrient homeostasis and adaptation [9]. In rice, the PERK gene Z15 is activated by moderately low temperatures, emphasizing the adaptability of PERKs to diverse environmental cues [14]. Additionally, PERKs have been implicated in plant defense against pathogens. For example, the expression of TaPERKs is influenced by fungal pathogens, and BnPERK1 has been shown to respond to the pathogen Sclerotinia sclerotiorum [7,12,15]. In summary, PERKs are versatile players in response to various stresses.
PERKs also play essential roles in plant hormone signaling. Several studies have highlighted the involvement of PERKs in the regulation of growth and development in response to hormonal signals [10,13,16]. For instance, AtPERK4 has been implicated in abscisic acid (ABA) signaling during root cell elongation [10]. Furthermore, the expression profiles of OsPERKs and GhPERKs have shown differential expression patterns under different plant hormone treatments, including ABA, methyl jasmona (MeJA), gibberellin (GA), salicylic acid (SA), and auxin [13,16]. The intricate regulation of PERKs by different plant hormones suggests their pivotal role in integrating hormonal signaling pathways to coordinate plant growth and stress responses.
In summary, PERK genes are known to be critical to plant growth, development, and stress responses. Despite the essential roles of PERKs in various processes across various plant species, comprehensive studies on the PERK gene family in Brassica napus (oilseed rape), an economically important crop serving as both an edible oil source and animal feed, are still limited [17]. This allopolyploid species (AACC, 2n = 38), formed by the hybridization between two diploid ancestors, B. rapa (AA = 20) and B. oleracea (CC = 18), emerged approximately 6800 to 12,500 years ago [18]. While a comprehensive study of BrPERK genes has been completed in male-sterile B. rapa plants, identifying 25 BrPERK genes and exploring their potential role in male sterility, studies in B. napus remain scarce [19].
This study aimed to provide a comprehensive study of BnPERK genes to include the exploration of its evolutionary history, chromosome location, and gene structure through various computational approaches. Tissue-specific and hormone treatment gene expression patterns were examined using available transcriptome datasets. Additionally, the study also investigated the role of BnPERKs in response to the obligate pathogen Plasmodiophora brassicae, which causes clubroot disease in Brassica species. By providing insights into the molecular and functional roles of BnPERKs, this study will contribute to a deeper understanding of this often-overlooked plant receptor subfamily and its potential applications in crop improvement.

2. Results

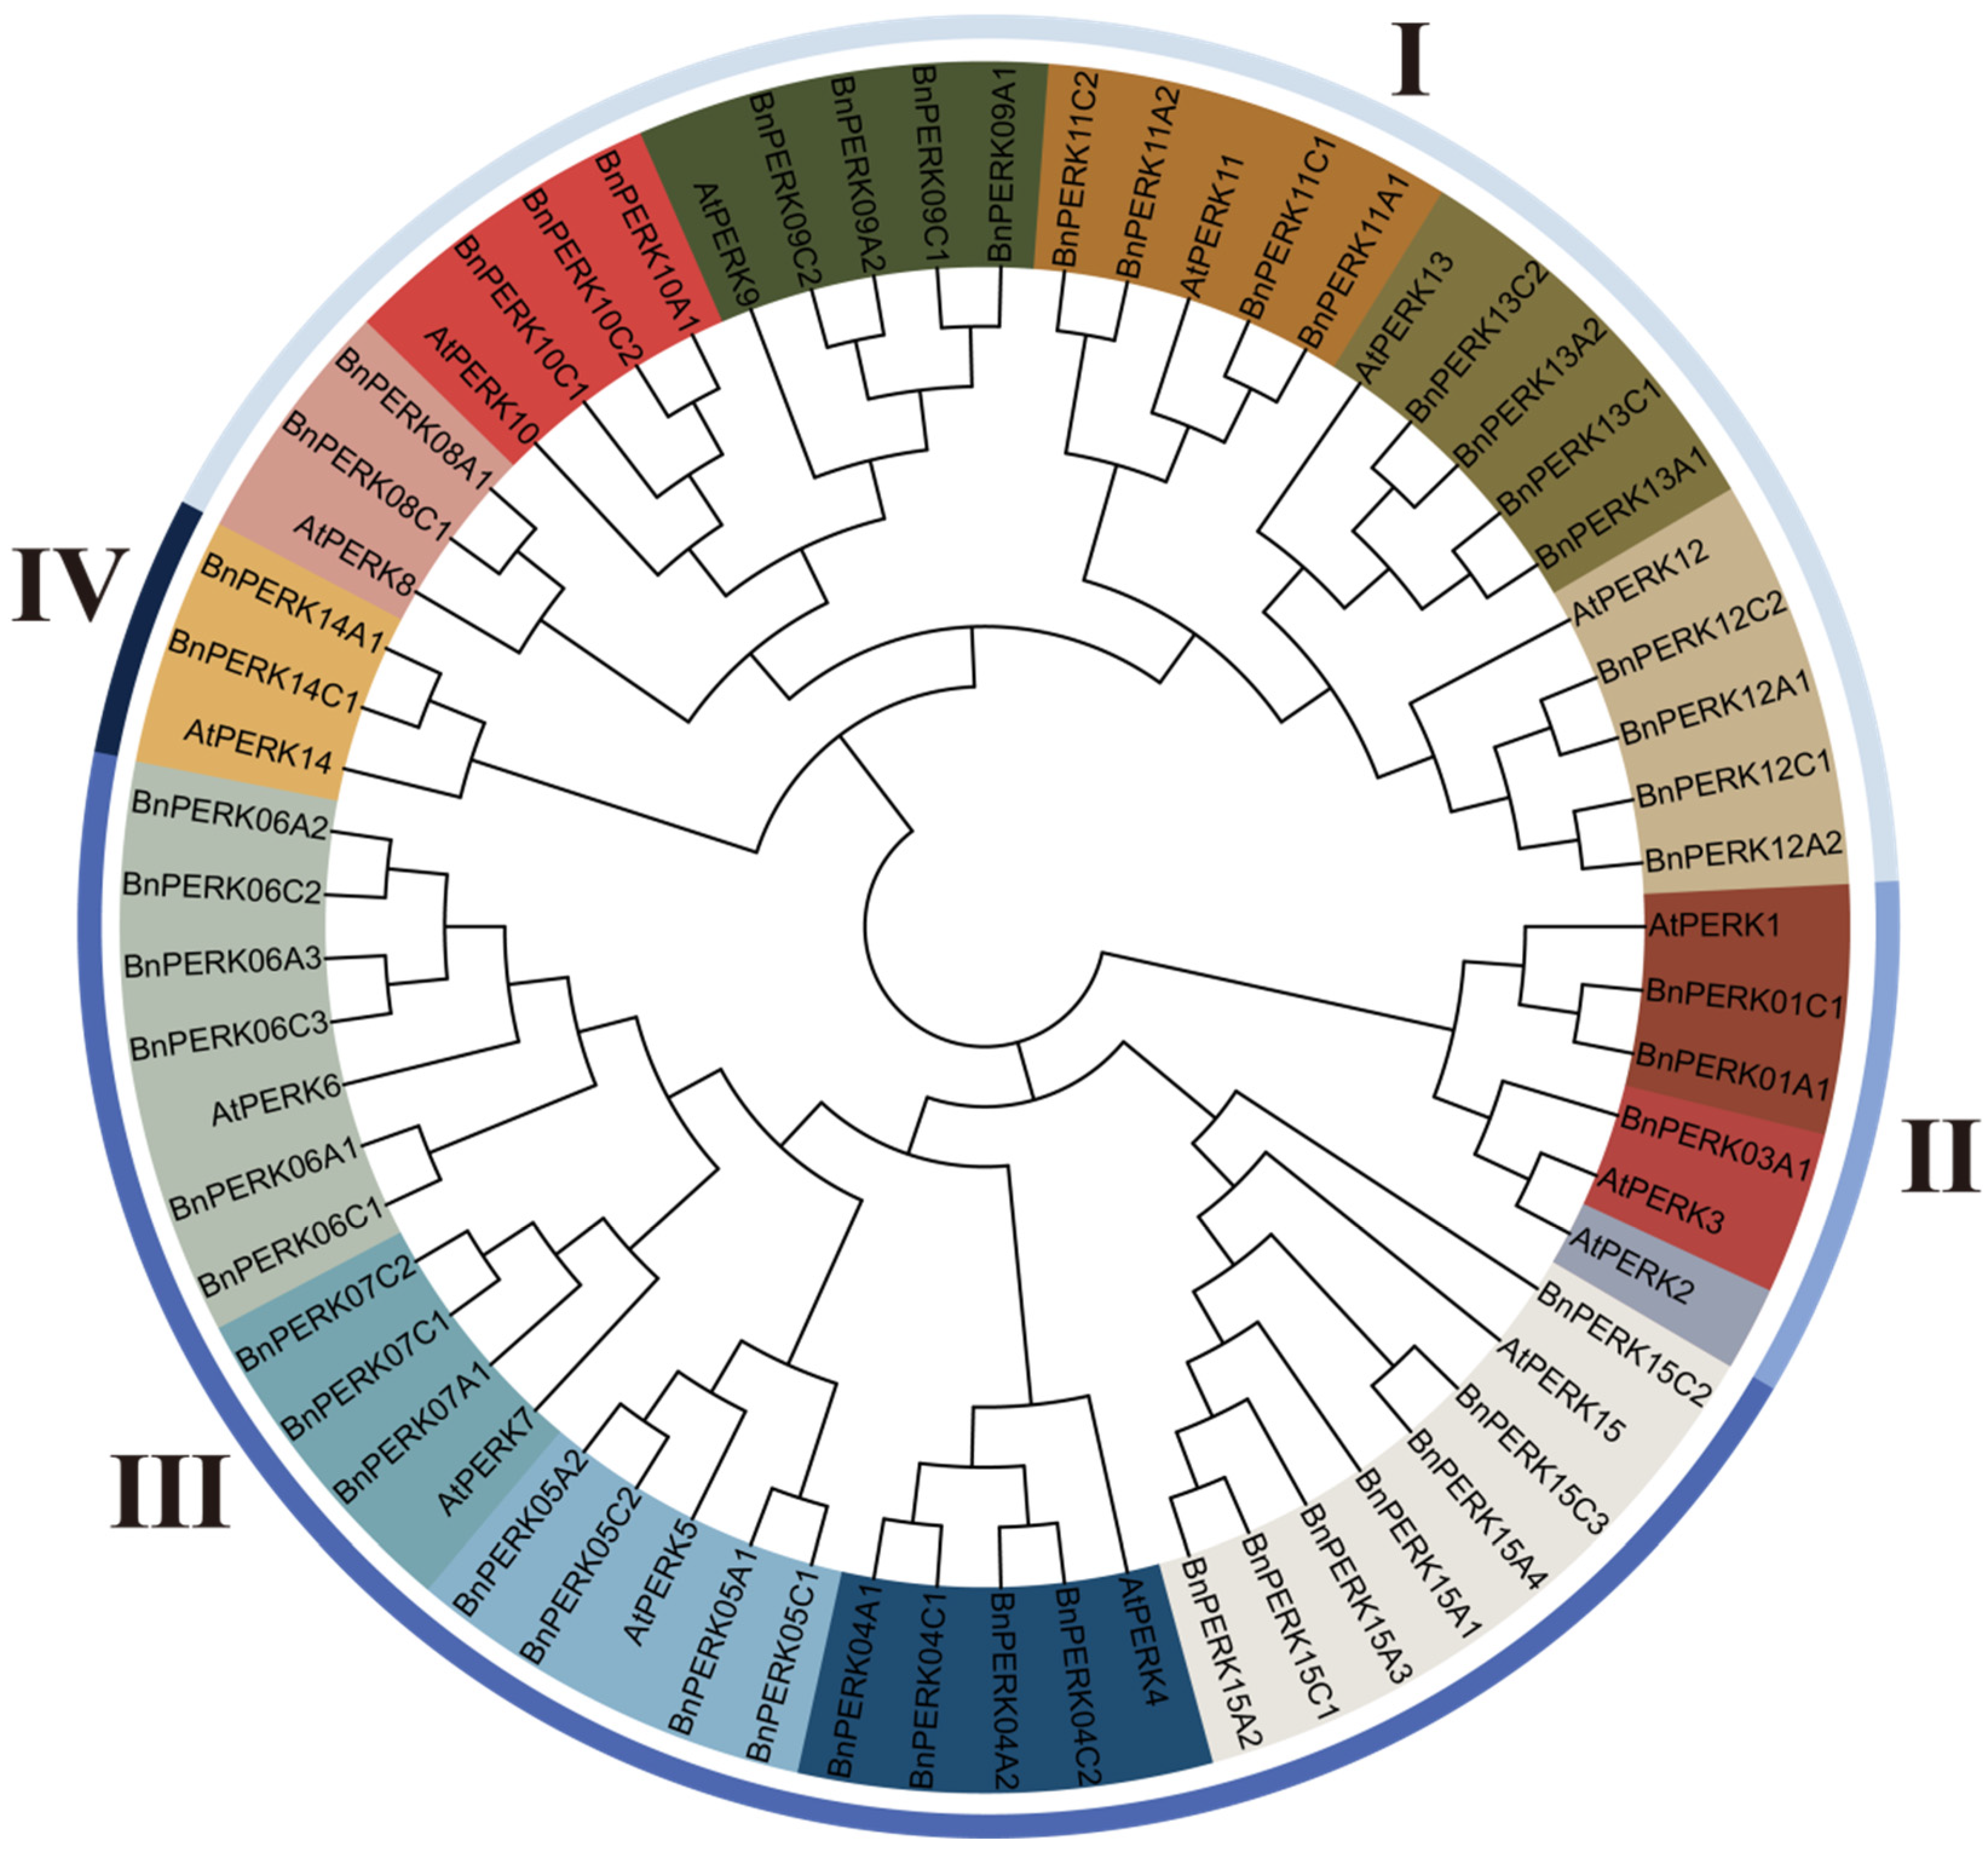
2.1. Identification and Phylogenetic Analysis of BnPERKs in Brassica napus

Fifty PERK genes were identified within the B. napus ‘ZS11’ genome (Supplementary Tables S2 and S3). Identification was accomplished through an extensive BLAST search using 15 AtPERK sequences, revealing a higher number of BnPERK genes compared with those reported in Arabidopsis, Chinese cabbage, soybean, rice, sorghum, maize, cotton, and wheat (Supplementary Table S4). The BnPERK family of proteins exhibited varying lengths, ranging from 187 to 921 amino acids. Their molecular weights (MWs) spanned from 20.63 to 102.21 kDa, with BnPERK15C2 and BnPERK15A2 representing the extremes. Additionally, the isoelectric points (pIs) ranged from 5.26 to 8.59 (Supplementary Table S5). The data plots illustrated that BnPERK proteins exhibit a broad spectrum of MW and pI. Moreover, predictions of subcellular localization suggested that most BnPERK proteins were located on the plasma membrane and endomembrane system, while others were associated with the nucleus and chloroplast (Supplementary Table S5).
To investigate the phylogenetic distribution and evolutionary relationships of the PERK gene family, a phylogenetic tree was constructed using 50 BnPERK protein sequences and 15 AtPERK protein sequences by MEGA11 using the maximum likelihood (ML) method (Supplementary Table S6). The BnPERK genes were categorized into four groups (I–IV) based on sequence similarity and functional domain analysis. Group III, being the largest group, included 5 paralogs with 24 BnPERK genes. Group I followed, containing 6 paralogs with 21 BnPERK genes. Group II included 3 paralogs, with 3 BnPERK genes, while Group IV contained only 1 paralog, with 3 BnPERK genes (Figure 1). All AtPERK genes, with the exception of AtPERK2, exhibited a close syntenic association with the 50 BnPERK genes. Most AtPERK genes corresponded to 2–6 orthologous genes in B. napus, each comprising orthologous genes from both the A and C subgenomes of B. napus. Notably, AtPERK3 was associated with a single ortholog, BnPERK03A1, as its counterpart in the C subgenome appeared to have been lost. These results suggest that genome rearrangement and gene loss occurred during the polyploidization of B. napus.

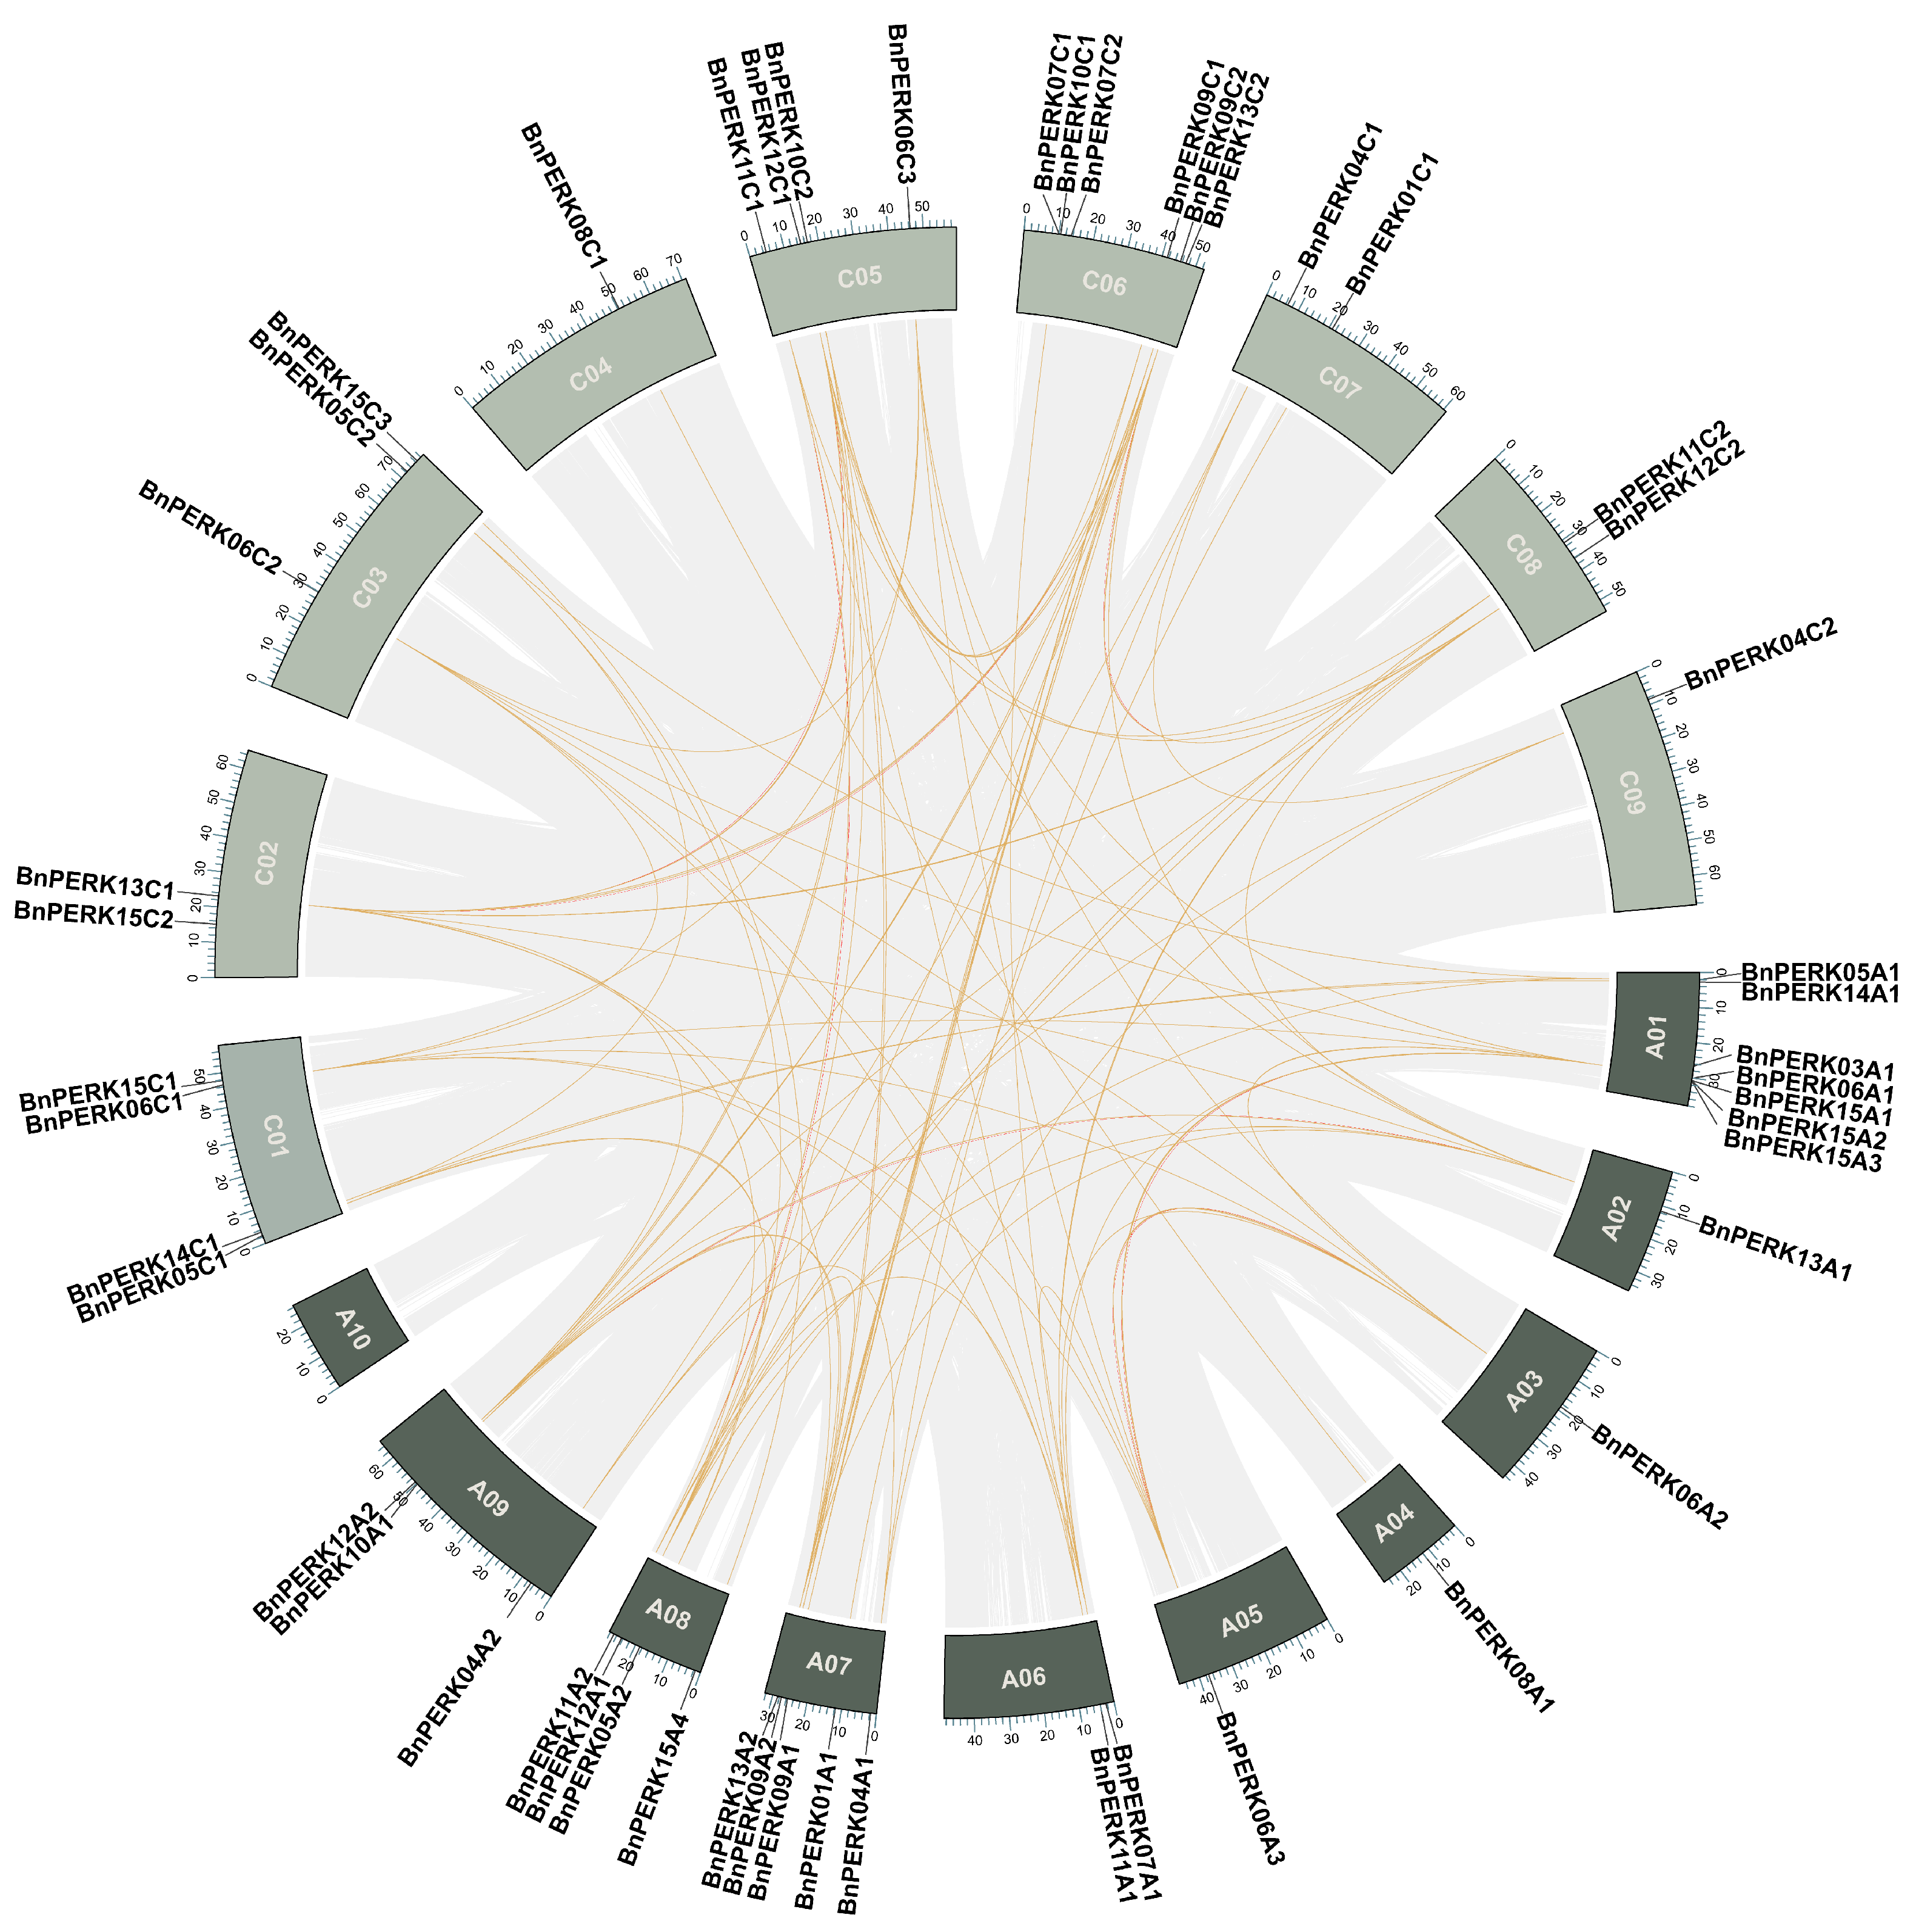
2.2. Chromosomal Distribution and Collinearity Analysis of BnPERK Genes

The 50 BnPERK genes were evenly distributed across the A and C subgenomes of B. napus, with 25 genes in each (Figure 2 and Supplementary Figure S1). These genes were dispersed among all chromosomes, except for A10. The highest concentration of genes was on the chromosome A1, which harbored seven genes, followed by six genes on C6 and five genes on A7. Single BnPERK genes were identified on chromosomes A2, A3, A4, A5, C4, and C9. The results indicated an irregular arrangement of the PERK gene family across the rapeseed chromosomes (Figure 2).
The collinear gene pairs in the B. napus genome were analyzed to explore syntenic relationships among BnPERKs (Figure 2). We identified 81 collinear gene pairs, including 49 pairs resulting from segmental duplication between the A and C subgenomes and 32 pairs occurring within a subgenome. The result indicated a high conservation between the A and C subgenomes. Additionally, we assessed the selective pressure exerted on duplicated BnPERK genes by calculating the ratios of nonsynonymous to synonymous substitutions (Ka/Ks) for the paralogous gene pairs (Supplementary Table S7). The Ka/Ks ratios ranged from 0.1409 to 0.2518 for 17 gene pairs in the A subgenome and from 0.1682 to 0.2519 for 15 gene pairs in the C subgenome. Furthermore, the Ka/Ks ratios for 49 gene pairs between the A and C subgenomes varied from 0.0482 to 0.5148. Notably, the Ka/Ks ratios for all paralogous gene pairs were found to be less than 1, indicating purifying selection acting on BnPERK genes.

2.3. Gene Structure, Conserved Motifs, and Cis-Elements Analysis of BnPERK Genes

To elucidate the functional characteristics of BnPERKs, the conserved motif, protein domain, and exon–intron organization were analyzed together with the phylogenetic tree (Figure 3). Ten conserved motifs were identified across the BnPERK proteins (Figure 3A and Supplementary Figure S2). These motifs exhibited consistent distribution patterns within the BnPERK proteins, with the exceptions of BnPERK15C2, BnPERK15A1, BnPERK15A3, and BnPERK10C1. Moreover, all BnPERK genes shared conserved tyrosine kinase domains, highlighting their functional significance (Figure 3B). Exon–intron analysis revealed structural diversity within the BnPERK gene family, though orthologous genes generally shared similar gene structures (Figure 3C). Most BnPERK genes harbored 5–9 introns, with the number of introns ranging from 3 (BnPERK15C2) to 16 (BnPERK15A2).
Cis-elements analysis is crucial for understanding gene regulation and function. Accordingly, upstream 2 kb sequences from BnPERKs transcription start sites were analyzed (Supplementary Tables S2 and S8). The results revealed that 75% of the identified cis-elements were core promoter and enhancer region elements. The remaining cis-elements were associated with hormonal responses, various stresses, and developmental processes (Figure 4A and Supplementary Figure S3). Cis-elements regulated responses to diverse hormones, including methyl jasmona (MeJA), abscisic acid (ABA), gibberellin (GA), auxin, ethylene (ET), and salicylic acid (SA), which were calculated (Figure 4B). The ABA and MeJA responsive elements were abundantly detected, and the auxin responsive elements were secondarily enriched (Figure 4B). These cis-elements relate to various biotic and abiotic stresses, such as light, anaerobic conditions, drought, low temperature, defense, and wounds (Figure 4C). Notably, there were light-responsive elements in all of the BnPERK genes (Supplementary Figure S3). In addition, there was a small part of the cis-elements that were categorized according to their roles in diverse developmental processes, including zein metabolism, endosperm expression, meristem expression, cell cycle regulation, and circadian control (Figure 4D). The presence of such diverse cis-elements suggests potential regulatory roles of BnPERKs in diverse biological processes.

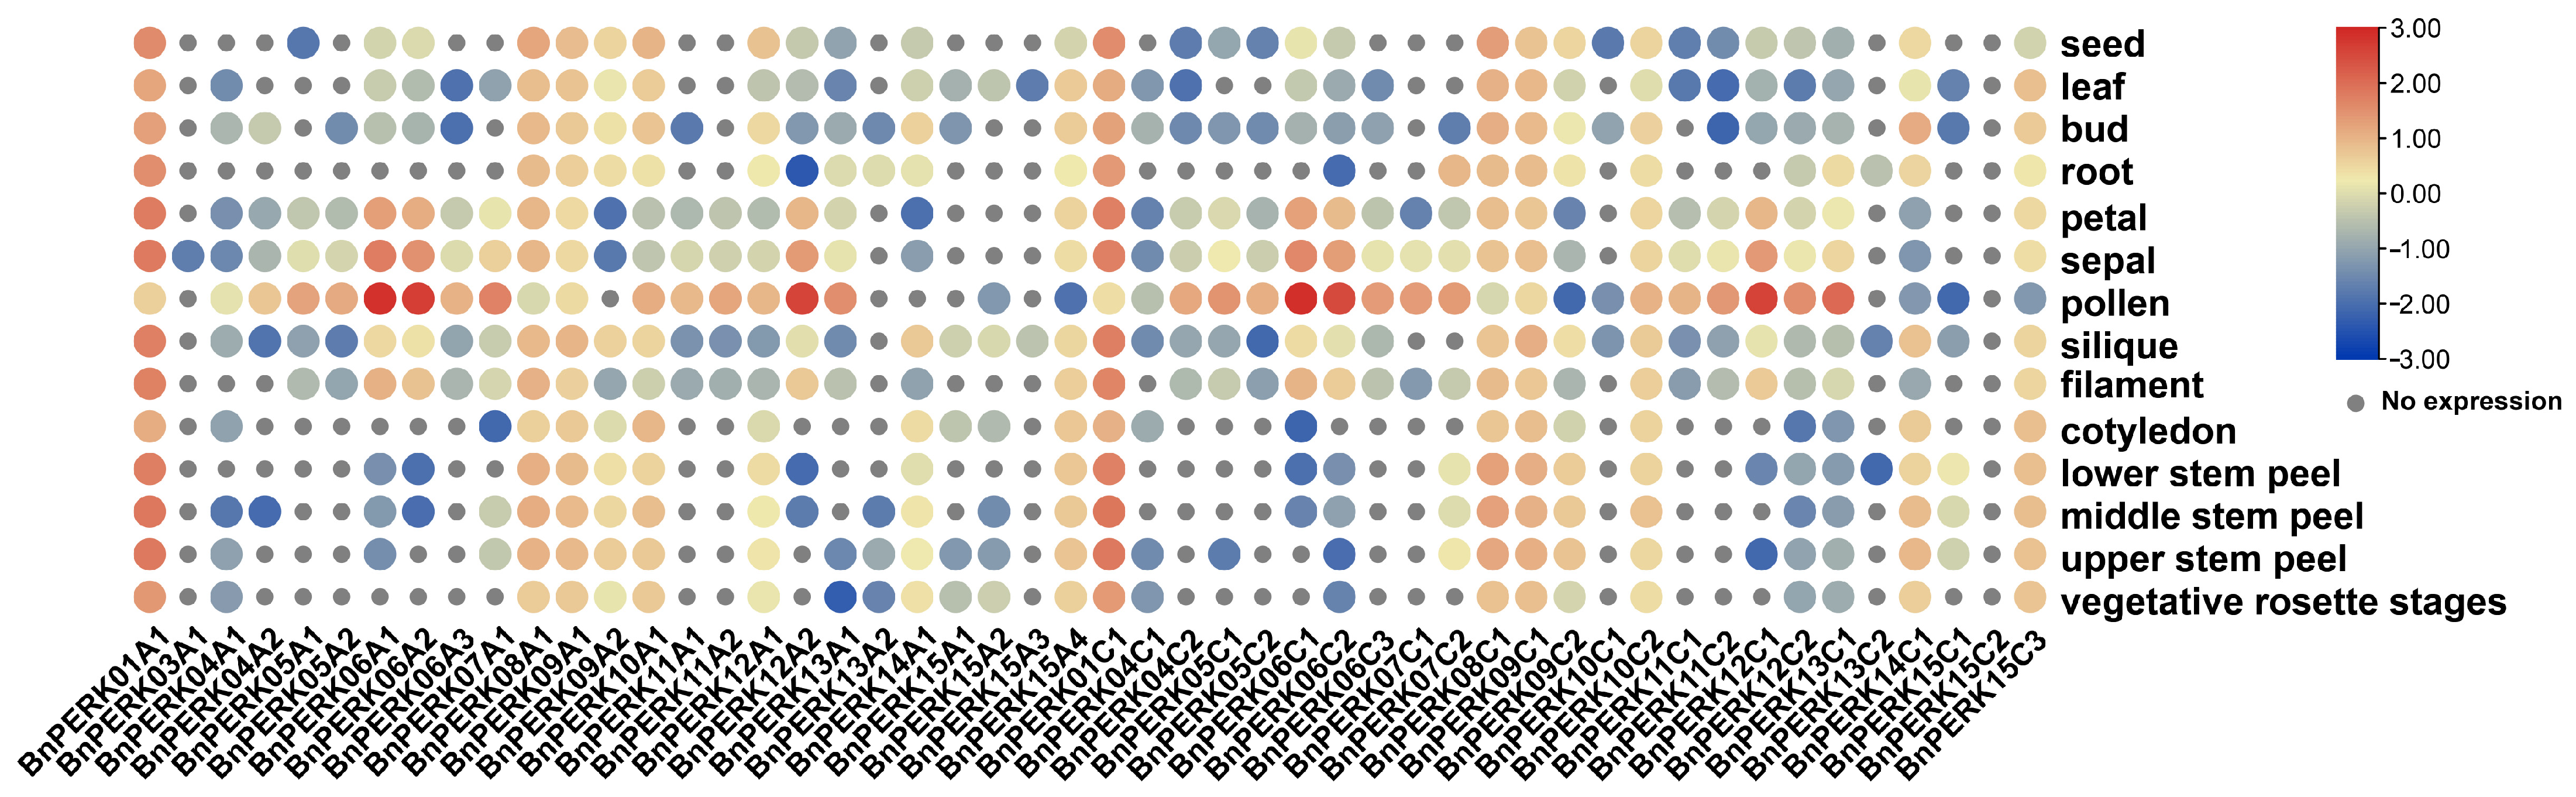
2.4. Expression Pattern of BnPERK Gene Family Across Various Tissues

The expression pattern of the BnPERK genes was analyzed across 14 tissues at various developmental stages through RNA-Seq analysis (Figure 5). The results exhibited diverse expression patterns across these tissues. There were 13 genes showing constitutive expression in multiple tissues, among which BnPERK01A1 and BnPERK01C1 exhibited the highest expression levels. In contrast, certain genes displayed specific expression patterns. For example, BnPERK03A1 showed highly specific but relatively low expression in the sepal, and BnPERK15A3 specifically expressed in the leaf and silique. Moreover, 18 orthologous genes of AtPERK5, AtPERK6, AtPERK7, and AtPERK12 in B. napus were highly expressed in pollen. BnPERK15C2, which encoded the shortest protein, was not expressed in any tissues, suggesting a potential loss of function. These differential expression patterns of BnPERK genes point to their diverse roles in plant growth and development.
Furthermore, some paralogous gene pairs, such as BnPERK01A1/BnPERK01C1 and BnPERK09A1/BnPERK09C1, showed similar expression patterns, being constitutively and highly expressed across all tested tissues. In contrast, other paralogous gene pairs, like BnPERK06A1/BnPERK06A2 and BnPERK06C1/BnPERK06C2, showed specific high expression in floral organs. Additionally, BnPERK15A4/BnPERK15C3 showed high expression levels in different tissues, except for pollen. However, some paralogous gene pairs exhibited distinct patterns, indicating functional divergence.

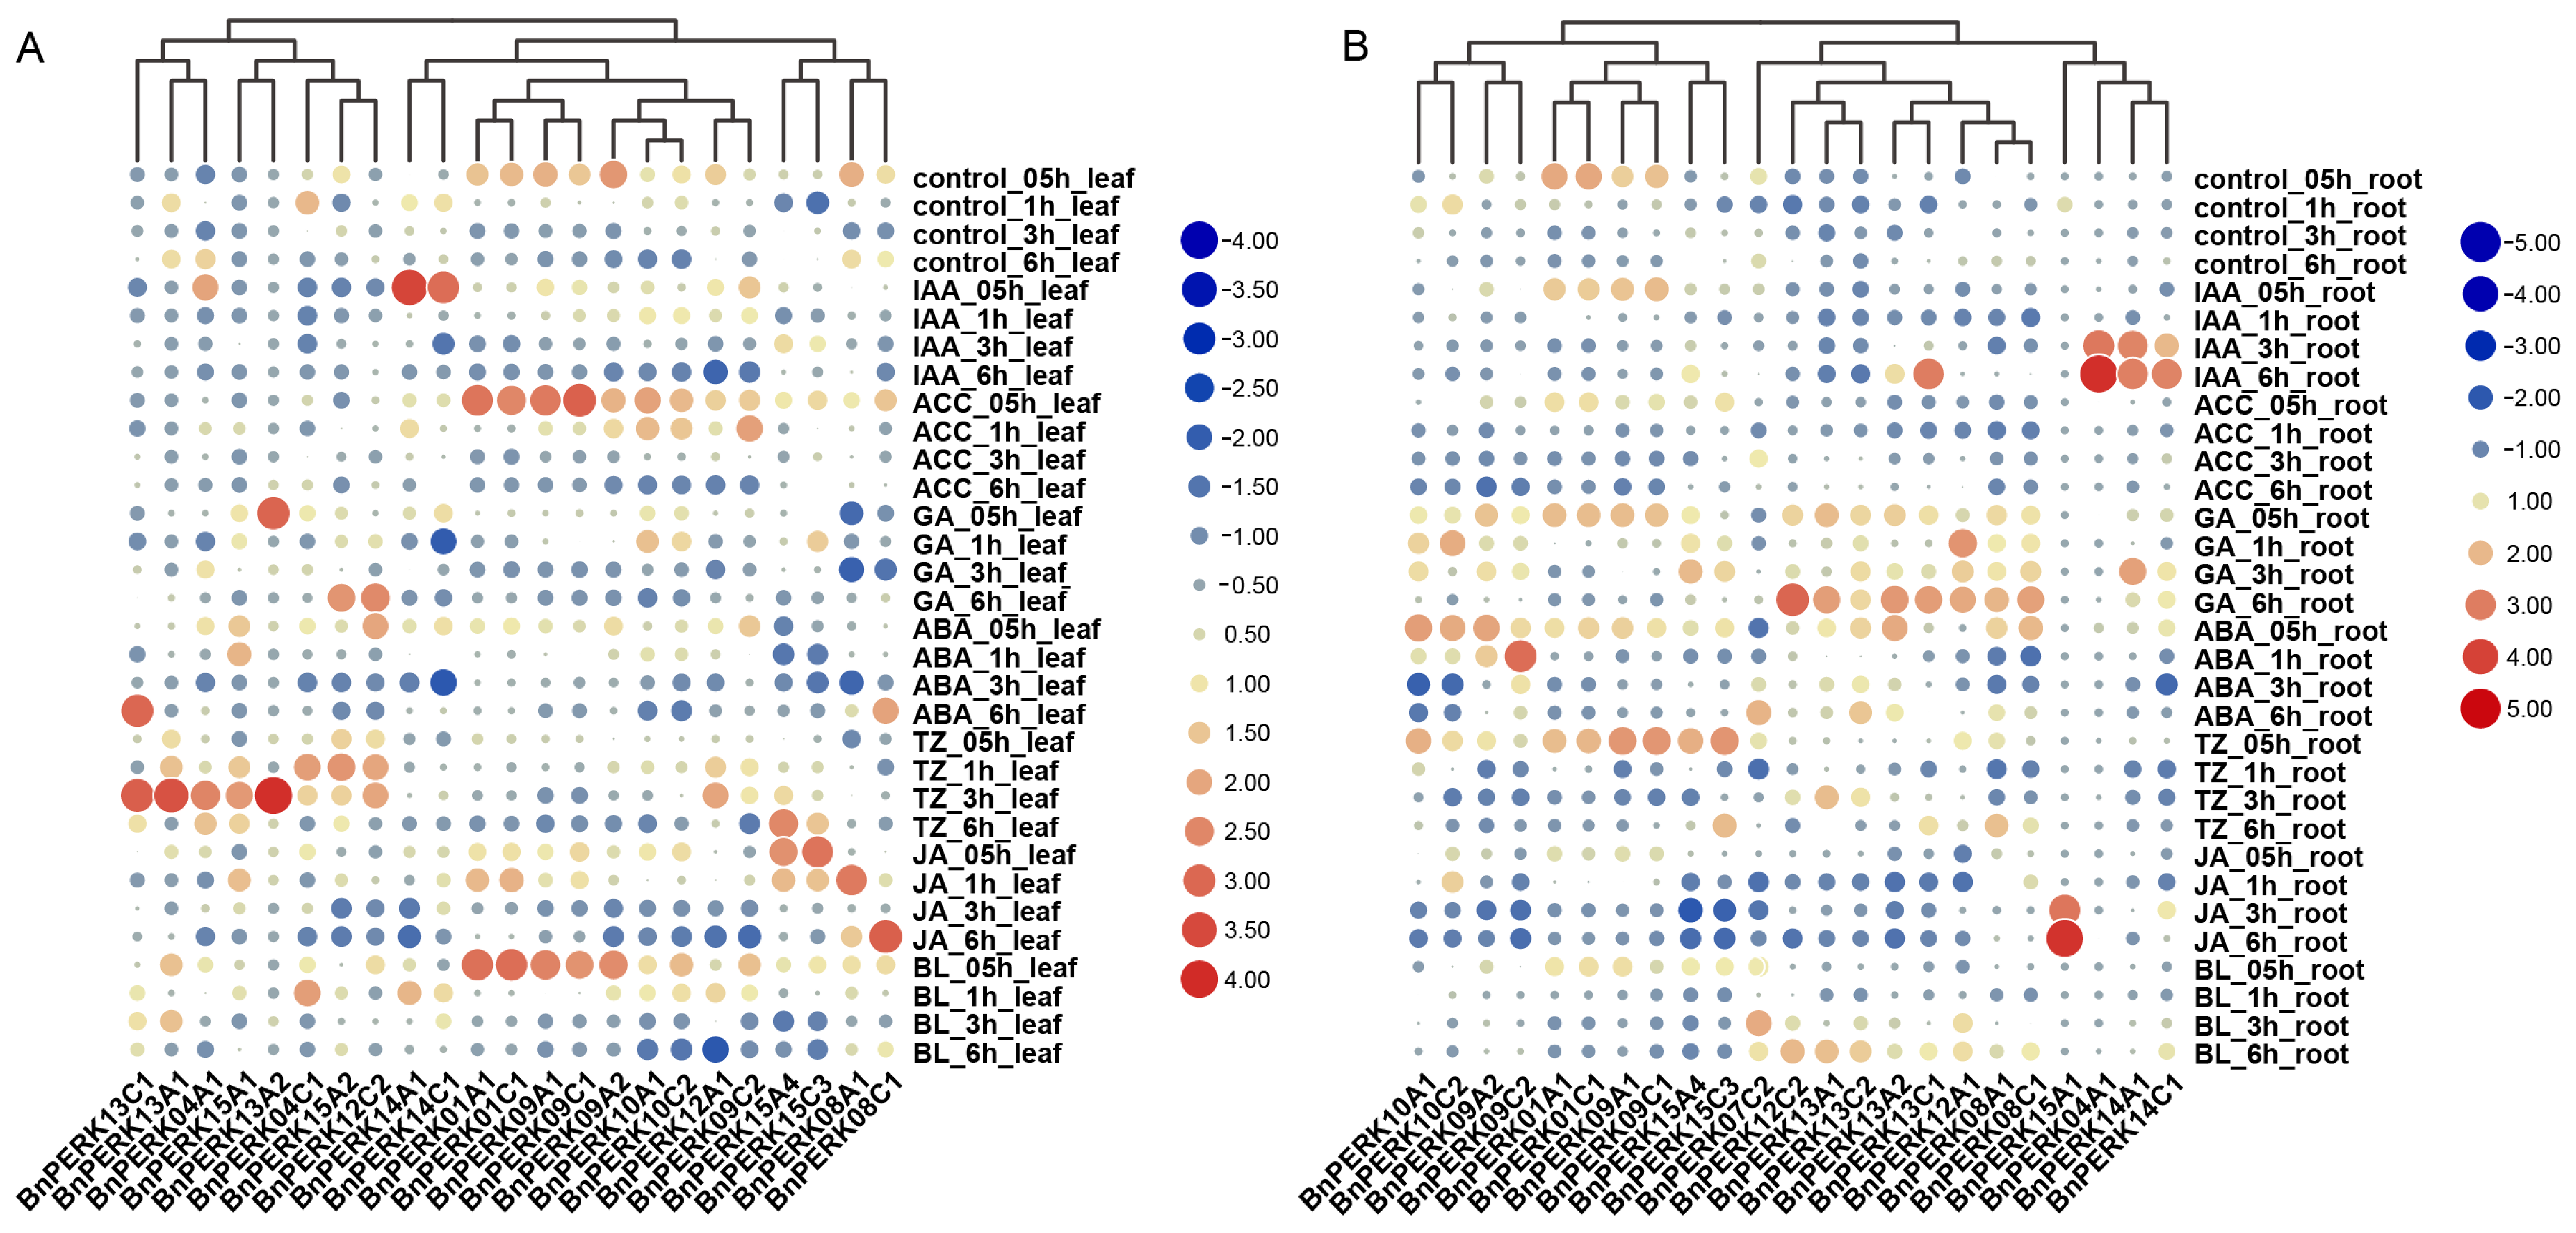
2.5. Expression Pattern of BnPERK Gene Family in Response to Hormone Treatments

In order to further explore the function of BnPERKs during hormone responses, we investigated their expression patterns in both leaves and roots after different hormone treatments (Figure 6). Among the 50 identified BnPERK genes, only a small subset was expressed in leaves and roots. Most of these expressed genes were strongly induced in leaves within 0.5 h after indole acetic acid (IAA), l-aminocyclopropane-l-carboxylic acid (ACC), gibberellin acid (GA), trans-zeatin (TZ), or brassinolide (BL) treatments (Figure 6A). Additionally, four genes—BnPERK15A4, BnPERK15C3, BnPERK08A1, and BnPERK08C1—showed enhanced transcript levels at different time points after methyl jasmonate (MeJA) treatment in leaves. In contrast, their expression patterns in roots were distinct. Most genes showed enhanced expression levels after GA and ABA treatments but decreased expression levels after MeJA treatment (Figure 6B). Notably, BnPERK15A1 was strongly induced after MeJA treatment. Furthermore, three genes, BnPERK09A1, BnPERK09C1, and BnPERK04C1, which showed increased expression in leaves after IAA treatment, were also induced in roots.

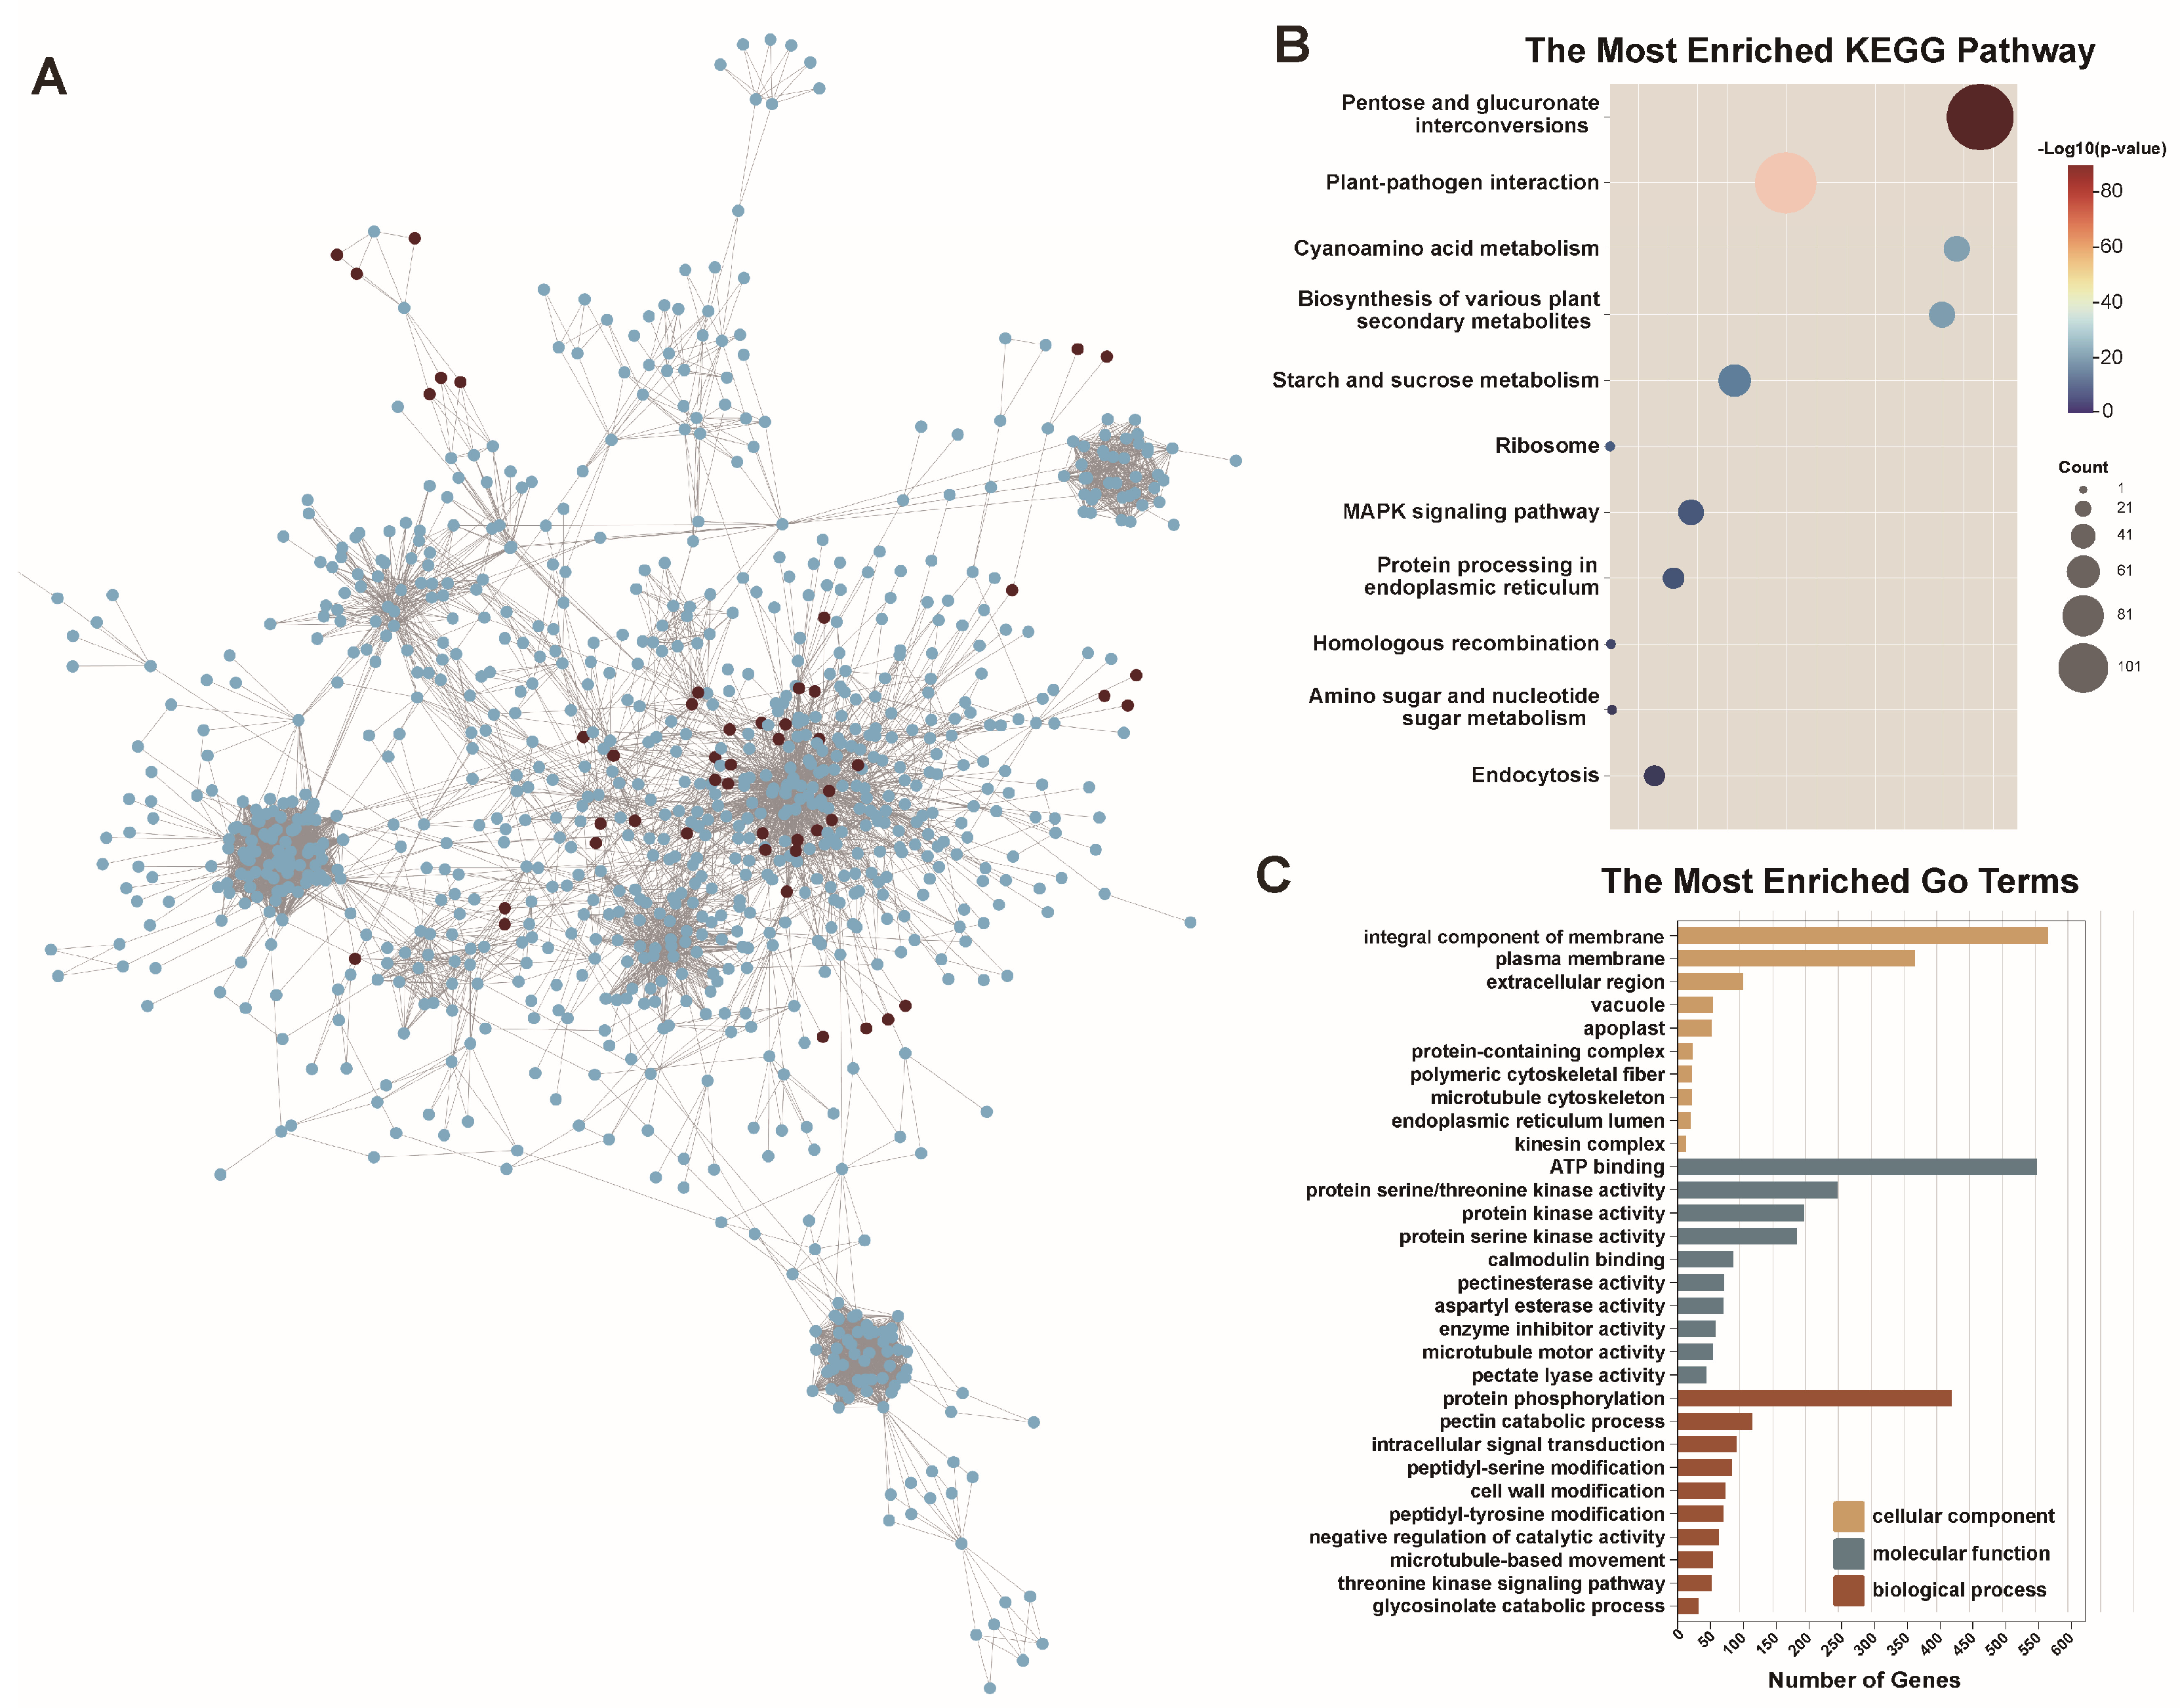
2.6. Protein–Protein Interaction Network Analysis of BnPERK Genes

Predictive interaction networks were employed to explore the biological mechanisms of BnPERK proteins. The analysis revealed that the BnPERK proteins putatively interact with 1133 proteins in B. napus. The results showed that most PERK proteins serve as core nodes in these networks, interacting with various proteins participating in different biological processes (Figure 7A and Supplementary Table S9).
KEGG enrichment analysis indicated that the interacting proteins were primarily involved in processes such as pentose and glucuronate interconversions, plant–pathogen interaction, starch and sucrose metabolism, cyanoamino acid metabolism, the biosynthesis of secondary metabolites, endoplasmic reticulum processing, and the MAPK signaling pathway (Figure 7B and Supplementary Table S10). Similarly, GO enrichment analysis revealed significant enrichment of terms like integral components of the membrane and plasma membrane in the cellular component category (Figure 7C and Supplementary Table S11). ATP binding and kinase activity were prominently enriched in the molecular function category. Biological process category terms such as protein phosphorylation, pectin catalytic activity, and cell wall modification were enriched. Protein interactions analysis provided a comprehensive view of the BnPERK proteins interaction network in B. napus, underscoring their central role and broad involvement in different biological processes, including sugar metabolism and plant–pathogen interaction.

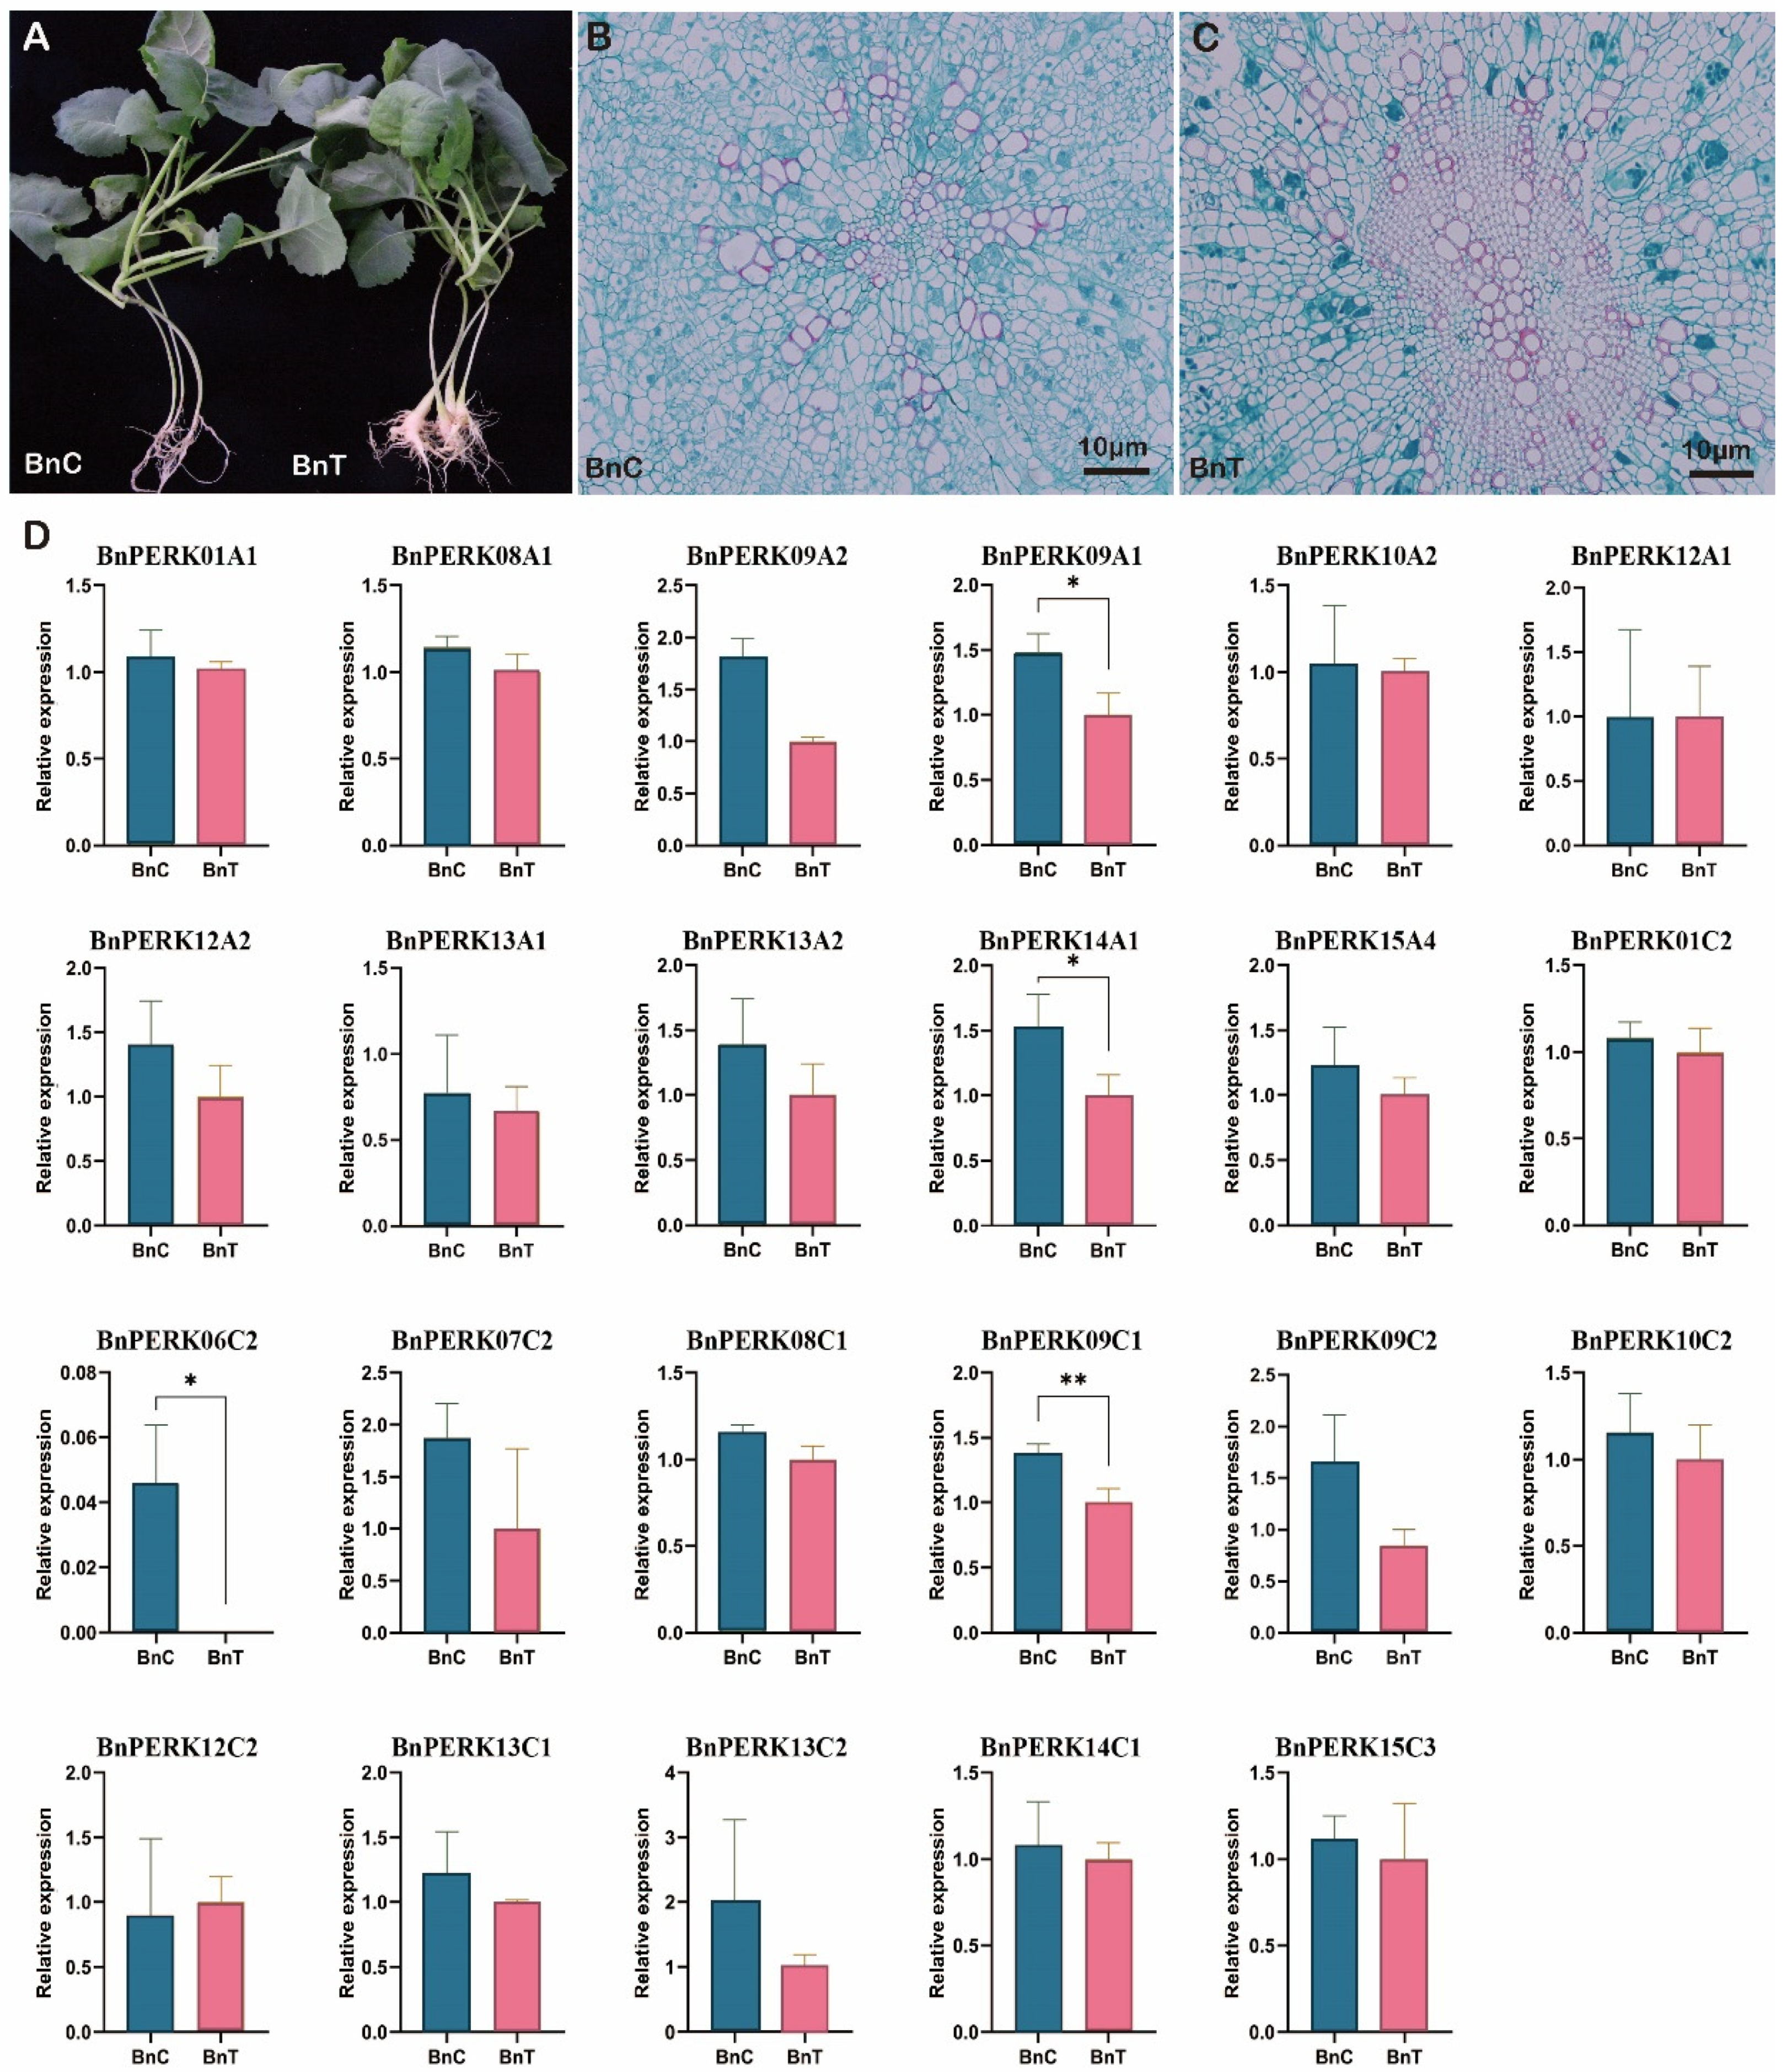
2.7. Root Gall Formation and BnPERK Gene Expression in B. napus upon Plasmodiophora brassicae Inoculation

Galls were observed on the roots of B. napus at 28 days after inoculation with P. brassicae (Figure 8A). Cross-sections of the inoculated roots revealed the changes in the vascular system. Resting spores that stained blue formed in the diseased roots. Furthermore, diseased root cells exhibited hypertrophy and disorder, accompanied by thickened cell walls, while control roots grew normally (Figure 8B). To better understand the response of BnPERK genes to clubroot disease, we analyzed the expression of BnPERK at 14 days after P. brassicae inoculation by RNA-Seq (Figure 8C). Among the 50 identified BnPERK genes, 23 were expressed in either inoculated or control roots. Notably, four genes, namely BnPERK09A1, BnPERK09C1, BnPERK14A1, and BnPERK06C2, showed downregulated expression in response to P. brassicae, among which BnPERK06C2 was completely inhibited after inoculation. Additionally, the paralogous gene pair BnPERK09A1/BnPERK09C1 also exhibited consistent expression patterns across different tissues. These four downregulated BnPERK genes were implicated in the response to P. brassicae.

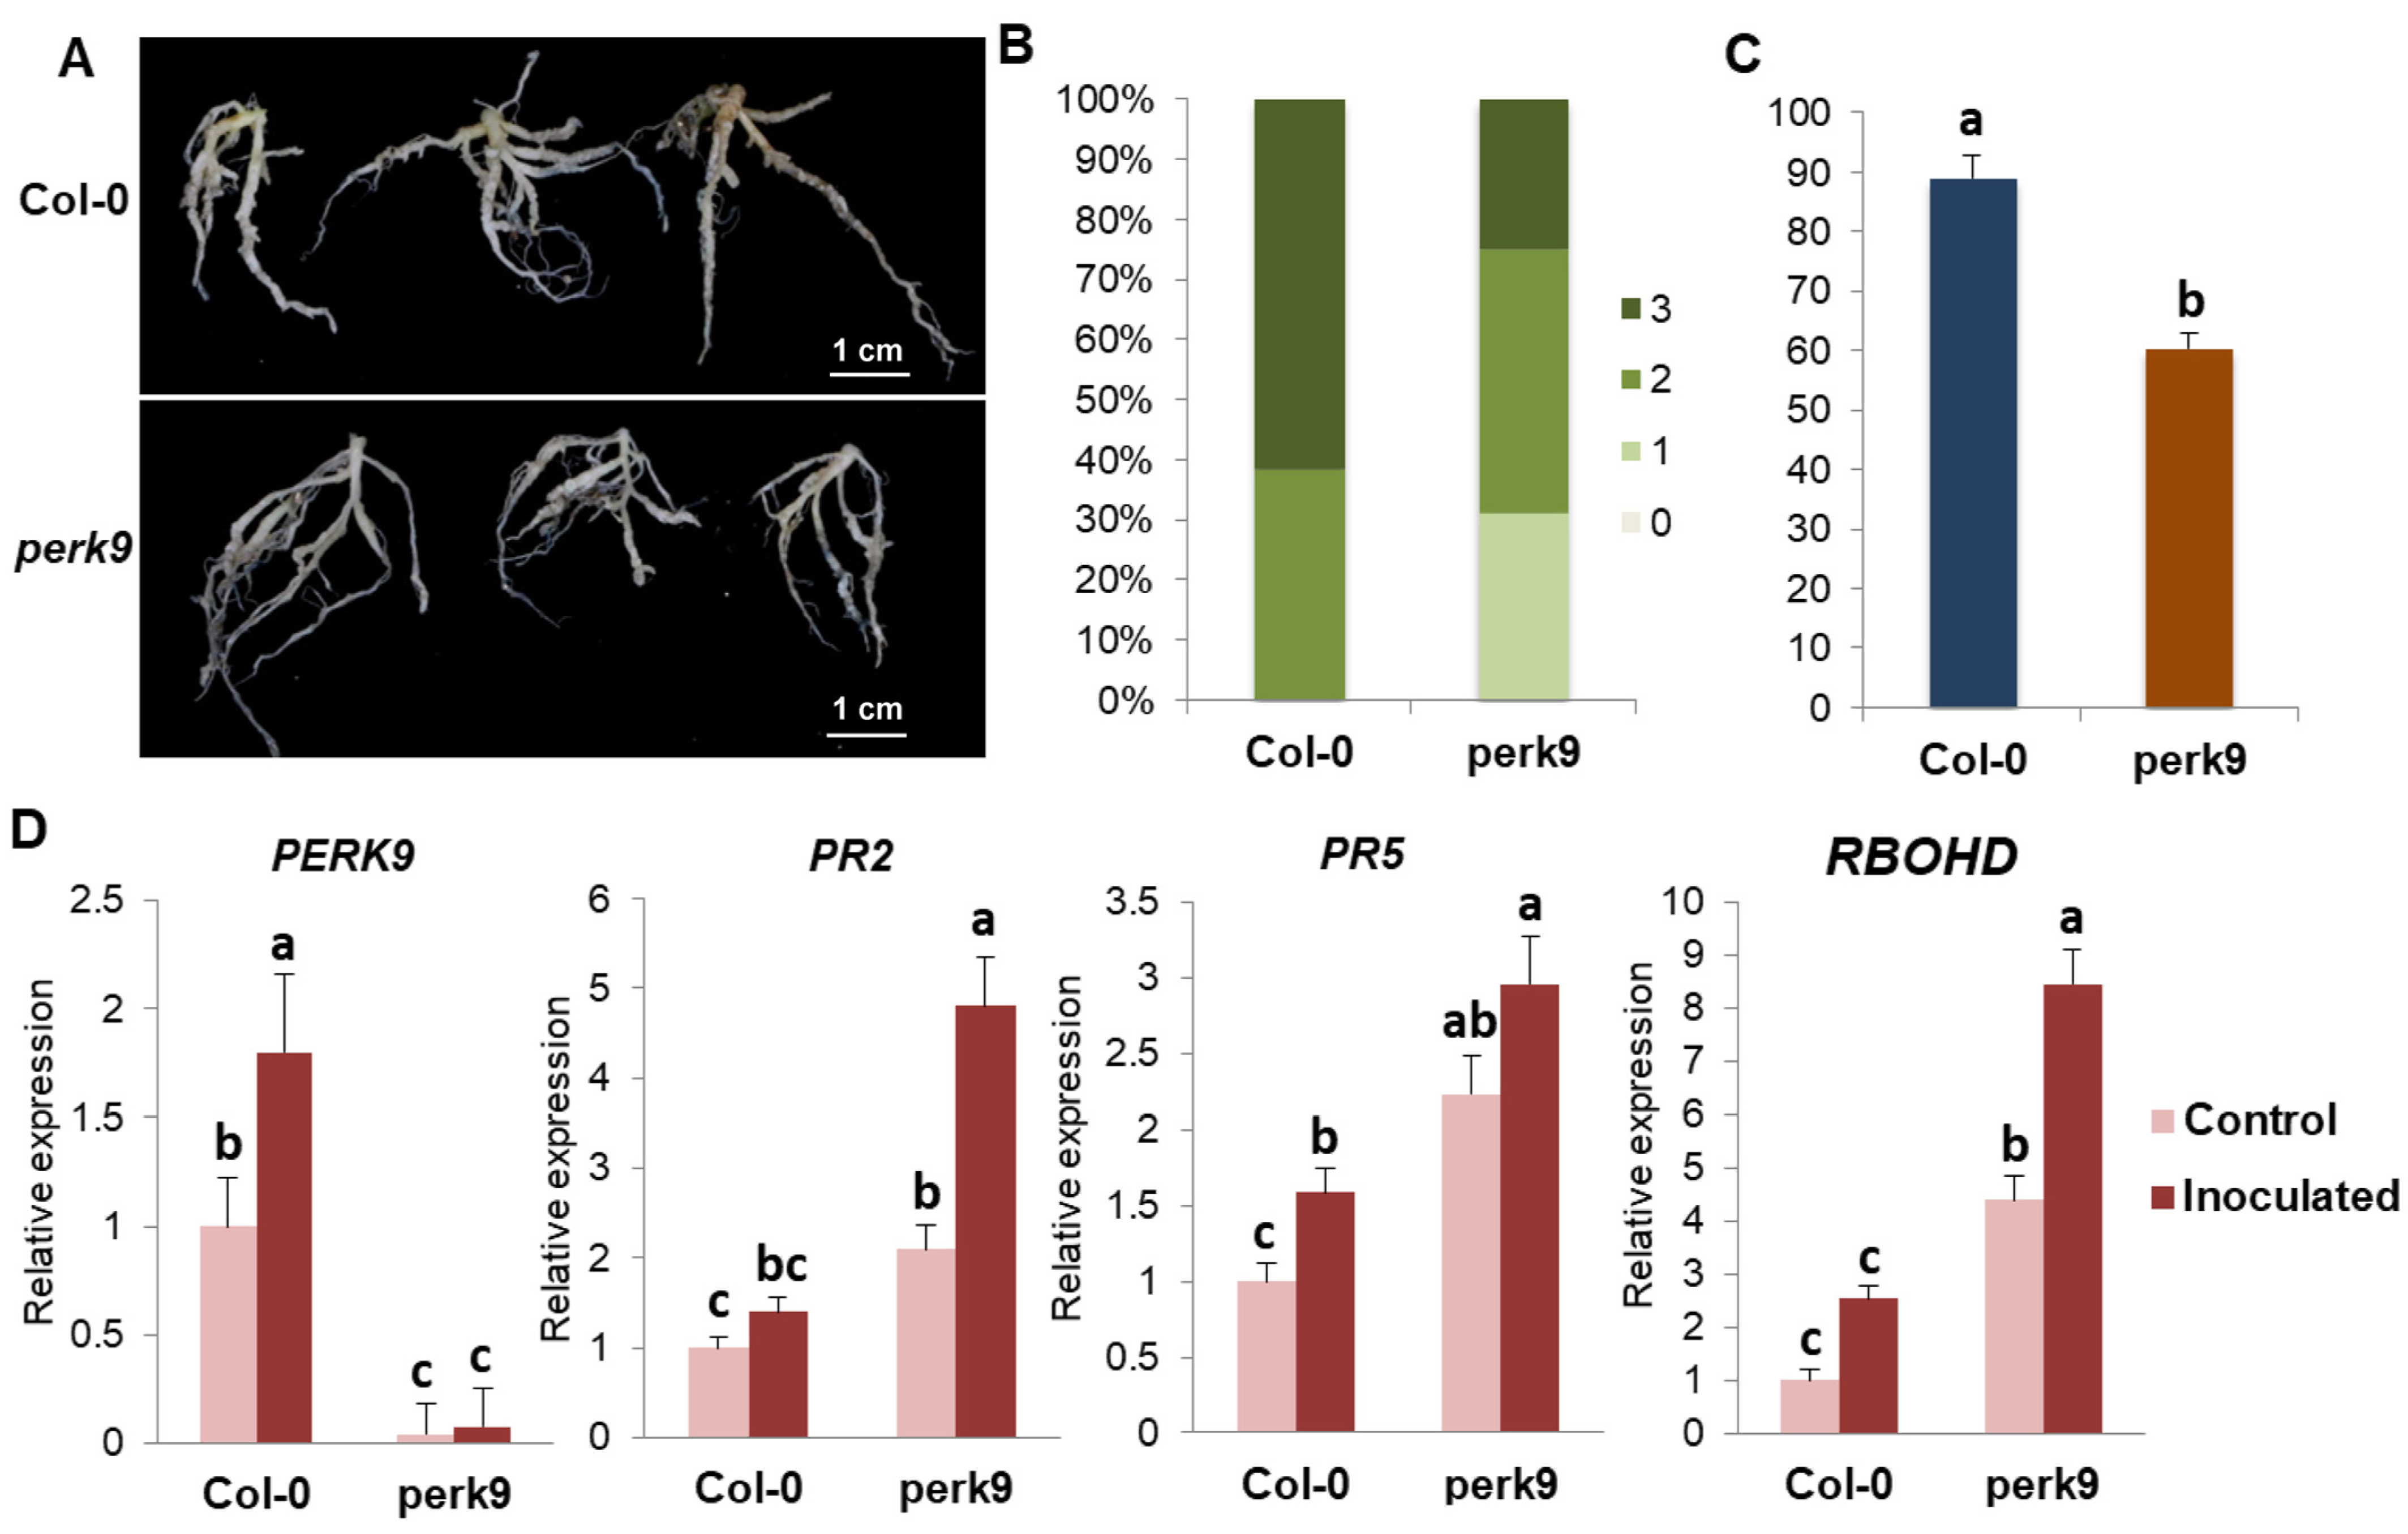
2.8. Function of AtPERK9 in Clubroot Disease

To explore the putative role of BnPERK09A1 and BnPERK09C1 in clubroot disease, the mutant of the orthologous gene AtPERK9 (At1g68690) was used for clubroot disease investigation. Both the Col-0 and perk9 showed disease symptoms on the main roots and the lateral roots (Figure 9A). The percentage of severely diseased plants (disease grade 3) in Col-0 was much higher than that in perk9, which resulted in a significantly higher disease index in Col-0 (Figure 9B,C). It indicated that perk9 showed decreased severity of the clubroot disease.
Furthermore, the expression levels of PERK9, PR2, PR5, and RBOHD were evaluated in Col-0 and perk9 lines at 14 days after P. brassicae inoculation. PERK9 also showed downregulated expression in response to P. brassicae in Col-0, while it was totally inhibited in perk9. The expressions of PR2, PR5, and RBOHD genes were greatly enhanced in perk9. PR2 and RBOHD not only could be induced in Col-0 after P. brassicae inoculation, but also in perk9. Enhanced disease resistance to clubroot disease and increased expression of these genes in perk9 indicated that the basal immune response was triggered by the knockout of PERK9.

3. Discussion

PERKs constitute a crucial subfamily of RLKs that play important roles in various molecular and cellular processes in plants, including development, signaling, and stress responses [5]. Despite their significance, there remains a lack of comprehensive study on the molecular functions of PERKs, particularly when compared with other RLKs. While genome-wide analyses of PERK genes have been conducted in some species [11,12,13,16,19], a thorough study of the BnPERK gene family has yet to be published. Therefore, this study systematically analyzed BnPERK genes, covering various aspects.

3.1. Deciphering the Evolutionary Dynamics of the BnPERK Genes

There were 50 PERK genes identified in the rapeseed cultivar ‘ZS11’ genome, highlighting an increased number of BnPERK genes compared with previous studies (Supplementary Table S3). This expansion of BnPERK genes was attributed to the evolutionary path of the Brassica genus, which experienced a genome triplication following its divergence from the Arabidopsis lineage [17,18]. Through interspecific hybridization between B. rapa (AA) and B. oleracea (CC), the allotetraploid B. napus (AACC) arose. This complex evolutionary process contributed to the expansion of the BnPERK gene family. Studies have consistently demonstrated that whole-genome duplication and segmental duplications are crucial mechanisms driving gene duplication and the expansion of gene families [20,21,22]. The prevalence of paralogous gene pairs resulting from segmental duplication highlights the role of genome duplication events in this expansion.
Initially, it was expected that each Arabidopsis gene would have six homologs in B. napus due to two recent duplication events. However, only 50 BnPERK genes were identified, suggesting a loss of duplicated BnPERK genes following Brassica genome triplication and hybridization. This indicated that gene loss was a crucial process during genomic arrangements and chromosome doubling [23]. This also implied a selective process, where functionally redundant BnPERK copies may have been lost, while the retained 50 BnPERK genes may be crucial for plant development, hormone signaling, and stress response.
Phylogenetic analysis revealed that most AtPERK genes corresponded to 2–6 orthologous genes in B. napus, each of which included orthologs from both the A and C subgenomes. However, some AtPERK genes showed variations in the number of corresponding orthologous genes from the A and C subgenomes, suggesting extensive chromosomal rearrangements and asymmetric gene loss within duplicated genomic blocks [17]. Analysis of Ka/Ks ratios of paralogous gene pairs indicated purifying selection on duplicated BnPERK genes, implying their functional conservation and evolutionary constraint at these loci [24].
Understanding the evolutionary dynamics of the BnPERK gene family not only enriches our knowledge of rapeseed genetics but also has broader implications for research in plant biology and stress-response mechanisms.

3.2. Exploring the Structural Diversity and Functional Roles of BnPERKs

The BnPERK gene family exhibited significant structural diversity, including variations in gene length, molecular weight, and isoelectric points. These variations suggested potential functional specialization within the gene family [25].
Although functional studies of BnPERKs are limited, expression profiling can still provide valuable insights about the gene’s function and its role in different biological processes [26]. In accordance with the result in A. thaliana, BnPERK family members exhibited two distinct expression patterns: some were highly expressed in pollen, while others had broader expression patterns [11]. Constitutive expression of certain BnPERK genes indicated their essential roles in fundamental cellular functions, while some BnPERKs exhibited higher expression levels in floral organs, which is consistent with findings in other species like A. thaliana, B. rapa, Triticum aestivum, and Oryza sativa and indicates their importance in floral development [11,12,16,19]. Specifically, 18 orthologs of AtPERK5, AtPERK6, AtPERK7, and AtPERK12 were notably expressed in pollen, among which AtPERK5 and AtPERK12 were shown to be essential for pollen tube growth [11,27]. Furthermore, certain B. rapa genes (orthologs of AtPERK6 and AtPERK12) were associated with male sterility, as they were downregulated in male-sterile mutants [19]. BnPERK01A1 and BnPERK01C1 (orthologs of AtPERK1) showed constitutively high expression, suggesting essential roles in fundamental cellular functions. Functional analysis of BnPERK1 indicated its role in regulating cell wall integrity, signaling in stress responses, and facilitating growth and development in Arabidopsis [15].
Phylogenetic analysis indicated that the BnPERK genes originated through segmental duplication [28]. Structural examination confirmed the phylogenetic arrangement, with most BnPERK genes sharing conserved motifs and tyrosine kinase domains. Differences in gene structure and cis-acting regulatory elements in promoters suggested evolutionary divergence, which may contribute to functional diversity and evolutionary mechanisms [29]. Analysis of the cis-element indicated that BnPERK genes were responsive to various stresses and hormone signaling pathways, with MeJA- and ABA-responsive elements being particularly abundant. This suggests that BnPERK genes could mediate diverse gene expression patterns and provide flexibility in stress responses [30].
Further study on the expression patterns of BnPERK genes in response to hormone treatments provided insights into their potential roles in hormone signaling and plant development. This rapid and robust response to IAA, ET, GA, CK, and BL suggested that BnPERK genes might play a crucial role in the early stages of hormonal signal transduction in leaves, possibly by mediating the downstream effects of these hormones. In contrast, the expression profiles in roots exhibited totally different expression patterns, which highlights the complexity and specificity of hormonal regulation in different tissues. Enhanced expression levels after GA and ABA treatments in roots suggest involvements in root growth and stress adaptation [31,32]. The contrasting expression patterns after MeJA treatment in roots and leaves imply distinct roles in different tissues. Additionally, the observation that genes such as BnPERK09A1, BnPERK09C1, and BnPERK04C1 were induced in both leaves and roots after IAA treatment implies a role in auxin signaling, which is central to various developmental processes, including cell elongation and differentiation [33]. These genes may act as intermediaries in auxin signal transduction pathways, influencing growth and development in a tissue-specific manner.
In summary, the comprehensive examination illuminates the structural diversity and functional implications of the BnPERK gene family. The differential expression patterns of BnPERK genes in response to various hormone treatments highlight their potential involvement in diverse physiological processes, including growth regulation, stress responses, and defense mechanisms.

3.3. Revealing the Role of BnPERK in Clubroot Disease

Recent studies have suggested that receptor-like kinases (RLKs) including PERKs are involved in plant–pathogen interactions and immune responses [2,3,4]. Analysis of cis-elements and expression profiles suggested that BnPERKs may act as novel sensors for various stresses, particularly plant pathogen infections [5,12]. Protein–protein interaction network analysis supported this result, revealing the multifunctionality of BnPERK proteins and emphasizing their broad participation in plant physiological processes specific to plant disease response [34]. The interactions involved cell wall organization, plant–pathogen interactions, plasma membrane dynamics, endomembrane activities, MAPK signaling pathways, and starch/sucrose metabolism. Given that pathogen-induced changes in cell walls affected disease resistance, it is possible that BnPERKs detect these alterations and initiate responses to maintain cell wall integrity [35]. The membrane localization of BnPERKs suggested they might perceive infection signals at the cell’s surface. Upon activation by cell wall components, BnPERKs likely trigger downstream signaling cascades, including MAPK pathways [36]. Otherwise, MAPK pathways also acted as downstream signaling components of hormones and played important roles in plant responses to different stresses [37]. Despite these insights, the exact role of BnPERKs in plant immunity remains largely unknown, and their interactions with RLKs or coreceptors remain largely unexplored.
Clubroot disease, caused by the obligate parasite P. brassicae, poses a significant threat to Brassicaceae plants [38]. The parasite is dependent on plant-derived sugars as a carbon source for colonization [39,40]. The enriched sugar metabolism reflects the altered homeostasis and increased demand for sugar in infected plants. However, the downstream signaling components and their regulation in response to P. brassicae infection are not yet clear. The PERK gene family, with its known functions in cell wall integrity and stress responses, may contribute to reinforcing the plant cell wall during pathogen infection or modulating defense-related signaling pathways [5]. Given the role of PERKs in disease response, the involvement of the PERK gene family in B. napus in clubroot disease was as expected. The transcriptional downregulation of BnPERK09A1, BnPERK09C1, BnPERK14A1, and BnPERK06C2 upon P. brassicae infection suggests their putative roles in clubroot disease response. In accordance with the result in B. napus, the expression of AtPERK9 was also downregulated in response to P. brassicae. The perk9 mutant was used for clubroot disease investigation, indicating the roles of BnPERK09A1 and BnPERK09C1 in the disease resistance. Pathogenesis-related proteins including enzymes like β-1,3-glucanase (PR2) and thionins (PR5), which have antimicrobial activity and are involved in the basal immune response [41]. The RBOHD (Respiratory burst oxidase homolog D) gene is crucial in generating reactive oxygen species (ROS) as part of the plant immune system [42]. The increased expression of these genes suggested that the knockout of AtPERK9 triggered the basal immune response, resulting in increased disease resistance in perk9. The induction of PR2 and RBOHD in both Col-0 and perk9 after inoculation suggested that basal immune response occurred in susceptible Col-0. Furthermore, the induction of BnPERK09A1 and BnPERK09C1 by IAA treatment was also particularly intriguing, as IAA is known to act as a signaling molecule potentially involved in the response to P. brassicae infection [43,44,45]. However, the exact roles of BnPERK09A1 and BnPERK09C1 need further function study. The predicted interaction proteins associated with these pathways implied their roles in mediating the interaction between B. napus and P. brassicae, providing targets for further functional characterization.
In summary, uncovering the role of BnPERKs in clubroot disease response provided valuable insights into plant–pathogen interactions and potential strategies for disease management.

4. Materials and Methods

4.1. Identification of BnPERK Genes in Brassica napus

The BnPERK gene family was selected in this study due to its critical role in plant growth, development, and stress responses. It has not been extensively studied in B. napus, making it a valuable target for genome-wide analysis. The genomic data and annotation for the B. napus cultivar ‘ZS11’ were sourced from B. napus multi-omics information resource (BnIR) (https://yanglab.hzau.edu.cn/BnIR, accessed on 1 March 2024) [46]. The PERK genes in B. napus were identified using BLASTp (https://blast.ncbi.nlm.nih.gov/) with an E-value threshold of 10−5, employing the protein sequence of 15 AtPERKs as queries [11]. The BnPERK gene family members were named based on their orthologous relationships and chromosomal location. By searching the conserved domain in InterPro (http://www.ebi.ac.uk/interpro, accessed on 5 March 2024) and the NCBI Conserved Domain Database (https://www.ncbi.nlm.nih.gov/Structure/cdd/wrpsb.cgi, accessed on 5 March 2024), the tyrosine kinase domain-containing protein sequences were verified for candidate BnPERK genes. Additionally, Expasy (https://web.expasy.org/protparam, accessed on 8 March 2024) was utilized to assess the isoelectric points (pIs) and the molecular weights (MWs) of BnPERK proteins. Subcellular locations of these proteins were predicted using Euk-mPLoc [47] (http://www.csbio.sjtu.edu.cn/bioinf/euk-multi-2, accessed on8 March 2024).

4.2. Chromosomal Location, Gene Duplication, and Phylogenetic Analysis

The positions of the BnPERK genes on the chromosomes were obtained from the annotation of the B. napus genome. McScanX (https://www.rcac.purdue.edu/software/mcscanx) was employed to detect the duplication patterns, including segmental and tandem duplication [48]. Visualization of chromosomal distribution and duplication events was represented using Circos (Vers. 0.69-9) software [49]. The Ka/Ks (nonsynonymous substitution rate to synonymous substitution rate) ratio was calculated for the paralogous gene pairs using ParaAT2.0 [50]. Collinearity analysis of BnPERK genes was conducted and displayed using TBtools (Vers. 2.056) [51]. A phylogenetic tree was generated using MEGA 11 [52] through neighbor-joining method with 1000 bootstrap replications and visualized using iTol (https://itol.embl.de, accessed on 11 March 2024).

4.3. Gene Structure, Conserved Motifs, and Cis-Elements Analysis

The exon–intron structure of PERK genes was examined using Gene Structure Display Server 2.0 (https://gsds.gao-lab.org/index.php/ accessed on 14 March 2024). Conserved motifs were predicted using Multiple Expectation Maximization for Motif Elicitation (https://meme-suite.org/meme/tools/meme, accessed on 14 March 2024). The sequences of 2 Kb upstream from the start codon of 50 BnPERK genes were extracted from the B. napus ‘ZS11’ genome and analyzed for cis-elements using PlantCARE [53] (http://bioinformatics.psb.ugent.be/webtools/plantcare/html, accessed on 14 March 2024) to predict cis-elements. The data were visualized using TBtools (Vers. 2.056) [51].

4.4. Expression Profiles of BnPERK Genes in Different Tissues and Under Hormone Treatments

To display different expression profiles, RNA-Seq data from various tissues and the hormone response of B. napus cultivar ‘ZS11’ were obtained from BnIR. A total of 14 tissues at different development stages included seed, leaf, bud, root, petal, sepal, pollen, silique, filament, cotyledon, lower stem peel, middle stem peel, upper stem peel, and vegetative rosette stages. The roots and leaves were treated with hormones (IAA, auxin; ACC, l-aminocyclopropane-l-carboxylic acid; GA, gibberellin acid; ABA, abscisic acid; TZ, trans-zeatin; JA, methyl jasmonate; BL, brassinolide) and sampled at 0.5, 1, 3, and 6 h after treatment. Heatmaps were generated using these expression values after logarithmic transformed RPKM values and displayed using TBtools (Vers. 2.056) [51].

4.5. Network-Based Prediction of Protein Interactions

Analysis of the protein–protein interaction network in B. napus was predicted using STRING (https://cn.string-db.org/, accessed on 15 March 2024), and the interactions were displayed using Cytoscape (Vers. 3.9.1) [54]. In order to investigate the biological process involving B. napus genes, the putative interacted genes based on Gene Ontology (GO) and Kyoto Encyclopedia of Genes and Genomes (KEGG) enrichment analyses were conducted by BnaOmics [55] (https://bnaomics.ocri-genomics.net/tools/enrich/, accessed on 15 March 2024).

4.6. Plasmodiophora Brassicae Inoculation, Clubroot Disease Investigation, and Histocytological Analysis

A collection of Plasmodiophora brassicae isolate from Zhijiang, Hubei, was used for inoculation in greenhouse. The seeds of B. napus cultivar ‘ZS11’, wild-type A. thaliana (Col-0), and AtPERK9 mutant were germinated in a greenhouse maintained at 24 °C under a 16/8 h light/dark photoperiod. Seven-day-old rapeseed seedlings were inoculated with resting spores of P. brassicae at a concentration of 10−6 spores/mL [56]. Two-week-old Arabidopsis seedlings were inoculated at a concentration of 10−5 spores/mL. The clubroot disease was investigated and photographed at 28–35 days after inoculation. The disease index was assessed using the following 0–3 scoring system: 0 refers to healthy roots; 1 refers to small galls on lateral roots only; 2 refers to small and medium galls covering the main root and a few lateral roots; 3 indicates large galls on the main root. The disease index (DI) was calculated according to the following formula: DI = 100 × (1 × N1 + 2 × N2 + 3 × N3)/3 × Nt. N1 to N3 refer to the number of plants in the indicated class, and Nt is the total number of plants tested.
The progression of cortex infection by P. brassicae was studied. Approximately 0.5 cm long root segments were excised from the upper of the primary root. Following standard protocols for fixation and dehydration, the samples were embedded in paraffin and sectioned at a thickness of 5–8 μM. Sections were analyzed and photographed using an optical microscope.

4.7. Transcriptome Analysis of BnPERK Genes in B. napus During Clubroot Disease

Root samples of B. napus infected with P. brassicae and uninfected controls were harvested at 14 days after treatment for RNA-Seq analysis. After sequencing and quality control, bioinformatics pipelines were using to clean raw sequencing data by removing adapters and low-quality reads. Then, the clean reads were aligned to the genome of ‘ZS11’. Gene expression levels were estimated using logarithmic transformed FPKM values. The differentially expressed genes (DEGs) between infected and control samples were determined with the DEGseq2 (adjusted p < 0.05 and |log2(fold-change)| ≥ 1) and displayed using TBtools (Vers. 2.056).

4.8. qRT-PCR Analysis of Pathogenesis-Related (PR) Genes in A. thaliana

Root samples from Arabidopsis Col-0 and perk9 infected with P. brassicae and uninfected controls were harvested at 14 days after inoculation for qRT-PCR study. Total RNA was extracted from control and inoculated roots using the FastPure Universal Plant Total RNA Isolation Kit (Vazyme, Nanjing, China). First-strand cDNA was synthesized with HiScript IV RT SuperMix for qPCR (Vazyme). Gene-specific primers are listed in Supplementary Table S1. Actin2 was used as reference gene. After running the qRT-PCR reactions, Ct (cycle threshold) values were obtained for each sample. The relative expression level was determined using the 2−ΔΔCt method [57]. The data were presented as the mean ± standard error (SE) based on three technical replicates of three biological replicates. Significant difference was determined at a p-value < 0.05.

5. Conclusions

The study emphasized the evolutionary dynamics, structural diversity, and functional roles of the BnPERK gene family. It suggested that BnPERK genes are involved in various physiological processes, including growth regulation, stress responses, and the defense against pathogens. The transcriptional downregulation of BnPERK09A1 and BnPERK09C1 upon P. brassicae infection and the potential involvement of these genes in clubroot disease response further emphasize their significance in plant immunity. The identification of BnPERK09A1 and BnPERK09C1 as potential targets for disease management strategies and their putative role in signaling networks could contribute to the resistance improvement of Brassicaceae crops.

Supplementary Materials

The following supporting information can be downloaded at: https://www.mdpi.com/article/10.3390/ijms26062685/s1.

Author Contributions

Validation, L.R.; Investigation, Z.Z., T.F. and C.Z.; Resources, L.Z.; Data curation, Z.Z.; Writing–original draft, Z.Z. and L.X.; Writing–review & editing, L.X.; Visualization, Z.Z. and T.F.; Supervision, C.T. and L.L.; Project administration, F.L.; Funding acquisition, C.T. and L.X. All authors have read and agreed to the published version of the manuscript.

Funding

This research was supported by the National Key Research and Development Program of China (2023YFF1000700), the National Natural Science Foundation of China (32370693), and the Innovation Program of Chinese Academy of Agricultural Sciences (CAAS-CSIAF-202402).

Institutional Review Board Statement

Not applicable.

Informed Consent Statement

Not applicable.

Data Availability Statement

Data are contained within the article and Supplementary Materials.

Conflicts of Interest

The authors declare no conflict of interest.

References

  1. Morris, E.R.; Walker, J.C. Receptor-like protein kinases: The keys to response. Curr. Opin. Plant Biol. 2003, 6, 339–342. [Google Scholar] [CrossRef]
  2. Cui, Y.W.; Lu, X.T.; Gou, X.P. Receptor-like protein kinases in plant reproduction: Current understanding and future perspectives. Plant Commun. 2022, 3, 100273. [Google Scholar] [CrossRef]
  3. Wu, Y.; Zhou, J.M. Receptor-like kinases in plant innate immunity. J. Integr. Plant Biol. 2013, 55, 1271–1286. [Google Scholar] [CrossRef]
  4. Dievart, A.; Gottin, C.; Périn, C.; Ranwez, V.; Chantret, N. Origin and Diversity of Plant Receptor-Like Kinases. Annu. Rev. Plant Biol. 2020, 71, 131–156. [Google Scholar] [CrossRef]
  5. Invernizzi, M.; Hanemian, M.; Keller, J.; Libourel, C.; Roby, D. PERKing up our understanding of the proline-rich extensin-like receptor kinases, a forgotten plant receptor kinase family. New Phytol. 2022, 235, 875–884. [Google Scholar] [CrossRef]
  6. Bai, L.; Zhou, Y.; Song, C.P. Arabidopsis proline-rich extensin-like receptor kinase 4 modulates the early event toward abscisic acid response in root tip growth. Plant Signal. Behav. 2009, 4, 1075–1077. [Google Scholar] [CrossRef]
  7. Silva, N.F.; Goring, D.R. The proline-rich, extensin-like receptor kinase-1 (PERK1) gene is rapidly induced by wounding. Plant Mol. Biol. 2002, 50, 667–685. [Google Scholar] [CrossRef]
  8. Uemura, T.; Hachisu, M.; Desaki, Y.; Ito, A.; Hoshino, R.; Sano, Y.; Nozawa, A.; Mujiono, K.; Galis, I.; Yoshida, A.; et al. Soy and Arabidopsis receptor-like kinases respond to polysaccharide signals from Spodoptera species and mediate herbivore resistance. Commun. Biol. 2020, 3, 224. [Google Scholar] [CrossRef]
  9. Xue, C.W.; Li, W.F.; Shen, R.F.; Lan, P. PERK13 modulates phosphate deficiencyinduced root hair elongation in Arabidopsis. Plant Sci. 2021, 312, 111060. [Google Scholar] [CrossRef] [PubMed]
  10. Bai, L.; Zhang, G.Z.; Zhou, Y.; Zhang, Z.P.; Wang, W.; Du, Y.Y.; Wu, Z.Y.; Song, C.P. Plasma membrane-associated proline-rich extensin-like receptor kinase 4, a novel regulator of Ca signalling, is required for abscisic acid responses in. Plant J. 2009, 60, 314–327. [Google Scholar] [CrossRef]
  11. Nakhamchik, A.; Zhao, Z.Y.; Provart, N.J.; Shiu, S.H.; Keatley, S.K.; Cameron, R.K.; Goring, D.R. A comprehensive expression analysis of the Arabidopsis proline-rich extensin-like receptor kinase gene family using bioinformatic and experimental approaches. Plant Cell Physiol. 2004, 45, 1875–1881. [Google Scholar] [CrossRef]
  12. Kesawat, M.S.; Kherawat, B.S.; Singh, A.; Dey, P.; Routray, S.; Mohapatra, C.; Saha, D.; Ram, C.; Siddique, K.H.M.; Kumar, A.; et al. Genome-wide analysis and characterization of the proline-rich extensin-like receptor kinases (PERKs) gene family reveals their role in different developmental stages and stress conditions in wheat (Triticum aestivum L.). Plants 2022, 11, 496. [Google Scholar] [CrossRef]
  13. Qanmber, G.; Liu, J.; Yu, D.Q.; Liu, Z.; Lu, L.L.; Mo, H.J.; Ma, S.Y.; Wang, Z.; Yang, Z.R. Genome-wide identification and characterization of the PERK gene family in Gossypium hirsutum reveals gene duplication and functional divergence. Int. J. Mol. Sci. 2019, 20, 1750. [Google Scholar] [CrossRef]
  14. Feng, P.; Shi, J.Q.; Zhang, T.; Zhong, Y.Q.; Zhang, L.S.; Yu, G.L.; Zhang, T.Q.; Zhu, X.Y.; Xing, Y.D.; Yin, W.Z.; et al. Zebra leaf 15, a receptor-like protein kinase involved in moderate low temperature signaling pathway in rice. Rice 2019, 12, 83. [Google Scholar] [CrossRef]
  15. Haffani, Y.Z.; Silva-Gagliardi, N.F.; Sewter, S.K.; Aldea, M.G.; Zhao, Z.Y.; Nakhamchik, A.; Cameron, R.K.; Goring, D.R. Altered expression of PERK receptor kinases in leads to changes in Arabidopsis growth and floral organ formation. Plant Signal. Behav. 2006, 1, 251–260. [Google Scholar] [CrossRef]
  16. Kesawat, M.S.; Kherawat, B.S.; Katara, J.L.; Parameswaran, C.; Misra, N.; Kumar, M.; Chung, S.M.; Alamri, S.; Siddiqui, M.H. Genome-wide analysis of proline-rich extensin-like receptor kinases (PERKs) gene family reveals their roles in plant development and stress conditions in Oryza sativa L. Plant Sci. 2023, 334, 111749. [Google Scholar] [CrossRef]
  17. Chalhoub, B.; Denoeud, F.; Liu, S.Y.; Parkin, I.A.P.; Tang, H.B.; Wang, X.Y.; Chiquet, J.; Belcram, H.; Tong, C.B.; Samans, B.; et al. Early allopolyploid evolution in the post-Neolithic Brassica napus oilseed genome. Science 2014, 345, 950–953. [Google Scholar] [CrossRef]
  18. Song, X.M.; Wei, Y.P.; Xiao, D.; Gong, K.; Sun, P.C.; Ren, Y.M.; Yuan, J.Q.; Wu, T.; Yang, Q.H.; Li, X.Y.; et al. Genome characterization clarifies U’s triangle model of evolution and polyploidy in Brassica. Plant Physiol. 2021, 186, 388–406. [Google Scholar] [CrossRef]
  19. Chen, G.H.; Wang, J.; Wang, H.; Wang, C.G.; Tang, X.Y.; Li, J.; Zhang, L.; Song, J.H.; Hou, J.F.; Yuan, L.Y. Genome-wide analysis of proline-rich extension-like receptor protein kinase (PERK) in Brassica rapa and its association with the pollen development. BMC Genom. 2020, 21, 401. [Google Scholar] [CrossRef]
  20. Gu, B.J.; Tong, Y.K.; Wang, Y.Y.; Zhang, M.L.; Ma, G.J.; Wu, X.Q.; Zhang, J.F.; Xu, F.; Li, J.; Ren, F. Genome-wide evolution and expression analysis of the MYB-CC gene family in Brassica spp. PeerJ 2022, 10, e12882. [Google Scholar] [CrossRef]
  21. Roy, B.C.; Shukla, N.; Gachhui, R.; Mukherjee, A. Genome-wide analysis of glutamate receptor gene family in allopolyploid Brassica napus and its diploid progenitors. Genetica 2023, 151, 293–310. [Google Scholar] [CrossRef] [PubMed]
  22. Xie, M.L.; Zuo, R.; Bai, Z.T.; Yang, L.L.; Zhao, C.J.; Gao, F.; Cheng, X.H.; Huang, J.Y.; Liu, Y.Y.; Li, Y.; et al. Genome-wide characterization of serine/arginine-rich gene family and its genetic effects on agronomic traits of Brassica napus. Front. Plant Sci. 2022, 13, 829668. [Google Scholar] [CrossRef]
  23. Albalat, R.; Cañestro, C. Evolution by gene loss. Nat. Rev. Genet. 2016, 17, 379–391. [Google Scholar] [CrossRef] [PubMed]
  24. Liu, J.F.; Zhang, Y.; Lei, X.Y.; Zhang, Z.M. Natural selection of protein structural and functional properties: A single nucleotide polymorphism perspective. Genome Biol. 2008, 9, R69. [Google Scholar] [CrossRef]
  25. Barberis, E.; Marengo, E.; Manfredi, M. Protein subcellular localization prediction. Methods Mol. Biol. 2021, 2361, 197–212. [Google Scholar]
  26. Zhang, C.X.; Freddolino, P.L.; Zhang, Y. COFACTOR: Improved protein function prediction by combining structure, sequence and protein-protein interaction information. Nucleic Acids Res. 2017, 45, 291–299. [Google Scholar] [CrossRef]
  27. Borassi, C.; Sede, A.R.; Mecchia, M.A.; Mangano, S.; Marzol, E.; Denita-Juarez, S.P.; Salter, J.D.S.; Velasquez, S.M.; Muschietti, J.P.; Estevez, J.M. Proline-rich extensin-like receptor kinases PERK5 and PERK12 are involved in pollen tube growth. FEBS Lett. 2021, 595, 2593–2607. [Google Scholar] [CrossRef]
  28. Parkin, I.A.P.; Gulden, S.M.; Sharpe, A.G.; Lukens, L.; Trick, M.; Osborn, T.C.; Lydiate, D.J. Segmental structure of the genome based on comparative analysis with Arabidopsis thaliana. Genetics 2005, 171, 765–781. [Google Scholar] [CrossRef]
  29. Lukens, L.N.; Quijada, P.A.; Udall, J.; Pires, J.C.; Schranz, M.E.; Osborn, T.C. Genome redundancy and plasticity within ancient and recent Brassica crop species. Biol. J. Linn. Soc. 2004, 82, 665–674. [Google Scholar] [CrossRef]
  30. Wittkopp, P.J.; Kalay, G. Cis-regulatory elements: Molecular mechanisms and evolutionary processes underlying divergence. Nat. Rev. Genet. 2012, 13, 59–69. [Google Scholar] [CrossRef] [PubMed]
  31. Bulgakov, V.P.; Wu, H.C.; Jinn, T.L. Coordination of ABA and chaperone signaling in plant stress responses. Trends Plant Sci. 2019, 24, 636–651. [Google Scholar] [CrossRef] [PubMed]
  32. Wu, K.; Xu, H.; Gao, X.H.; Fu, X.D. New insights into gibberellin signaling in regulating plant growth-metabolic coordination. Curr. Opin. Plant Biol. 2021, 63, 102074. [Google Scholar] [CrossRef]
  33. Gomes, G.L.B.; Scortecci, K.C. Auxin and its role in plant development: Structure, signalling, regulation and response mechanisms. Plant Biol. 2021, 23, 894–904. [Google Scholar] [CrossRef] [PubMed]
  34. Wimalagunasekara, S.S.; Weeraman, J.W.J.K.; Tirimanne, S.; Fernando, P.C. Protein-protein interaction (PPI) network analysis reveals important hub proteins and sub-network modules for root development in rice (Oryza sativa). J. Genet. Eng. Biotechnol. 2023, 21, 69. [Google Scholar] [CrossRef]
  35. Borassi, C.; Sede, A.R.; Mecchia, M.A.; Salter, J.D.S.; Marzol, E.; Muschietti, J.P.; Estevez, J.M. An update on cell surface proteins containing extensin-motifs. J. Exp. Bot. 2016, 67, 477–487. [Google Scholar] [CrossRef]
  36. Bacete, L.; Mélida, H.; Miedes, E.; Molina, A. Plant cell wall-mediated immunity: Cell wall changes trigger disease resistance responses. Plant J. 2018, 93, 614–636. [Google Scholar] [CrossRef] [PubMed]
  37. Raja, V.; Majeed, U.; Kang, H.; Andrabi, K.I.; John, R. Abiotic stress: Interplay between ROS, hormones and MAPKs. Environ. Exp. Bot. 2017, 137, 142–157. [Google Scholar] [CrossRef]
  38. Chen, W.; Li, Y.; Yan, R.B.; Ren, L.; Liu, F.; Zeng, L.Y.; Sun, S.N.; Yang, H.H.; Chen, K.R.; Xu, L.; et al. SnRK1.1-mediated resistance of Arabidopsis thaliana to clubroot disease is inhibited by the novel Plasmodiophora brassicae effector PBZF1. Mol. Plant Pathol. 2021, 22, 1057–1069. [Google Scholar] [CrossRef]
  39. Kemen, E.; Jones, J.D.G. Obligate biotroph parasitism: Can we link genomes to lifestyles? Trends Plant Sci. 2012, 17, 448–457. [Google Scholar] [CrossRef]
  40. Kong, L.; Li, X.; Zhan, Z.; Piao, Z. Sugar transporters in Plasmodiophora brassicae: Genome-wide identification and functional verification. Int. J. Mol. Sci. 2022, 23, 5264. [Google Scholar] [CrossRef]
  41. Ali, S.; Ganai, B.A.; Kamili, A.N.; Bhat, A.A.; Mir, Z.A.; Bhat, J.A.; Tyagi, A.; Islam, S.T.; Mushtaq, M.; Yadav, P.; et al. Pathogenesis-related proteins and peptides as promising tools for engineering plants with multiple stress tolerance. Microbiol. Res. 2018, 212, 29–37. [Google Scholar] [CrossRef] [PubMed]
  42. Lee, D.; Lal, N.K.; Lin, Z.J.D.; Ma, S.S.; Liu, J.; Castro, B.; Toruño, T.; Dinesh-Kumar, S.P.; Coaker, G. Regulation of reactive oxygen species during plant immunity through phosphorylation and ubiquitination of RBOHD. Nat. Commun. 2020, 11, 1838. [Google Scholar] [CrossRef] [PubMed]
  43. Ludwig-Muller, J. Auxin homeostasis, signaling, and interaction with other growth hormones during the clubroot disease of Brassicaceae. Plant Signal. Behav. 2014, 9, e28593. [Google Scholar] [CrossRef] [PubMed]
  44. Xu, L.; Ren, L.; Chen, K.R.; Liu, F.; Fang, X.P. Putative role of IAA during the early response of Brassica napus L. to Plasmodiophora brassicae. Eur. J. Plant Pathol. 2016, 145, 601–613. [Google Scholar] [CrossRef]
  45. Wei, X.C.; Liao, R.J.; Zhang, X.W.; Zhao, Y.Y.; Xie, Z.Q.; Yang, S.J.; Su, H.A.; Wang, Z.Y.; Zhang, L.Y.; Tian, B.M.; et al. Integrative transcriptome, miRNAs, degradome, and phytohormone analysis of Brassica rapa L. in response to Plasmodiophora brassicae. Int. J. Mol. Sci. 2023, 24, 2652. [Google Scholar] [CrossRef]
  46. Yang, Z.Q.; Wang, S.B.; Wei, L.L.; Huang, Y.M.; Liu, D.X.; Jia, Y.P.; Luo, C.F.; Lin, Y.C.; Liang, C.Y.; Hu, Y.; et al. BnIR: A multi-omics database with various tools for research and breeding. Mol. Plant 2023, 16, 775–789. [Google Scholar] [CrossRef]
  47. Chou, K.C.; Shen, H.B. A new method for predicting the subcellular localization of eukaryotic proteins with both single and multiple sites: Euk-mPLoc 2.0. PLoS ONE 2010, 5, e9931. [Google Scholar] [CrossRef]
  48. Wang, Y.P.; Tang, H.B.; Wang, X.Y.; Sun, Y.; Joseph, P.V.; Paterson, A.H. Detection of colinear blocks and synteny and evolutionary analyses based on utilization of MCScanX. Nat. Protoc. 2024, 19, 2206–2229. [Google Scholar] [CrossRef]
  49. Krzywinski, M.; Schein, J.; Birol, I.; Connors, J.; Gascoyne, R.; Horsman, D.; Jones, S.J.; Marra, M.A. Circos: An information aesthetic for comparative genomics. Genome Res. 2009, 19, 1639–1645. [Google Scholar] [CrossRef]
  50. Zhang, Z.; Xiao, J.F.; Wu, J.Y.; Zhang, H.Y.; Liu, G.M.; Wang, X.M.; Dai, L. ParaAT: A parallel tool for constructing multiple protein-coding DNA alignments. Biochem. Biophys. Res. Commun. 2012, 419, 779–781. [Google Scholar] [CrossRef]
  51. Chen, C.J.; Wu, Y.; Li, J.W.; Wang, X.; Zeng, Z.H.; Xu, J.; Liu, Y.L.; Feng, J.T.; Chen, H.; He, Y.H.; et al. TBtools-II: A “one for all, all for one” bioinformatics platform for biological big-data mining. Mol. Plant 2023, 16, 1733–1742. [Google Scholar] [CrossRef] [PubMed]
  52. Tamura, K.; Stecher, G.; Kumar, S. MEGA11 Molecular Evolutionary Genetics Analysis Version 11. Mol. Biol. Evol. 2021, 38, 3022–3027. [Google Scholar] [CrossRef]
  53. Lescot, M.; Déhais, P.; Thijs, G.; Marchal, K.; Moreau, Y.; Van de Peer, Y.; Rouzé, P.; Rombauts, S. PlantCARE, a database of plant cis-acting regulatory elements and a portal to tools for in silico analysis of promoter sequences. Nucleic Acids Res. 2002, 30, 325–327. [Google Scholar] [CrossRef] [PubMed]
  54. Otasek, D.; Morris, J.H.; Bouças, J.; Pico, A.R.; Demchak, B. Cytoscape Automation: Empowering workflow-based network analysis. Genome Biol. 2019, 20, 185. [Google Scholar] [CrossRef]
  55. Cui, X.B.; Hu, M.; Yao, S.L.; Zhang, Y.Y.; Tang, M.Q.; Liu, L.J.; Cheng, X.H.; Tong, C.B.; Liu, S.Y. BnaOmics: A comprehensive platform combining pan-genome and multi-omics data from Brassica napus. Plant Commun. 2023, 4, 100609. [Google Scholar] [CrossRef] [PubMed]
  56. Xu, L.; Yang, H.; Ren, L.; Chen, W.; Liu, L.J.; Liu, F.; Zeng, L.Y.; Yan, R.B.; Chen, K.R.; Fang, X.P. Jasmonic acid-mediated aliphatic glucosinolate metabolism is involved in clubroot disease development in Brassica napus L. Front. Plant Sci. 2018, 9, 750. [Google Scholar] [CrossRef]
  57. Pfaffl, M.W. A new mathematical model for relative quantification in real-time RT-PCR. Nucleic Acids Res. 2001, 29, e45. [Google Scholar] [CrossRef]
Figure 1. Phylogenetic tree of the PERK gene family in B. napus and A. thaliana. The phylogenetic tree was constructed with 50 BnPERK protein sequences and 15 AtPERK protein sequences by MEGA11 using the maximum likelihood (ML) method. A total of 15 paralogs were identified, grouped into 15 distinct clusters, each represented by a different color (PERK1 to PERK15). Based on sequence similarity and functional domain analysis, the 15 paralogs were further categorized into four major groups, which are indicated by distinct colors (outer lane). Group I, light steel blue; Group II, cornflower blue; Group III, royal blue; Group IV, black.
Ijms 26 02685 g001
Figure 2. Chromosomal distribution and collinearity relationships of BnPERK genes. The locations of all the chromosomal BnPERK genes are shown in different chromosomes. The light green boxes stand for A subgenomes and dark green boxes stand for C subgenomes in Brassica napus. The light brown lines represent collinearity in BnPERK gene pairs.
Ijms 26 02685 g002
Figure 3. Phylogenetic tree, conserved motifs, and gene structure analysis of BnPERK gene family. A total of 14 paralogs were identified based on the phylogenetic tree, each represented by a different color. (A) Motif composition of BnPERK proteins, with motifs 1–10 displayed in different colored boxes. (B) Identification of the protein kinase domain in BnPERK proteins. (C) Exon–intron analysis of BnPERK genes, with yellow boxes representing un-translated regions (UTRs) and orange boxes represented coding sequences (CDSs).
Ijms 26 02685 g003
Figure 4. Cis-elements analysis of the BnPERK promoters. The cis-elements were predicted by analysis of 2 Kb upstream regions of BnPERK genes. They were categorized into four groups (A), including hormonal responses (B), biotic and abiotic stress (C), developmental processes (D), and promoter and enhancer regions, which are represented by different colors and further categorized.
Ijms 26 02685 g004
Figure 5. Expression profiles of the BnPERK gene family in various tissues of Brassica napus. The heatmap shows the expression of 50 BnPERK genes across 14 different tissues, processed with log2 normalization. The color gradient ranges from blue (indicating lower expression levels) to red (indicating higher expression levels), while the gray spots represent no detectable expression.
Ijms 26 02685 g005
Figure 6. Expression patterns of BnPERKs under hormone treatments in leaves (A) and roots (B). The heatmap displays the relative expression of BnPERKs at 0.5, 1, 3, and 6 h after treatment, derived from RNA-Seq analysis. IAA, indole acetic acid; GA, gibberellin acid; ABA, abscisic acid; ACC, l-aminocyclopropane-l-carboxylic acid; TZ, trans-zeatin; JA, methyl jasmonate; BL, brassinolide. Different dot colors represent different relative expression levels: red dot indicates up-regulated expression, blue dot indicates down-regulated expression, and the larger the dot, the greater the fold change.
Ijms 26 02685 g006
Figure 7. Proteins interacting with BnPERK proteins in Brassica napus. (A) Protein–protein interaction network of BnPERK proteins. Dark brown spots represent BnPERK proteins, blue spots represent proteins that interact with BnPERK proteins, and gray lines indicate the interaction between BnPERK proteins and other proteins. (B) KEGG enrichment analysis of proteins that interacted with BnPERK proteins. (C) GO enrichment analysis of proteins that interacted with BnPERK proteins.
Ijms 26 02685 g007
Figure 8. Disease symptoms, histocytological analysis, and PERK gene expression analysis in control and inoculated B. napus. (A) Symptoms of clubroot disease in control and inoculated roots at 28 days after inoculation. (B,C) Histocytological analysis of cross-sections of control and inoculated roots at 28 days after inoculation. (D) Expression patterns of 23 PERK genes at 14 days after inoculation with Plasmodiophora brassicae. Error bars represent the standard error of the means of the three replicates. Stars indicate significant differences in expression between control and inoculated roots (|log2 (fold-change)| > 1). *, p < 0.05; **, p < 0.01.
Ijms 26 02685 g008
Figure 9. Enhanced disease severity of clubroot disease in the mutant of AtPERK9. (A) Root phenotypes of wild-type A. thaliana (Col-0) and perk9 at 28 days after inoculation. (B) The occurrence of clubroot disease in Col-0 and perk9 was investigated according to the 0–3 scoring system. (C) Disease index of Col-0 and perk9. (D) Expression patterns of PERK9, PR2, PR5, and RBOHD genes in Col-0 and perk9 lines. Different letters represent significant differences (p < 0.05).
Ijms 26 02685 g009
Disclaimer/Publisher’s Note: The statements, opinions and data contained in all publications are solely those of the individual author(s) and contributor(s) and not of MDPI and/or the editor(s). MDPI and/or the editor(s) disclaim responsibility for any injury to people or property resulting from any ideas, methods, instructions or products referred to in the content.

