
Data-Driven Modeling and Design of Sustainable High Tg Polymers

 , , ,
, , ,
Abstract
1. Introduction
2. Results
2.1. Data
2.2. Data-Driven Modeling
2.3. Correlations
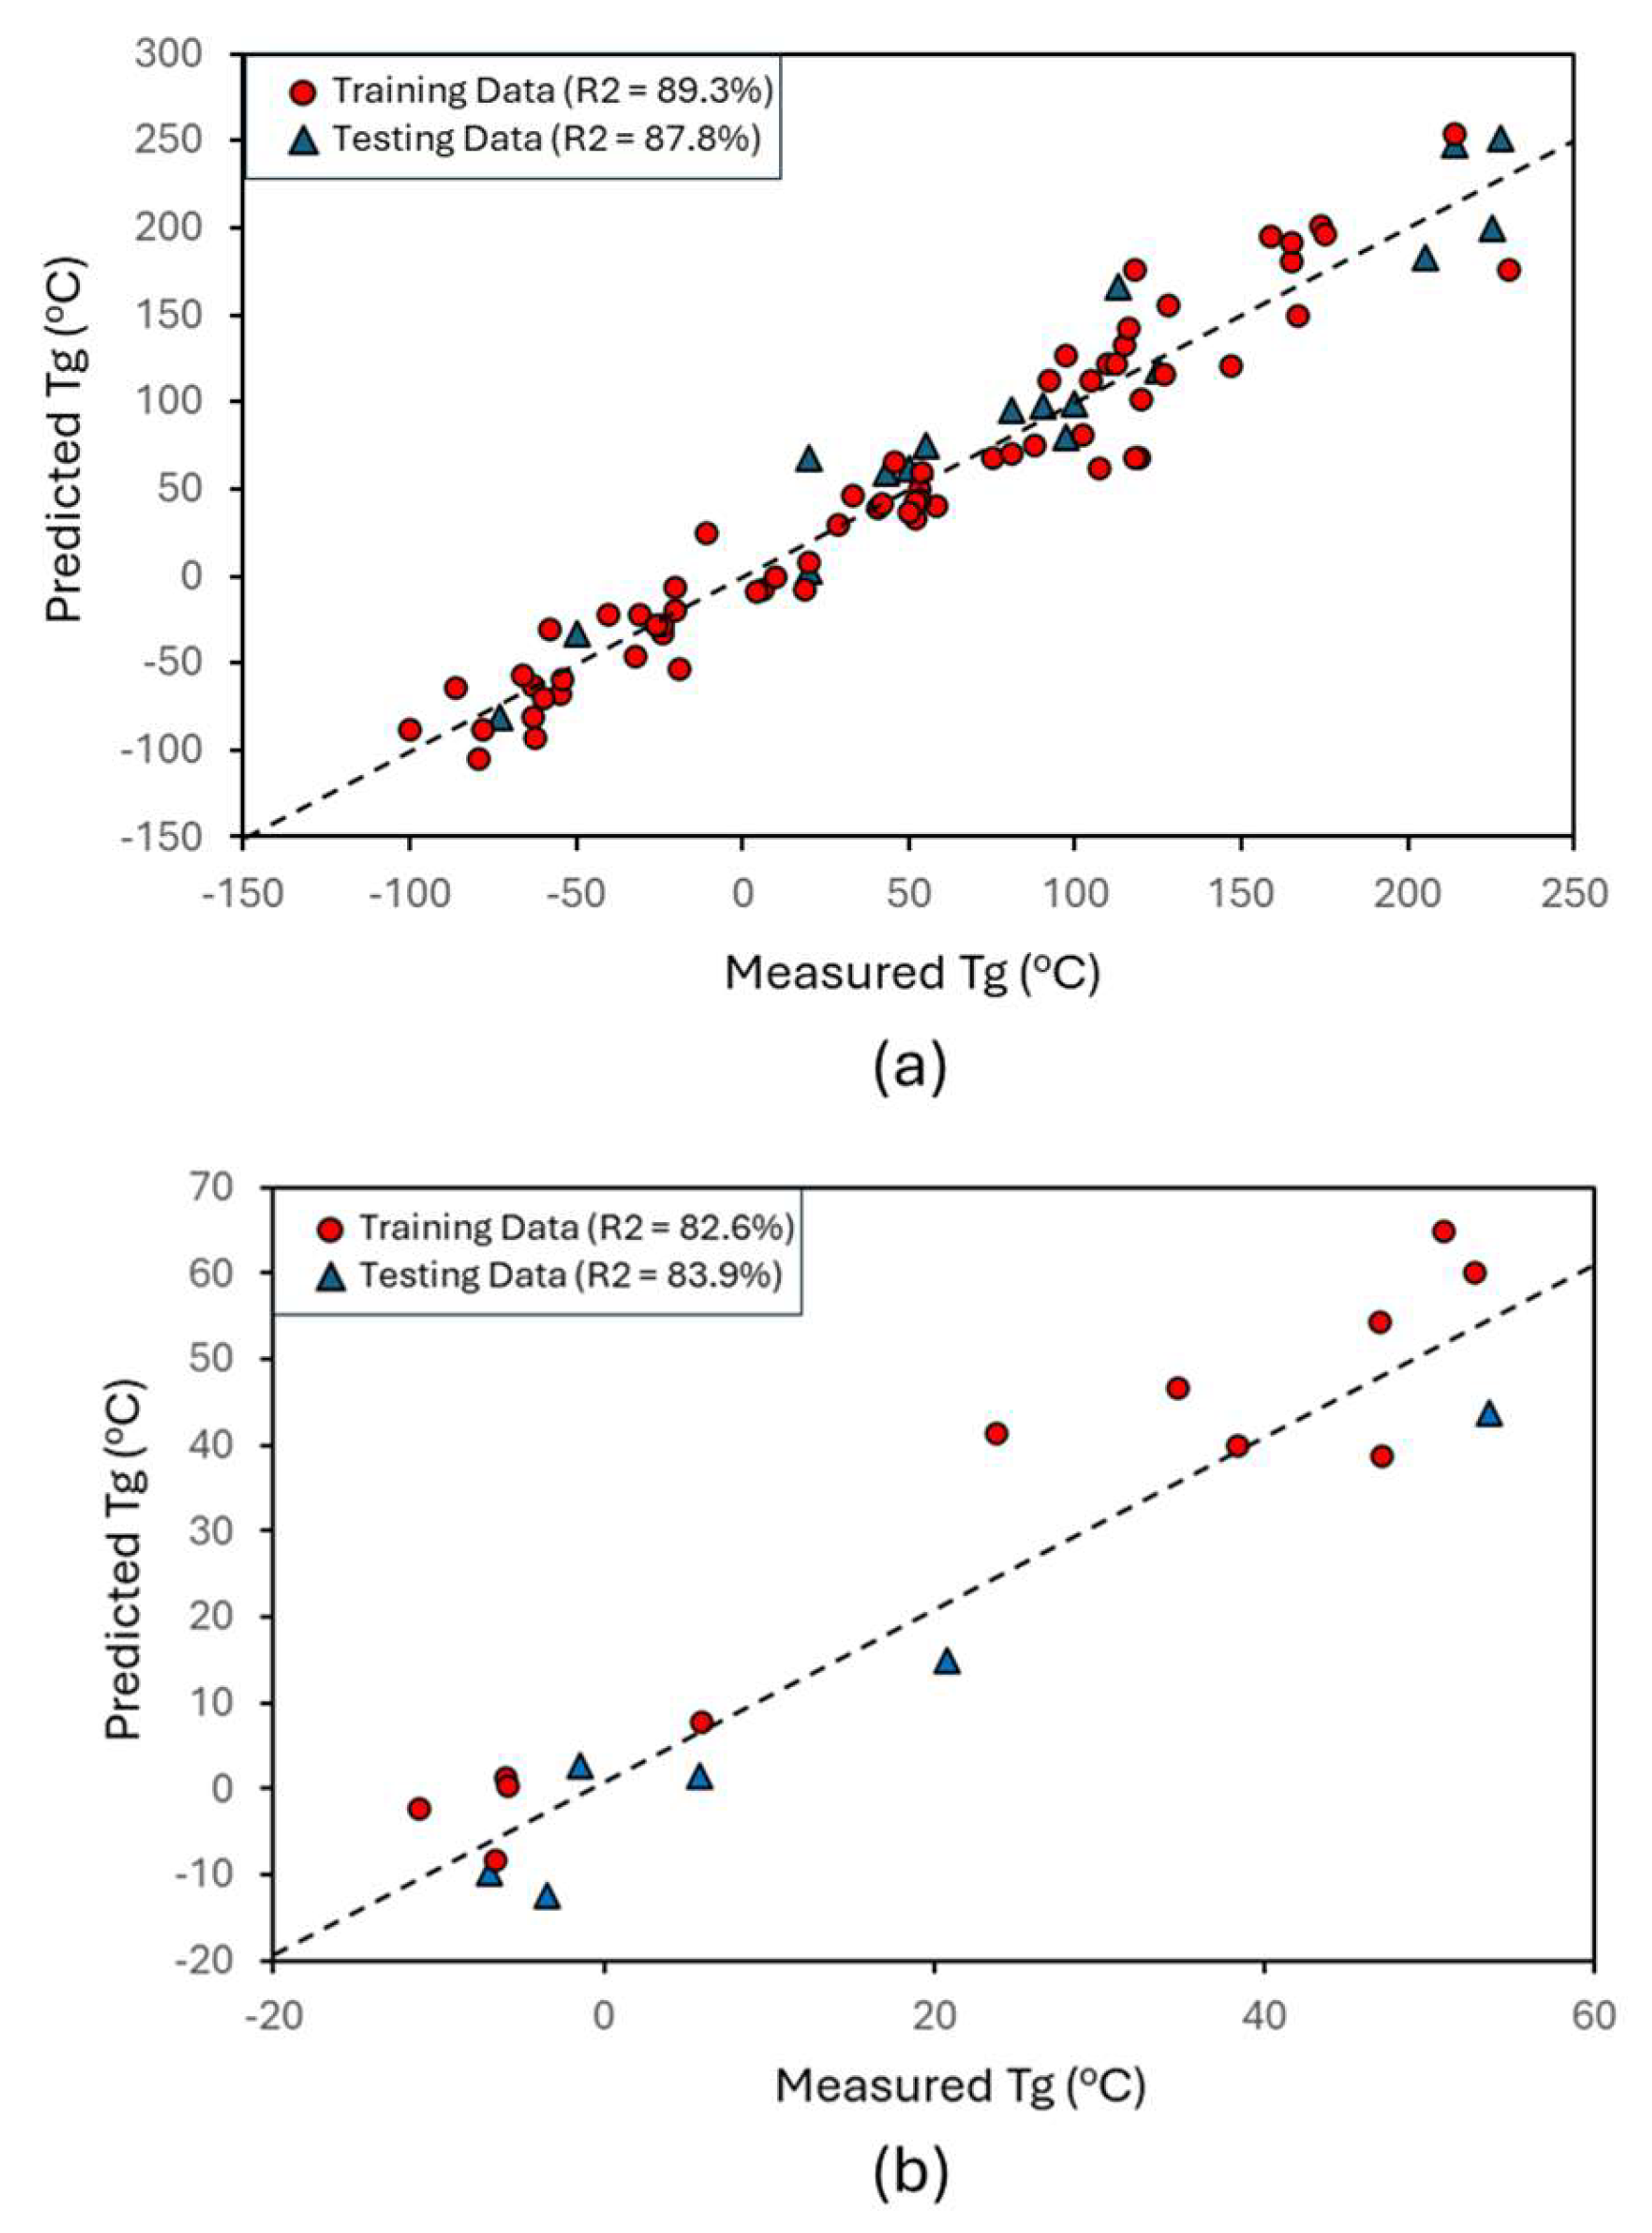
2.4. Tg Prediction
3. Discussion
4. Materials and Methods
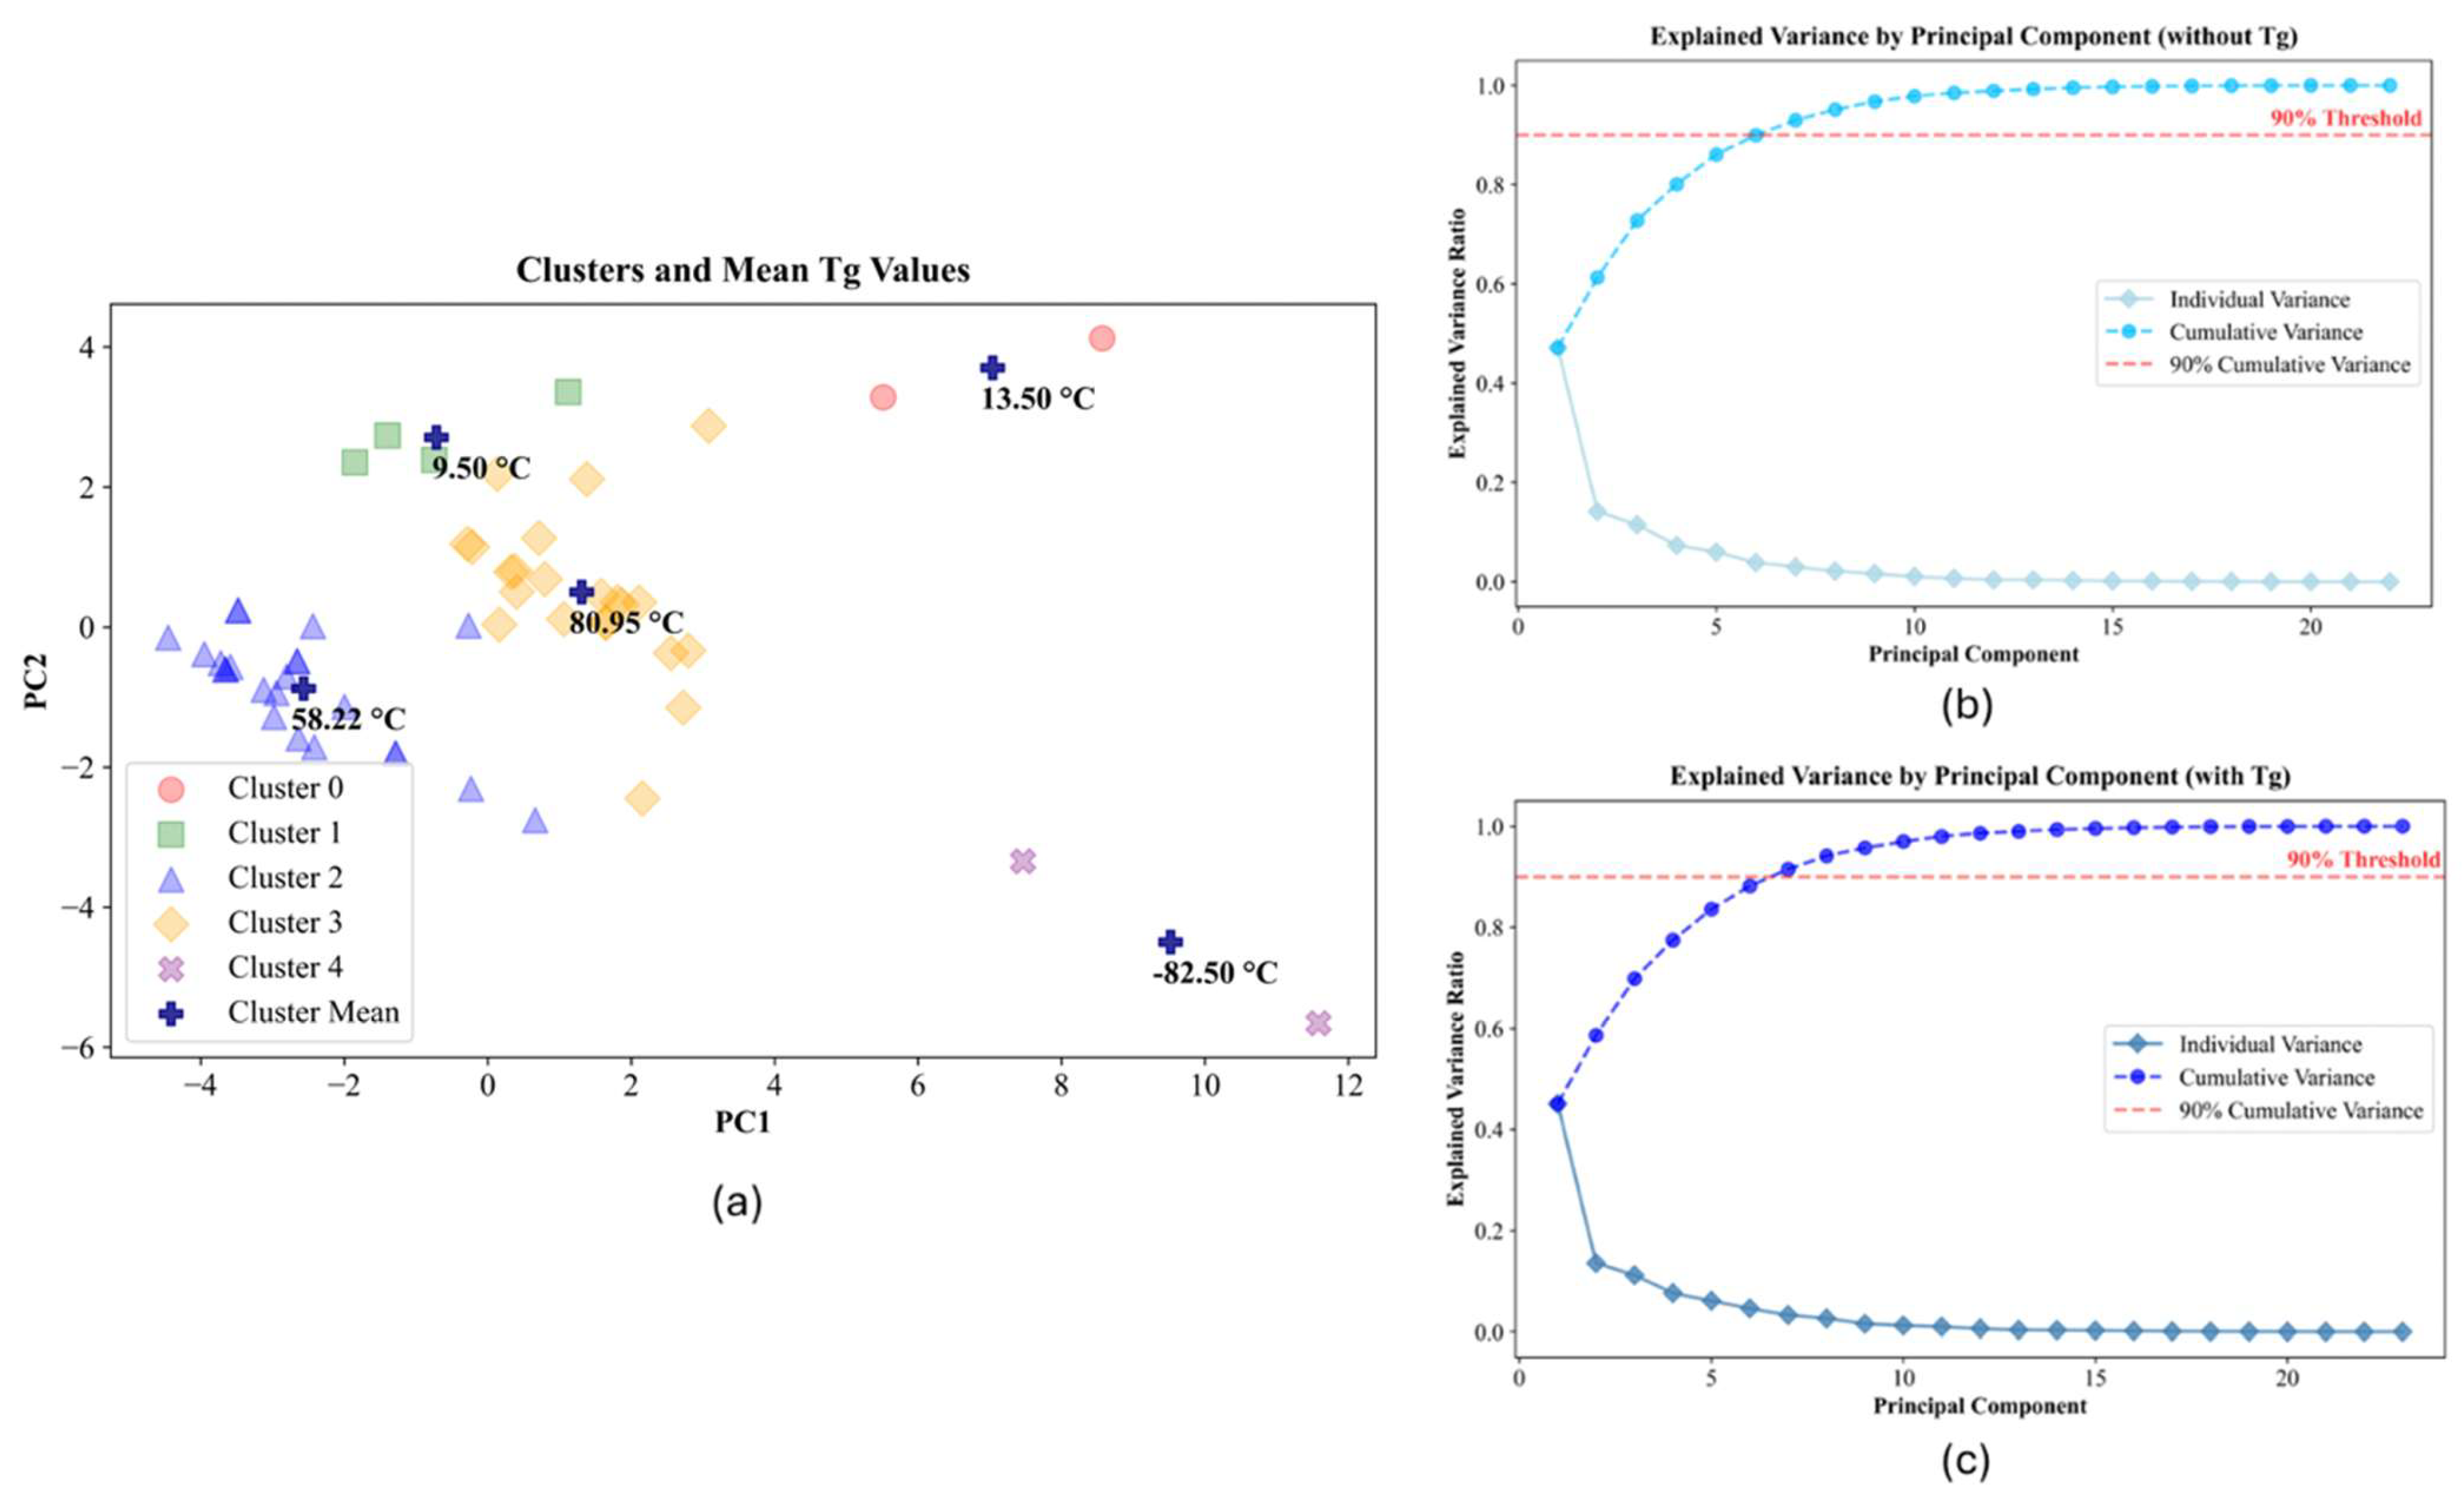
4.1. Unsupervised Learning
4.2. Supervised Learning
5. Conclusions
Supplementary Materials
Author Contributions
Funding
Institutional Review Board Statement
Informed Consent Statement
Data Availability Statement
Conflicts of Interest
References
- Tang, C.; Ryu, C.Y. (Eds.) Sustainable Polymers from Biomass; Wiley-VCH: Weinheim, Germany, 2017; Chapter 1; pp. 36–40. [Google Scholar]
- Nguyen, H.T.H.; Qi, P.; Rostagno, M.; Feteha, A.; Miller, S.A. The Quest for High Glass Transition Temperature Bioplastics. J. Mater. Chem. A 2018, 6, 9298–9331. [Google Scholar] [CrossRef]
- Fagnani, D.E.; Tami, J.L.; Copley, G.; Clemons, M.N.; Getzler, Y.D.Y.L.; McNeil, A.J. 100th Anniversary of Macromolecular Science Viewpoint: Redefining Sustainable Polymers. ACS Macro Lett. 2021, 10, 41–53. [Google Scholar] [CrossRef] [PubMed]
- Muelhaupt, R. Green Polymer Chemistry and Bio-Based Plastics: Dreams and Reality. Macromol. Chem. Phys. 2013, 214, 159–174. [Google Scholar] [CrossRef]
- Papageorgiou, G.Z. Thinking Green: Sustainable Polymers from Renewable Resources. Polymers 2018, 10, 952. [Google Scholar] [CrossRef]
- Huang, Y.; Kormakov, S.; He, X.; Gao, X.; Zheng, X.; Liu, Y.; Sun, J.; Wu, D. Conductive Polymer Composites from Renewable Resources: An Overview of Preparation, Properties, and Applications. Polymers 2019, 11, 187. [Google Scholar] [CrossRef]
- Zhu, Y.; Romain, C.; Williams, C.K. Sustainable Polymers from Renewable Resources. Nature 2016, 540, 354–362. [Google Scholar] [CrossRef]
- Yu, X.; Jia, J.; Xu, S.; Lao, K.U.; Sanford, M.J.; Ramakrishnan, R.K.; Nazarenko, S.I.; Hoye, T.R.; Coates, G.W.; DiStasio, R.A. Unraveling Substituent Effects on the Glass Transition Temperatures of Biorenewable Polyesters. Nat. Commun. 2018, 9, 2880. [Google Scholar] [CrossRef]
- Plass, C.; Adebar, N.; Hiessl, R.; Kleber, J.; Grimm, A.; Langsch, A.; Otter, R.; Liese, A.; Gröger, H. Structure-Performance Guided Design of Sustainable Plasticizers from Biorenewable Feedstocks. Eur. J. Org. Chem. 2021, 2021, 6086–6096. [Google Scholar] [CrossRef]
- Ding, J.; Gong, J.; Bai, H.; Li, L.; Zhong, Y.; Ma, Z.; Svrcek, V. Constructing Honeycomb Micropatterns on Nonplanar Substrates with High Glass Transition Temperature Polymers. J. Colloid Interface Sci. 2012, 380, 99–104. [Google Scholar] [CrossRef]
- Sun, H.-S.; Chiu, Y.-C.; Chen, W.-C. Renewable Polymeric Materials for Electronic Applications. Polym. J. 2017, 49, 61–73. [Google Scholar] [CrossRef]
- Zhou, J.; Zhang, H.; Deng, J.; Wu, Y. High Glass-Transition Temperature Acrylate Polymers Derived from Biomasses, Syringaldehyde, and Vanillin. Macromol. Chem. Phys. 2016, 217, 2402–2408. [Google Scholar] [CrossRef]
- Park, P.; Jonnalagadda, S. Predictors of Glass Transition in the Biodegradable Polylactide and Poly-Lactide-Co-Glycolide Polymers. J. Appl. Polym. Sci. 2006, 100, 1983–1987. [Google Scholar] [CrossRef]
- Ni, H.; Liu, J.; Yang, S. Preparation and Characterization of Inherently Heat-Sealable Polyimides with High Glass Transition Temperatures. J. Appl. Polym. Sci. 2016, 133, 43058. [Google Scholar] [CrossRef]
- Li, Y.; Guo, H. Crosslinked Poly(Methyl Methacrylate) with Perfluorocyclobutyl Aryl Ether Moiety as Crosslinking Unit: Thermally Stable Polymer with High Glass Transition Temperature. RSC Adv. 2020, 10, 1981–1988. [Google Scholar] [CrossRef]
- Zhou, Q.; Yan, C.; Li, H.; Zhu, Z.; Gao, Y.; Xiong, J.; Tang, H.; Zhu, C.; Yu, H.; Lopez, S.P.G.; et al. Polymer Fiber Rigid Network with High Glass Transition Temperature Reinforces Stability of Organic Photovoltaics. Nano-Micro Lett. 2024, 16, 224. [Google Scholar] [CrossRef]
- Liu, X.; Gao, Y.; Zhu, X.; Shang, Y.; Cui, Z.; Yan, Q.; Zhang, H. Design and Synthesis of Poly(Arylene Ether Sulfone)s with High Glass Transition Temperature by Introducing Biphenylene Groups. Polym. Int. 2020, 69, 1267–1274. [Google Scholar] [CrossRef]
- Boukis, A.C.; Llevot, A.; Meier, M.A.R. High Glass Transition Temperature Renewable Polymers via Biginelli Multicomponent Polymerization. Macromol. Rapid Commun. 2016, 37, 643–649. [Google Scholar] [CrossRef]
- Odian, G. Principles of Polymerization, 4th ed.; John Wiley & Sons Inc.: Hoboken, NJ, USA, 2004; Chapter 1; pp. 620–626. [Google Scholar]
- Chee, K.K. Dependence of Glass Transition Temperature on Chain Flexibility and Intermolecular Interactions in Polymers. J. Appl. Polym. Sci. 1991, 43, 1205–1208. [Google Scholar] [CrossRef]
- Solunov, C.A. Cooperative Molecular Dynamics and Strong/Fragile Behavior of Polymers. Eur. Polym. J. 1999, 35, 1543–1556. [Google Scholar] [CrossRef]
- Brunet, J.; Collas, F.; Humbert, M.; Perrin, L.; Brunel, F.; Lacôte, E.; Montarnal, D.; Raynaud, J. High Glass-Transition Temperature Polymer Networks Harnessing the Dynamic Ring Opening of Pinacol Boronates. Angew. Chem. Int. Ed. 2019, 58, 12216–12222. [Google Scholar] [CrossRef]
- Bicerano, J. Prediction of Polymer Properties, 2nd ed.; M. Dekker: New York, NY, USA, 1996. [Google Scholar]
- van Krevelen, D.W.; te Nijenhuis, K. Properties of Polymers: Their Correlation with Chemical Structure: Their Numerical Estimation and Prediction from Additive Group Contributions, 4th ed.; Elsevier: Amsterdam, The Netherlands, 2009. [Google Scholar]
- Askadskii, A.A. Computational Materials Science of Polymers; Cambridge International Science Pub.: Cambridge, UK, 2003. [Google Scholar]
- Kim, C.; Chandrasekaran, A.; Huan, T.D.; Das, D.; Ramprasad, R. Polymer Genome: A Data-Powered Polymer Informatics Platform for Property Predictions. J. Phys. Chem. C 2018, 122, 17575–17585. [Google Scholar] [CrossRef]
- Song, C.; Gu, H.; Zhu, L.; Jiang, W.; Weng, Z.; Zong, L.; Liu, C.; Hu, F.; Pan, Y.; Jian, X. A Polymer Genome Approach for Rational Design of Poly(Aryl Ether)s with High Glass Transition Temperature. J. Mater. Chem. A 2023, 11, 16985–16994. [Google Scholar] [CrossRef]
- Hickey, K.; Feinstein, J.; Sivaraman, G.; MacDonell, M.; Yan, E.; Matherson, C.; Coia, S.; Xu, J.; Picel, K. Applying Machine Learning and Quantum Chemistry to Predict the Glass Transition Temperatures of Polymers. Comput. Mater. Sci. 2024, 238, 112933. [Google Scholar] [CrossRef]
- Liu, D.-F.; Feng, Q.-K.; Zhang, Y.-X.; Zhong, S.-L.; Dang, Z.-M. Prediction of High-Temperature Polymer Dielectrics Using a Bayesian Molecular Design Model. J. Appl. Phys. 2022, 132, 014901. [Google Scholar] [CrossRef]
- Miccio, L.A.; Borredon, C.; Schwartz, G.A. A Glimpse Inside Materials: Polymer Structure–Glass Transition Temperature Relationship as Observed by a Trained Artificial Intelligence. Comput. Mater. Sci. 2024, 236, 112863. [Google Scholar] [CrossRef]
- Casanola-Martin, G.M.; Karuth, A.; Pham-The, H.; González-Díaz, H.; Webster, D.C.; Rasulev, B. Machine Learning Analysis of a Large Set of Homopolymers to Predict Glass Transition Temperatures. Commun. Chem. 2024, 7, 226–229. [Google Scholar] [CrossRef]
- Tao, L.; Chen, G.; Li, Y. Machine Learning Discovery of High-Temperature Polymers. Patterns 2021, 2, 100225. [Google Scholar] [CrossRef]
- Li, X.; Petersen, L.; Broderick, S.; Narasimhan, B.; Rajan, K. Identifying Factors Controlling Protein Release from Combinatorial Biomaterial Libraries via Hybrid Data Mining Methods. ACS Comb. Sci. 2011, 13, 50–58. [Google Scholar] [CrossRef]
- Mullis, A.S.; Broderick, S.R.; Phadke, K.S.; Peroutka-Bigus, N.; Bellaire, B.H.; Rajan, K.; Narasimhan, B. Data Analytics-Guided Rational Design of Antimicrobial Nanomedicines Against Opportunistic, Resistant Pathogens. Nanomedicine 2023, 48, 102647. [Google Scholar] [CrossRef]
- Zhang, Y.; Xu, X. Machine Learning Glass Transition Temperature of Polymers. Heliyon 2020, 6, e05055. [Google Scholar] [CrossRef]
- Phanse, Y.; Puttamreddy, S.; Loy, D.; Ramirez, J.V.; Ross, K.A.; Alvarez-Castro, I.; Mogler, M.; Broderick, S.; Rajan, K.; Narasimhan, B.; et al. RNA Nanovaccine Protects Against White Spot Syndrome Virus in Shrimp. Vaccines 2022, 10, 1428. [Google Scholar] [CrossRef] [PubMed]
- Mullis, A.S.; Broderick, S.R.; Binnebose, A.M.; Peroutka-Bigus, N.; Bellaire, B.H.; Rajan, K.; Narasimhan, B. Data Analytics Approach for Rational Design of Nanomedicines with Programmable Drug Release. Mol. Pharm. 2019, 16, 1917–1928. [Google Scholar] [CrossRef] [PubMed]
- Phanse, Y.; Carrillo-Conde, B.R.; Ramer-Tait, A.E.; Roychoudhury, R.; Broderick, S.; Pohl, N.; Rajan, K.; Narasimhan, B.; Wannemuehler, M.J.; Bellaire, B.H. Functionalization Promotes Pathogen-Mimicking Characteristics of Polyanhydride Nanoparticle Adjuvants. J. Biomed. Mater. Res. A 2017, 105, 2762–2771. [Google Scholar] [CrossRef] [PubMed]
- Ross, K.; Adams, J.; Loyd, H.; Ahmed, S.; Sambol, A.; Broderick, S.; Rajan, K.; Kohut, M.; Bronich, T.; Wannemuehler, M.J.; et al. Combination Nanovaccine Demonstrates Synergistic Enhancement in Efficacy Against Influenza. ACS Biomater. Sci. Eng. 2016, 2, 368–374. [Google Scholar] [CrossRef]
- Rumman, A.H.; Sahriar, M.A.; Islam, M.T.; Shorowordi, K.M.; Carbonara, J.; Broderick, S.; Ahmed, S. Data-Driven Design for Enhanced Efficiency of Sn-Based Perovskite Solar Cells Using Machine Learning. APL Mach. Learn. 2023, 1, 046117. [Google Scholar] [CrossRef]
- Tao, L.; Varshney, V.; Li, Y. Benchmarking Machine Learning Models for Polymer Informatics: An Example of Glass Transition Temperature. J. Chem. Inf. Model. 2021, 61, 5395–5413. [Google Scholar] [CrossRef]
- Ma, R.; Zhang, H.; Xu, J.; Sun, L.; Hayashi, Y.; Yoshida, R.; Shiomi, J.; Wang, J.; Luo, T. Machine Learning-Assisted Exploration of Thermally Conductive Polymers Based on High-Throughput Molecular Dynamics Simulations. Mater. Today Phys. 2022, 28, 100850. [Google Scholar] [CrossRef]
- Kim, C.; Chandrasekaran, A.; Jha, A.; Ramprasad, R. Active-Learning and Materials Design: The Example of High Glass Transition Temperature Polymers. MRS Commun. 2019, 9, 860–866. [Google Scholar] [CrossRef]
- Islam, M.T.; Liu, Q.; Broderick, S. Machine Learning Accelerated Design of High-Temperature Ternary and Quaternary Nitride Superconductors. Appl. Sci. 2024, 14, 9196. [Google Scholar] [CrossRef]
- Broderick, S.R.; Rajan, K. Designing a Periodic Table for Alloy Design: Harnessing Machine Learning to Navigate a Multiscale Information Space. JOM 2020, 72, 4370–4379. [Google Scholar] [CrossRef]
- Giles, S.A.; Sengupta, D.; Broderick, S.R.; Rajan, K. Machine-Learning-Based Intelligent Framework for Discovering Refractory High-Entropy Alloys with Improved High-Temperature Yield Strength. npj Comput. Mater. 2022, 8, 235. [Google Scholar] [CrossRef]
- Broderick, S.; Dongol, R.; Rajan, K. Exploring the Shape of Data for Discovering Patterns in Crystal Chemistry. MRS Commun. 2021, 11, 811–817. [Google Scholar] [CrossRef]
- Dasgupta, A.; Gao, Y.; Broderick, S.R.; Pitman, E.B.; Rajan, K. Machine Learning-Aided Identification of Single Atom Alloy Catalysts. J. Phys. Chem. C 2020, 124, 14158–14166. [Google Scholar] [CrossRef]
- Aldrich Polymer Products. Reference: Polymer Properties, Sigma-Aldrich: St. Louis, MO, USA; 52–53.
- Goyal, S.; Lin, F.-Y.; Forrester, M.; Henrichsen, W.; Murphy, G.; Shen, L.; Wang, T.; Cochran, E.W. Glycerol Ketals as Building Blocks for a New Class of Biobased (Meth)acrylate Polymers. ACS Sustain. Chem. Eng. 2021, 9, 10620–10629. [Google Scholar] [CrossRef]
- Kanbargi, N.; Damron, J.T.; Gao, Y.; Kearney, L.T.; Carrillo, J.M.; Keum, J.K.; Sumpter, B.G.; Naskar, A.K. Amplifying Nanoparticle Reinforcement through Low Volume Topologically Controlled Chemical Coupling. ACS Macro Lett. 2024, 13, 280–287. [Google Scholar] [CrossRef]
- Nguyen, H.N.; Lu, L.-H.; Huang, C.-J. Aromatic Disulfide Cross-Linkers for Self-Healable and Recyclable Acrylic Polymer Networks. ACS Appl. Polym. Mater. 2024, 6, 4615–4624. [Google Scholar] [CrossRef]


| Polymer Features | How They Were Defined or Calculated |
|---|---|
| N | total non-hydrogen atoms in one polymer repeat unit |
| N_C | number of carbon atoms in one polymeric repeat unit |
| N_H | number of hydrogen atoms in one polymeric repeat unit |
| N_ester_n | number of backbone -COO- (non-conjugated with aromatic ring) |
| N_ester_c | number of backbone -COO- (one-sided conjugation with aromatic ring) |
| N_aromaticring | number of aromatic rings in one polymeric repeat unit |
| N_CH2 | number of -CH2 in one polymeric repeat unit |
| N_ether | number of -O- in a polymeric repeat unit |
| N_backbone_O | number of backbone oxygen atoms in one polymeric repeat unit |
| N_O | number of oxygen atoms in a polymeric repeat unit |
| M | mole weight of one polymer repeat unit(g/mol) |
| N_alkyl_ether | number of ether (R-O-R’) linkages between two units R and R’ both of which are connected to the alkyl carbon atom |
| N_rot | total number of rotational degrees of freedom parameter (N_rot = the backbone rotational degrees plus the side group rotational degrees) |
| N_K | N_K = 5N_amide + 7N_cyanide + 15N_carbonate + 5N_Cl + 13N_Br + 4N_hydroxyl − 3N_(ether) − 5N_C = C + 3N_sulfone − 3N_acrylic ester − 5N_ (isolated saturated aliphatic hydrocarbon rings, i.e., cyclohexyl or cyclopentyl) |
| N_SP | number of atoms in the shortest path across the backbone of a polymeric repeat unit, N_SP ≤ N_BB |
| Nmv | Nmv = 2 × N_ester + 3 × N_ether |
| 0Χ | the zeroth-order (atomic) connectivity indices (the first atomic index) |
| 0ΧV | the zeroth-order (atomic) connectivity indices (the second atomic index) |
| 1Χ | the first-order (bond) connectivity indices (the first bond index) |
| 1ΧV | the first-order (bond) connectivity indices (the second bond index) |
| BB_index1 | backbone index1 is a steric hindrance parameter that reflects the flexibility of the polymer backbone structure, similar to the stiffness of the backbone. |
| BB_index2 | backbone index2 is a steric hindrance parameter that differentiates between backbone atoms with the same (δ/δV) values but different δ values, reflecting variations in the number of non-hydrogen neighbors around each backbone atom. |
| Feature | Times Selected | Correlation |
|---|---|---|
| N_rot | 4 | − |
| BB_index2 | 3 | − |
| N_alkyl_ether | 2 | − |
| N_ether_c | 2 | + and − |
| N_aromaticRing | 2 | + |
| N_H | 2 | − |
| Nmv | 1 | + |
| N_K | 1 | − |
| N_ester_n | 1 | − |
| 0X | 1 | |
| 1Xv | 1 | |
| M | 1 |
Disclaimer/Publisher’s Note: The statements, opinions and data contained in all publications are solely those of the individual author(s) and contributor(s) and not of MDPI and/or the editor(s). MDPI and/or the editor(s) disclaim responsibility for any injury to people or property resulting from any ideas, methods, instructions or products referred to in the content. |
© 2025 by the authors. Licensee MDPI, Basel, Switzerland. This article is an open access article distributed under the terms and conditions of the Creative Commons Attribution (CC BY) license (https://creativecommons.org/licenses/by/4.0/).
Share and Cite
Liu, Q.; Forrester, M.F.; Dileep, D.; Subbiah, A.; Garg, V.; Finley, D.; Cochran, E.W.; Kraus, G.A.; Broderick, S.R. Data-Driven Modeling and Design of Sustainable High Tg Polymers. Int. J. Mol. Sci. 2025, 26, 2743. https://doi.org/10.3390/ijms26062743
Liu Q, Forrester MF, Dileep D, Subbiah A, Garg V, Finley D, Cochran EW, Kraus GA, Broderick SR. Data-Driven Modeling and Design of Sustainable High Tg Polymers. International Journal of Molecular Sciences. 2025; 26(6):2743. https://doi.org/10.3390/ijms26062743
Chicago/Turabian StyleLiu, Qinrui, Michael F. Forrester, Dhananjay Dileep, Aadhi Subbiah, Vivek Garg, Demetrius Finley, Eric W. Cochran, George A. Kraus, and Scott R. Broderick. 2025. "Data-Driven Modeling and Design of Sustainable High Tg Polymers" International Journal of Molecular Sciences 26, no. 6: 2743. https://doi.org/10.3390/ijms26062743
APA StyleLiu, Q., Forrester, M. F., Dileep, D., Subbiah, A., Garg, V., Finley, D., Cochran, E. W., Kraus, G. A., & Broderick, S. R. (2025). Data-Driven Modeling and Design of Sustainable High Tg Polymers. International Journal of Molecular Sciences, 26(6), 2743. https://doi.org/10.3390/ijms26062743