
Exploring Multi-Target Therapeutic Strategies for Glioblastoma via Endogenous Network Modeling


Abstract
:1. Introduction
2. Results
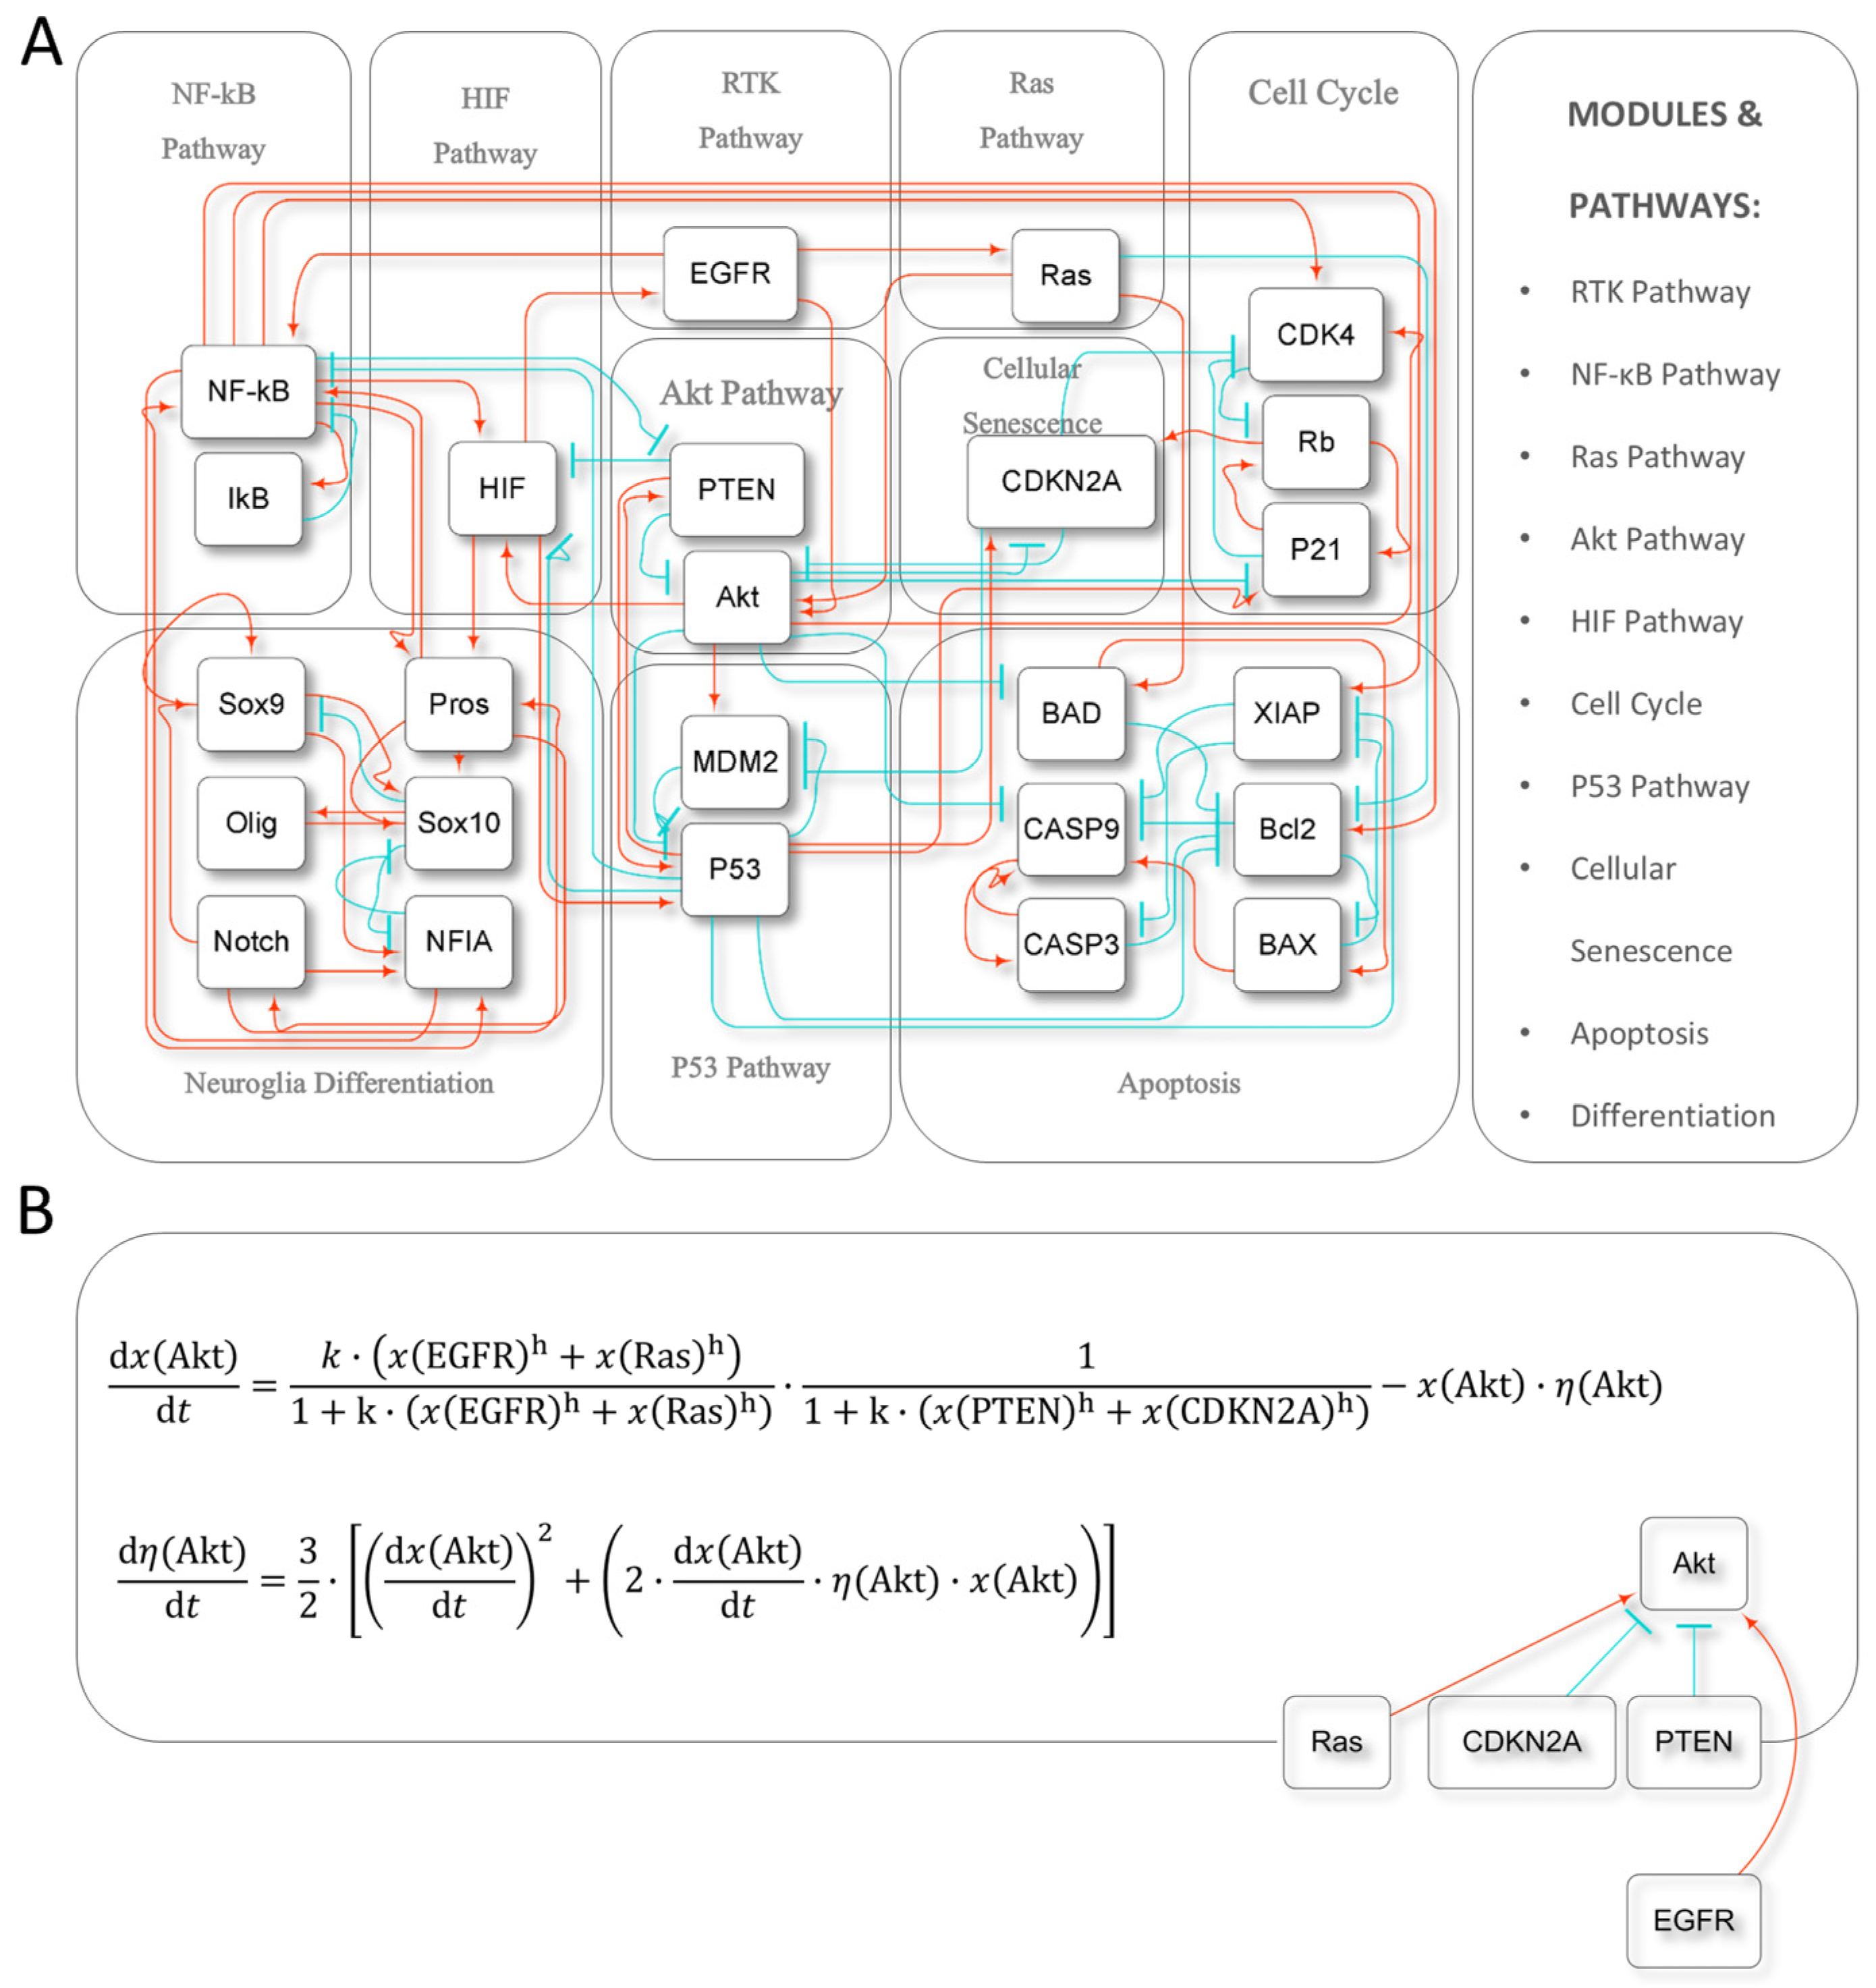
2.1. Model Construction and Dynamics
2.2. Model Validation
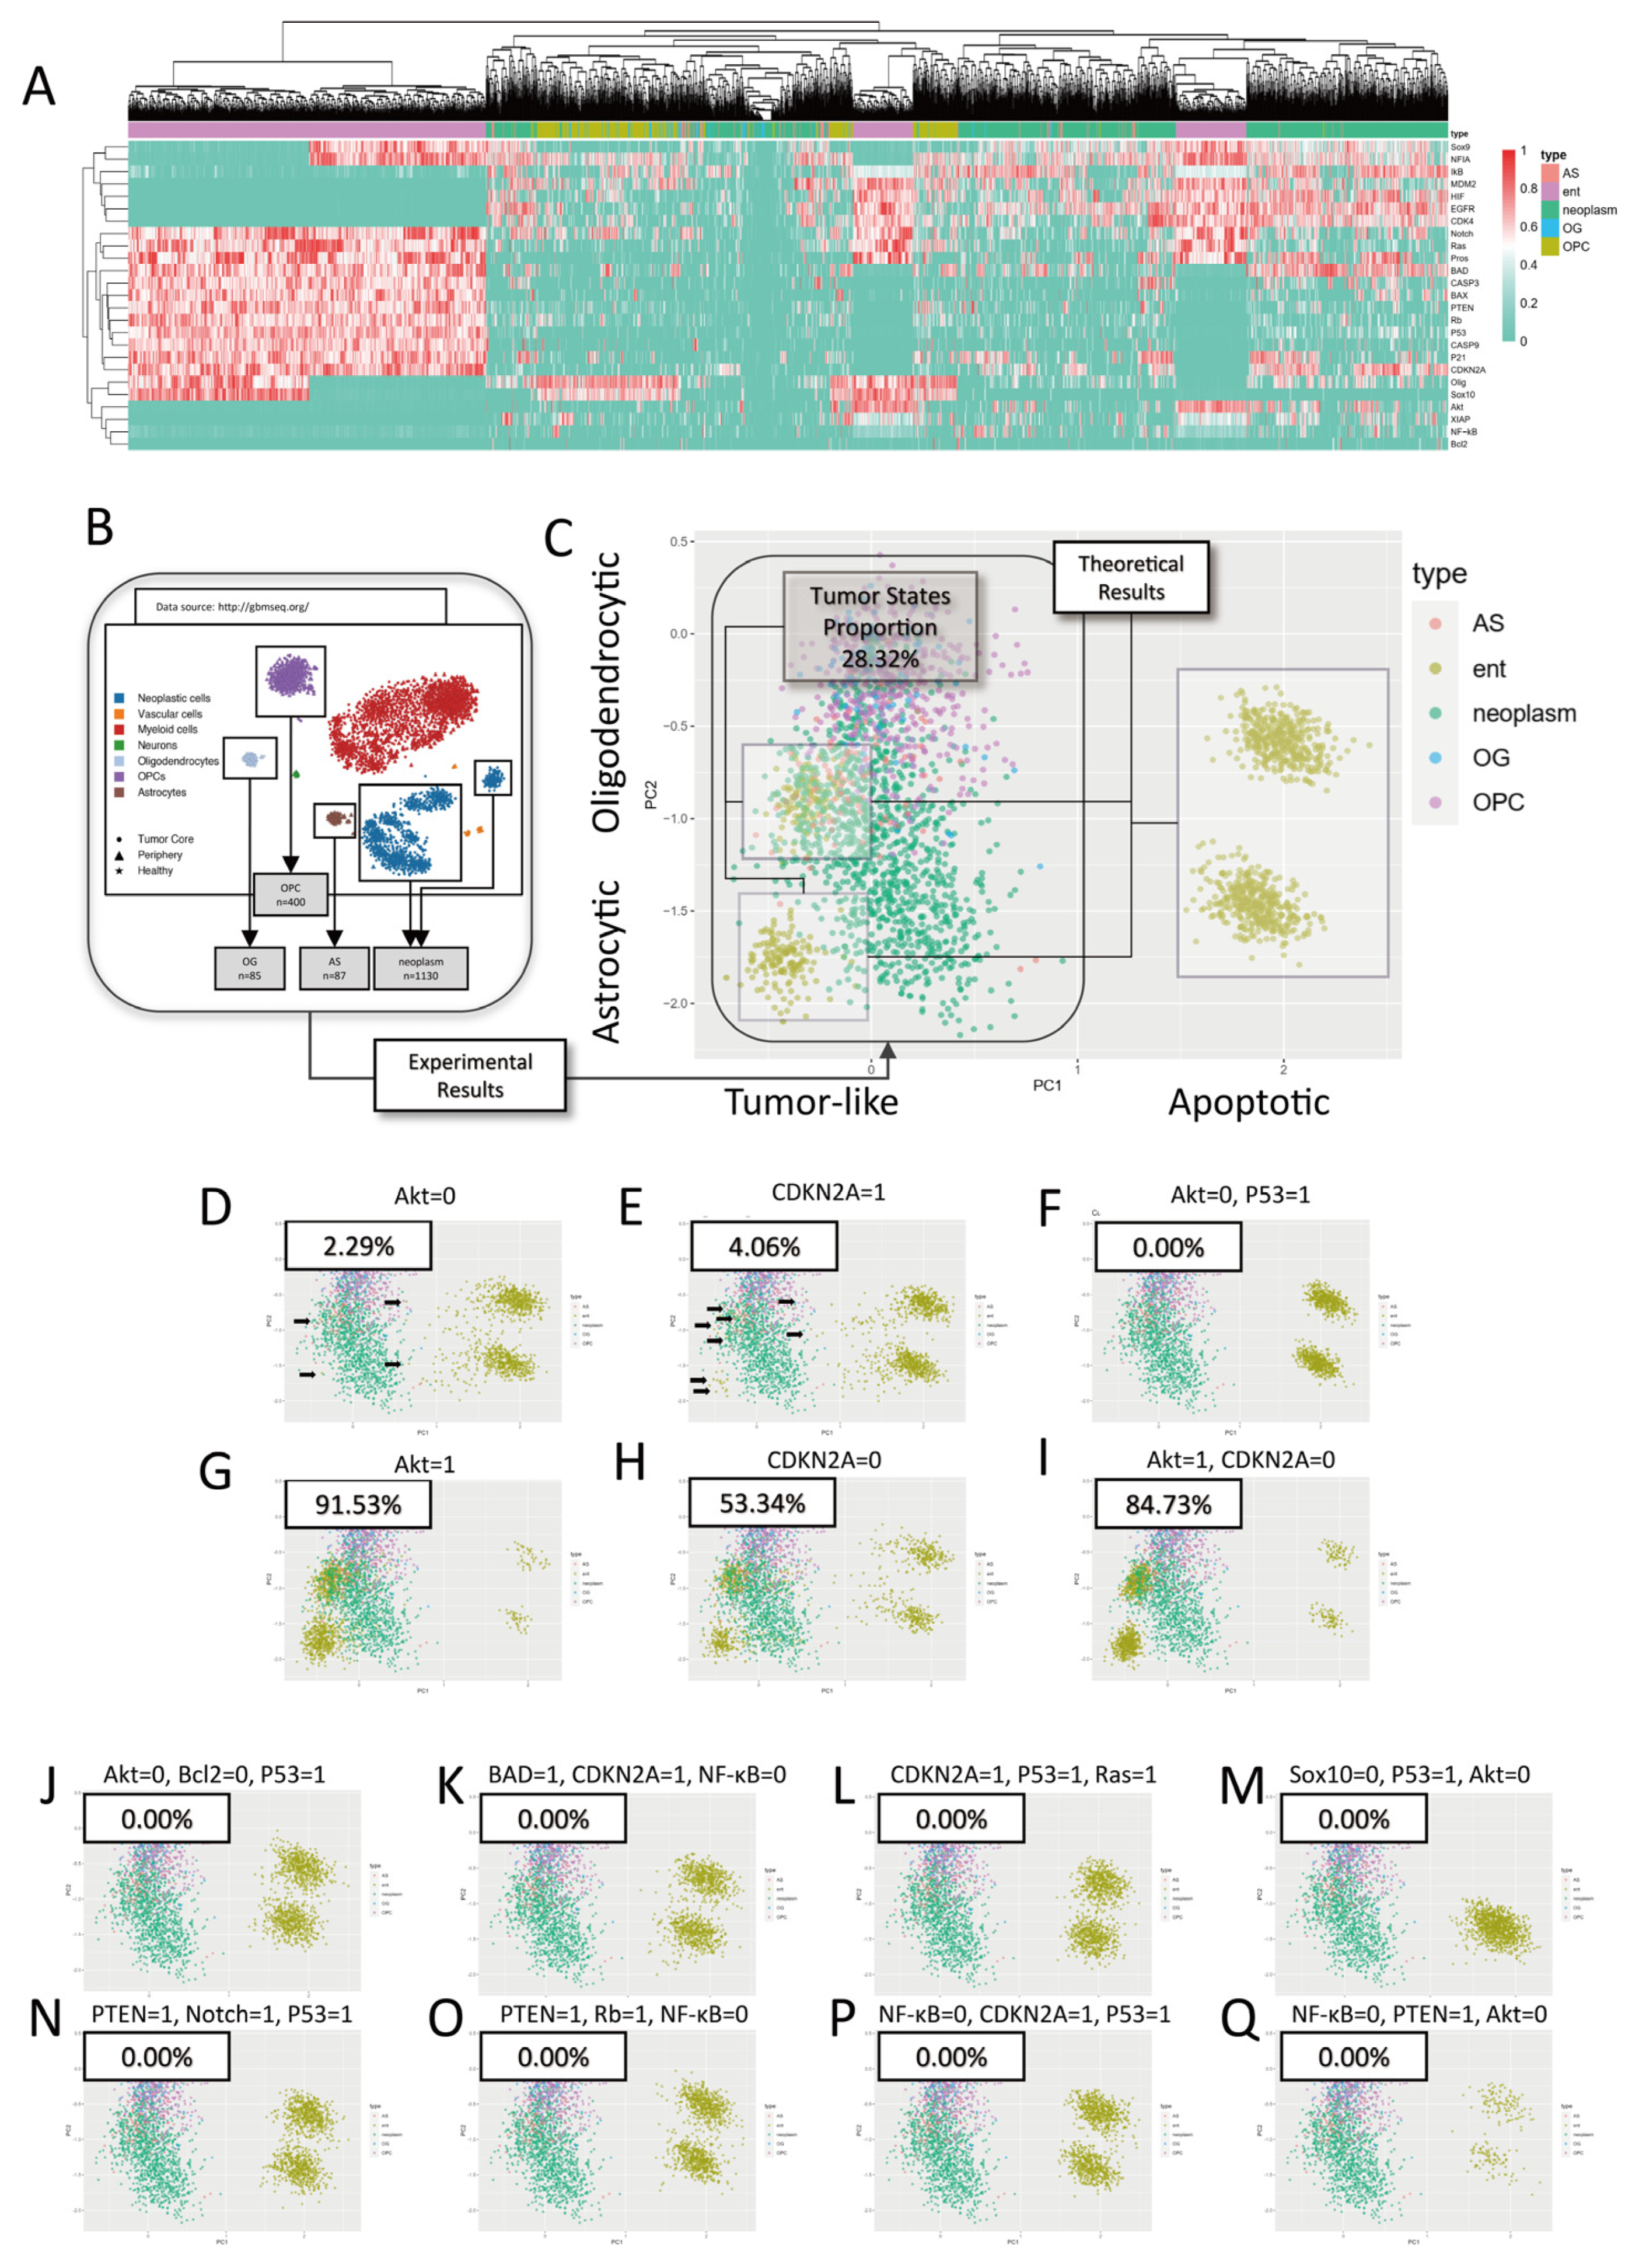
2.2.1. Validation with scRNA-Seq Data
2.2.2. Common Mutations in Glioblastoma Expand Tumor Stable States
2.3. Exploration of Therapeutic Strategies
2.3.1. Single-Target Interventions
2.3.2. Multi-Target Interventions
3. Discussion
3.1. Model Limitation
3.2. Potential Clinical Applications
4. Materials and Methods
4.1. Model Construction
4.2. Dynamic Simulations
4.3. Data Analysis
4.3.1. scRNA-Seq Data Preprocessing
4.3.2. Theoretical–Experimental Comparisons
5. Conclusions
Supplementary Materials
Author Contributions
Funding
Institutional Review Board Statement
Informed Consent Statement
Data Availability Statement
Acknowledgments
Conflicts of Interest
References
- Louis, D.N.; Perry, A.; Reifenberger, G.; von Deimling, A.; Figarella-Branger, D.; Cavenee, W.K.; Ohgaki, H.; Wiestler, O.D.; Kleihues, P.; Ellison, D.W. The 2016 World Health Organization Classification of Tumors of the Central Nervous System: A Summary. Acta Neuropathol. 2016, 131, 803–820. [Google Scholar] [CrossRef] [PubMed]
- Ostrom, Q.T.; Bauchet, L.; Davis, F.G.; Deltour, I.; Fisher, J.L.; Langer, C.E.; Pekmezci, M.; Schwartzbaum, J.A.; Turner, M.C.; Walsh, K.M.; et al. The Epidemiology of Glioma in Adults: A State of the Science Review. Neuro-Oncology 2014, 16, 896–913. [Google Scholar] [CrossRef]
- Miller, K.D.; Ostrom, Q.T.; Kruchko, C.; Patil, N.; Tihan, T.; Cioffi, G.; Fuchs, H.E.; Waite, K.A.; Jemal, A.; Siegel, R.L.; et al. Brain and Other Central Nervous System Tumor Statistics, 2021. CA Cancer J. Clin. 2021, 71, 381–406. [Google Scholar] [CrossRef] [PubMed]
- Sadowski, K.; Jażdżewska, A.; Kozłowski, J.; Zacny, A.; Lorenc, T.; Olejarz, W. Revolutionizing Glioblastoma Treatment: A Comprehensive Overview of Modern Therapeutic Approaches. Int. J. Mol. Sci. 2024, 25, 5774. [Google Scholar] [CrossRef]
- Dewdney, B.; Jenkins, M.R.; Best, S.A.; Freytag, S.; Prasad, K.; Holst, J.; Endersby, R.; Johns, T.G. From Signalling Pathways to Targeted Therapies: Unravelling Glioblastoma’s Secrets and Harnessing Two Decades of Progress. Signal Transduct. Target. Ther. 2023, 8, 400. [Google Scholar] [CrossRef]
- Raghavendra, N.M.; Pingili, D.; Kadasi, S.; Mettu, A.; Prasad, S.V.U.M. Dual or Multi-Targeting Inhibitors: The next Generation Anticancer Agents. Eur. J. Med. Chem. 2018, 143, 1277–1300. [Google Scholar] [CrossRef]
- Yang, K.; Wu, Z.; Zhang, H.; Zhang, N.; Wu, W.; Wang, Z.; Dai, Z.; Zhang, X.; Zhang, L.; Peng, Y.; et al. Glioma Targeted Therapy: Insight into Future of Molecular Approaches. Mol. Cancer 2022, 21, 39. [Google Scholar] [CrossRef]
- Riviere-Cazaux, C.; Carlstrom, L.P.; Neth, B.J.; Olson, I.E.; Rajani, K.; Rahman, M.; Ikram, S.; Mansour, M.A.; Mukherjee, B.; Warrington, A.E.; et al. An Untapped Window of Opportunity for Glioma: Targeting Therapy-Induced Senescence Prior to Recurrence. npj Precis. Oncol. 2023, 7, 126. [Google Scholar] [CrossRef]
- Bush, N.A.O.; Chang, S.M.; Berger, M.S. Current and Future Strategies for Treatment of Glioma. Neurosurg. Rev. 2017, 40, 1–14. [Google Scholar] [CrossRef]
- Rajesh, Y.; Pal, I.; Banik, P.; Chakraborty, S.; Borkar, S.A.; Dey, G.; Mukherjee, A.; Mandal, M. Insights into Molecular Therapy of Glioma: Current Challenges and next Generation Blueprint. Acta Pharmacol. Sin. 2017, 38, 591–613. [Google Scholar] [CrossRef]
- Begagić, E.; Pugonja, R.; Bečulić, H.; Čeliković, A.; Tandir Lihić, L.; Kadić Vukas, S.; Čejvan, L.; Skomorac, R.; Selimović, E.; Jaganjac, B.; et al. Molecular Targeted Therapies in Glioblastoma Multiforme: A Systematic Overview of Global Trends and Findings. Brain Sci. 2023, 13, 1602. [Google Scholar] [CrossRef]
- Jin, H.; Wang, L.; Bernards, R. Rational Combinations of Targeted Cancer Therapies: Background, Advances and Challenges. Nat. Rev. Drug Discov. 2023, 22, 213–234. [Google Scholar] [CrossRef] [PubMed]
- Weinberg, R.A. Coming Full Circle—From Endless Complexity to Simplicity and Back Again. Cell 2014, 157, 267–271. [Google Scholar] [CrossRef] [PubMed]
- He, B.; Lu, C.; Zheng, G.; He, X.; Wang, M.; Chen, G.; Zhang, G.; Lu, A. Combination Therapeutics in Complex Diseases. J. Cell Mol. Med. 2016, 20, 2231–2240. [Google Scholar] [CrossRef] [PubMed]
- Tsimberidou, A.M.; Fountzilas, E.; Nikanjam, M.; Kurzrock, R. Review of Precision Cancer Medicine: Evolution of the Treatment Paradigm. Cancer Treat. Rev. 2020, 86, 102019. [Google Scholar] [CrossRef]
- Giordano, S.; Petrelli, A. From Single- to Multi-Target Drugs in Cancer Therapy: When Aspecificity Becomes an Advantage. Curr. Med. Chem. 2008, 15, 422–432. [Google Scholar] [CrossRef]
- Doostmohammadi, A.; Jooya, H.; Ghorbanian, K.; Gohari, S.; Dadashpour, M. Potentials and Future Perspectives of Multi-Target Drugs in Cancer Treatment: The next Generation Anti-Cancer Agents. Cell Commun. Signal. 2024, 22, 228. [Google Scholar] [CrossRef]
- Xu, J.G.; Chen, S.; He, Y.; Zhu, X.; Wang, Y.; Ye, Z.; Zhou, J.C.; Wu, X.; Zhang, L.; Ren, X.; et al. An Antibody Cocktail Targeting Two Different CD73 Epitopes Enhances Enzyme Inhibition and Tumor Control. Nat. Commun. 2024, 15, 10872. [Google Scholar] [CrossRef]
- Hu, X.; Xie, J.; Yang, Y.; Qiu, Z.; Lu, W.; Lin, X.; Xu, B. Multi-Target Neural Differentiation (MTND) Therapeutic Cocktail to Suppress Brain Tumor. Int. J. Mol. Sci. 2023, 24, 12329. [Google Scholar] [CrossRef]
- Swanton, C.; Bernard, E.; Abbosh, C.; André, F.; Auwerx, J.; Balmain, A.; Bar-Sagi, D.; Bernards, R.; Bullman, S.; DeGregori, J.; et al. Embracing Cancer Complexity: Hallmarks of Systemic Disease. Cell 2024, 187, 1589–1616. [Google Scholar] [CrossRef]
- Uthamacumaran, A. Dissecting Cell Fate Dynamics in Pediatric Glioblastoma through the Lens of Complex Systems and Cellular Cybernetics. Biol. Cybern. 2022, 116, 407–445. [Google Scholar] [CrossRef] [PubMed]
- Ao, P.; Galas, D.; Hood, L.; Zhu, X. Cancer as Robust Intrinsic State of Endogenous Molecular-Cellular Network Shaped by Evolution. Med. Hypotheses 2008, 70, 678–684. [Google Scholar] [CrossRef] [PubMed]
- Yuan, R.; Zhu, X.; Wang, G.; Li, S.; Ao, P. Cancer as Robust Intrinsic State Shaped by Evolution: A Key Issues Review. Reports Prog. Phys. 2017, 80, 042701. [Google Scholar] [CrossRef]
- Wang, G.; Zhu, X.; Gu, J.; Ao, P. Quantitative Implementation of the Endogenous Molecular-Cellular Network Hypothesis in Hepatocellular Carcinoma. Interface Focus 2014, 4, 20130064. [Google Scholar] [CrossRef]
- Su, H.; Wang, G.; Yuan, R.; Wang, J.; Tang, Y.; Ao, P.; Zhu, X. Decoding Early Myelopoiesis from Dynamics of Core Endogenous Network. Sci. China Life Sci. 2017, 60, 627–646. [Google Scholar] [CrossRef]
- Wang, J.; Yuan, R.; Zhu, X.; Ao, P. Adaptive Landscape Shaped by Core Endogenous Network Coordinates Complex Early Progenitor Fate Commitments in Embryonic Pancreas. Sci. Rep. 2020, 10, 1112. [Google Scholar] [CrossRef]
- Yao, M.; Su, Y.; Xiong, R.; Zhang, X.; Zhu, X.; Chen, Y.C.; Ao, P. Deciphering the Topological Landscape of Glioma Using a Network Theory Framework. Sci. Rep. 2024, 14, 26724. [Google Scholar] [CrossRef]
- Ni, X.R.; Guo, C.C.; Yu, Y.J.; Yu, Z.H.; Cai, H.P.; Wu, W.C.; Ma, J.X.; Chen, F.R.; Wang, J.; Chen, Z.P. Combination of Levetiracetam and IFN-α Increased Temozolomide Efficacy in MGMT-Positive Glioma. Cancer Chemother. Pharmacol. 2020, 86, 773–782. [Google Scholar] [CrossRef]
- Poornima, P.; Kumar, J.D.; Zhao, Q.; Blunder, M.; Efferth, T. Network Pharmacology of Cancer: From Understanding of Complex Interactomes to the Design of Multi-Target Specific Therapeutics from Nature. Pharmacol. Res. 2016, 111, 290–302. [Google Scholar] [CrossRef]
- Huang, S.; Kauffman, S. How to Escape the Cancer Attractor: Rationale and Limitations of Multi-Target Drugs. Semin. Cancer Biol. 2013, 23, 270–278. [Google Scholar] [CrossRef]
- Zhang, X.; Chen, Y.C.; Yao, M.; Xiong, R.; Liu, B.; Zhu, X.; Ao, P. Potential Therapeutic Targets of Gastric Cancer Explored under Endogenous Network Modeling of Clinical Data. Sci. Rep. 2024, 14, 13127. [Google Scholar] [CrossRef]
- Darmanis, S.; Sloan, S.A.; Croote, D.; Barres, B.A.; Gephart, M.H.; Quake, S.R.; Darmanis, S.; Sloan, S.A.; Croote, D.; Mignardi, M.; et al. Single-Cell RNA-Seq Analysis of Infiltrating Neoplastic Cells at the Migrating Front of Human Glioblastoma. Cell Rep. 2017, 21, 1399–1410. [Google Scholar] [CrossRef] [PubMed]
- Chen, J.; McKay, R.M.; Parada, L.F. Malignant Glioma: Lessons from Genomics, Mouse Models, and Stem Cells. Cell 2012, 149, 36–47. [Google Scholar] [CrossRef] [PubMed]
- Lever, J.; Krzywinski, M.; Altman, N. Principal Component Analysis. Nat. Methods 2017, 14, 641–642. [Google Scholar] [CrossRef]
- Tang, H.; Shrager, J.B. CRISPR/Cas-Mediated Genome Editing to Treat EGFR-Mutant Lung Cancer: A Personalized Molecular Surgical Therapy. EMBO Mol. Med. 2016, 8, 83–85. [Google Scholar] [CrossRef]
- Martincorena, I.; Fowler, J.C.; Wabik, A.; Lawson, A.R.J.; Abascal, F.; Hall, M.W.J.; Cagan, A.; Murai, K.; Mahbubani, K.; Stratton, M.R.; et al. Somatic Mutant Clones Colonize the Human Esophagus with Age. Science 2018, 362, 911–917. [Google Scholar] [CrossRef]
- Sedo, A.; Mentlein, R. Glioma Cell Biology; Sedo, A., Mentlein, R., Eds.; Springer: Vienna, Austria, 2014; ISBN 978-3-7091-1430-8. [Google Scholar]
- Laug, D.; Glasgow, S.M.; Deneen, B. A Glial Blueprint for Gliomagenesis. Nat. Rev. Neurosci. 2018, 19, 393–403. [Google Scholar] [CrossRef]
- Lee, J.; Hoxha, E.; Song, H.-R. A Novel NFIA-NFκB Feed-Forward Loop Contributes to Glioblastoma Cell Survival. Neuro-Oncology 2016, 19, 524–534. [Google Scholar] [CrossRef]
- Tang, G.; Yang, J.; Minemoto, Y.; Lin, A. Blocking Caspase-3-Mediated Proteolysis of IKKβ Suppresses TNF-α-Induced Apoptosis. Mol. Cell 2001, 8, 1005–1016. [Google Scholar] [CrossRef]
- Sherr, C.J.; Roberts, J.M. CDK Inhibitors: Positive and Negative Regulators of G1-Phase Progression. Genes Dev. 1999, 13, 1501–1512. [Google Scholar] [CrossRef]
- Otto, T.; Sicinski, P. Cell Cycle Proteins as Promising Targets in Cancer Therapy. Nat. Rev. Cancer 2017, 17, 93–115. [Google Scholar] [CrossRef] [PubMed]
- Engeland, K. Cell Cycle Regulation: P53-P21-RB Signaling. Cell Death Differ. 2022, 29, 946–960. [Google Scholar] [CrossRef] [PubMed]
- Rayess, H.; Wang, M.B.; Srivatsan, E.S. Cellular Senescence and Tumor Suppressor Gene P16. Int. J. Cancer 2012, 130, 1715–1725. [Google Scholar] [CrossRef] [PubMed]
- Dang, C.V. C-Myc Target Genes Involved in Cell Growth, Apoptosis, and Metabolism. Mol. Cell Biol. 1999, 19, 1–11. [Google Scholar] [CrossRef]
- Namihira, M.; Kohyama, J.; Semi, K.; Sanosaka, T.; Deneen, B.; Taga, T.; Nakashima, K. Committed Neuronal Precursors Confer Astrocytic Potential on Residual Neural Precursor Cells. Dev. Cell 2009, 16, 245–255. [Google Scholar] [CrossRef]
- Fridman, J.S.; Lowe, S.W. Control of Apoptosis by P53. Oncogene 2003, 22, 9030–9040. [Google Scholar] [CrossRef]
- Mittal, S.; Subramanyam, D.; Dey, D.; Kumar, R.V.; Rangarajan, A. Cooperation of Notch and Ras/MAPK Signaling Pathways in Human Breast Carcinogenesis. Mol. Cancer 2009, 8, 128. [Google Scholar] [CrossRef]
- De Francesco, E.M.; Maggiolini, M.; Musti, A.M. Crosstalk between Notch, HIF-1α and GPER in Breast Cancer EMT. Int. J. Mol. Sci. 2018, 19, 2011. [Google Scholar] [CrossRef]
- Meng, F. A Novel Role of HIF-1α/PROX-1/LYVE-1 Axis on Tissue Regeneration after Renal Ischaemia/Reperfusion in Mice. Arch. Physiol. Biochem. 2019, 125, 321–331. [Google Scholar] [CrossRef]
- Chen, Z.; Trotman, L.C.; Shaffer, D.; Lin, H.-K.; Dotan, Z.A.; Niki, M.; Koutcher, J.A.; Scher, H.I.; Ludwig, T.; Gerald, W.; et al. Crucial Role of P53-Dependent Cellular Senescence in Suppression of Pten-Deficient Tumorigenesis. Nature 2005, 436, 725–730. [Google Scholar] [CrossRef]
- Shostak, K.; Chariot, A. EGFR and NF-ΚB: Partners in Cancer. Trends Mol. Med. 2015, 21, 385–393. [Google Scholar] [CrossRef] [PubMed]
- Shen, J.; Xia, W.; Khotskaya, Y.B.; Huo, L.; Nakanishi, K.; Lim, S.-O.; Du, Y.; Wang, Y.; Chang, W.-C.; Chen, C.-H.; et al. EGFR Modulates MicroRNA Maturation in Response to Hypoxia through Phosphorylation of AGO2. Nature 2013, 497, 383–387. [Google Scholar] [CrossRef] [PubMed]
- Porter, A.G.; Jänicke, R.U. Emerging Roles of Caspase-3 in Apoptosis. Cell Death Differ. 1999, 6, 99–104. [Google Scholar] [CrossRef]
- Webb, A.E.; Brunet, A. FOXO Transcription Factors: Key Regulators of Cellular Quality Control. Trends Biochem. Sci. 2014, 39, 159–169. [Google Scholar] [CrossRef]
- Reiprich, S.; Wegner, M. From CNS Stem Cells to Neurons and Glia: Sox for Everyone. Cell Tissue Res. 2015, 359, 111–124. [Google Scholar] [CrossRef]
- Hidalgo, A.; Logan, A. Go and Stop Signals for Glial Regeneration. Curr. Opin. Neurobiol. 2017, 47, 182–187. [Google Scholar] [CrossRef]
- Lee, J.-W.; Bae, S.-H.; Jeong, J.-W.; Kim, S.-H.; Kim, K.-W. Hypoxia-Inducible Factor (HIF-1)α: Its Protein Stability and Biological Functions. Exp. Mol. Med. 2004, 36, 1–12. [Google Scholar] [CrossRef]
- Deveraux, Q.L.; Reed, J.C. IAP Family Proteins---Suppressors of Apoptosis. Genes Dev. 1999, 13, 239–252. [Google Scholar] [CrossRef]
- Deveraux, Q.L. IAPs Block Apoptotic Events Induced by Caspase-8 and Cytochrome c by Direct Inhibition of Distinct Caspases. EMBO J. 1998, 17, 2215–2223. [Google Scholar] [CrossRef]
- Pahl, H.L. Activators and Target Genes of Rel/NF-ΚB Transcription Factors. Oncogene 1999, 18, 6853–6866. [Google Scholar] [CrossRef]
- Vojtek, A.B.; Der, C.J. Increasing Complexity of the Ras Signaling Pathway. J. Biol. Chem. 1998, 273, 19925–19928. [Google Scholar] [CrossRef] [PubMed]
- Zhong, J.; Troppmair, J.; Rapp, U.R. Independent Control of Cell Survival by Raf-1 and Bcl-2 at the Mitochondria. Oncogene 2001, 20, 4807–4816. [Google Scholar] [CrossRef] [PubMed]
- Mori, T. Involvement of the P53-p16/RB Pathway Control Mechanism in Early-stage Carcinogenesis in Head and Neck Squamous Cell Carcinoma. Pathol. Int. 2022, 72, 577–588. [Google Scholar] [CrossRef] [PubMed]
- Zundel, W.; Schindler, C.; Haas-Kogan, D.; Koong, A.; Kaper, F.; Chen, E.; Gottschalk, A.R.; Ryan, H.E.; Johnson, R.S.; Jefferson, A.B.; et al. Loss of PTEN Facilitates HIF-1-Mediated Gene Expression. Genes Dev. 2000, 14, 391–396. [Google Scholar] [CrossRef]
- Gartel, A.L.; Radhakrishnan, S.K. Lost in Transcription: P21 Repression, Mechanisms, and Consequences. Cancer Res. 2005, 65, 3980–3985. [Google Scholar] [CrossRef]
- Gao, L.; Xu, W.; Fan, S.; Li, T.; Zhao, T.; Ying, G.; Zheng, J.; Li, J.; Zhang, Z.; Yan, F.; et al. MANF Attenuates Neuronal Apoptosis and Promotes Behavioral Recovery via Akt/MDM-2/P53 Pathway after Traumatic Spinal Cord Injury in Rats. BioFactors 2018, 44, 369–386. [Google Scholar] [CrossRef]
- Toledo, F.; Wahl, G.M. MDM2 and MDM4: P53 Regulators as Targets in Anticancer Therapy. Int. J. Biochem. Cell Biol. 2007, 39, 1476–1482. [Google Scholar] [CrossRef]
- Elbaz, B.; Popko, B. Molecular Control of Oligodendrocyte Development. Trends Neurosci. 2019, 42, 263–277. [Google Scholar] [CrossRef]
- Glasgow, S.M.; Zhu, W.; Stolt, C.C.; Huang, T.-W.; Chen, F.; LoTurco, J.J.; Neul, J.L.; Wegner, M.; Mohila, C.; Deneen, B. Mutual Antagonism between Sox10 and {NFIA} Regulates Diversification of Glial Lineages and Glioma Subtypes. Nat. Neurosci. 2014, 17, 1322–1329. [Google Scholar] [CrossRef]
- Wang, Y.; Wang, X.; Sun, M.; Zhang, Z.; Cao, H.; Chen, X. NF-KB Activity-Dependent P-Selectin Involved in Ox-LDL-Induced Foam Cell Formation in U937 Cell. Biochem. Biophys. Res. Commun. 2011, 411, 543–548. [Google Scholar] [CrossRef]
- Manning, B.D.; Cantley, L.C. AKT/PKB Signaling: Navigating Downstream. Cell 2007, 129, 1261–1274. [Google Scholar] [CrossRef] [PubMed]
- Karin, M.; Lin, A. NF-ΚB at the Crossroads of Life and Death. Nat. Immunol. 2002, 3, 221–227. [Google Scholar] [CrossRef] [PubMed]
- Wang, C.-Y.; Guttridge, D.C.; Mayo, M.W.; Baldwin, A.S. NF-ΚB Induces Expression of the Bcl-2 Homologue A1/Bfl-1 To Preferentially Suppress Chemotherapy-Induced Apoptosis. Mol. Cell. Biol. 1999, 19, 5923–5929. [Google Scholar] [CrossRef] [PubMed]
- Meng, F.; D’Mello, S.R. NF-ΚB Stimulates Akt Phosphorylation and Gene Expression by Distinct Signaling Mechanisms. Biochim. Biophys. Acta—Gene Struct. Expr. 2003, 1630, 35–40. [Google Scholar] [CrossRef]
- Al-Khalaf, H.H.; Aboussekhra, A. P16 Controls P53 Protein Expression Through MiR-Dependent Destabilization of MDM2. Mol. Cancer Res. 2018, 16, 1299–1308. [Google Scholar] [CrossRef]
- Hu, H.; Li, Z.; Chen, J.; Wang, D.; Ma, J.; Wang, W.; Li, J.; Wu, H.; Li, L.; Wu, M.; et al. P16 Reactivation Induces Anoikis and Exhibits Antitumour Potency by Downregulating Akt/Survivin Signalling in Hepatocellular Carcinoma Cells. Gut 2011, 60, 710–721. [Google Scholar] [CrossRef]
- Xiong, Y.; Hannon, G.J.; Zhang, H.; Casso, D.; Kobayashi, R.; Beach, D. P21 Is a Universal Inhibitor of Cyclin Kinases. Nature 1993, 366, 701–704. [Google Scholar] [CrossRef]
- Fruman, D.A.; Rommel, C. PI3K and Cancer: Lessons, Challenges and Opportunities. Nat. Rev. Drug Discov. 2014, 13, 140–156. [Google Scholar] [CrossRef]
- Kaufmann, S.H.; Hengartner, M.O. Programmed Cell Death: Alive and Well in the New Millennium. Trends Cell Biol. 2001, 11, 526–534. [Google Scholar] [CrossRef]
- Chang, H.Y.; Yang, X. Proteases for Cell Suicide: Functions and Regulation of Caspases. Microbiol. Mol. Biol. Rev. 2000, 64, 821–846. [Google Scholar] [CrossRef]
- Kastenhuber, E.R.; Lowe, S.W. Putting P53 in Context. Cell 2017, 170, 1062–1078. [Google Scholar] [CrossRef] [PubMed]
- Goswami, A.; Shah, B.A.; Kumar, A.; Rizvi, M.A.; Kumar, S.; Bhushan, S.; Malik, F.A.; Batra, N.; Joshi, A.; Singh, J. Antiproliferative Potential of a Novel Parthenin Analog P16 as Evident by Apoptosis Accompanied by Down-Regulation of PI3K/AKT and ERK Pathways in Human Acute Lymphoblastic Leukemia MOLT-4 Cells. Chem. Biol. Interact. 2014, 222, 60–67. [Google Scholar] [CrossRef] [PubMed]
- Thompson, J.E.; Thompson, C.B. Putting the Rap on Akt. J. Clin. Oncol. 2004, 22, 4217–4226. [Google Scholar] [CrossRef]
- Castellano, E.; Downward, J. RAS Interaction with PI3K: More Than Just Another Effector Pathway. Genes Cancer 2011, 2, 261–274. [Google Scholar] [CrossRef] [PubMed]
- Harbour, J.W.; Dean, D.C. Rb Function in Cell-Cycle Regulation and Apoptosis. Nat. Cell Biol. 2000, 2, E65–E67. [Google Scholar] [CrossRef]
- Singh, R.; Letai, A.; Sarosiek, K. Regulation of Apoptosis in Health and Disease: The Balancing Act of BCL-2 Family Proteins. Nat. Rev. Mol. Cell Biol. 2019, 20, 175–193. [Google Scholar] [CrossRef]
- Cardone, M.H.; Roy, N.; Stennicke, H.R.; Salvesen, G.S.; Franke, T.F.; Stanbridge, E.; Frisch, S.; Reed, J.C. Regulation of Cell Death Protease Caspase-9 by Phosphorylation. Science 1998, 282, 1318–1321. [Google Scholar] [CrossRef]
- Stambolic, V.; MacPherson, D.; Sas, D.; Lin, Y.; Snow, B.; Jang, Y.; Benchimol, S.; Mak, T.W. Regulation of PTEN Transcription by P53. Mol. Cell 2001, 8, 317–325. [Google Scholar] [CrossRef]
- Zou, H.; Yang, R.; Hao, J.; Wang, J.; Sun, C.; Fesik, S.W.; Wu, J.C.; Tomaselli, K.J.; Armstrong, R.C. Regulation of the Apaf-1/Caspase-9 Apoptosome by Caspase-3 and XIAP. J. Biol. Chem. 2003, 278, 8091–8098. [Google Scholar] [CrossRef]
- Alexander, K.; Hinds, P.W. Requirement for P27 KIP1 in Retinoblastoma Protein-Mediated Senescence. Mol. Cell. Biol. 2001, 21, 3616–3631. [Google Scholar] [CrossRef]
- Kharbanda, S.; Pandey, P.; Schofield, L.; Israels, S.; Roncinske, R.; Yoshida, K.; Bharti, A.; Yuan, Z.-M.; Saxena, S.; Weichselbaum, R.; et al. Role for Bcl-x L as an Inhibitor of Cytosolic Cytochrome C Accumulation in DNA Damage-Induced Apoptosis. Proc. Natl. Acad. Sci. USA 1997, 94, 6939–6942. [Google Scholar] [CrossRef] [PubMed]
- Yeung, S.J.; Pan, J.; Lee, M.-H. Roles of P53, Myc and HIF-1 in Regulating Glycolysis—The Seventh Hallmark of Cancer. Cell. Mol. Life Sci. 2008, 65, 3981–3999. [Google Scholar] [CrossRef] [PubMed]
- Haupt, S.; Berger, M.; Goldberg, Z.; Haupt, Y. Apoptosis—The P53 Network. J. Cell Sci. 2003, 116, 4077–4085. [Google Scholar] [CrossRef] [PubMed]
- Sundaram, M. RTK/Ras/MAPK Signaling. WormBook 2006, 17, 93–115. [Google Scholar] [CrossRef]
- Klum, S.; Zaouter, C.; Alekseenko, Z.; Björklund, Å.K.; Hagey, D.W.; Ericson, J.; Muhr, J.; Bergsland, M. Sequentially Acting SOX Proteins Orchestrate Astrocyte- and Oligodendrocyte-specific Gene Expression. EMBO Rep. 2018, 19, 1715–1725. [Google Scholar] [CrossRef]
- May, M.J.; Ghosh, S. Signal Transduction through NF-ΚB. Immunol. Today 1998, 19, 80–88. [Google Scholar] [CrossRef]
- Cully, M.; Downward, J. SnapShot: Ras Signaling. Cell 2008, 133, 1292–1292.e1. [Google Scholar] [CrossRef]
- Weider, M.; Wegner, M. SoxE Factors: Transcriptional Regulators of Neural Differentiation and Nervous System Development. Semin. Cell Dev. Biol. 2017, 63, 35–42. [Google Scholar] [CrossRef]
- Vasudevan, K.M.; Gurumurthy, S.; Rangnekar, V.M. Suppression of PTEN Expression by NF-ΚB Prevents Apoptosis. Mol. Cell. Biol. 2004, 24, 1007–1021. [Google Scholar] [CrossRef]
- Janku, F.; Yap, T.A.; Meric-Bernstam, F. Targeting the PI3K Pathway in Cancer: Are We Making Headway? Nat. Rev. Clin. Oncol. 2018, 15, 273–291. [Google Scholar] [CrossRef]
- Cory, S.; Adams, J.M. The Bcl2 Family: Regulators of the Cellular Life-or-Death Switch. Nat. Rev. Cancer 2002, 2, 647–656. [Google Scholar] [CrossRef] [PubMed]
- Greenhough, A.; Patsos, H.A.; Williams, A.C.; Paraskeva, C. The Cannabinoid δ 9 -tetrahydrocannabinol Inhibits RAS-MAPK and PI3K-AKT Survival Signalling and Induces BAD-mediated Apoptosis in Colorectal Cancer Cells. Int. J. Cancer 2007, 121, 2172–2180. [Google Scholar] [CrossRef]
- Xu, X.; Huang, L.; Futtner, C.; Schwab, B.; Rampersad, R.R.; Lu, Y.; Sporn, T.A.; Hogan, B.L.M.; Onaitis, M.W. The Cell of Origin and Subtype of K-Ras-Induced Lung Tumors Are Modified by Notch and Sox2. Genes Dev. 2014, 28, 1929–1939. [Google Scholar] [CrossRef] [PubMed]
- Huang, W.-C.; Hung, M.-C. Beyond NF-ΚB Activation: Nuclear Functions of IκB Kinase α. J. Biomed. Sci. 2013, 20, 3. [Google Scholar] [CrossRef]
- Mendelsohn, J.; Baselga, J. The EGF Receptor Family as Targets for Cancer Therapy. Oncogene 2000, 19, 6550–6565. [Google Scholar] [CrossRef]
- van der Vos, K.E.; Coffer, P.J. The Extending Network of FOXO Transcriptional Target Genes. Antioxid. Redox Signal. 2011, 14, 579–592. [Google Scholar] [CrossRef]
- Kato, K.; Forero, M.G.; Fenton, J.C.; Hidalgo, A. The Glial Regenerative Response to Central Nervous System Injury Is Enabled by Pros-Notch and Pros-NFκB Feedback. PLoS Biol. 2011, 9, e1001133. [Google Scholar] [CrossRef]
- Sundaram, M.V. The Love–Hate Relationship between Ras and Notch. Genes Dev. 2005, 19, 1825–1839. [Google Scholar] [CrossRef]
- LaPak, K.M.; Burd, C.E. The Molecular Balancing Act of P16INK4a in Cancer and Aging. Mol. Cancer Res. 2014, 12, 167–183. [Google Scholar] [CrossRef]
- Basu, A. The Relationship between BcI2, Bax and P53: Consequences for Cell Cycle Progression and Cell Death. Mol. Hum. Reprod. 1998, 4, 1099–1109. [Google Scholar] [CrossRef]
- Liu, Y.; Su, Z.; Tavana, O.; Gu, W. Understanding the Complexity of P53 in a New Era of Tumor Suppression. Cancer Cell 2024, 42, 946–967. [Google Scholar] [CrossRef] [PubMed]
- Eskes, R.; Desagher, S.; Antonsson, B.; Martinou, J.-C. Bid Induces the Oligomerization and Insertion of Bax into the Outer Mitochondrial Membrane. Mol. Cell. Biol. 2000, 20, 929–935. [Google Scholar] [CrossRef] [PubMed]
- Budihardjo, I.; Oliver, H.; Lutter, M.; Luo, X.; Wang, X. Biochemical Pathways of Caspase Activation During Apoptosis. Annu. Rev. Cell Dev. Biol. 1999, 15, 269–290. [Google Scholar] [CrossRef]
- Sun, C.; Yao, M.; Xiong, R.; Su, Y.; Zhu, B.; Chen, Y.C.; Ao, P. Evolution of Telencephalon Anterior–Posterior Patterning through Core Endogenous Network Bifurcation. Entropy 2024, 26, 631. [Google Scholar] [CrossRef] [PubMed]

| Target = 1 | Target = 1 | ||
|---|---|---|---|
| Intervention | Glioma States Proportion | Intervention | Glioma States Proportion |
| Akt = 0 | 2.29% | Akt = 1 | 91.53% |
| CDKN2A = 1 | 4.06% | MDM2 = 1 | 61.06% |
| P53 = 1 | 6.09% | CDKN2A = 0 | 53.34% |
| PTEN = 1 | 7.56% | Bcl2 = 1 | 52.61% |
| HIF = 0 | 25.15% | XIAP = 1 | 48.93% |
| BAD = 0 | 25.55% | P53 = 0 | 48.40% |
| Rb = 1 | 25.84% | NF-kB = 1 | 48.28% |
| BAX = 0 | 26.86% | CDK4 = 1 | 48.20% |
| IkB = 1 | 26.93% | PTEN = 0 | 46.68% |
| P21 = 1 | 27.09% | Notch = 0 | 44.54% |
| Notch = 1 | 27.67% | Rb = 0 | 42.24% |
| NF-kB = 0 | 27.95% | IkB = 0 | 39.81% |
| Ras = 0 | 28.08% | CASP3 = 0 | 38.31% |
| Sox9 = 0 | 28.11% | EGFR = 1 | 38.08% |
| Sox10 = 0 | 28.13% | NFIA = 1 | 37.88% |
| No Intervention | 28.32% | HIF = 1 | 36.66% |
| Olig = 1 | 28.43% | BAD = 1 | 36.44% |
| Bcl2 = 0 | 28.55% | P21 = 0 | 35.78% |
| MDM2 = 0 | 29.06% | Ras = 1 | 35.76% |
| BAX = 1 | 29.85% | NFIA = 0 | 35.48% |
| CASP9 = 0 | 30.26% | Sox10 = 1 | 35.01% |
| EGFR = 0 | 30.26% | CASP3 = 1 | 34.98% |
| Pros = 0 | 31.25% | Pros = 1 | 34.75% |
| XIAP = 0 | 31.69% | CASP9 = 1 | 34.60% |
| CDK4 = 0 | 33.45% | Olig = 0 | 34.38% |
| Sox9 = 1 | 33.60% | ||
| Targets = 2 | Targets = 2 | Targets = 3 | Targets = 3 | ||||
|---|---|---|---|---|---|---|---|
| Intervention | Glioma States Proportion | Intervention | Glioma States Proportion | Intervention | Glioma States Proportion | Intervention | Glioma States Proportion |
| Akt = 0 | 0.00% | Akt = 1 | 84.74% | NF-kB = 0 | 0.00% | IkB = 0 | 100.00% |
| P53 = 1 | CDKN2A = 0 | CDKN2A = 1 | Olig = 0 | ||||
| P53 = 1 | Akt = 1 | ||||||
| P21 = 1 | 0.80% | Akt = 1 | 83.28% | Akt = 0 | 0.00% | Akt = 1 | 100.00% |
| Akt = 0 | Ikb = 0 | Bcl2 = 0 | Rb = 0 | ||||
| P53 = 1 | NFIA = 0 | ||||||
| CDKN2A = 1 | 1.24% | Akt = 1 | 79.62% | CDKN2A = 1 | 0.00% | IkB = 0 | 100.00% |
| PTEN = 1 | CASP9 = 0 | P53 = 1 | P53 = 0 | ||||
| Ras = 1 | P21 = 0 | ||||||
| Akt = 0 | 1.27% | Notch = 0 | 78.44% | PTEN = 1 | 0.00% | Sox10 = 0 | 100.00% |
| Bcl2 = 1 | Akt = 1 | Notch = 1 | Bcl2 = 1 | ||||
| P53 = 1 | Akt = 1 | ||||||
| Akt = 0 | 1.33% | XIAP = 0 | 78.27% | PTEN = 1 | 0.00% | Rb = 0 | 100.00% |
| BAD = 1 | Akt = 1 | Rb = 1 | Akt = 1 | ||||
| NF-kB = 0 | P21 = 1 | ||||||
| Akt = 0 | 1.34% | XIAP = 1 | 77.82% | Sox10 = 0 | 0.00% | Akt = 1 | 100.00% |
| Notch = 1 | Akt = 1 | P53 = 1 | IkB = 0 | ||||
| Akt = 0 | Notch = 0 | ||||||
| Akt = 0 | 1.34% | Akt = 1 | 73.64% | NF-kB = 0 | 0.00% | BAX = 0 | 100.00% |
| XIAP = 1 | MDM2 = 0 | PTEN = 1 | Rb = 1 | ||||
| Akt = 0 | Akt = 1 | ||||||
| Akt = 0 | 1.40% | NF-kB = 1 | BAD = 1 | 0.00% | Akt = 1 | 100.00% | |
| Sox9 = 1 | CDKN2A = 0 | 68.83% | CDKN2A = 1 | Sox10 = 1 | |||
| NF-kB = 0 | XIAP = 0 | ||||||
| Pros = 1 | 1.45% | P53 = 0 | CDKN2A = 1 | 0.08% | NFIA = 0 | 100.00% | |
| Akt = 0 | PTEN = 0 | 55.99% | Notch = 1 | Akt = 1 | |||
| PTEN = 1 | BAD = 0 | ||||||
| Olig = 1 | 1.46% | CDKN2A = 0 | Akt = 0 | 0.09% | IkB = 0 | 100.00% | |
| Akt = 0 | Rb = 0 | 52.51% | BAX = 1 | NFIA = 0 | |||
| CDKN2A = 1 | Akt = 1 | ||||||
| BAD = 0 | 1.46% | CDKN2A = 0 | Ras = 1 | 0.12% | P21 = 0 | 100.00% | |
| Akt = 0 | BAX = 1 | 51.37% | Rb = 1 | Bcl2 = 1 | |||
| PTEN = 1 | Notch = 0 | ||||||
| XIAP = 0 | 1.47% | PTEN = 0 | P21 = 1 | 0.14% | Akt = 1 | 100.00% | |
| Akt = 0 | NF-kB = 1 | 50.21% | PTEN = 1 | Rb = 0 | |||
| Bcl2 = 0 | EGFR = 0 | ||||||
| NFIA = 1 | 1.49% | HIF = 0 | Olig = 1 | 0.17% | BAD = 1 | 100.00% | |
| Akt = 0 | P53 = 0 | 48.87% | NF-kB = 0 | Pros = 0 | |||
| CDKN2A = 1 | Akt = 1 | ||||||
| Akt = 0 | 1.51% | BAX = 1 | P53 = 1 | 0.35% | Pros = 0 | 100.00% | |
| Sox10 = 1 | P53 = 0 | 48.75% | XIAP = 1 | P53 = 0 | |||
| PTEN = 1 | P21 = 0 | ||||||
| EGFR = 1 | 1.59% | Notch = 1 | PTEN = 1 | 0.48% | CASP9 = 0 | 100.00% | |
| Akt = 0 | P53 = 0 | 48.27% | Pros = 1 | XIAP = 0 | |||
| MDM2 = 0 | Akt = 1 | ||||||
| Olig = 0 | 1.68% | XIAP = 1 | P53 = 1 | 0.60% | Olig = 1 | 100.00% | |
| Akt = 0 | CDKN2A = 0 | 47.84% | Bcl2 = 1 | Akt = 1 | |||
| PTEN = 1 | BAX = 1 | ||||||
| CDKN2A = 1 | 3.23% | P53 = 0 | CASP9 = 1 | 0.73% | Akt = 1 | 100.00% | |
| NF-kB = 0 | P53 = 0 | 47.79% | Ras = 1 | Sox10 = 0 | |||
| Akt = 0 | Bcl2 = 1 | ||||||
| Ras = 0 | 3.64% | P53 = 0 | EGFR = 1 | 0.79% | Akt = 1 | 100.00% | |
| CDKN2A = 1 | Pros = 1 | 47.71% | CDKN2A = 1 | CASP9 = 1 | |||
| BAX = 1 | Notch = 0 | ||||||
| CDKN2A = 1 | 3.73% | XIAP = 0 | PTEN = 1 | 0.96% | Akt = 1 | 100.00% | |
| BAX = 0 | P53 = 0 | 47.58% | NF-kB = 0 | Notch = 0 | |||
| Notch = 1 | XIAP = 1 | ||||||
| CDKN2A = 1 | 3.80% | Olig = 0 | HIF = 0 | 1.02% | IkB = 0 | 100.00% | |
| Sox10 = 1 | P53 = 0 | 47.58% | CASP9 = 1 | BAD = 0 | |||
| PTEN = 1 | Akt = 1 | ||||||
| NFIA = 1 | 3.91% | P53 = 0 | Akt = 0 | 1.09% | Akt = 1 | 100.00% | |
| CDKN2A = 1 | XIAP = 1 | 47.26% | CASP9 = 1 | Ras = 0 | |||
| Sox9 = 1 | PTEN = 1 | ||||||
| EGFR = 1 | 4.15% | P21 = 0 | CDKN2A = 1 | 1.17% | Akt = 1 | 100.00% | |
| CDKN2A = 1 | PTEN = 0 | 47.12% | Sox10 = 1 | Rb = 0 | |||
| Rb = 1 | BAD = 1 | ||||||
| P53 = 1 | 4.96% | NFIA = 1 | PTEN = 1 | 1.31% | Akt = 1 | 100.00% | |
| MDM2 = 0 | P53 = 0 | 46.87% | Bcl2 = 0 | MDM2 = 1 | |||
| HIF = 0 | P21 = 0 | ||||||
| P53 = 1 | 5.42% | EGFR = 0 | CASP9 = 1 | 1.46% | Akt = 1 | 100.00% | |
| Ras = 0 | P53 = 0 | 46.64% | P53 = 1 | IkB = 1 | |||
| NF-kB = 0 | HIF = 0 | ||||||
| PTEN = 1 | 5.75% | Ras = 0 | PTEN = 1 | 1.47% | Akt = 1 | 100.00% | |
| MDM2 = 0 | CDKN2A = 0 | 46.60% | Pros = 0 | NFIA = 1 | |||
| MDM2 = 0 | Olig = 1 | ||||||
Disclaimer/Publisher’s Note: The statements, opinions and data contained in all publications are solely those of the individual author(s) and contributor(s) and not of MDPI and/or the editor(s). MDPI and/or the editor(s) disclaim responsibility for any injury to people or property resulting from any ideas, methods, instructions or products referred to in the content. |
© 2025 by the authors. Licensee MDPI, Basel, Switzerland. This article is an open access article distributed under the terms and conditions of the Creative Commons Attribution (CC BY) license (https://creativecommons.org/licenses/by/4.0/).
Share and Cite
Yao, M.; Zhu, X.; Chen, Y.-C.; Yang, G.-H.; Ao, P. Exploring Multi-Target Therapeutic Strategies for Glioblastoma via Endogenous Network Modeling. Int. J. Mol. Sci. 2025, 26, 3283. https://doi.org/10.3390/ijms26073283
Yao M, Zhu X, Chen Y-C, Yang G-H, Ao P. Exploring Multi-Target Therapeutic Strategies for Glioblastoma via Endogenous Network Modeling. International Journal of Molecular Sciences. 2025; 26(7):3283. https://doi.org/10.3390/ijms26073283
Chicago/Turabian StyleYao, Mengchao, Xiaomei Zhu, Yong-Cong Chen, Guo-Hong Yang, and Ping Ao. 2025. "Exploring Multi-Target Therapeutic Strategies for Glioblastoma via Endogenous Network Modeling" International Journal of Molecular Sciences 26, no. 7: 3283. https://doi.org/10.3390/ijms26073283
APA StyleYao, M., Zhu, X., Chen, Y.-C., Yang, G.-H., & Ao, P. (2025). Exploring Multi-Target Therapeutic Strategies for Glioblastoma via Endogenous Network Modeling. International Journal of Molecular Sciences, 26(7), 3283. https://doi.org/10.3390/ijms26073283