Article

Phylogenetic Analysis and Expression Patterns of Triterpenoid Saponin Biosynthesis Genes in 19 Araliaceae Plants

School of Tropical Agriculture and Forestry, Hainan University, Haikou 570228, China
*
Author to whom correspondence should be addressed.
These authors contributed equally to this work.
Int. J. Mol. Sci. 2025, 26(7), 3439; https://doi.org/10.3390/ijms26073439
Submission received: 6 February 2025 / Revised: 18 March 2025 / Accepted: 1 April 2025 / Published: 7 April 2025
(This article belongs to the Section Molecular Plant Sciences)

Abstract

:
The Araliaceae family has significant economic and medicinal value. However, the phylogenetic relationships and the expression patterns of key genes of the active triterpenoid substance within this family are still unclear. In this study, we employed comparative transcriptomics to analyze the transcriptomes of 19 species from 11 genera of Araliaceae, aiming to elucidate the evolutionary history of the family and the expression patterns of key genes in the ginsenoside biosynthesis pathway. Our results divide Araliaceae into two subfamilies: Aralioideae and Hydrocotyloideae. Aralioideae is further classified into three groups: the Aralia–Panax group, the Polyscias–Pseudopanax group, and the Asian Palmate group. PhyloNet analysis reveals that the common ancestor of Panax ginseng, Panax quinquefolius, and Panax japonicus was an allopolyploid, likely resulting from hybridization between Panax notoginseng and Panax pseudoginseng. Additionally, all Aralioideae species underwent the pg-β event, which may be critical for ginsenoside biosynthesis. We discovered that Panax species exhibit distinct expression patterns of key enzyme genes (β-AS, DDS, CYP450, UGTs) compared to other Araliaceae species. These enzyme genes show independent evolutionary lineages in gene trees, suggesting unique functional adaptations that enable Panax species to efficiently synthesize ginsenosides. This study provides a theoretical foundation for the conservation and utilization of Araliaceae germplasm resources.

1. Introduction

The Araliaceae family comprises approximately 45 genera and over 1500 species, widely distributed across tropical and temperate regions of both hemispheres. These plants exhibit rich morphological diversity, including trees, shrubs, and perennial herbs [1]. The family Araliaceae is divided into two subfamilies: Aralioideae and Hydrocotyloideae [2]. Many species in the Aralioideae subfamily possess medicinal value, with the most renowned being Panax species such as P. ginseng, P. notoginseng, and P. quinquefolius. In China, the dried roots of P. ginseng and P. notoginseng have been used as medicinal herbs for thousands of years, as documented in numerous classical medical texts, such as Shen-nong’s Herbal Classics and Compendium of Materia Medica [3,4]. P. quinquefolius, native to North America, was later introduced to China and was first recorded in the Supplement to the Illustrated New Compilation of Materia Medica in 1694 [5]. Today, these plants are widely utilized not only as medicinal herbs but also as dietary supplements and functional foods on a global scale [6]. Pharmacological studies have revealed that their primary bioactive components, ginsenosides, exhibit diverse biological activities, including cardioprotective, anti-inflammatory, anticancer, and antidiabetic effects [7].
Ginsenosides, classified as triterpenoid compounds, are categorized into dammarane-type and oleanane-type based on their skeleton structure. Among these, dammarane-type ginsenosides are the primary constituents and can be further divided into protopanaxadiol, protopanaxatriol, and ocotillol types [6]. The biosynthetic pathway of ginsenosides originates from the mevalonate (MVA) pathway and the plastid-derived 2-C-methyl-D-erythritol 4-phosphate (MEP) pathway, which synthesize isopentenyl pyrophosphate (IPP) and its isomer dimethylallyl pyrophosphate (DMAPP) [8]. Subsequently, IPP and DMAPP are converted into 2,3-oxidosqualene, which undergoes cyclization, hydroxylation, and glycosylation to ultimately produce ginsenosides [6]. Panax species, renowned for their abundant ginsenosides, have been overharvested. Coupled with their long growth cycles and stringent environmental requirements, this has resulted in wild P. ginseng becoming endangered and P. notoginseng being extinct in the wild [9,10]. Therefore, elucidating the phylogenetic relationships of Araliaceae plants and deciphering the biosynthetic pathway of ginsenosides not only provides a scientific basis for the conservation and sustainable utilization of endangered plants but also offers crucial genetic information for the field of ginsenoside biosynthesis and metabolic engineering. These efforts are of significant importance for preserving biodiversity and enhancing the medicinal value of Araliaceae plants.
The morphological characteristics of Araliaceae plants are highly complex and diverse, with relatively conserved floral traits. As a result, early morphological classifications predominantly relied on floral characteristics. For example, Harms (1898) [11] classified Araliaceae plants into three groups: Aralieae, Mackinlayeae, and Schefflereae, based on the form of the corolla folding. With the advancement of molecular biology, the internal transcribed spacer (ITS) of nuclear rRNA genes and the trnL-trnF region of the chloroplast genome have become critical tools for studying the phylogeny of Araliaceae. These studies indicate that the subfamily Aralioideae can be further divided into four groups: the Aralia–Panax group and Asian Palmate group, distributed in East Asia and Southeast Asia, and the Polyscias–Pseudopanax group and Greater Raukaua group, found in the Pacific and Indian Oceans [1,12,13]. However, studies based on limited genetic fragments provide insufficient phylogenetic resolution, leaving the basal evolutionary relationships unclear. Additionally, the complexity introduced by multiple hybridization events, polyploidization, and rapid evolution presents ongoing challenges for further elucidation of the phylogenetic relationships within Araliaceae.
With the rapid advancements in sequencing technologies and the field of phylogenetics, approaches such as whole-chloroplast genome sequencing, target gene capture sequencing, and reduced-representation genome sequencing have been applied to phylogenetic studies of Araliaceae [2,14,15]. Compared to these methods, transcriptome sequencing has emerged as an essential tool for phylogenetic research due to its richness in informative loci, low cost, and high feasibility [16,17,18]. Single-copy orthologous genes obtained from transcriptomes have demonstrated strong capabilities in resolving complex phylogenetic problems across various taxa. For example, this approach was utilized in the “One Thousand Plant Transcriptomes Project” to reveal the evolutionary relationships of green plants [17]. Additionally, it has been applied in phylogenetic studies of Leguminosae [19], Asteraceae [20], and Camellia [16]. However, its application in the Araliaceae family remains relatively limited. Moreover, transcriptome data can provide critical insights into important biological processes such as polyploidization, hybridization, and incomplete lineage sorting [17,21,22]. Since transcriptomes contain gene expression information, they also enable the investigation of expression patterns of key genes involved in the ginsenoside biosynthesis pathway.
With the ongoing progress of sequencing technology, a vast amount of plant transcriptome data has been made publicly available, offering a robust data foundation for plant phylogenetic analysis. We have gathered all available transcriptome data for Araliaceae plants from public databases and successfully obtained transcriptome data from 19 Araliaceae plant species. This study aims to utilize comparative transcriptomics to analyze transcriptome data from 19 publicly available species of the Araliaceae family and two outgroup species from the Apiaceae family (Centella asiatica and Daucus carota), totaling 21 species. The objectives are to explore the phylogenetic relationships, complex evolutionary history of Araliaceae, and the expression patterns of key genes involved in the ginsenoside biosynthesis pathway. The findings will provide a scientific basis and data foundation for the conservation and sustainable utilization of Araliaceae genetic resources, as well as for the genetic breeding and varietal improvement of economically important species.

2. Results

2.1. Assembly and Characterization of Transcriptome of Araliaceae Plants

Transcriptomics provides rich genetic information and serves as a crucial data foundation for unraveling the evolutionary history of Araliaceae plants. We collected transcriptome data for 19 species of Araliaceae plants from public databases and selected C. asiatica and D. carota from the Apiaceae family as outgroup species, utilizing transcriptome data from a total of 21 species. De novo transcriptome assembly was performed using Trinity v2.15.1, yielding 6,098,021 transcripts with an N50 value of 1467 bp (Table S1). The completeness of the assembled transcripts was assessed using BUSCO v5.4.7 with the core eudicot database. The results showed that the transcriptome assemblies for most species had completeness levels exceeding 90%, except for Hedera helix (54.10%) and Hydrocotyle umbellata (54.40%), which had completeness levels below 80% (Table S2). The lower completeness in these two species is likely due to the use of transcriptome sequencing data from only a single tissue and the lack of replicates. Overall, the high completeness of our transcriptome assemblies provides a robust foundation for subsequent analyses.
Functional annotation of the predicted proteins was performed using seven databases: SwissProt, PFAM, KEGG, GO, COG, TAIR11, and Non-Redundant Protein Database (NR). A total of 5,023,301 protein sequences were successfully annotated with known proteins or domains (Table S3). Transcription factor (TF) annotation conducted using ITAK v1.6 identified 59208 protein sequences belonging to TF families, with an average of 2819 per species. Among these, AP2/ERF-ERF (n = 4137) was the most abundant TF family in the Araliaceae transcriptomes, followed by C2H2 (n = 4060) and bHLH (n = 4030) (Table S4). Additionally, 79,585 simple sequence repeat (SSR) loci were identified (Table S5). Of these, 87 loci exhibited polymorphism between individual plants, providing valuable genetic resources for genomic studies and breeding efforts in Araliaceae species (Table S6).

2.2. Phylogenetic Trees and Divergence Times of Araliaceae Plants Based on Comparative Transcriptomic Analysis

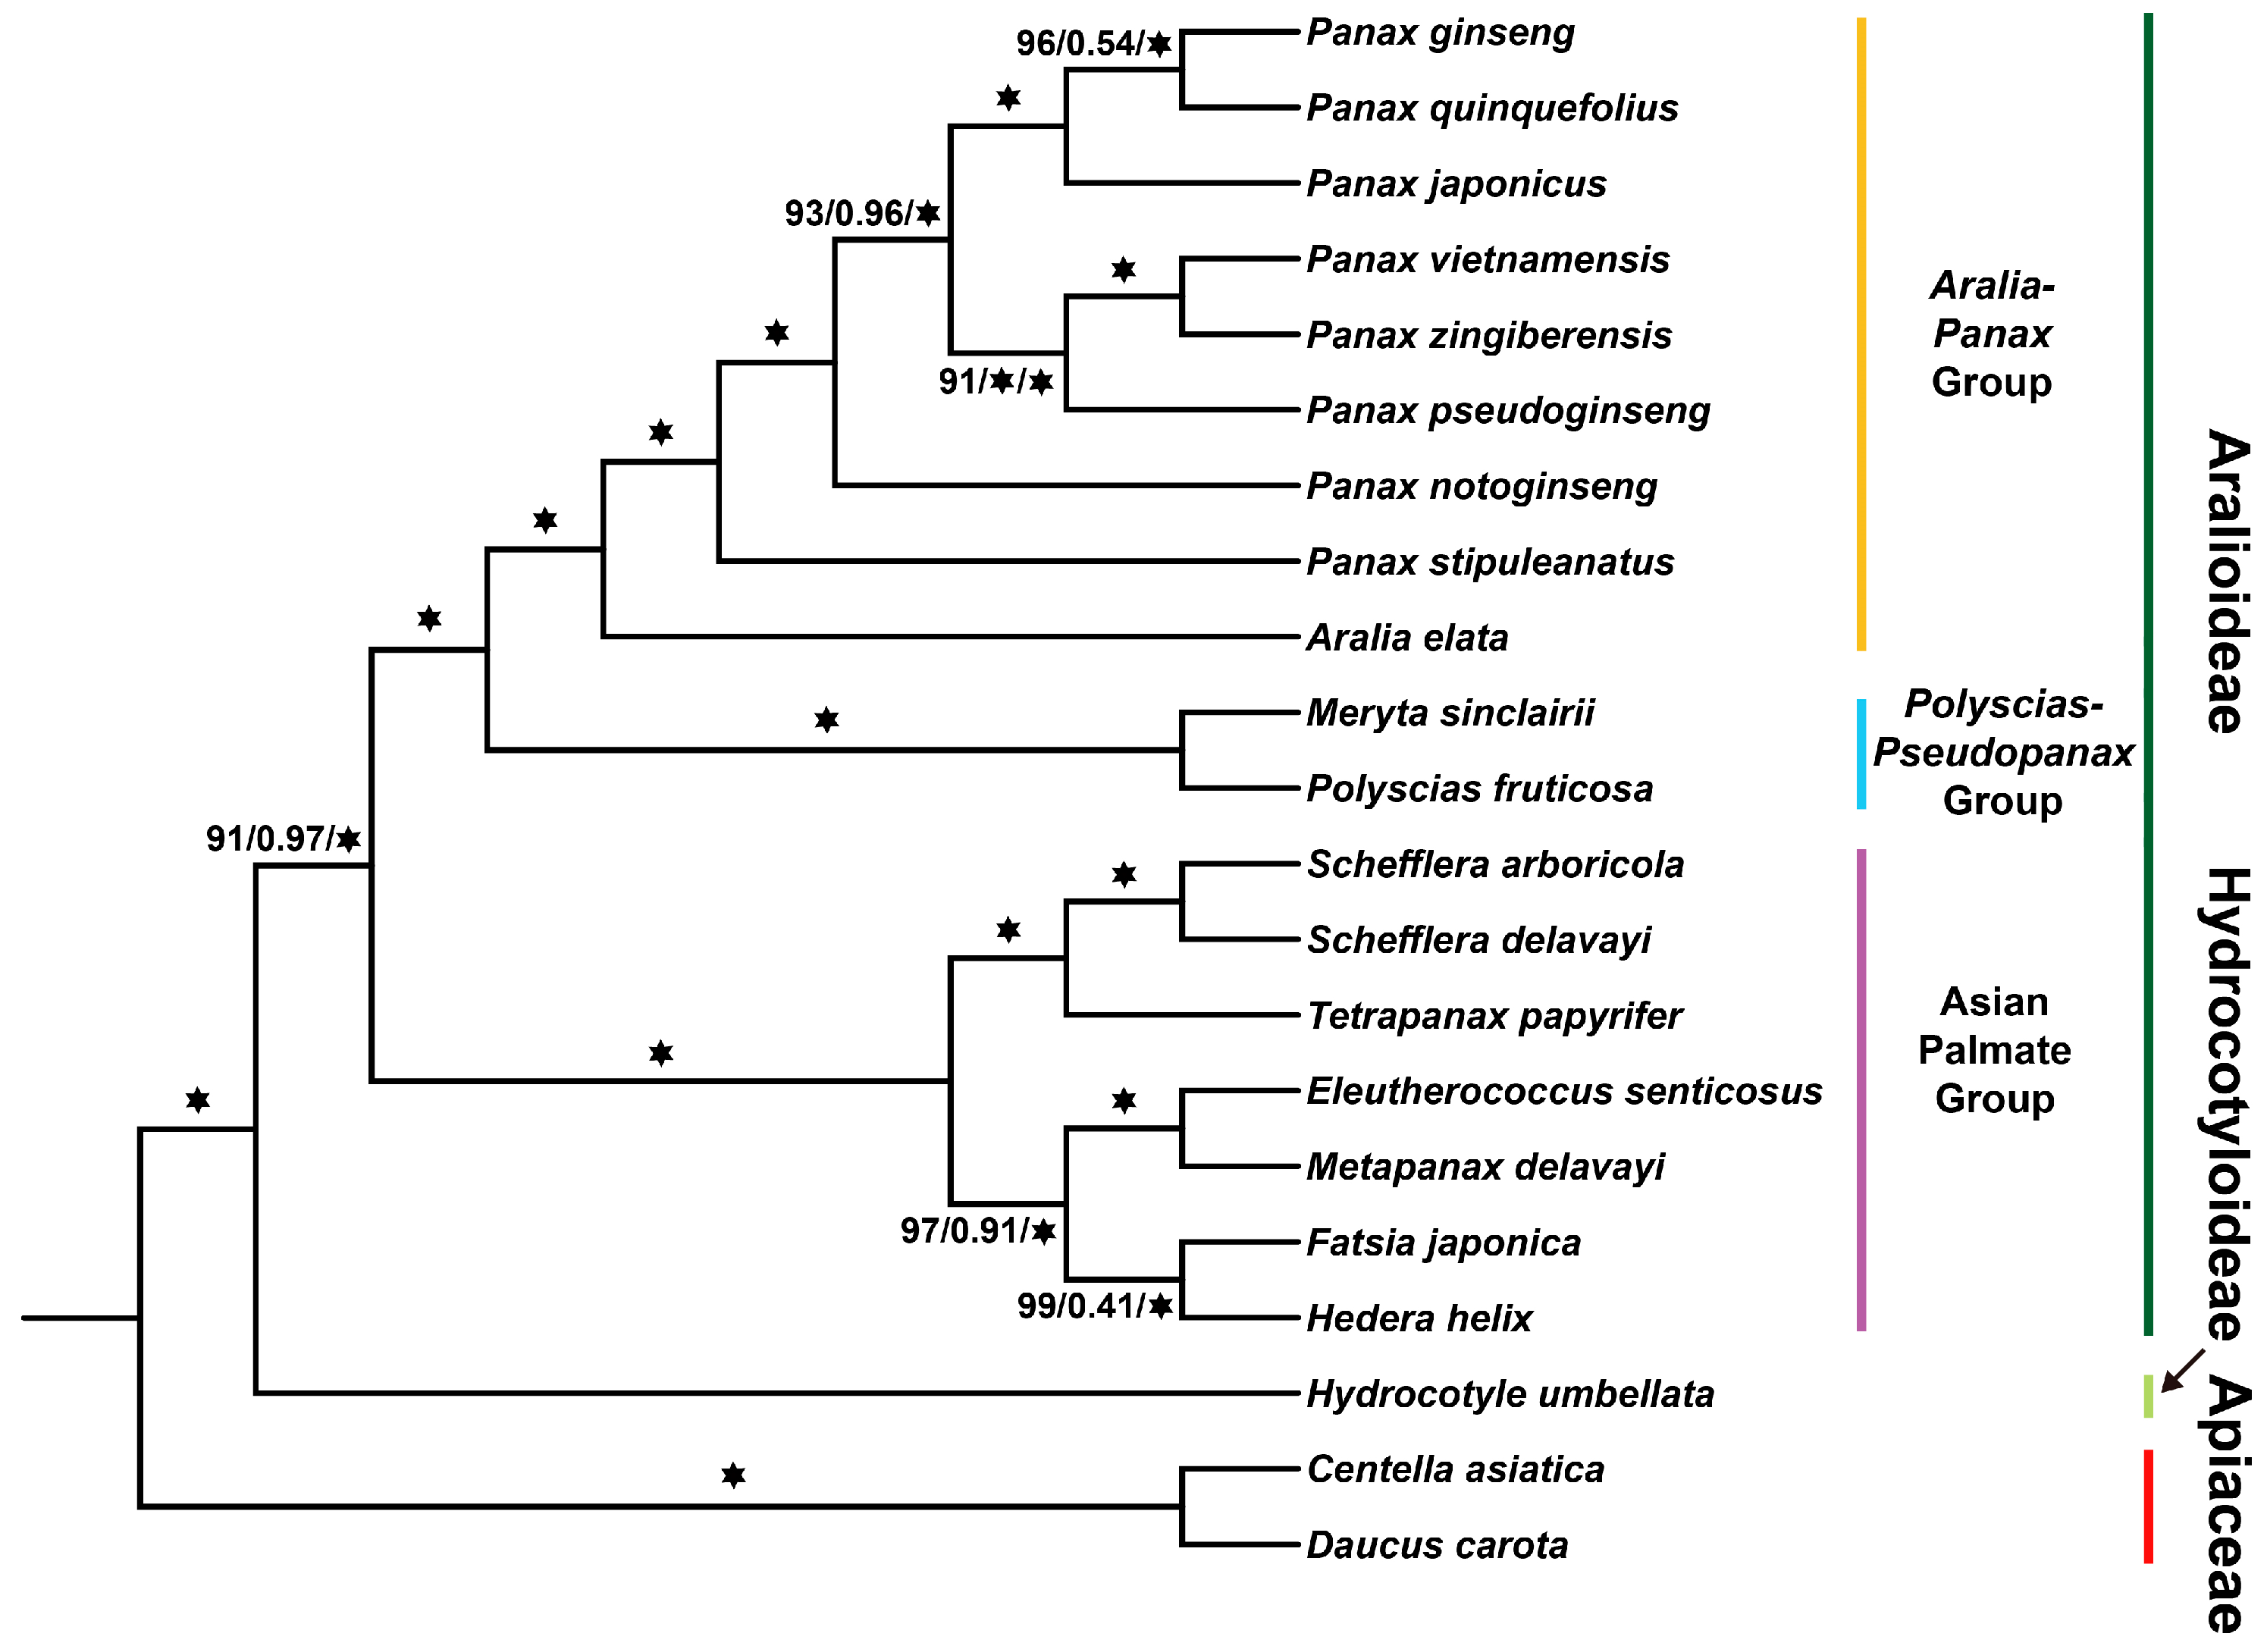
Obtaining accurate single-copy orthologous genes from the transcriptome data will enable us to correctly resolve the phylogenetic relationships among Araliaceae plants. We identified 510 single-copy orthologous genes across the 21 species. We used these data, combined with both concatenation-based and coalescent-based methods, to construct a phylogenetic tree in order to reveal the evolutionary relationships and taxonomic status within the Araliaceae family. In the concatenation-based method, we constructed a maximum likelihood tree using IQ-TREE v2.2.5 and a Bayesian tree using MrBayes v3.2.7a. The tree in the coalescent-based method was constructed using ASTRAL v5.7.8. The three species trees we ultimately obtained consistently displayed the same phylogenetic relationships (Figure 1). Only the concatenation-based tree showed relatively low branch support for P. ginseng and P. quinquefolius (local posterior probability = 0.54), as well as for Fatsia japonica and H. helix (local posterior probability = 0.41). All other branches showed high support [IQ-TREE bootstrap support > 90, MrBayes posterior probability > 0.9, ASTRAL local posterior probability > 0.9], with most branches receiving maximum support, indicating that the reliability of our phylogenetic trees is very high (Figure 1). The species tree showed that the Araliaceae family is divided into two major subfamilies: Hydrocotyloideae, represented by Hydrocotyle species, and Aralioideae, which includes other Araliaceae plants. Within Aralioideae, the Asian Palmate group diverged first, forming the sister clade to the remaining Aralioideae species. The Polyscias–Pseudopanax group and the Aralia–Panax group, which includes the Panax, are placed within the same major clade, where they are sister branches to one another (Figure 1).
Due to the lower support for the branches of P. ginseng and P. quinquefolius (local posterior probability = 0.54), as well as F. japonica and H. helix (local posterior probability = 0.41) in the coalescent-based tree, we used PhyParts v0.0.1 to detect conflicts between the species tree and gene trees in order to investigate the reasons for the lower support of these two branches. In the PhyParts v0.0.1 results, the sister relationship between P. ginseng and P. quinquefolius was supported by 114 gene trees, accounting for 23.3% of all gene trees, while the most consistent conflicting gene trees accounted for 24.1% (Figure 2). The sister relationship between F. japonica and H. helix was supported by 71 gene trees, representing 14.5% of all gene trees, with the most consistent conflicting gene trees accounting for 10.6% (Figure 2). These findings suggest that the low branch support may be attributed to incomplete lineage sorting (ILS) or hybridization. Nevertheless, our three species trees share the same topology, and the concatenation-based maximum likelihood and Bayesian tree analyses provided high support for these two branches [bootstrap support = 96 and 99, posterior probability = 1] (Figure 1). This indicates that phylogenetic analyses using larger datasets can mitigate the impact of incomplete lineage sorting on the topology, thereby yielding more accurate phylogenetic relationships. In conclusion, the phylogenetic tree of Araliaceae constructed based on 510 single-copy orthologous genes demonstrated high robustness. These results suggest that identifying and utilizing a sufficient number of single-copy orthologous genes from the transcriptomes of Araliaceae plants can effectively reveal accurate phylogenetic relationships.
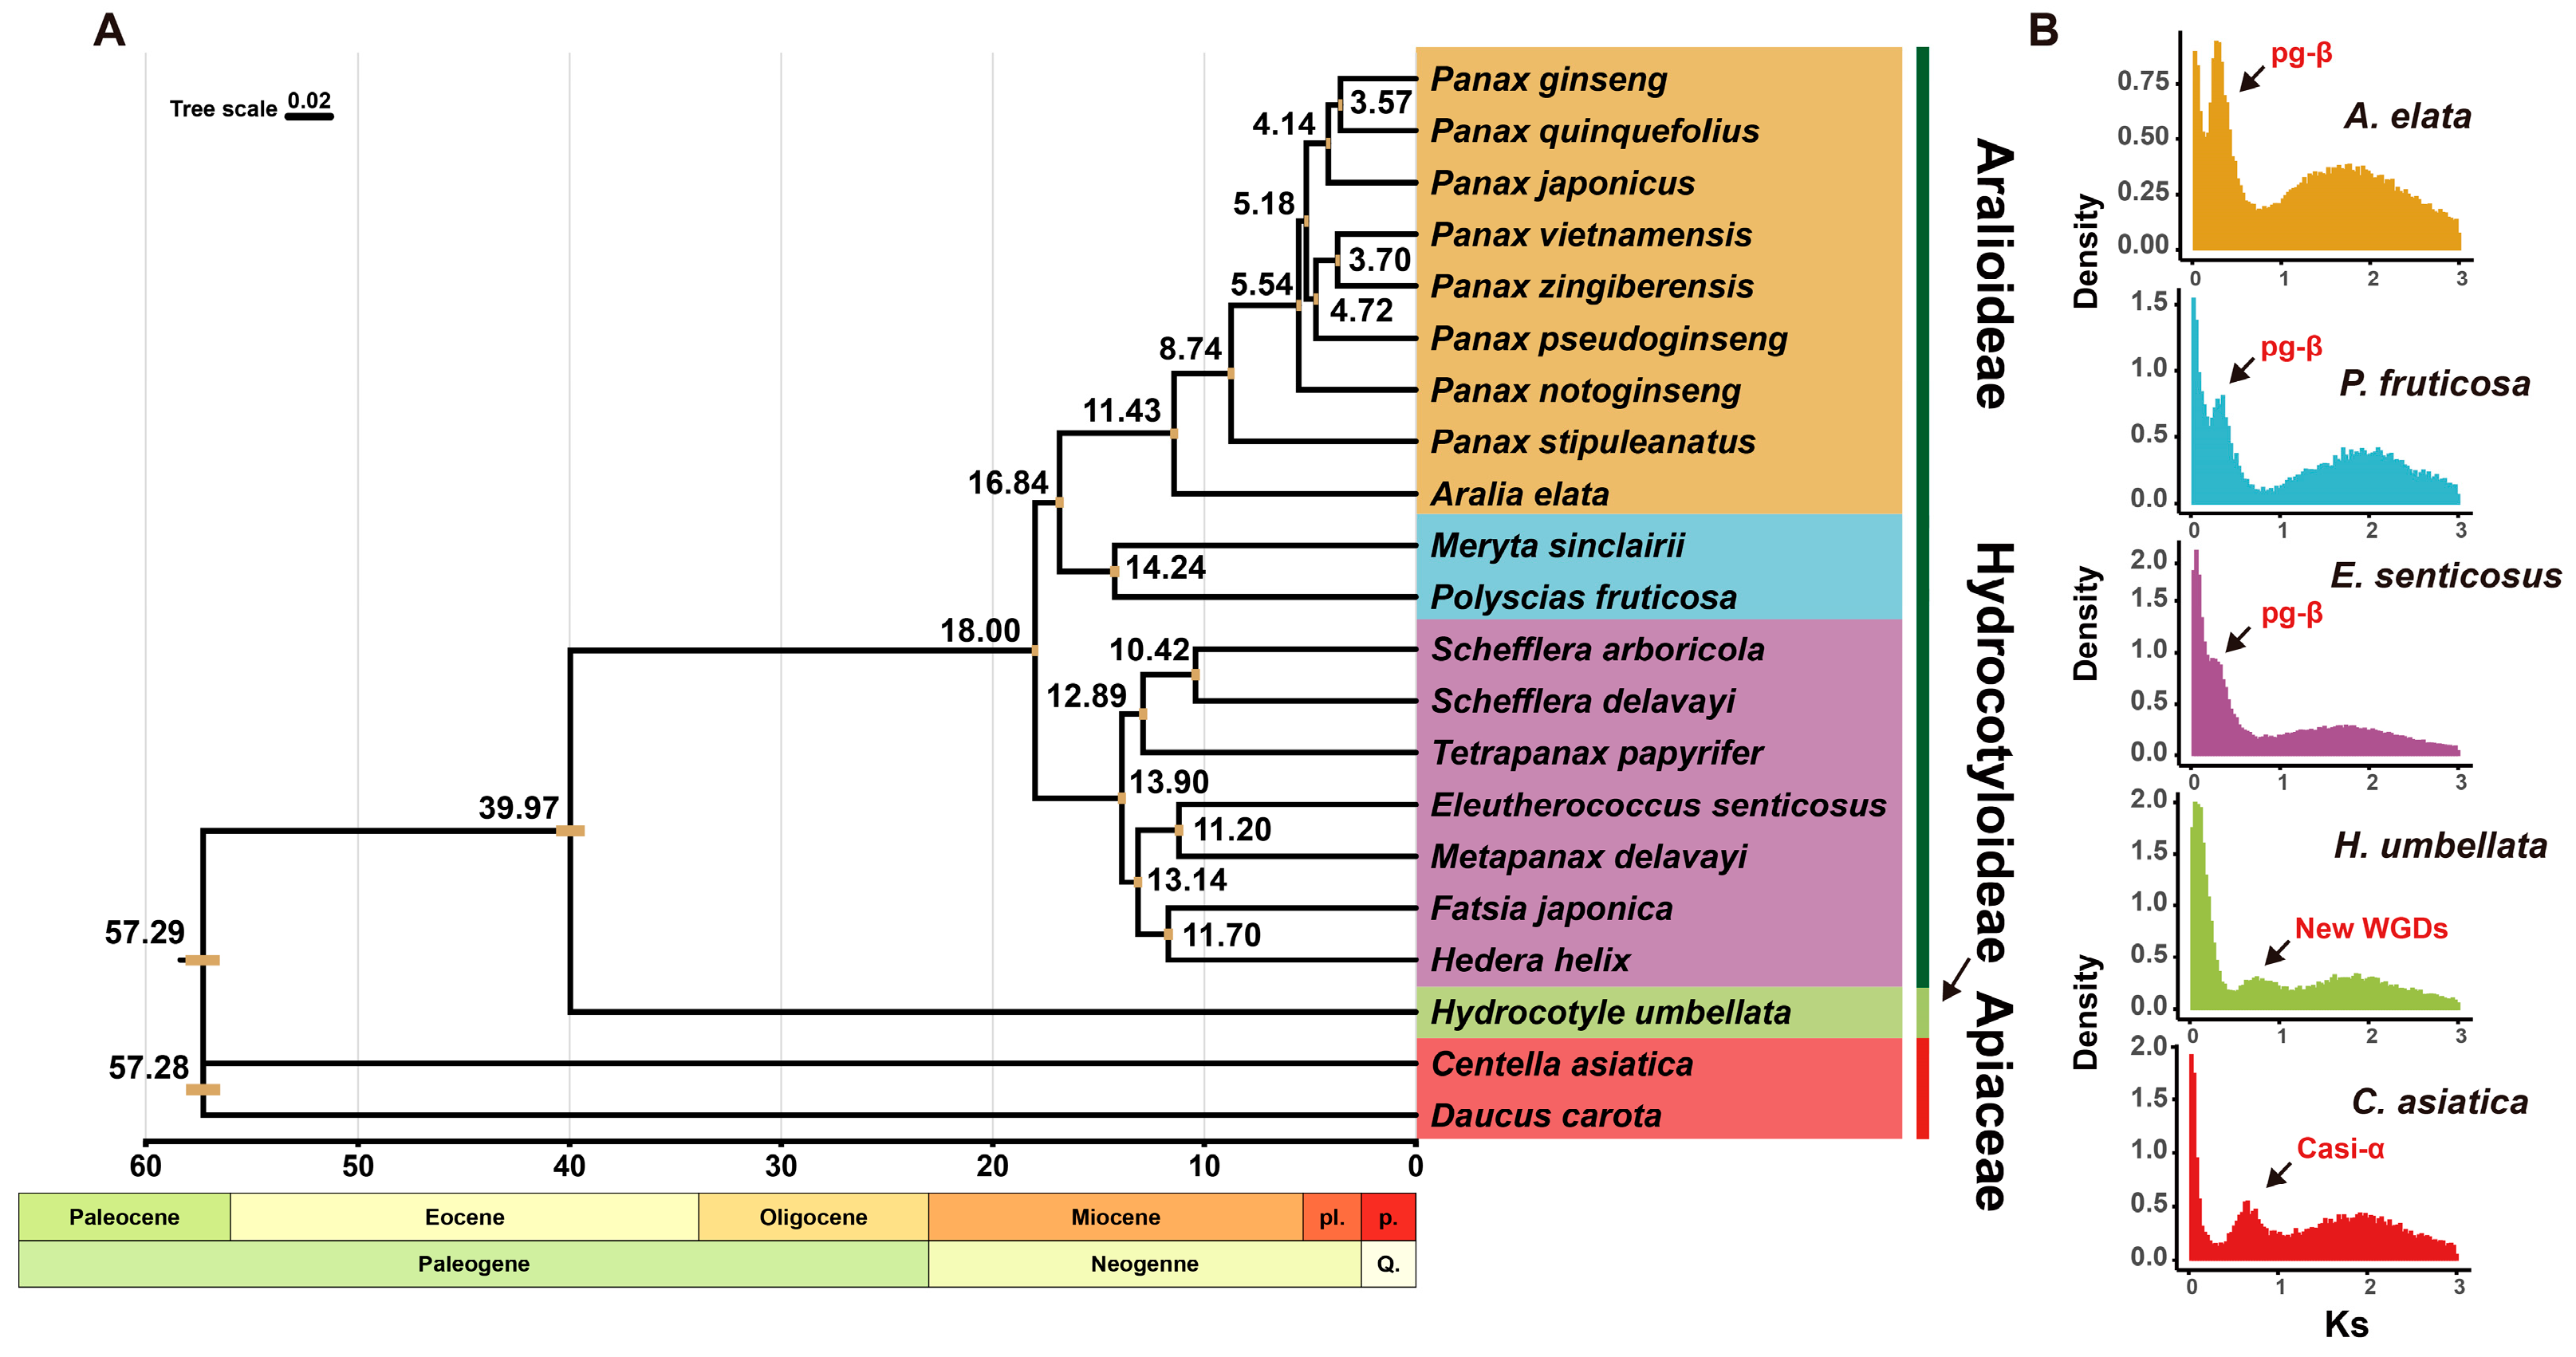
Based on the reliable phylogenetic topology of Araliaceae, we estimated the divergence times within the family. The results indicate that Araliaceae originated approximately 57.29 million years ago (MYA) [95% HPD = 56.5, 58.12]. The divergence between Hydrocotyloideae and Aralioideae occurred around 39.97 MYA [95% HPD = 39.29, 40.64]. The diversification of Aralioideae began approximately 18 MYA [95% HPD = 17.85, 18.16]. The emergence of Panax dates back to around 11.43 MYA [95% HPD = 11.24, 11.62], while the origin of the tetraploid lineage within Panax (including P. ginseng, P. quinquefolius, and P. japonicus) is estimated to have occurred approximately 5.18 MYA [95% HPD = 5.07, 5.28] (Figure 3A).

2.3. The Evolutionary Origin of Polyploid Panax Species

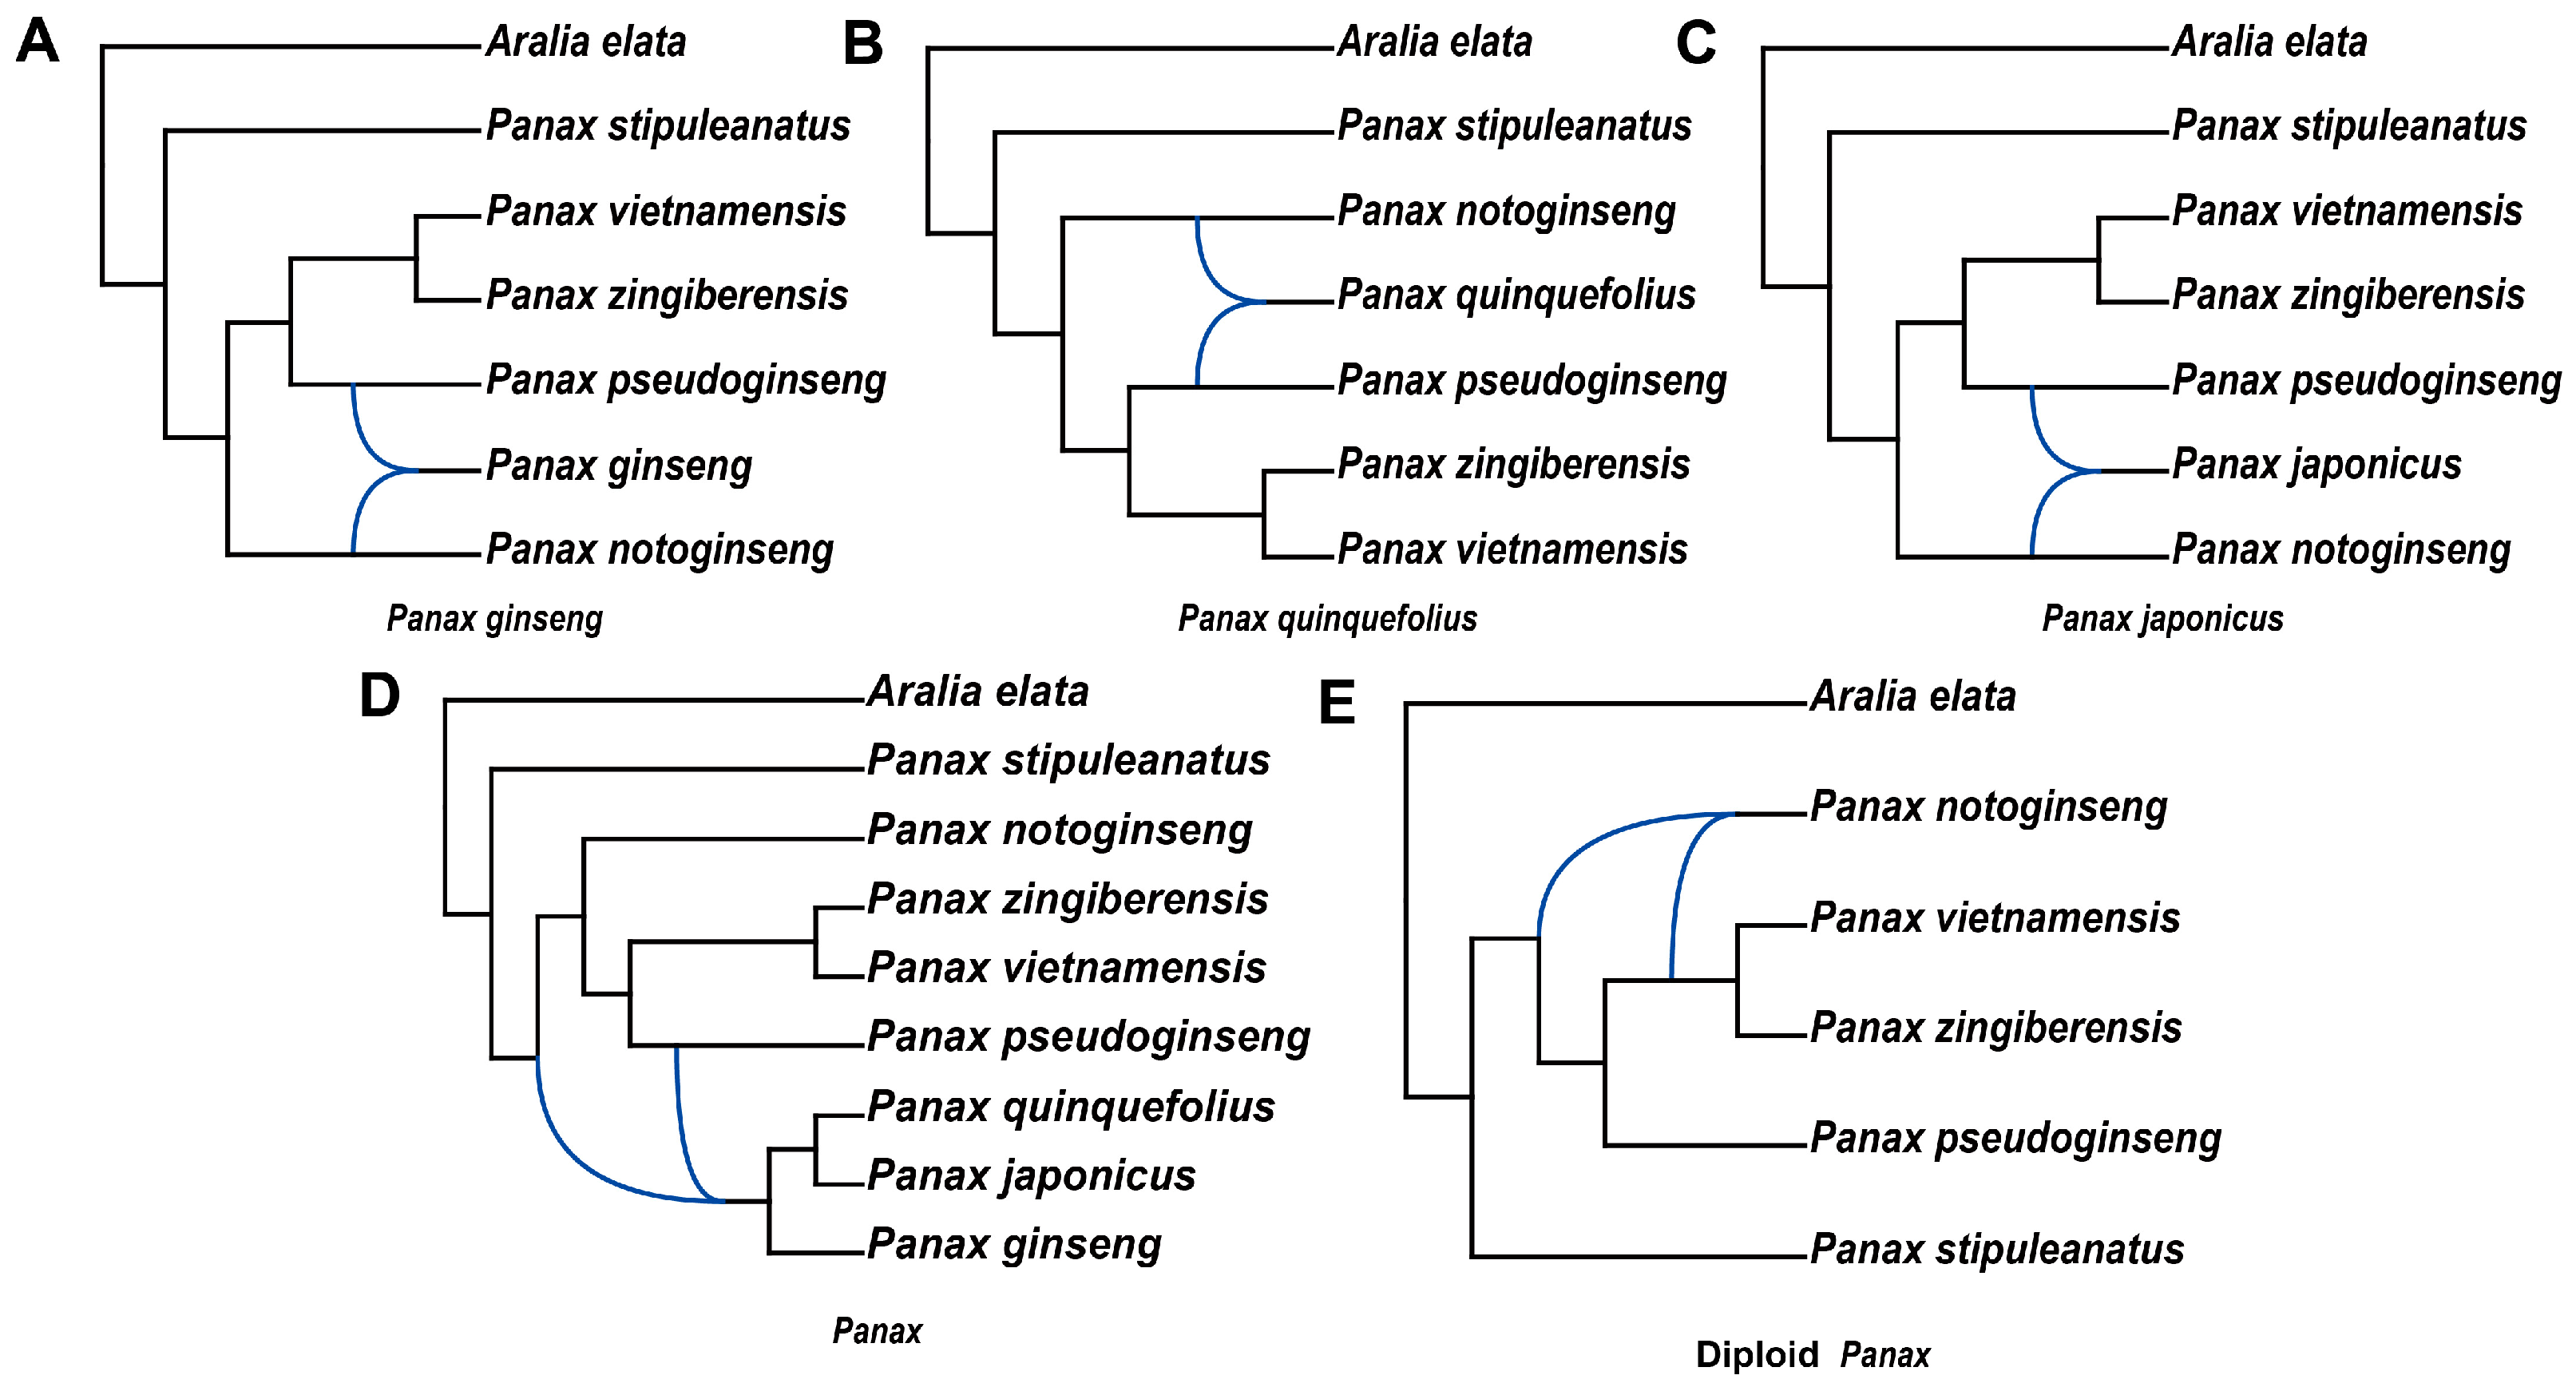
P. ginseng in the Araliaceae family has been confirmed as an allopolyploid species in previous studies, and both its close relatives, P. quinquefolius and P. notoginseng, are also considered allopolyploid species. However, the lack of research on their ancestral progenitors has resulted in gaps in the understanding of this segment of their evolutionary history. Our transcriptome data includes several well-known species of Panax (eight species), which enables us to explore the origin of the parental species of the allopolyploid plants. We used the “InferNetwork_MP_Allopp” method in PhyloNet v3.8.2 to infer phylogenetic networks for the three tetraploid species within Panax based on gene trees. In the analyses of P. ginseng, P. quinquefolius, and P. japonicus, the results from PhyloNet v3.8.2 indicated that they share the same putative parental species: P. notoginseng and P. pseudoginseng (Figure 4A–C). In the phylogenetic network of Panax species, the three tetraploid species were positioned within the same branch, with their common ancestor identified as an allopolyploid (Figure 4D). This suggests that P. quinquefolius and P. japonicus may also be allopolyploid species, and their ancestors likely underwent an allopolyploidization event in the Southeast Asian region, where diploid species of the Panax are primarily distributed. However, the putative parental ancestors differed between the two analyses. In the phylogenetic network of Panax, the common ancestor of P. pseudoginseng, P. notoginseng, Panax vietnamensis, and Panax zingiberensis was found to hybridize with P. pseudoginseng (Figure 4D). As a result, we could not definitively determine the parental ancestors of the shared common ancestor of the three tetraploid species. To further investigate the causes of these discrepancies, we employed the “InferNetwork_MPL” method in PhyloNet v3.8.2 to construct a phylogenetic network for diploid species within Panax. The results revealed that P. notoginseng is a hybrid species, with the common ancestor of P. vietnamensis, P. zingiberensis, and P. pseudoginseng hybridizing with the common ancestor of P. vietnamensis and P. zingiberensis (Figure 4E). We speculate that the hybridization events occurring in the ancestors of diploid Panax species resulted in extensive gene flow, making it challenging to determine the parental ancestors of the allopolyploid species. By combining the phylogenetic networks of the allopolyploid species and the Panax, we found that in all four results, P. pseudoginseng is a hybrid species. This phenomenon suggests that P. pseudoginseng is one of the ancestral progenitors of the allopolyploid species (Figure 4A–D).

2.4. Whole-Genome Duplication Events in Araliaceae

WGD events can rapidly enlarge the genome within a short time, providing a rich genetic foundation for the adaptive evolution of plants. They are crucial evolutionary events in the process of species evolution. By analyzing the synonymous substitutions (Ks) of paralogous genes at each locus in the transcriptome data of Araliaceae plants, we plotted the Ks distribution and detected potential WGD events in Araliaceae plants based on the position of the peak. The Ks distribution revealed a peak at approximately 0.3 for Aralioideae plants, which may correspond to the pg-β event previously reported in Panax. Using the plant-wide synonymous substitution rate of 6.1 × 10⁻⁹, the peak position corresponds to around 24.6 MYA, which is prior to the divergence of Aralioideae (18 MYA) (Figure 3A). This suggests that Aralioideae plants collectively underwent the pg-β event (Figure 3A,B). However, the peak position of H. umbellata differs from that of Aralioideae plants but appears at a similar position to the peak of C. asiatica from the Apiaceae (Figure 3B).
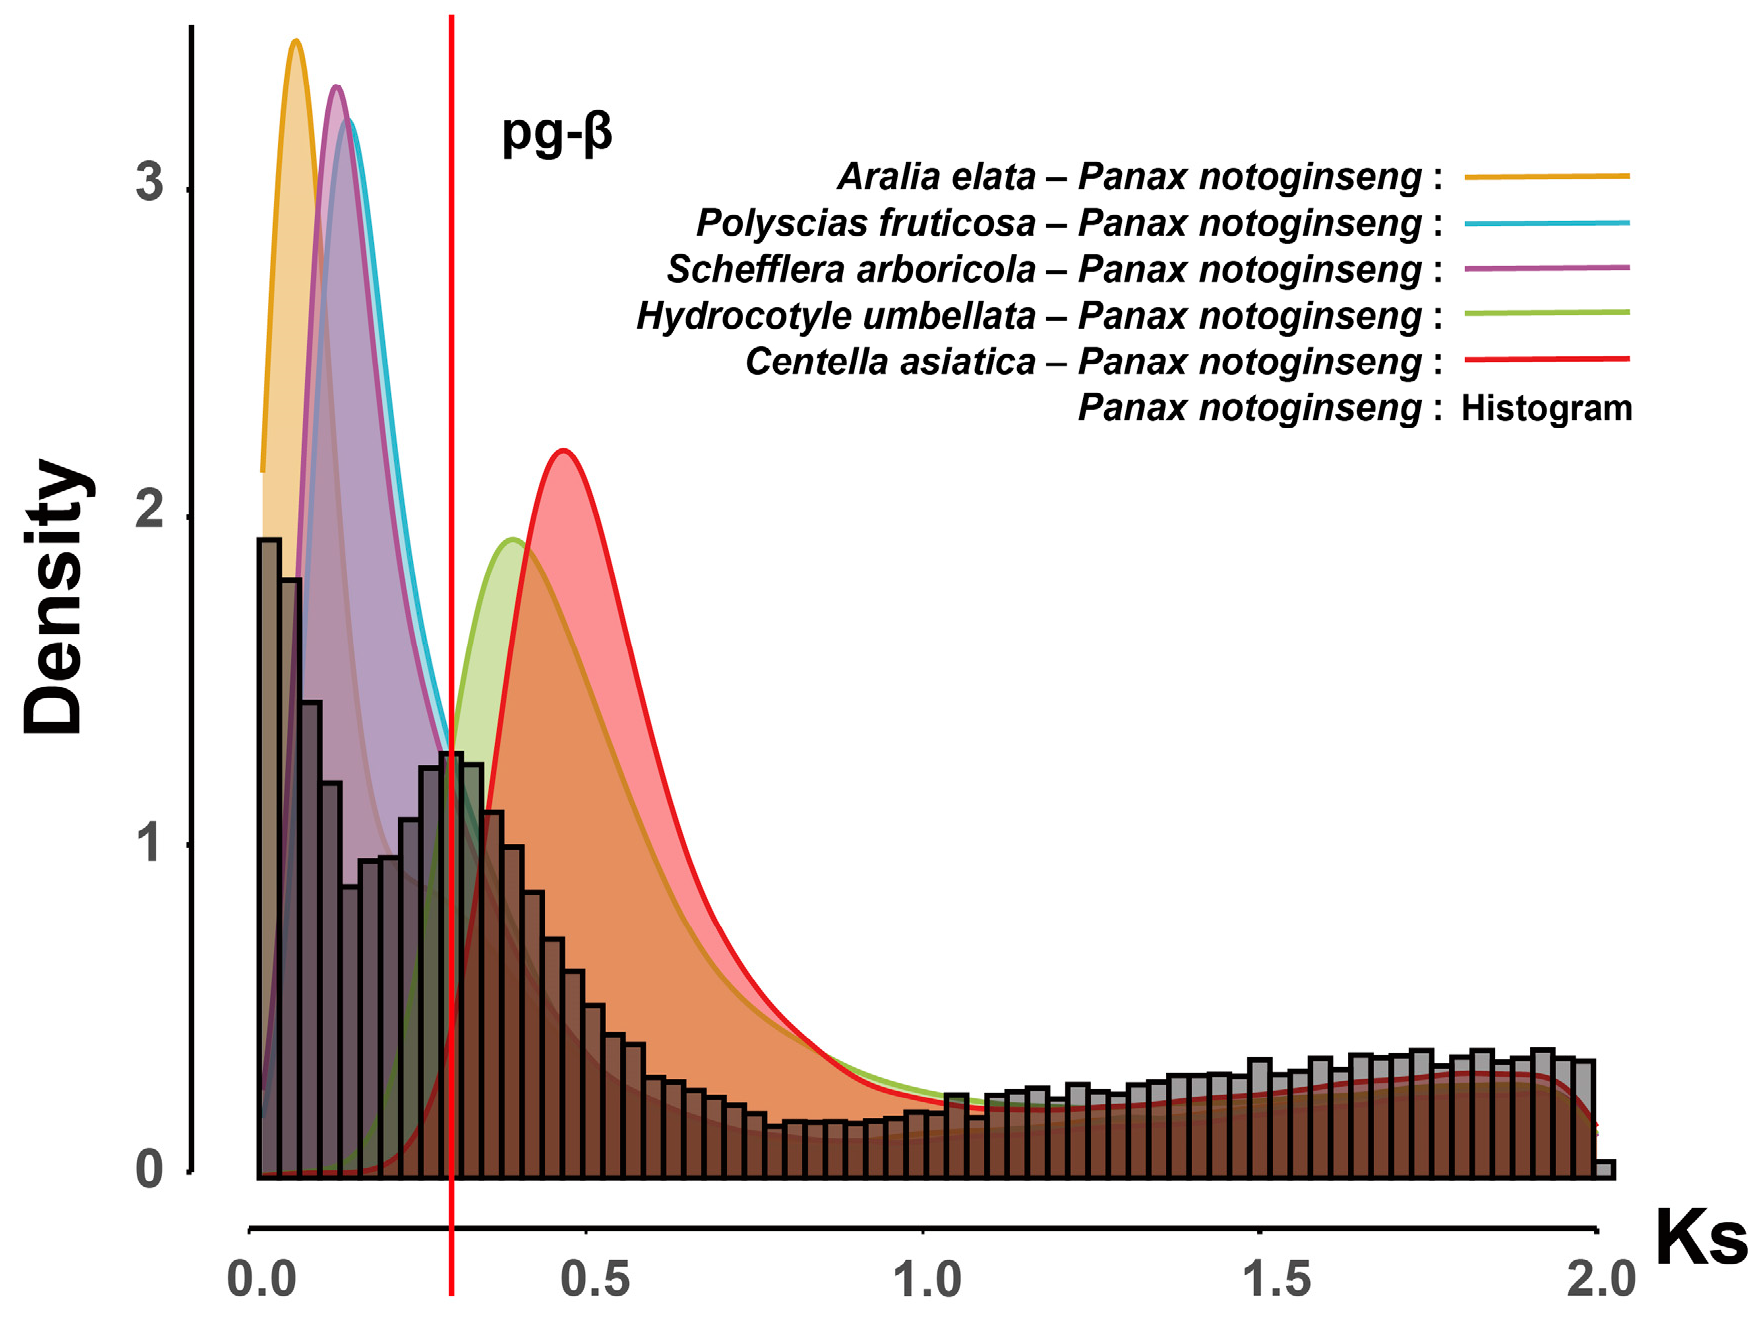
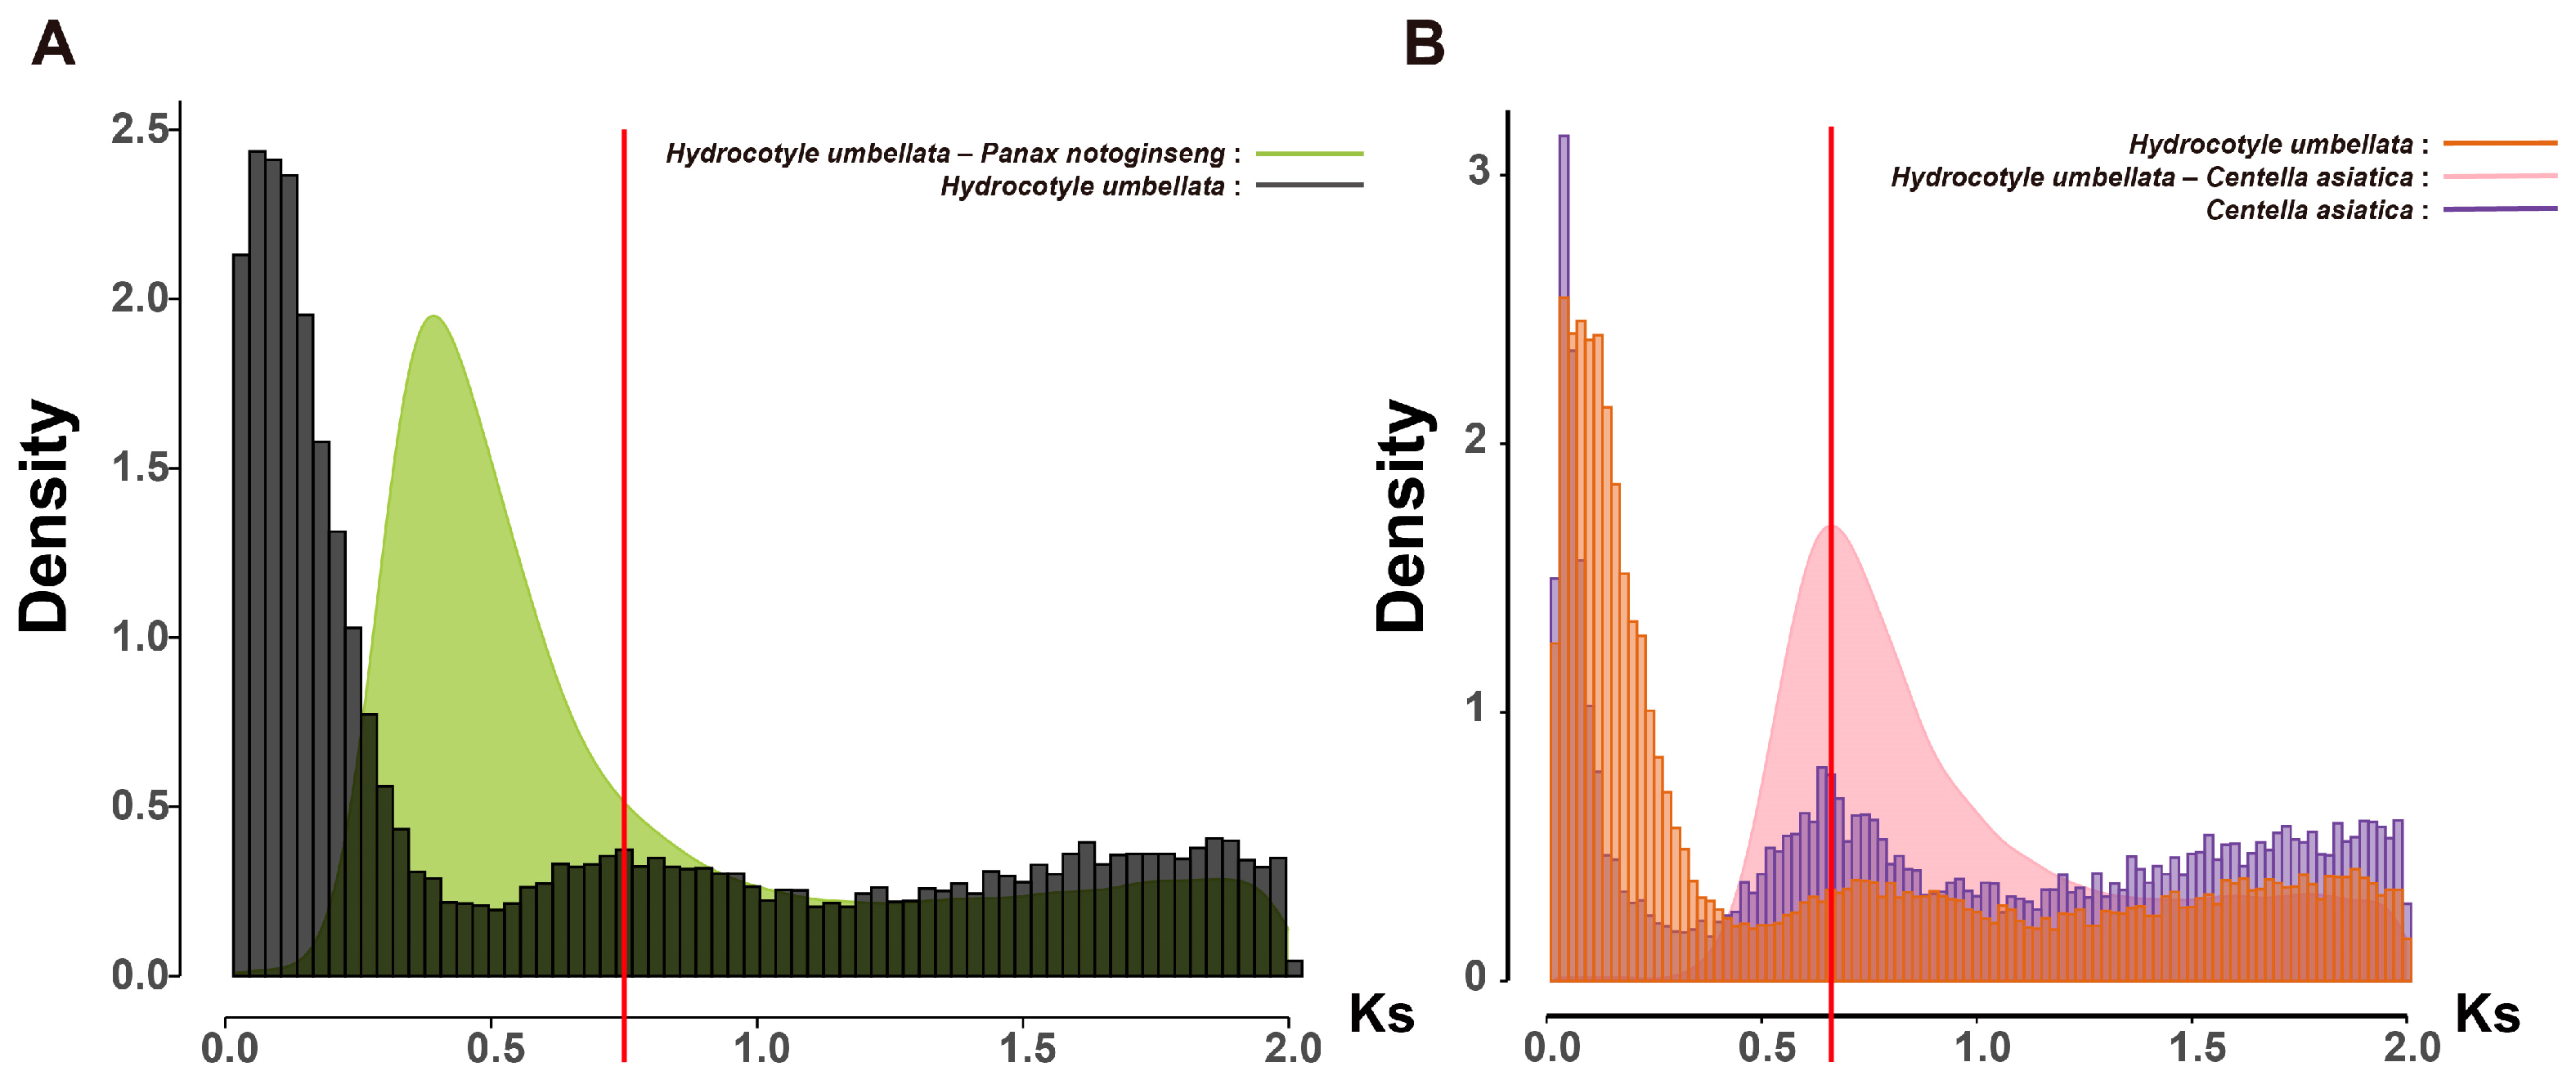
To further investigate whether the pg-β event is a shared WGD event in Araliaceae plants, we used P. notoginseng as a reference and calculated the Ks values of its orthologous genes with representative plants from various lineages (Schefflera arboricola, Polyscias fruticosa, Aralia elata, H. umbellata, and C. asiatica) to analyze the relationship between species divergence and the timing of the pg-β event (Figure 5). The results showed that the divergence of Aralioideae plants (S. arboricola, P. fruticosa, and A. elata) from P. notoginseng occurred after the pg-β event, while the divergence of H. umbellata from P. notoginseng took place before the pg-β event. This indicates that Aralioideae plants collectively underwent the pg-β event, while H. umbellata did not (Figure 5). The Ks peak in H. umbellata is positioned prior to its divergence from P. notoginseng, but this peak was not observed in other Aralioideae plants (Figure 6A). We speculate that the genes duplicated during this WGD event may have undergone substantial loss throughout the evolutionary history of Aralioideae plants, contributing to their significant morphological differences. Additionally, to determine whether the Ks peaks in C. asiatica and H. umbellata represent the same event, we calculated the Ks values of orthologous genes between these two species. The results showed that the Ks peak of orthologous genes was similar to the Ks peak of paralogous genes within each species (Figure 6B), making it difficult to conclude whether they represent the same event based on this analysis alone. To further clarify whether these peaks correspond to the same event, whole-genome data and chromosomal evolution analyses may be required.
The results of this study confirm that the pg-β event was a shared experience among Aralioideae plants. Previous genomic studies on P. notoginseng revealed that multiple enzyme genes involved in ginsenoside biosynthesis were duplicated during the pg-β event, suggesting that this event played a significant role in promoting ginsenoside biosynthesis. Theoretically, all Aralioideae plants should have the ability to synthesize ginsenosides as they collectively experienced the pg-β event. However, ginsenosides are primarily found in large quantities in Panax species. Therefore, we conducted an in-depth analysis of the expression patterns of key enzyme genes involved in the ginsenoside biosynthesis pathway in Araliaceae to gain insights into the specific ability of Panax species to synthesize ginsenosides within the family.

2.5. Gene Expression Patterns in the Ginsenoside Biosynthesis Pathway

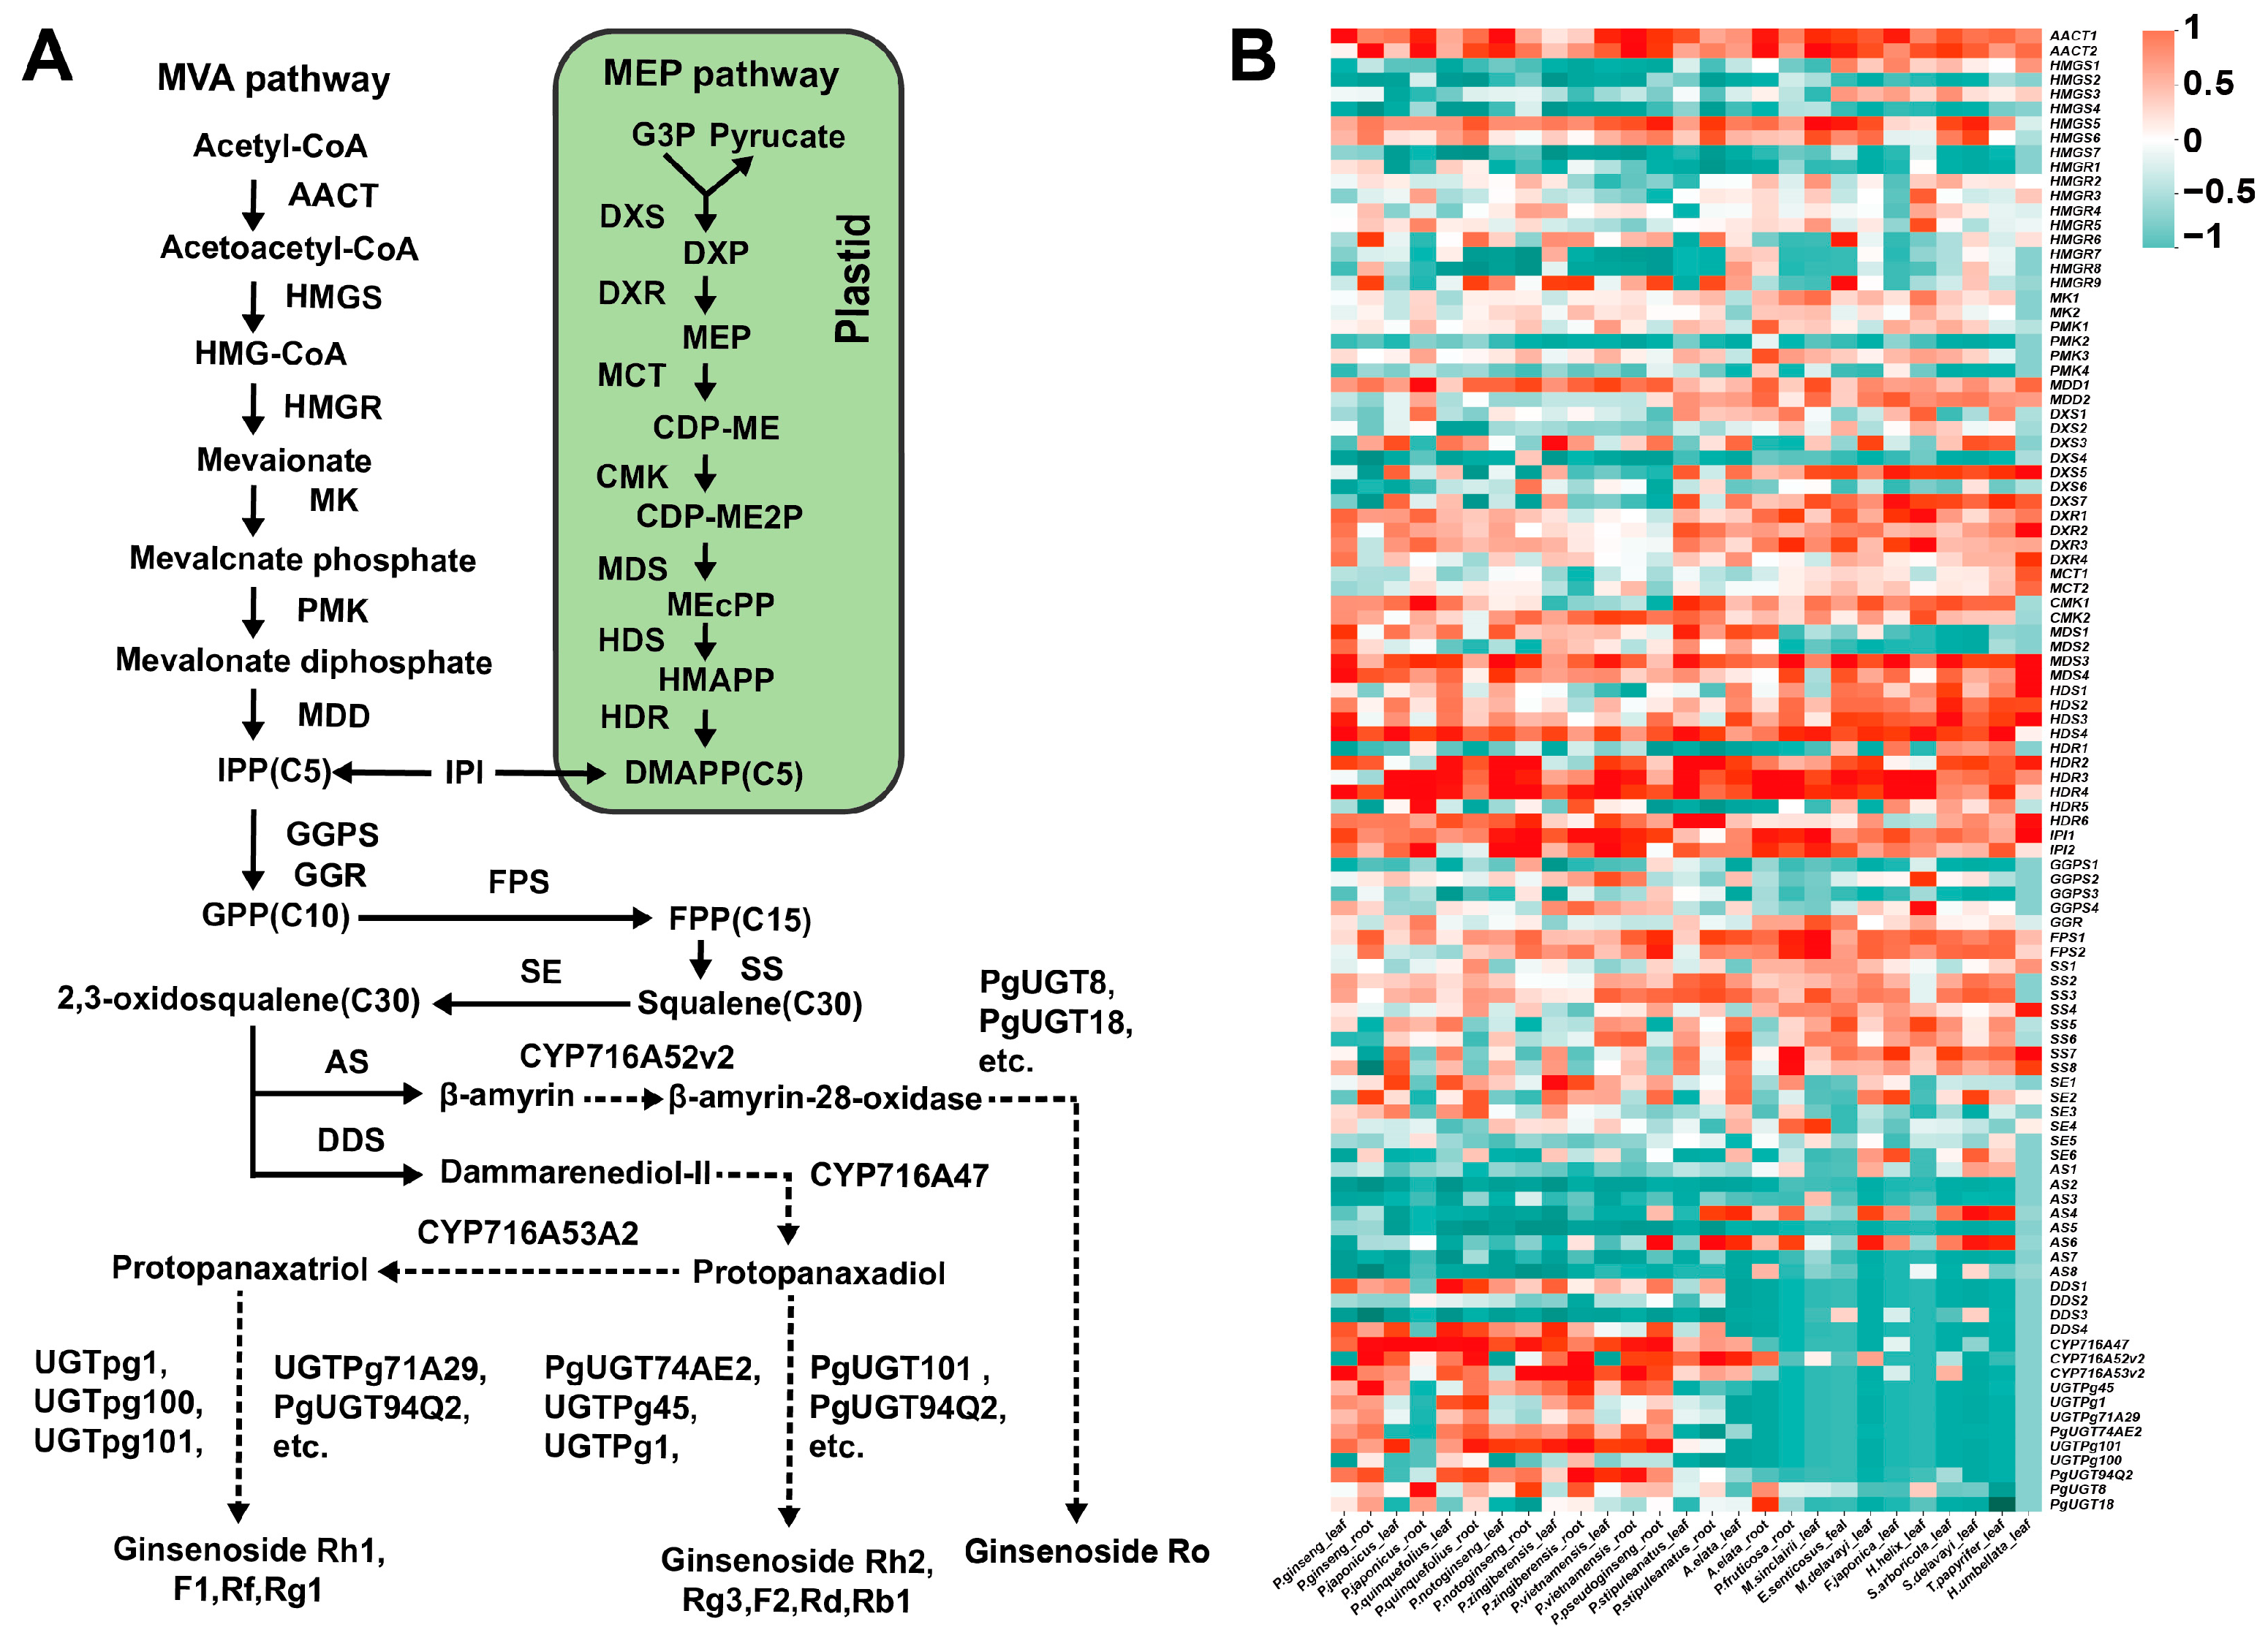
Araliaceae plants produce a wide variety of triterpenoid compounds; however, ginsenosides, triterpenoids with exceptionally high medicinal value, have been detected in significant quantities exclusively in Panax species. We explored the expression patterns of key gene families involved in the ginsenoside biosynthesis pathway across different Araliaceae species to identify the enzyme genes responsible for the specific synthesis of ginsenosides in Panax species. To achieve this, we used the Panax genome as a reference to calculate gene expression levels for various Araliaceae species. Using reference sequences of gene families in the ginsenoside biosynthesis pathway, we identified the members of each gene family within Panax. Finally, we compared the expression levels of these gene family members to analyze the expression patterns of key gene families in the ginsenoside biosynthesis pathway across different Araliaceae species. The results revealed that 23 key gene families have multiple copies, with different copies exhibiting distinct expression patterns within the same species. For instance, dammarenediol-II synthase (DDS) has three highly expressed copies (DDS1, DDS2, DDS4) in Panax species, while one copy (DDS3) shows no expression (Figure 7B, Table S7). This complex expression pattern highlights the intricate regulatory mechanisms of key genes in the ginsenoside biosynthesis pathway. The homologous genes of β-AS (β-AS1, β-AS4, and β-AS6) are highly expressed in multiple genera but exhibit low expression in most Panax species, except in the roots of Panax stipuleanatus and P. pseudoginseng. In contrast, the three homologous genes of DDS (DDS1, DDS2, and DDS4) show the opposite trend (Figure 7B). This divergence in expression patterns may be one of the key reasons why ginsenosides are synthesized exclusively in Panax species. Given the large number of members in the cytochrome P450 (CYP450) and UDP-glycosyltransferase (UGTs) families, this study focused only on genes with confirmed functions in Panax. The CYP450 genes involved in the synthesis of dammarane-type ginsenosides, CYP716A47 (protopanaxadiol) and CYP716A53v2 (protopanaxatriol), are highly expressed only in Panax species, while the CYP716A52v2 gene involved in oleanane-type ginsenoside synthesis is also highly expressed in A. elata (Figure 7A,B). UGTs catalyze the final step of ginsenoside biosynthesis, the glycosylation reaction. Seven UGTs genes involved in the synthesis of dammarane-type ginsenosides (UGTPg45, UGTPg1, UGTPg71A29, PgUGT74AE2, UGTPg101, UGTPg100, PgUGT94Q2) are highly expressed in Panax species but either show no expression or are expressed at low levels in other Araliaceae plants (Figure 7A,B). The UGT8 and UGT18 genes involved in the synthesis of oleanane-type ginsenosides are highly expressed not only in Panax species but also in the roots of A. elata (Figure 7B). The high expression of CYP716A52v2, UGT8, and UGT18 genes in A. elata suggests that, even with transcriptome data obtained from different studies, their expression patterns can still be accurately reflected to some extent. Based on the differential expression patterns of β-AS, DDS, CYP450, and UGTs genes between Panax species and other Araliaceae plants, we hypothesize that these genes may be key enzymes responsible for the specific synthesis of ginsenosides in Panax species.
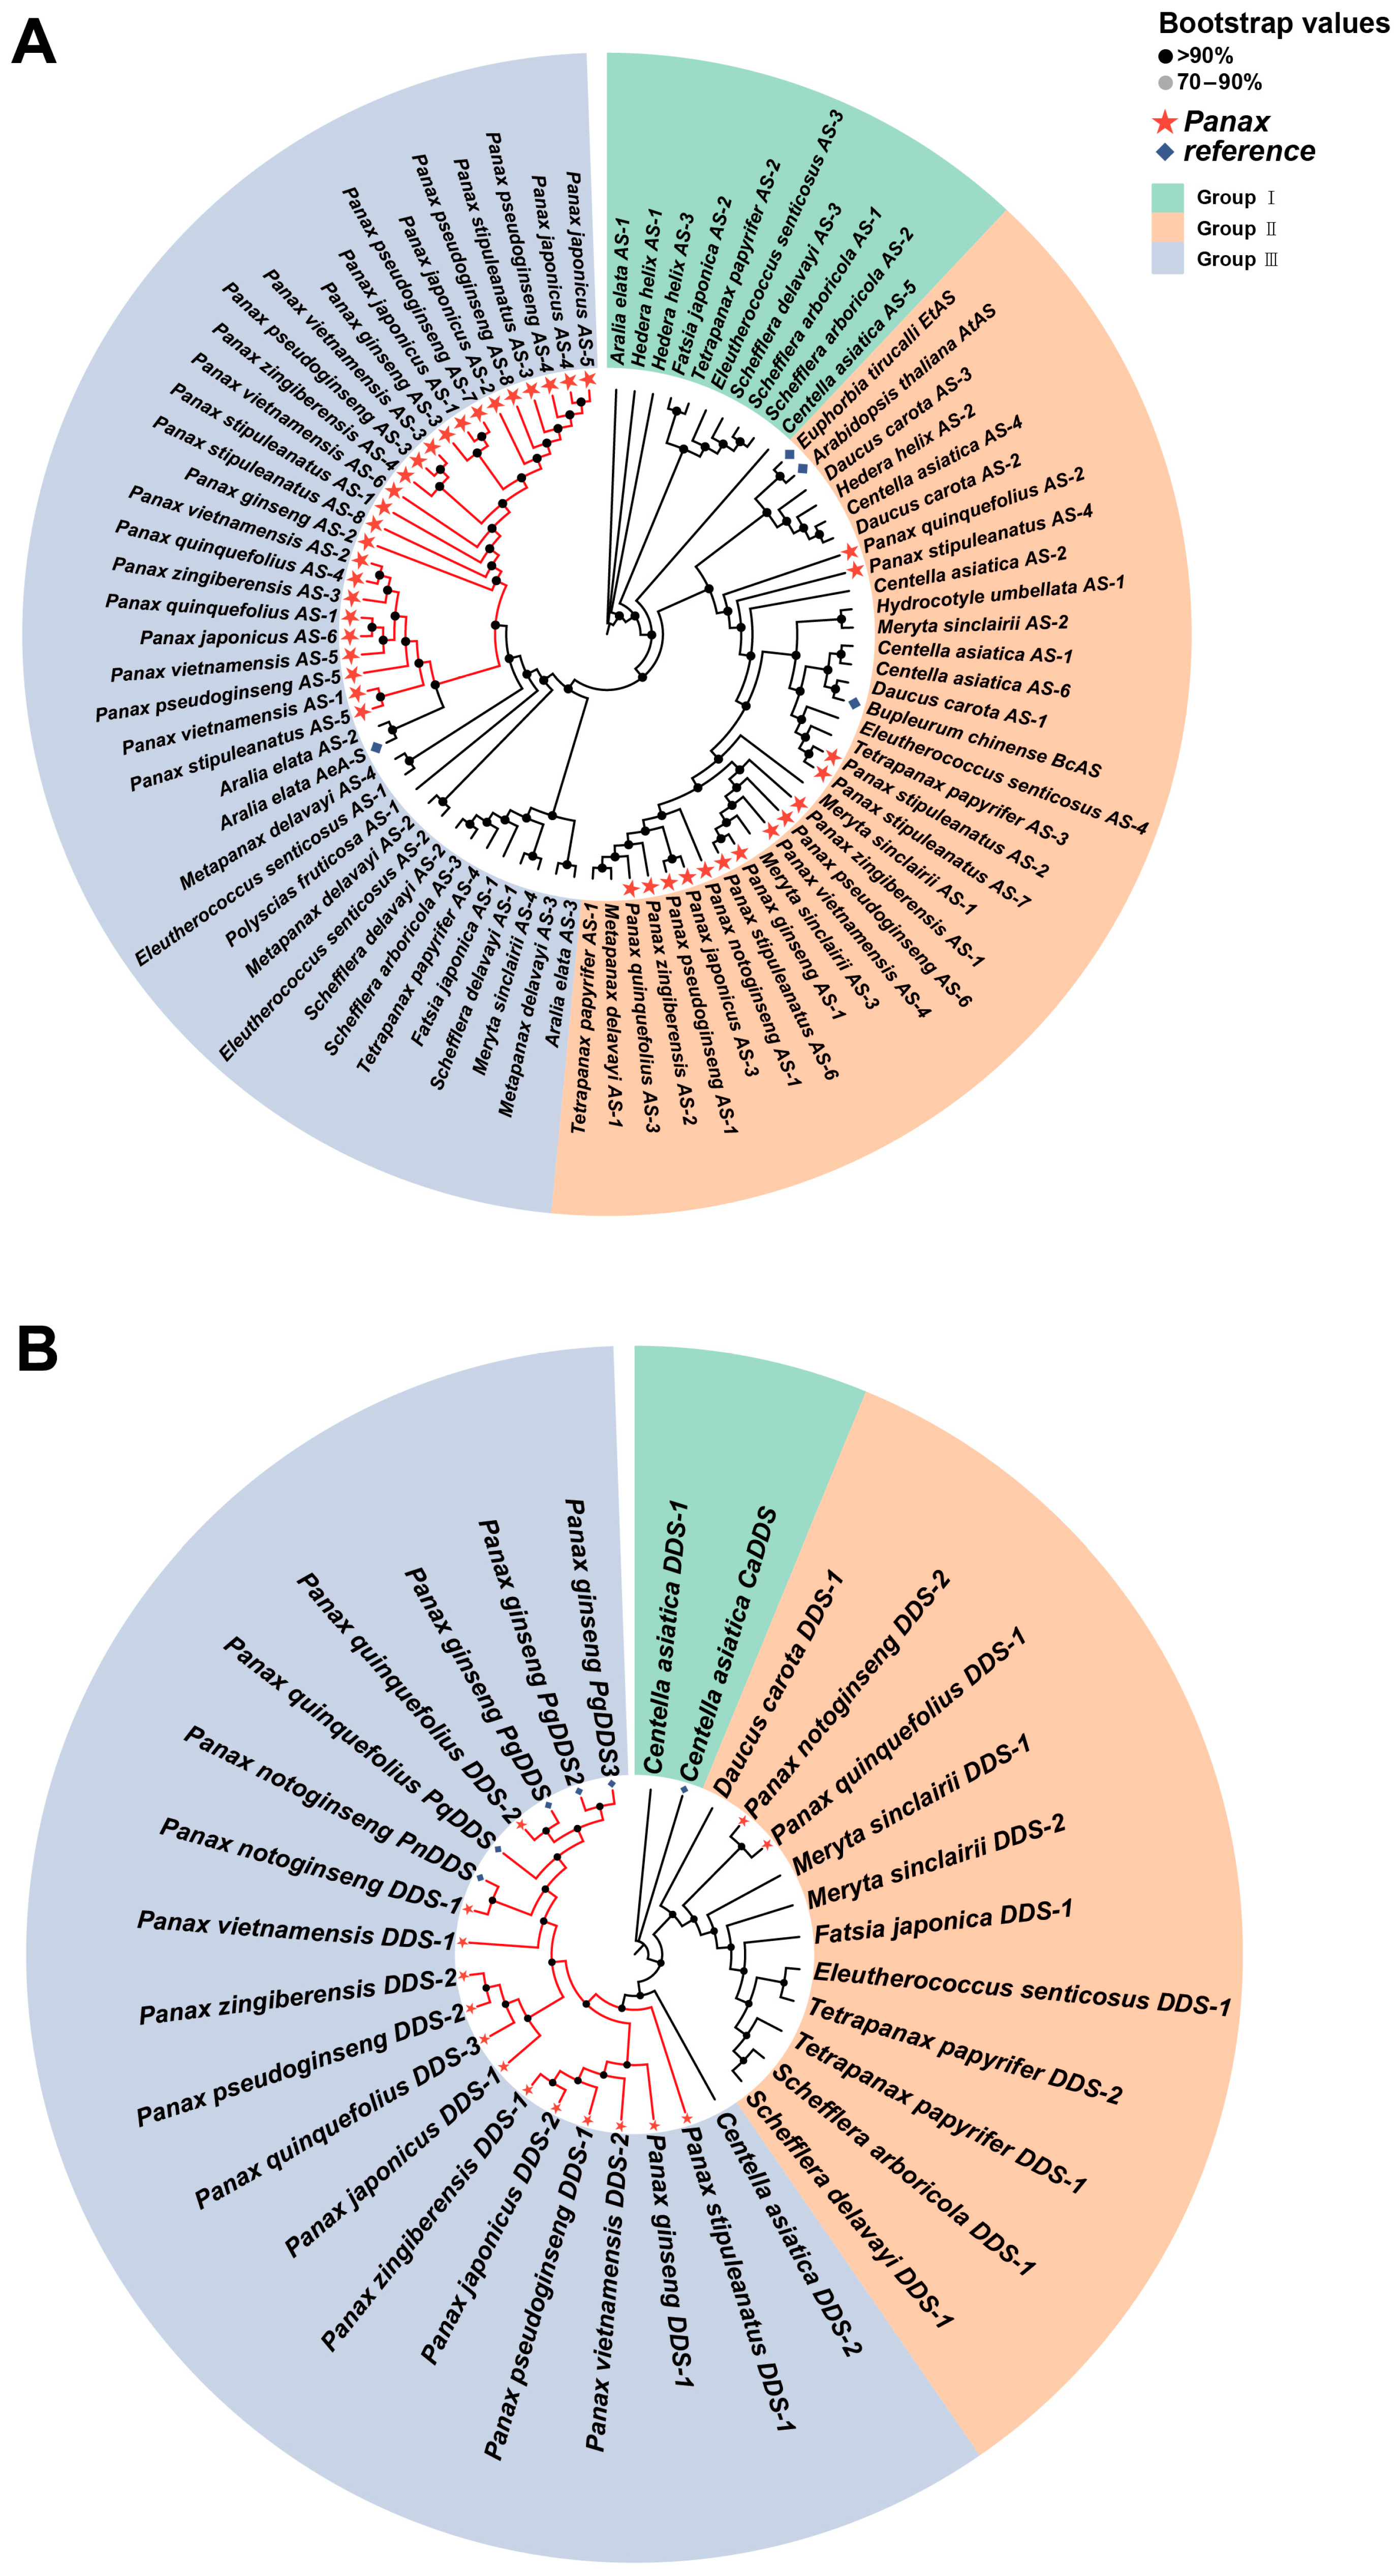
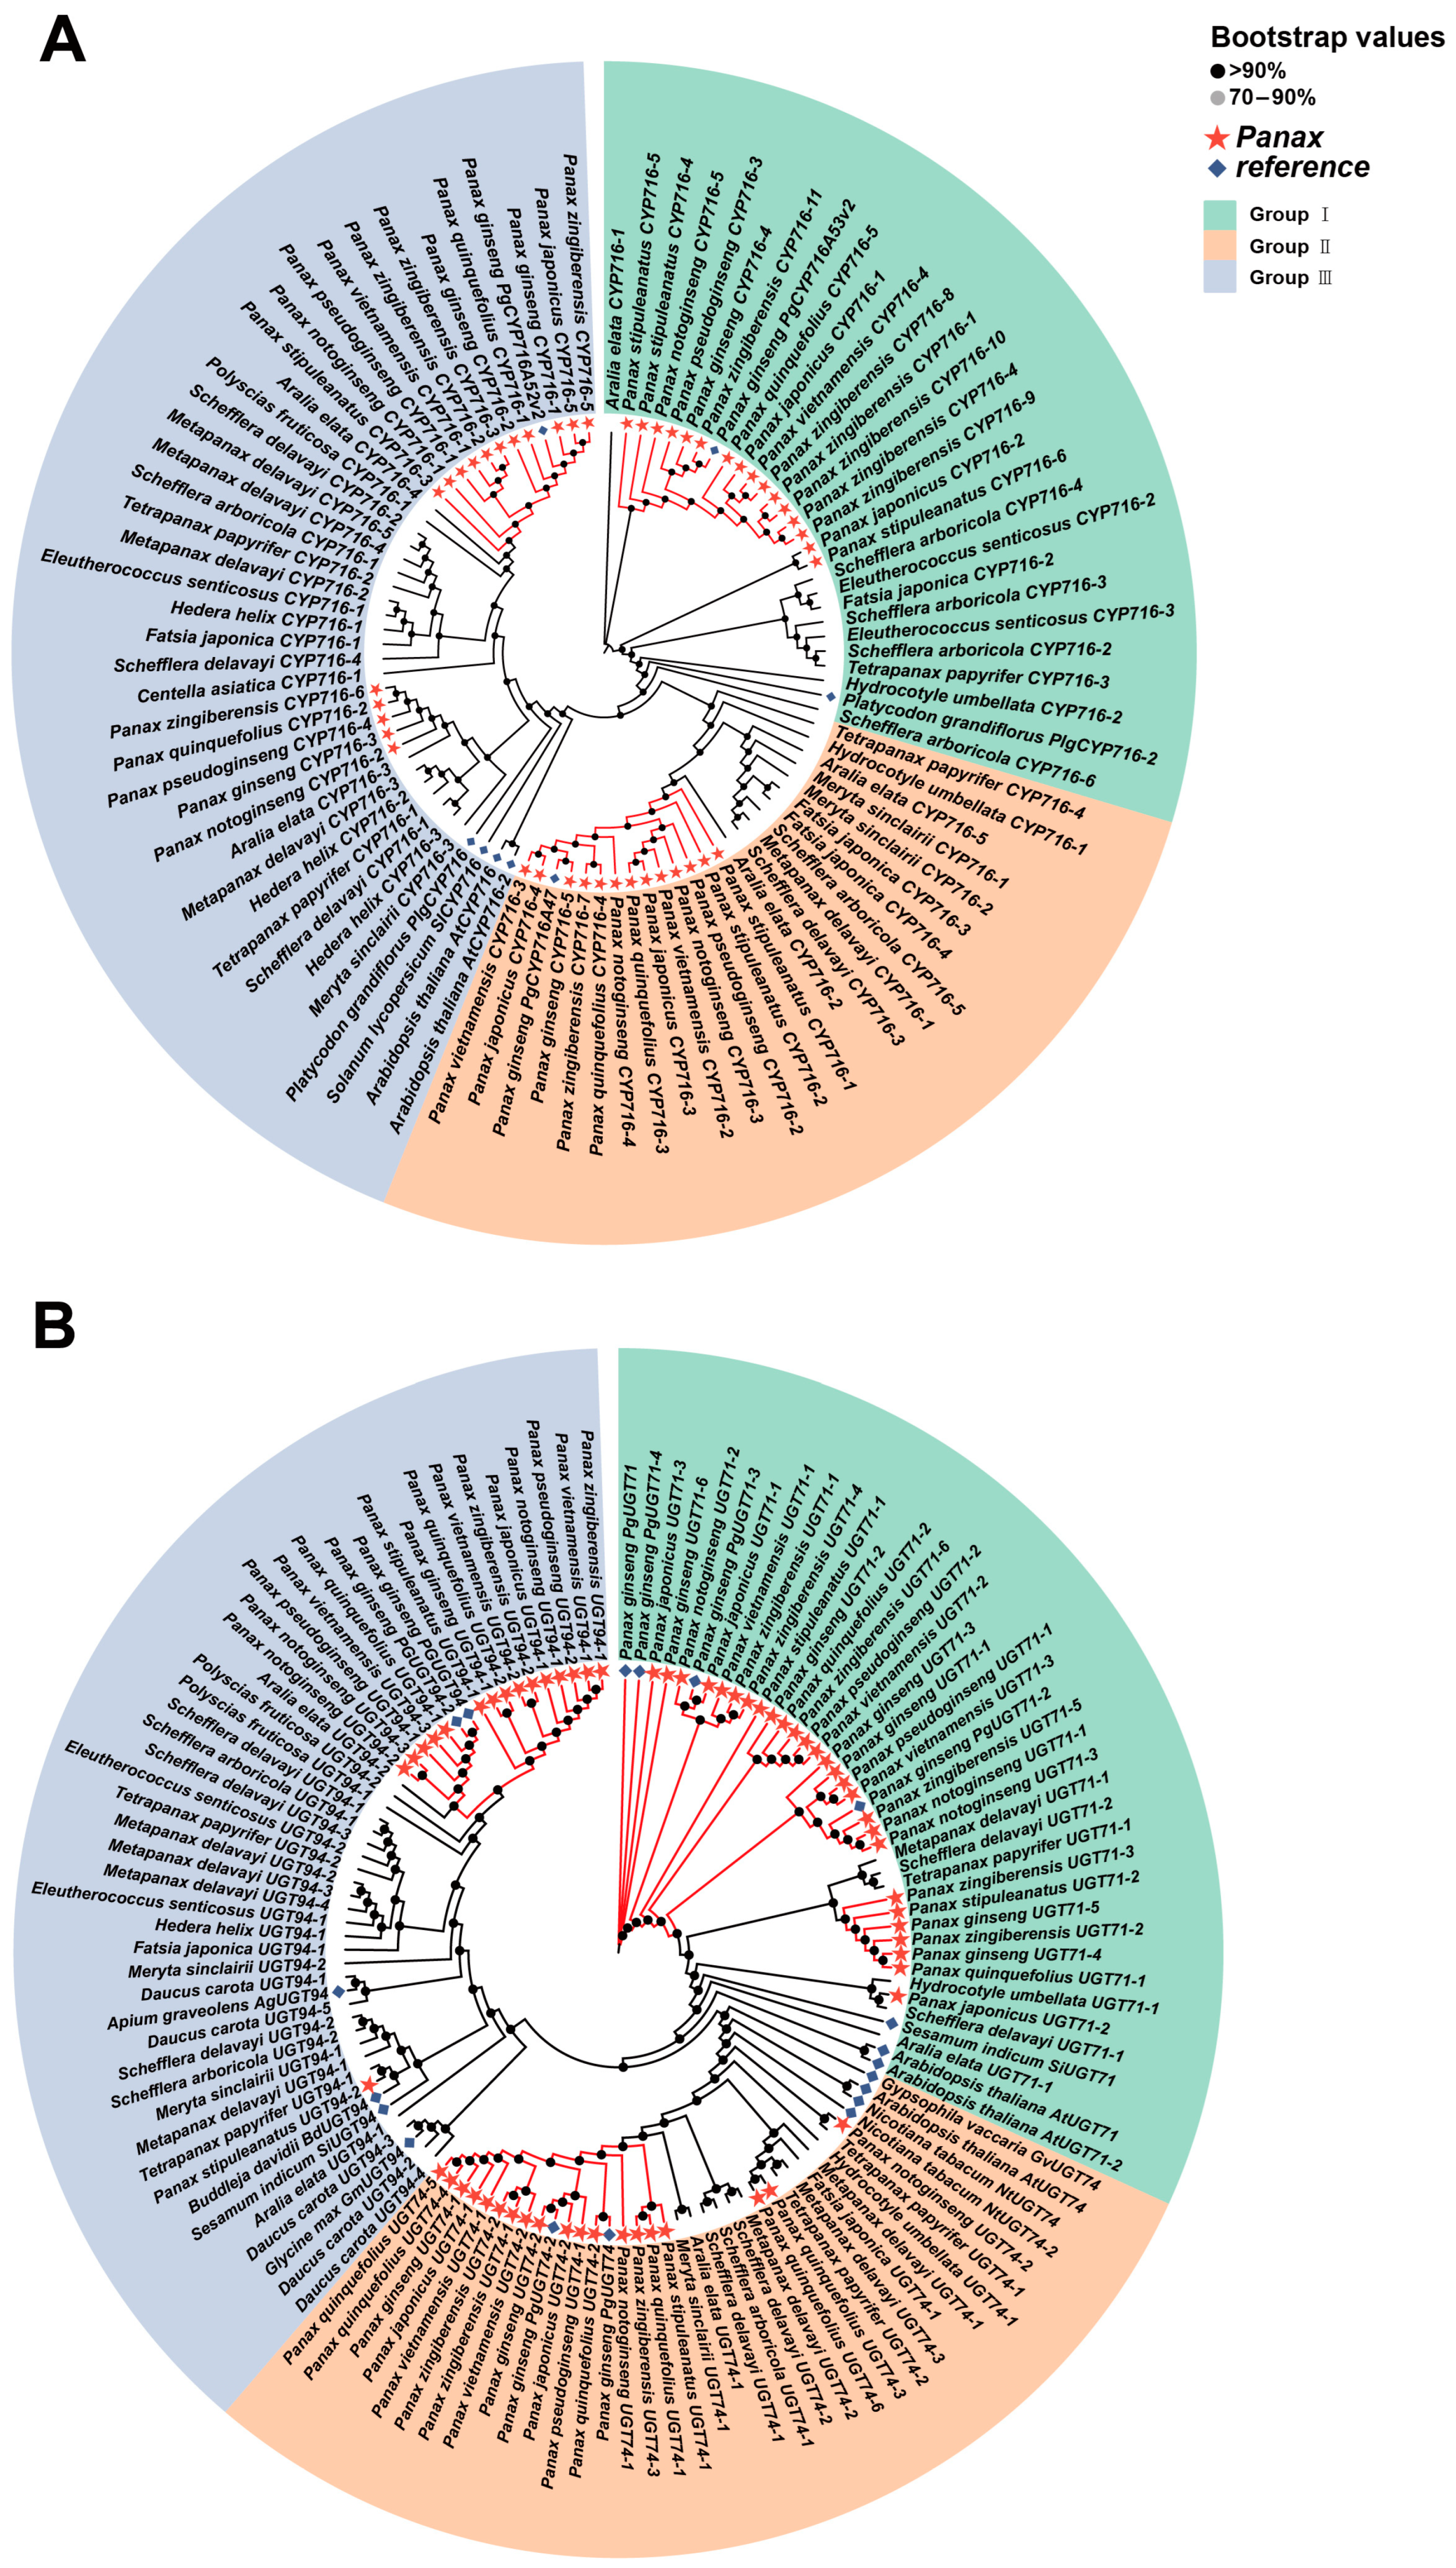
To investigate the evolutionary relationships of the four key enzyme genes (β-AS, DDS, CYP450, and UGTs) in Araliaceae plants, we used genes identified in previous studies as references to identify putative homologous genes in various Araliaceae species and constructed corresponding gene trees. The results showed that Araliaceae plants universally possess homologous genes for these four key enzymes. Notably, the UGT71 and UGT74 subfamilies within the UGTs family have significantly higher copy numbers in Panax species compared to other species (Table S8). In the gene tree constructed for β-AS homologous genes, two major clades were identified. One clade contains reference genes from multiple species, while the other clade includes reference genes from Aralia clustered with homologous genes identified in Panax species. This pattern reflects the close phylogenetic relationship between Panax and Aralia and suggests that their β-AS homologous genes may have similar functions (Figure 8A). In the gene tree constructed for DDS homologous genes, homologous genes from Panax species formed a distinct clade, with all previously identified DDS genes located within this clade. This suggests that DDS homologous genes in Panax may possess unique functions that differentiate them from those in other species (Figure 8B). As the CYP716 subfamily plays a major role in ginsenoside biosynthesis, we identified putative homologous genes specifically within this subfamily. In the gene tree of the CYP716 subfamily, three distinct clades consisting of homologous genes from Panax species were observed, with each clade containing a reference gene with a known function in Panax. Furthermore, these three clades were nested within different larger branches, suggesting that members of the CYP716 subfamily with different functions may have distinct evolutionary origins (Figure 9A). In the gene tree of UGTs, members of each subfamily clustered together. Most homologous genes of UGT71 were identified in Panax species and formed a distinct cluster, while a clade in UGT74 consisted entirely of homologous genes from Panax species. In UGT94, homologous genes from Panax were densely distributed within a branch that also included homologous genes from Aralia, suggesting that these genes may share similar functions (Figure 9B). In summary, distinct clades consisting of homologous genes from Panax species were observed in all four gene trees. This phenomenon suggests that the homologous genes of the four key enzymes may have undergone independent evolutionary processes in Panax species, resulting in functions distinct from their homologs in other species. This functional divergence likely enables Panax species to synthesize ginsenosides specifically.

3. Discussion

3.1. Resolution of the Phylogeny of Araliaceae Plants

Previous studies have shown that the morphological classification of Araliaceae plants is quite challenging, and this has been a major barrier to the conservation, development, and sustainable utilization of the germplasm resources of this family, as well as to the related industries [1,12,13]. Although early researchers conducted molecular phylogenetic studies on Araliaceae using the nuclear rRNA gene internal transcribed spacer (ITS) and the trnL-trnF region of the chloroplast genome [1,12,13], the limited data and high sequencing costs have resulted in unclear phylogenetic relationships within the Araliaceae family [1,12,13]. With the rapid development of next-generation sequencing platforms, both genomic and organellar genomes have been applied to the study of phylogenetic relationships in Araliaceae plants. Compared to these methods, transcriptome data provide abundant informative loci and high feasibility, gradually becoming a crucial approach for phylogenetic research. This approach has shown excellent performance in the phylogenetic studies of green plants [17], Leguminosae [19], Camellia [16], and other taxa. The use of transcriptome data is limited by RNA degradation and the difficulty in preserving sample data, which restricts its practicality. However, in the study by He et al. (2022) [23] on the phylogeny of Ranunculaceae plants, they successfully sequenced RNA extracted from silica gel-dried plant tissues, successfully resolving the phylogenetic relationships of Ranunculaceae. This result increased the practicality of transcriptome data in resolving phylogenetic relationships. Therefore, the transcriptome data from 19 Araliaceae species and two outgroup species from Apiaceae were used in this study to analyze the phylogenetic relationships of Araliaceae based on these species’ 510 single-copy orthologous genes. Our research reconstructed a robust and well-resolved phylogenetic framework for Araliaceae by two methods, with most branches receiving maximum support [IQ-TREE bootstrap support = 100, MrBayes posterior probability = 1, ASTRAL local posterior probability = 1] (Figure 1). In addition, by comparing with the results obtained by previous researchers using gene fragments and chloroplast genomes, we found that the generic relationships obtained in this study are the same as theirs [2,12,13]. This shows that the phylogenetic relationships constructed using the transcriptome data from 19 species of Araliaceae plants can accurately reflect the true affinity among genera in the family. In summary, transcriptome data has a significant advantage in constructing the phylogenetic relationships of Araliaceae and can provide a clearer and more stable phylogenetic tree.
Our phylogenetic analysis and divergence time study suggest that the Araliaceae family likely originated around 57.29 MYA [95% HPD = 56.5, 58.12], and support the division of Araliaceae into Aralioideae and Hydrocotyloideae around 39.97 MYA [95% HPD = 39.29, 40.64]. Subsequently, the diversification of Aralioideae plants began around 18 MYA [95% HPD = 17.85, 18.16] (Figure 3). Aralioideae is the core group of the Araliaceae family. In our study, we classified Aralioideae into three groups: the Aralia–Panax group, the Asian Palmate group, and the Polyscias–Pseudopanax group. The Aralia–Panax group includes Panax and Aralia, with Aralia positioned as the sister lineage to Panax at the base of this clade (Figure 1). The Polyscias–Pseudopanax group and the Aralia–Panax group were identified as sister clades, consistent with previous studies based on nuclear and plastid genes (Figure 1). For example, Wen et al. (2001) [12], using nuclear ITS sequences, collectively referred to the Aralia–Panax group and the Polyscias–Pseudopanax group as the Aralia–Polyscias–Pseudopanax group. Similarly, Kang et al. (2023) [2], through phylogenetic analysis of plastid genomes, confirmed that the Polyscias–Pseudopanax group is the sister clade to the Aralia–Panax group. The Asian Palmate group comprises the largest number of species within Araliaceae, including the largest genus, Schefflera [2]. Due to the high species diversity and early rapid radiation within the group, its phylogenetic relationships remain unclear. For instance, the phylogenetic positions of Hedera–Merrilliopanax and Kalopanax–Metapanax clades are yet to be resolved [2,12]. In our study, the limited sample size prevented a comprehensive resolution of the phylogenetic relationships within the Asian Palmate group; however, we successfully established a phylogenetic framework with a stable topology, and the internal branches covering six genera of plants showed very high support (Figure 1). In the future, broader species sampling is expected to further elucidate the complex phylogenetic relationships within this group and provide a more comprehensive understanding of its evolutionary history. Much taxonomic information indicates that the systematic classification of subfamily Hydrocotyloideae has been highly controversial. Hydrocotyloideae was classified under Apiaceae for a long time until Xie et al. (2022) [24] constructed the phylogenetic relationships of Apiales using 72 plastid genes, which confirmed that the genus Hydrocotyle belongs to Araliaceae. Our study also further validates this result (Figure 1).
Choi et al. (2014) [25] used fluorescence in situ hybridization (FISH) analysis to demonstrate that P. ginseng is an allopolyploid, but lacked evidence of its diploid progenitor. Therefore, we used PhyloNet v3.8.2 [26] analysis to investigate the origin of the parental species of P. ginseng. The phylogenetic network of Panax that we constructed shows that the common ancestor of P. ginseng, P. japonicus, and P. quinquefolius was an allopolyploid (Figure 4A–D). The phylogenetic network proposed by Zhang et al. (2025) [15] also supports the hybrid origin of a common ancestor for P. ginseng, P. japonicus, and P. quinquefolius. Additionally, Wang et al. (2022) [27] constructed a phylogenetic tree using the subgenomes of P. ginseng, P. japonicus, and P. quinquefolius. The results indicated that the six subgenomes were divided into two branches, with each branch containing subgenomes from all three species. These results indicate that the common ancestor of P. ginseng, P. japonicus, and P. quinquefolius underwent allopolyploidization, becoming an allopolyploid. We hypothesize that the allopolyploid genome of P. ginseng originated from their common ancestor, suggesting that P. japonicus and P. quinquefolius may also be allopolyploids. In the phylogenetic networks of individual allopolyploid Panax species and Panax, the species involved in hybridization differ, which makes it impossible to directly determine the parent species of the common ancestor of the three allopolyploid species (Figure 4A–D). However, in all four phylogenetic networks, P. pseudoginseng is consistently assumed to be one of the progenitors (Figure 4A–D). P. notoginseng is assumed to be one of the progenitors in the phylogenetic networks of individual allopolyploid Panax species (Figure 4A–C). In the subgenomic phylogenetic analyses by Wang et al. (2022) [27] and Song et al. (2024) [3], it was found that the genome of P. notoginseng is closely related to the subgenomes of allopolyploid Panax species. Based on the above, we hypothesize that P. pseudoginseng and P. notoginseng may be the diploid progenitors of the common ancestor of P. ginseng, P. japonicus, and P. quinquefolius. Furthermore, we suggest that the common ancestor of P. ginseng, P. japonicus, and P. quinquefolius may have undergone intermediate hybridization and allopolyploidization in Southeast Asia, where P. pseudoginseng and P. notoginseng are widely distributed. This hypothesis also supports the “two-step migration hypothesis” which suggests that the ancestor of P. quinquefolius underwent tetraploidization in Asia before migrating to North America, where the modern P. quinquefolius evolved.
Previous studies have analyzed WGD events in a few Araliaceae plants, such as P. ginseng, P. notoginseng, P. quinquefolius from Panax, and Eleutherococcu senticosus and A. elata from the Eleutherococcus and Aralia genera [3,27,28,29,30]. However, it remains unclear whether these WGD events are shared across all Araliaceae plants or are specific to certain species. Therefore, we analyzed WGD events in the aforementioned 21 species by calculating the Ks values of paralogous genes within species. Our results indicate that Aralioideae plants universally experienced the pg-β event (Figure 3 and Figure 5), a finding also reported in genomic studies of P. ginseng, P. notoginseng, E. senticosus, and A. elata [3,28,29,30]. This study, using data from a broader range of species, provides further evidence supporting this hypothesis. In addition to the pg-β event, some Araliaceae plants have experienced other WGD events; for example, the pg-α event was detected in P. ginseng, and the Es-α event was identified in E. senticosus species [3,28]. Following these recent WGD events, both species were found to be allopolyploids, and no new WGD events have been identified in other Araliaceae species thus far [3,14,28,31]. Therefore, we hypothesize that post-WGD rediploidization and hybridization events may have been the primary drivers of diversification in Aralioideae plants.
In our study, the Ks peak of H. umbellata differs from that of Aralioideae plants, and this peak occurred prior to the divergence between H. umbellata and P. notoginseng (Figure 3 and Figure 6A). Therefore, we hypothesize that this WGD event might have been experienced by all Araliaceae plants, but during the evolution of Aralioideae, a substantial loss of genes resulting from this event may have occurred, leading to significant phenotypic differences between Hydrocotyloideae and Aralioideae plants. That might explain why early morphological classifications consistently placed Hydrocotyloideae within Apiaceae. In our study, only H. umbellata, a species from the Hydrocotyloideae subfamily, was included, and no closely related species were available as a reference. Therefore, we cannot confirm this as a newly discovered WGD event. However, this is an intriguing discovery that warrants further investigation. Future studies with additional Hydrocotyloideae species are needed to verify our hypothesis.

3.2. The Expression Patterns and Evolutionary Relationships of Key Enzyme-Coding Genes in Ginsenoside Biosynthesis of Araliaceae Plants

Araliaceae plants can synthesize a wide variety of triterpenoid compounds, but only Panax species can synthesize ginsenosides in large quantities [32]. Understanding the reasons behind this phenomenon is crucial for the development and utilization of Araliaceae plants. To this end, we utilized transcriptome data from 19 Araliaceae species to construct the expression patterns of key enzyme genes involved in the ginsenoside biosynthesis pathway in Araliaceae plants. By analyzing the expression patterns of key enzyme-coding genes involved in the ginsenoside biosynthesis pathway in Araliaceae, we found that the expression patterns of AS, DDS, CYP450, and UGTs genes in Panax species differ from those in other Araliaceae plants (Figure 7B). DDS and AS, both belonging to the oxidosqualene cyclase (OSC) family, are involved in the cyclization of 2,3-oxidosqualene, forming the basic skeleton of ginsenosides [33]. DDS has been confirmed as a key enzyme in the synthesis of dammarane-type ginsenosides, with its overexpression or introduction shown to increase ginsenoside production [34]. AS is the key enzyme for synthesizing oleanane-type ginsenosides [35]. Additionally, silenced expression of DDS leads to increased expression of other OSC members, explaining the phenomenon of low AS expression in plants with high DDS expression. The phylogenetic analysis of genes shows that homologous AS genes in Aralia cluster with those in Panax species, while DDS homologs in Panax form a distinct clade, including reference genes with verified functions (Figure 8A,B). This indicates that the DDS gene in Panax species may have undergone independent evolution, resulting in the gene’s neofunctionalization, which ultimately led to the large-scale synthesis and accumulation of ginsenosides in Panax species [36]. These results further confirm the findings in our previous research. Studies have shown that in Aralia, the loss of exons in DDS-encoding genes leads to the inability to produce dammarane-type saponins, while the introduction of the PgDDS gene from P. ginseng can restore the accumulation of dammarane-type saponins in Aralia callus tissues [37]. Additionally, Yang et al. (2023) [38], through genomic and biochemical analyses, demonstrated that OSC genes responsible for dammarane-type saponin synthesis were generated during the pg-β event. Therefore, we hypothesize that after the pg-β event, other Aralioideae plants outside Panax may have experienced DDS gene loss or gene fragment deletions during their evolutionary process, leading to low or absent expression of the DDS gene. This, in turn, would prevent the large-scale synthesis of dammarane-type triterpenoid skeletons and affect the synthesis of ginsenosides.
CYP450 primarily participates in oxidation and hydroxylation reactions during ginsenoside biosynthesis [39], while UGTs function in the final step of ginsenoside biosynthesis. UGTs transfer glycosyl residues from activated sugars to the aglycones of ginsenosides, thereby regulating the biological activity, solubility, and stability of ginsenosides. Previous studies have shown that the CYP450 and UGTs gene superfamilies are widespread in plants and have a large number of members; for example, P. ginseng contains 550 CYP450 genes and 273 UGTs genes [3]. In P. ginseng, three members of the CYP450 superfamily have been identified as being involved in the regulation of ginsenoside biosynthesis. Specifically, CYP716A47 regulates the synthesis of protopanaxadiol-type ginsenosides, CYP716A53v2 regulates the synthesis of protopanaxatriol-type ginsenosides, and CYP716A52v2 regulates the synthesis of oleanane-type ginsenosides [7,32,40]. In addition to being highly expressed in Panax species, CYP716A52v2 also exhibits significantly high expression in Aralia. CYP716A52v2 is a β-amyrin-28-oxidase that converts β-amyrin into oleanolic acid, which serves as the aglycone of ginsenoside Ro [41]. The UGT8 and UGT18 genes, which are involved in the synthesis of ginsenoside Ro, also exhibit high expression in the roots of A. elata (Figure 7B). This is consistent with the presence of ginsenoside Ro in A. elata [42]. Furthermore, the CYP450 gene tree shows that the homologous genes of A. elata cluster within the same clade as those of Panax species (Figure 9A). These results suggest that the homologous genes in A. elata, which are in the same clade as those in Panax species, may share similar functions. UGTs are widely involved in the glycosylation of terpenoids [43]. In our study, UGTs participating in ginsenoside biosynthesis were either not expressed or expressed at extremely low levels in species outside Panax. The number of homologous UGTs genes identified in the transcriptomes of Panax species was significantly higher than in other species, with the UGT71 and UGT74 subfamilies showing the most pronounced differences (Table S8). The gene tree further revealed that putative homologous genes in Panax clustered together, indicating that these genes have undergone independent evolution within Panax (Figure 9B). Yang et al. (2021) [28] reported that E. senticosus contains 125 UGTs members, notably fewer than the 144 found in P. notoginseng. Therefore, we speculate that additional gene duplication events occurred during the evolution of Panax, leading to an increased number of functional UGTs. Moreover, some UGTs genes have also undergone independent evolution within Panax. These evolutionary events not only led to the large-scale synthesis of ginsenosides in Panax species but also increased the diversity of ginsenosides. These uniquely evolved and specifically expressed genes should be considered important candidate genes for subsequent functional validation experiments.

4. Materials and Methods

4.1. Data Sources and Transcriptome Assembly

In this study, we collected transcriptome data of all extant Araliaceae plants from public databases and successfully obtained data from 19 species (11 genera). We used C. asiatica and D. carota from Apiaceae as outgroups, giving a total of 21 species’ data. All data are from GenBank SRA (Table S9). We deeply explored the phylogenetic relationships of the 19 Araliaceae species based on these data. Quality assessment of the raw transcriptomic reads was performed using FastQC v0.12.1 [44]. Subsequently, low-quality bases, adapter sequences, and potential contaminants were removed from the raw reads using Trimmomatic v0.39 [45], resulting in clean reads.
Clean reads were assembled de novo into transcriptomes using Trinity v2.15.1 [46] with default parameters. The resulting transcripts were processed with CD-HIT v4.8.1 [47] to remove highly similar sequences, applying the parameters “-c 0.98” and “-n 5”. The completeness of the assembly was evaluated using BUSCO v5.4.7 [48] with the embryophyta_odb10 database. Candidate coding regions were identified from the assembled transcripts using TransDecoder v5.7.1 [46].
Initially, the “TransDecoder.LongOrfs” command was used to predict open reading frames (ORFs), selecting those with a length of at least 100 amino acids. Subsequently, the amino acid sequences of these ORFs were aligned against protein databases constructed from P. ginseng [3] and Arabidopsis thaliana [49] using BLASTP v2.5.0 [50], with parameters set to “-evalue 1 × 10⁻⁵” and “-max_target_seqs 1” to identify the best matches. Finally, the “TransDecoder.Predict” command was used to integrate the BLASTP v2.5.0 [50] search results in order to predict the most likely expressed nucleotide coding sequences and their corresponding protein sequences.

4.2. Gene Functional Annotation and Single-Copy Orthologue Identification

Functional annotation of Araliaceae transcripts was performed by aligning the predicted protein sequences against seven widely recognized protein databases, including Swiss-Prot, PFAM, GO, COG, KEGG, NR and TAIR11. The alignment was conducted using BLASTP v2.5.0 [50] with a threshold parameter of “-evalue 1 × 10⁻⁵”. TFs in Araliaceae were predicted and classified using the ITAK v1.6 tool [51] with default parameters.
Single-copy orthologous genes were identified from the protein dataset predicted by TransDecoder v5.7.1 [46]. To minimize redundancy, the longest sequences showing homology to protein sequences derived from the P. ginseng and A. thaliana genomes were selected. Subsequently, these filtered protein sequences were processed through the OrthoFinder v2.5.5 pipeline [52] with default parameters to cluster orthologous groups. The final phylogenetic analysis was based on the “Single_Copy_Orthologue_Sequences” subset from OrthoFinder v2.5.5 [52] results, which strictly retained only orthogroups containing all target species with exactly one gene copy per species to ensure phylogenetic reliability [16].

4.3. Phylogeny Construction and Divergence Time Estimation

This study reconstructs the phylogenetic relationships of Araliaceae plants using both concatenation-based and coalescent-based approaches [16,17,18]. For the concatenation method, MUSCLE v5.1 [53] with default parameters was employed to align each single-copy orthologous gene, and poorly aligned regions were trimmed using trimAl v1.4.rev15 [54]. The alignment results were then concatenated into a supergene sequence matrix using Python v3.12.0 scripts. Subsequently, phylogenetic trees were constructed using the maximum likelihood method in IQ-TREE v2.2.5 [55] and the Bayesian inference method in MrBayes v3.2.7a [56]. When constructing the phylogenetic tree with IQ-TREE v2.2.5 [55], the parameter “-m MFP+MERGE” was used to automatically detect the best substitution model for each partition, and support values were calculated using 1000 bootstrap replicates. In constructing the phylogenetic tree using MrBayes v3.2.7a [56], the best substitution model for each partition was determined using IQ-TREE v2.2.5 [55] with the “-m TESTMERGEONLY” option. The “-mset mrbayes” option was applied to ensure that the selected models were compatible with MrBayes v3.2.7a [56]. During the execution of MrBayes v3.2.7a [56], three independent MCMC chains were set up with a total of 100,000 iterations, and sampling was performed every 1000 iterations. For the coalescent-based method, individual gene trees were constructed using IQ-TREE v2.2.5 [55], and species trees were inferred by integrating the gene trees using ASTRAL v5.7.8 [57]. Gene tree conflicts along the topology of the species tree were assessed using PhyParts v0.0.1 [58] with default parameters. Visualization of these conflicts was performed using the phypartspiecharts.py script provided by the program’s authors.
We used the supergene sequence obtained from the concatenation method as input for the MCMCTree module in PAML v4.10.7 [59] to estimate the divergence times of Araliaceae species. Based on prior research, we selected three nodes for calibration. First, per Yang et al. (2021) [28], we set the diversification start time of the subfamily Aralioidae at 18–19 MYA, based on the divergence time between P. ginseng and E. senticosus. Second, following Choi et al. (2013) [60], we set the divergence time between P. ginseng and P. quinquefolius at 0.8–1.2 MYA. Third, per Kang et al. (2023) [2], we constrained the divergence time between the Apiaceae and Araliaceae families to within 69 MYA. Finally, the species tree and divergence time tree were visualized using Chiplot [61].

4.4. Inferring the Origin of Allopolyploidy in the Panax Genus

This study utilized the “InferNetwork_MP_Allopp” command in PhyloNet v3.8.2 [26] to infer the putative ancestors of tetraploids within the Panax species [22]. This method applies a parsimony-based approach under the Minimizing Deep Coalescences (MDC) criterion to infer allopolyploid species networks. From the 510 single-copy orthologous gene sequences identified in Araliaceae, sequences from eight Panax species and Aralia were extracted. When constructing gene trees, Aralia was used as the outgroup. When inferring the putative ancestors of tetraploids within Panax, phylogenetic networks were constructed using P. ginseng, P. quinquefolius, and P. japonicus alongside other diploid Panax species. The corresponding tetraploid species were designated as potential hybrid taxa, with a single hybridization event allowed. We also constructed a phylogenetic network for Panax species, designating P. ginseng, P. quinquefolius, and P. japonicus as potential hybrid taxa and allowing for up to three hybridization events. Additionally, a phylogenetic network comprising only diploid Panax species was constructed using the “InferNetwork_MPL” method in PhyloNet v3.8.2 [26], without specifying potential hybrid taxa and allowing for up to five hybridization events. The resulting phylogenetic networks were visualized using Dendroscope v3.8.10 [62].

4.5. Identification of Whole-Genome Duplication Events in Araliaceae

This study detected potential WGD events in Araliaceae plants by analyzing the distribution of Ks at each locus of paralogous genes in the transcriptome data [63]. First, redundant protein sequences predicted by TransDecoder v5.7.1 [46] were processed using CD-HIT v4.8.1 [47]. Next, the Python v3.12.0 script ks_plot.py was used to invoke the codeml program from PAML v4.10.7 [59], applying the NG correction method to calculate the Ks values for paralogous gene pairs. Finally, the Ks value distribution curve was plotted using the ggplot2 package in R v4.2.2 to visually depict potential WGD events. To estimate the timing of WGD events, we inferred the age of the duplication events using the formula Tdiversity = Ks/2r, with r = 6.1 × 10⁻⁹ [36].

4.6. Analysis of Expression Patterns of Key Genes in the Ginsenoside Biosynthesis Pathway

To assess the gene expression levels of Araliaceae species, this study used the P. ginseng genome as a reference to calculate gene expression levels [64]. First, an index was constructed for the P. ginseng genome using HISAT2 v2.2.1 [65], and the Araliaceae transcriptome data were aligned to this genome. The resulting SAM files were converted to BAM files using Samtools v1.15.1 [66], followed by gene-level quantification using featureCounts v2.16.1 [67], with gene expression levels assessed using TPM (transcripts per million). To analyze the expression of key genes in the ginsenoside biosynthesis pathway, reference sequences of these key genes were downloaded from the National Center for Biotechnology Information (NCBI), Pfam, and UniProt databases (Table S10). BLAST v2.5.0 [50] and HMMER v3.4 [68] were then used to align the nucleotide and protein sequences of these reference genes, respectively, in order to select the best matches based on coverage, similarity, and alignment scores. Expression data (TPM) for these genes in Araliaceae species were extracted and normalized using log2(TPM+1). Finally, a heatmap of the key gene expression patterns was generated using Chiplot [61] to visually display the expression profiles of key genes in the ginsenoside biosynthesis pathway.
Based on the expression patterns of key genes, we further investigated the evolutionary trajectories of DDS, β-AS, CYP450, and UGTs in Araliaceae species. Functional coding sequences were retrieved from the NCBI as references [69]. Due to the large number of members in the CYP450 and UGTs superfamilies, we focused only on the families primarily involved in ginsenoside biosynthesis. In P. ginseng, the CYP450 genes identified as participating in ginsenoside biosynthesis are concentrated in the CYP71 family, while most UGTs genes involved in ginsenoside biosynthesis belong to the UGT74, UGT94, and UGT71 families [6]. Homologous genes from the Araliaceae transcriptomes were identified using BLAST v2.5.0 [50] with the threshold parameter set to “-evalue 1 × 10⁻¹⁰”. The BLAST-identified homologous genes were further screened by examining their conserved domains using CD-Search [70]. Sequence alignment for gene tree construction was performed using MUSCLE v5.1 [53], followed by phylogenetic tree construction with IQ-TREE v2.2.5 [55]. The model parameter was set to “-m MFP” for automatic detection of the best substitution model, and bootstrap support values were calculated with 1000 replicates. The resulting gene trees were visualized using Chiplot [61].

5. Conclusions

In conclusion, by utilizing transcriptome data from Araliaceae plants and combining comparative transcriptomics with phylogenomic approaches, we provide novel insights into an in-depth analysis of the phylogenetic relationships and evolutionary history of Araliaceae. Furthermore, we investigated the expression patterns and evolutionary relationship of key genes involved in the ginsenoside biosynthesis pathway, providing valuable insights into the specific synthesis of ginsenosides in Panax species within the Araliaceae family. This study not only enhances our understanding of the phylogenetic relationships and evolutionary history of Araliaceae, providing a solid scientific basis for the conservation of endangered species and molecular breeding within the family, but also offers important theoretical foundations for research on the biosynthesis and metabolic engineering of ginsenosides.

Supplementary Materials

The following supporting information can be downloaded at: https://www.mdpi.com/article/10.3390/ijms26073439/s1.

Author Contributions

D.Z. spearheaded the design of this project. C.M. conducted data analysis and drafted the manuscript. C.M. and D.Z. engaged in discussions and revisions. C.M., Y.L., J.Y., L.Z. and J.F. participated in bioinformatics analyses. All authors have read and agreed to the published version of the manuscript.

Funding

This work was funded by the National Natural Science Foundation of China (32101403) and Hainan University Start-up Funding for Scientific Research (KYQD(ZR)-22109).

Institutional Review Board Statement

Not applicable.

Informed Consent Statement

Informed consent was obtained from all subjects involved in the study.

Data Availability Statement

The data presented in this study are available in this article and the Supplementary Materials.

Conflicts of Interest

The authors declare no conflicts of interest.

References

  1. Li, R.; Wen, J. Phylogeny and diversification of Chinese Araliaceae based on nuclear and plastid DNA sequence data. J. Syst. Evol. 2016, 54, 453–467. [Google Scholar] [CrossRef]
  2. Kang, J.S.; Giang, V.N.L.; Park, H.S.; Park, Y.S.; Cho, W.H.Y.; Nguyen, V.; Shim, H.; Waminal, N.E.; Park, J.Y.; Kim, H.H.; et al. Evolution of the Araliaceae family involved rapid diversification of the Asian Palmate group and Hydrocotyle specific mutational pressure. Sci. Rep. 2023, 13, 14. [Google Scholar] [CrossRef]
  3. Song, Y.T.; Zhang, Y.T.; Wang, X.; Yu, X.K.; Liao, Y.; Zhang, H.; Li, L.F.; Wang, Y.P.; Liu, B.; Li, W. Telomere-to-telomere reference genome for Panax ginseng highlights the evolution of saponin biosynthesis. Hortic. Res. 2024, 11, 12. [Google Scholar] [CrossRef]
  4. Wang, T.; Guo, R.X.; Zhou, G.H.; Zhou, X.D.; Kou, Z.Z.; Sui, F.; Li, C.; Tang, L.Y.; Wang, Z.J. Traditional uses, botany, phytochemistry, pharmacology and toxicology of Panax notoginseng (Burk.) FH Chen: A review. J. Ethnopharmacol. 2016, 188, 234–258. [Google Scholar] [CrossRef]
  5. Yang, L.; Hou, A.J.; Zhang, J.X.; Wang, S.; Man, W.J.; Yu, H.; Zheng, S.W.; Wang, X.J.; Liu, S.T.; Jiang, H. Panacis Quinquefolii Radix: A Review of the Botany, Phytochemistry, Quality Control, Pharmacology, Toxicology and Industrial Applications Research Progress. Front. Pharmacol. 2020, 11, 26. [Google Scholar] [CrossRef]
  6. Hou, M.Q.; Wang, R.F.; Zhao, S.J.; Wang, Z.T. Ginsenosides in Panax genus and their biosynthesis. Acta Pharm. Sin. B 2021, 11, 1813–1834. [Google Scholar] [CrossRef]
  7. Yang, J.L.; Hu, Z.F.; Zhang, T.T.; Gu, A.D.; Gong, T.; Zhu, P. Progress on the Studies of the Key Enzymes of Ginsenoside Biosynthesis. Molecules 2018, 23, 589. [Google Scholar] [CrossRef]
  8. Pena, R.D.; Hodgson, H.; Liu, J.C.T.; Stephenson, M.J.; Martin, A.C.; Owen, C.; Harkess, A.; Leebens-Mack, J.; Jimenez, L.E.; Osbourn, A.; et al. Complex scaffold remodeling in plant triterpene biosynthesis. Science 2023, 379, 361–368. [Google Scholar] [CrossRef]
  9. Jiang, Z.; Ma, K. The state’s will, scientific decision and citizen participation: In memory of the first provincial species red list in China. Biodivers. Sci. 2017, 25, 794–795. [Google Scholar] [CrossRef]
  10. Fang, X.X.; Wang, M.Q.; Zhou, X.T.; Wang, H.; Wang, H.Y.; Xiao, H.X. Effects of growth years on ginsenoside biosynthesis of wild ginseng and cultivated ginseng. BMC Genom. 2022, 23, 15. [Google Scholar] [CrossRef] [PubMed]
  11. Harms, H. Araliaceae. In Die Natürlichen Pflanzenfamilien; Teil 3; Engler, A., Prantl, K., Eds.; Wilhelm Engelmann: Leipzig, Germany, 1898; Volume 8, pp. 1–62. [Google Scholar]
  12. Wen, J.; Plunkett, G.M.; Mitchell, A.D.; Wagstaff, S.J. The Evolution of Araliaceae: A Phylogenetic Analysis Based on ITS Sequences of Nuclear Ribosomal DNA. Syst. Bot. 2001, 26, 144–167. [Google Scholar]
  13. Plunkett, G.M.; Wen, J.; Lowry, P.P., II. Infrafamilial classifications and characters in Araliaceae: Insights from the phylogenetic analysis of nuclear (ITS) and plastid (trnL-trnF) sequence data. Plant Syst. Evol. 2004, 245, 1–39. [Google Scholar]
  14. Liu, J.; Nie, Z.L.; Ren, C.; Su, C.; Wen, J. Phylogenomics of Aralia sect. Aralia (Araliaceae): Signals of hybridization and insights into its species delimitations and intercontinental biogeography. Mol. Phylogenet. Evol. 2023, 181, 13. [Google Scholar] [CrossRef]
  15. Zhang, M.H.; Nie, Z.L.; Fairbanks, R.A.; Liu, J.; Literman, R.; Johnson, G.; Handy, S.; Wen, J. Phylogenomic insights into species relationships, reticulate evolution, and biogeographic diversification of the ginseng genus Panax (Araliaceae), with an emphasis on the diversification in the Himalayan-Hengduan Mountains. J. Syst. Evol. 2025, 63, 99–114. [Google Scholar] [CrossRef]
  16. Wu, Q.; Tong, W.; Zhao, H.J.; Ge, R.H.; Li, R.P.; Huang, J.; Li, F.D.; Wang, Y.L.; Mallano, A.I.; Deng, W.W.; et al. Comparative transcriptomic analysis unveils the deep phylogeny and secondary metabolite evolution of 116 Camellia plants. Plant J. 2022, 111, 406–421. [Google Scholar] [CrossRef]
  17. Leebens-Mack, J.H.; Barker, M.S.; Carpenter, E.J.; Deyholos, M.K.; Gitzendanner, M.A.; Graham, S.W.; Grosse, I.; Li, Z.; Melkonian, M.; Mirarab, S.; et al. One thousand plant transcriptomes and the phylogenomics of green plants. Nature 2019, 574, 679–685. [Google Scholar] [CrossRef]
  18. Meng, G.L.; Zhou, C.R.; Liu, S.L.; Zhou, X. Phylogenomics based on transcriptomics and short-read sequences. Bio-101 2021, e1010649. [Google Scholar] [CrossRef]
  19. Zhao, Y.Y.; Zhang, R.; Jiang, K.W.; Qi, J.; Hu, Y.; Guo, J.; Zhu, R.B.; Zhang, T.K.; Egan, A.N.; Yi, T.S.; et al. Nuclear phylotranscriptomics and phylogenomics support numerous polyploidization events and hypotheses for the evolution of rhizobial nitrogen-fixing symbiosis in Fabaceae. Mol. Plant 2021, 14, 748–773. [Google Scholar] [CrossRef]
  20. Zhang, C.F.; Huang, C.H.; Liu, M.; Hu, Y.; Panero, J.L.; Luebert, F.; Gao, T.G.; Ma, H. Phylotranscriptomic insights into Asteraceae diversity, polyploidy, and morphological innovation. J. Integr. Plant Biol. 2021, 63, 1273–1293. [Google Scholar] [CrossRef] [PubMed]
  21. Won, S.Y.; Kwon, S.J.; Lee, T.H.; Jung, J.A.; Kim, J.S.; Kang, S.H.; Sohn, S.H. Comparative transcriptome analysis reveals whole-genome duplications and gene selection patterns in cultivated and wild Chrysanthemum species. Plant Mol. Biol. 2017, 95, 451–461. [Google Scholar] [CrossRef] [PubMed]
  22. Wang, S.B.; Gao, J.P.; Li, Z.W.; Chen, K.; Pu, W.X.; Feng, C. Phylotranscriptomics supports numerous polyploidization events and phylogenetic relationships in Nicotiana. Front. Plant Sci. 2023, 14, 16. [Google Scholar] [CrossRef]
  23. He, J.; Lyu, R.; Luo, Y.K.; Xiao, J.M.; Xie, L.; Wen, J.; Li, W.H.; Pei, L.Y.; Cheng, J. A phylotranscriptome study using silica gel-dried leaf tissues produces an updated robust phylogeny of Ranunculaceae. Mol. Phylogenet. Evol. 2022, 174, 16. [Google Scholar] [CrossRef]
  24. Xie, D.F.; Xie, C.A.; Ren, T.; Song, B.N.; Zhou, S.D.; He, X.J. Plastid phylogenomic insights into relationships, divergence, and evolution of Apiales. Planta 2022, 256, 19. [Google Scholar] [CrossRef]
  25. Choi, H.I.; Waminal, N.E.; Park, H.M.; Kim, N.H.; Choi, B.S.; Park, M.; Choi, D.; Lim, Y.P.; Kwon, S.J.; Park, B.S.; et al. Major repeat components covering one-third of the ginseng (Panax ginseng C.A. Meyer) genome and evidence for allotetraploidy. Plant J. 2014, 77, 906–916. [Google Scholar] [CrossRef]
  26. Wen, D.Q.; Yu, Y.; Zhu, J.F.; Nakhleh, L. Inferring Phylogenetic Networks Using PhyloNet. Syst. Biol. 2018, 67, 735–740. [Google Scholar] [CrossRef] [PubMed]
  27. Wang, Z.H.; Wang, X.F.; Lu, T.Y.; Li, M.R.; Jiang, P.; Zhao, J.; Liu, S.T.; Fu, X.Q.; Wendel, J.F.; Van de Peer, Y.; et al. Reshuffling of the ancestral core-eudicot genome shaped chromatin topology and epigenetic modification in Panax. Nat. Commun. 2022, 13, 12. [Google Scholar] [CrossRef]
  28. Yang, Z.J.; Chen, S.S.; Wang, S.F.; Hu, Y.; Zhang, G.H.; Dong, Y.; Yang, S.C.; Miao, J.H.; Chen, W.; Sheng, J. Chromosomal-scale genome assembly of Eleutherococcus senticosus provides insights into chromosome evolution in Araliaceae. Mol. Ecol. Resour. 2021, 21, 2204–2220. [Google Scholar] [CrossRef]
  29. Zhang, D.; Li, W.; Xia, E.H.; Zhang, Q.J.; Liu, Y.; Zhang, Y.; Tong, Y.; Zhao, Y.; Niu, Y.C.; Xu, J.H.; et al. The Medicinal Herb Panax notoginseng Genome Provides Insights into Ginsenoside Biosynthesis and Genome Evolution. Mol. Plant 2017, 10, 903–907. [Google Scholar] [CrossRef]
  30. Liu, W.X.; Guo, W.H.; Chen, S.; Xu, H.H.; Zhao, Y.; Chen, S.; You, X.L. A High-Quality Reference Genome Sequence and Genetic Transformation System of Aralia elata. Front. Plant Sci. 2022, 13, 11. [Google Scholar] [CrossRef]
  31. Gallego-Narbón, A.; Wen, J.; Liu, J.; Valcárcel, V. Hybridization and genome duplication for early evolutionary success in the Asian Palmate group of Araliaceae. J. Syst. Evol. 2022, 60, 1303–1318. [Google Scholar] [CrossRef]
  32. Wang, Y.; Zhang, H.; Ri, H.C.; An, Z.Y.; Wang, X.; Zhou, J.N.; Zheng, D.R.; Wu, H.; Wang, P.C.; Yang, J.F.; et al. Deletion and tandem duplications of biosynthetic genes drive the diversity of triterpenoids in Aralia elata. Nat. Commun. 2022, 13, 2224. [Google Scholar] [CrossRef] [PubMed]
  33. Han, J.Y.; Kwon, Y.S.; Yang, D.C.; Jung, Y.R.; Choi, Y.E. Expression and RNA interference-induced silencing of the dammarenediol synthase gene in Panax ginseng. Plant Cell Physiol. 2006, 47, 1653–1662. [Google Scholar] [CrossRef] [PubMed]
  34. Han, J.Y.; Kim, H.J.; Kwon, Y.S.; Choi, Y.E. The Cyt P450 Enzyme CYP716A47 Catalyzes the Formation of Protopanaxadiol from Dammarenediol-II During Ginsenoside Biosynthesis in Panax ginseng. Plant Cell Physiol. 2011, 52, 2062–2073. [Google Scholar] [CrossRef] [PubMed]
  35. Kushiro, T.; Shibuya, M.; Ebizuka, Y. Beta-amyrin synthase—cloning of oxidosqualene cyclase that catalyzes the formation of the most popular triterpene among higher plants. Eur. J. Biochem. 1998, 256, 238–244. [Google Scholar] [CrossRef]
  36. Zhang, D.; Li, W.; Chen, Z.J.; Wei, F.G.; Liu, Y.L.; Gao, L.Z. SMRT- and Illumina-based RNA-seq analyses unveil the ginsinoside biosynthesis and transcriptomic complexity in Panax notoginseng. Sci. Rep. 2020, 10, 14. [Google Scholar] [CrossRef]
  37. Mohanan, P.; Yang, T.-J.; Song, Y.H. Genes and Regulatory Mechanisms for Ginsenoside Biosynthesis. J. Plant Biol. 2023, 66, 87–97. [Google Scholar] [CrossRef]
  38. Yang, Z.J.; Li, X.B.; Yang, L.; Peng, S.F.; Song, W.L.; Lin, Y.; Xiang, G.S.; Li, Y.; Ye, S.; Ma, C.H.; et al. Comparative genomics reveals the diversification of triterpenoid biosynthesis and origin of ocotillol- type triterpenes in Panax. Plant Commun. 2023, 4, 15. [Google Scholar] [CrossRef]
  39. Han, J.Y.; Hwang, H.S.; Choi, S.W.; Kim, H.J.; Choi, Y.E. Cytochrome P450 CYP716A53v2 Catalyzes the Formation of Protopanaxatriol from Protopanaxadiol During Ginsenoside Biosynthesis in Panax ginseng. Plant Cell Physiol. 2012, 53, 1535–1545. [Google Scholar] [CrossRef]
  40. Yuan, X.X.; Li, R.Q.; He, W.S.; Xu, W.; Xu, W.; Yan, G.H.; Xu, S.H.; Chen, L.X.; Feng, Y.Q.; Li, H. Progress in Identification of UDP-Glycosyltransferases for Ginsenoside Biosynthesis. J. Nat. Prod. 2024, 87, 1246–1267. [Google Scholar] [CrossRef]
  41. Han, J.Y.; Kim, M.J.; Ban, Y.W.; Hwang, H.S.; Choi, Y.E. The Involvement of β-Amyrin 28-Oxidase (CYP716A52v2) in Oleanane-Type Ginsenoside Biosynthesis in Panax ginseng. Plant Cell Physiol. 2013, 54, 2034–2046. [Google Scholar] [CrossRef]
  42. Xu, Y.; Liu, J.Y.; Zeng, Y.L.; Jin, S.R.; Liu, W.T.; Li, Z.L.; Qin, X.H.; Bai, Y.L. Traditional uses, phytochemistry, pharmacology, toxicity and quality control of medicinal genus Aralia: A review. J. Ethnopharmacol. 2022, 284, 32. [Google Scholar] [CrossRef] [PubMed]
  43. Lu, X.; Huang, L.J.; Scheller, H.; Keasling, J.D. Medicinal terpenoid UDP-glycosyltransferases in plants: Recent advances and research strategies. J. Exp. Bot. 2023, 74, 1343–1357. [Google Scholar] [CrossRef] [PubMed]
  44. de Sena Brandine, G.; Smith, A.D. Falco: High-speed FastQC emulation for quality control of sequencing data. F1000Research 2019, 8, 1874. [Google Scholar] [CrossRef] [PubMed]
  45. Bolger, A.M.; Lohse, M.; Usadel, B. Trimmomatic: A flexible trimmer for Illumina sequence data. Bioinformatics 2014, 30, 2114–2120. [Google Scholar] [CrossRef]
  46. Haas, B.J.; Papanicolaou, A.; Yassour, M.; Grabherr, M.; Blood, P.D.; Bowden, J.; Couger, M.B.; Eccles, D.; Li, B.; Lieber, M.; et al. De novo transcript sequence reconstruction from RNA-seq using the Trinity platform for reference generation and analysis. Nat. Protoc. 2013, 8, 1494–1512. [Google Scholar] [CrossRef]
  47. Fu, L.M.; Niu, B.F.; Zhu, Z.W.; Wu, S.T.; Li, W.Z. CD-HIT: Accelerated for clustering the next-generation sequencing data. Bioinformatics 2012, 28, 3150–3152. [Google Scholar] [CrossRef]
  48. Simao, F.A.; Waterhouse, R.M.; Ioannidis, P.; Kriventseva, E.V.; Zdobnov, E.M. BUSCO: Assessing genome assembly and annotation completeness with single-copy orthologs. Bioinformatics 2015, 31, 3210–3212. [Google Scholar] [CrossRef]
  49. Cheng, C.Y.; Krishnakumar, V.; Chan, A.P.; Thibaud-Nissen, F.; Schobel, S.; Town, C.D. Araport11: A complete reannotation of the Arabidopsis thaliana reference genome. Plant J. 2017, 89, 789–804. [Google Scholar] [CrossRef]
  50. Altschul, S.F.; Madden, T.L.; Schaffer, A.A.; Zhang, J.; Zhang, Z.; Miller, W.; Lipman, D.J. Gapped BLAST and PSI-BLAST: A new generation of protein database search programs. Nucleic Acids Res. 1997, 25, 3389–3402. [Google Scholar] [CrossRef]
  51. Zheng, Y.; Jiao, C.; Sun, H.H.; Rosli, H.G.; Pombo, M.A.; Zhang, P.F.; Banf, M.; Dai, X.B.; Martin, G.B.; Giovannoni, J.J.; et al. iTAK: A Program for Genome-wide Prediction and Classification of Plant Transcription Factors, Transcriptional Regulators, and Protein Kinases. Mol. Plant. 2016, 9, 1667–1670. [Google Scholar] [CrossRef]
  52. Emms, D.M.; Kelly, S. OrthoFinder: Phylogenetic orthology inference for comparative genomics. Genome Biol. 2019, 20, 14. [Google Scholar] [CrossRef]
  53. Edgar, R.C. MUSCLE: Multiple sequence alignment with high accuracy and high throughput. Nucleic Acids Res. 2004, 32, 1792–1797. [Google Scholar] [CrossRef] [PubMed]
  54. Capella-Gutiérrez, S.; Silla-Martínez, J.M.; Gabaldón, T. trimAl: A tool for automated alignment trimming in large-scale phylogenetic analyses. Bioinformatics 2009, 25, 1972–1973. [Google Scholar] [CrossRef]
  55. Minh, B.Q.; Schmidt, H.A.; Chernomor, O.; Schrempf, D.; Woodhams, M.D.; von Haeseler, A.; Lanfear, R. IQ-TREE 2: New Models and Efficient Methods for Phylogenetic Inference in the Genomic Era. Mol. Biol. Evol. 2020, 37, 1530–1534. [Google Scholar] [CrossRef]
  56. Huelsenbeck, J.P.; Ronquist, F. MRBAYES: Bayesian inference of phylogenetic trees. Bioinformatics 2001, 17, 754–755. [Google Scholar] [CrossRef]
  57. Mirarab, S.; Warnow, T. ASTRAL-II: Coalescent-based species tree estimation with many hundreds of taxa and thousands of genes. Bioinformatics 2015, 31, i44–i52. [Google Scholar] [CrossRef] [PubMed]
  58. Smith, S.A.; Moore, M.J.; Brown, J.W.; Yang, Y. Analysis of phylogenomic datasets reveals conflict, concordance, and gene duplications with examples from animals and plants. BMC Evol. Biol. 2015, 15, 15. [Google Scholar] [CrossRef]
  59. Yang, Z. PAML 4: Phylogenetic analysis by maximum likelihood. Mol. Biol. Evol. 2007, 24, 1586–1591. [Google Scholar] [CrossRef]
  60. Choi, H.-I.; Kim, N.-H.; Lee, J.; Choi, B.S.; Kim, K.D.; Park, J.Y.; Lee, S.-C.; Yang, T.J. Evolutionary relationship of Panax ginseng and Panax quinquefolius inferred from sequencing and comparative analysis of expressed sequence tags. Genet. Resour. Crop Evol. 2013, 60, 1377–1387. [Google Scholar] [CrossRef]
  61. Xie, J.M.; Chen, Y.R.; Cai, G.J.; Cai, R.L.; Hu, Z.; Wang, H. Tree Visualization by One Table (tvBOT): A web application for visualizing, modifying and annotating phylogenetic trees. Nucleic Acids Res. 2023, 51, W587–W592. [Google Scholar] [CrossRef]
  62. Huson, D.H.; Scornavacca, C. Dendroscope 3: An Interactive Tool for Rooted Phylogenetic Trees and Networks. Syst. Biol. 2012, 61, 1061–1067. [Google Scholar] [CrossRef] [PubMed]
  63. Wang, N.; Yang, Y.; Moore, M.J.; Brockington, S.F.; Walker, J.F.; Brown, J.W.; Liang, B.; Feng, T.; Edwards, C.; Mikenas, J.; et al. Evolution of Portulacineae Marked by Gene Tree Conflict and Gene Family Expansion Associated with Adaptation to Harsh Environments. Mol. Biol. Evol. 2019, 36, 112–126. [Google Scholar] [CrossRef] [PubMed]
  64. Jiang, Z.Q.; Tu, L.C.; Yang, W.F.; Zhang, Y.F.; Hu, T.Y.; Ma, B.W.; Lu, Y.; Cui, X.M.; Gao, J.; Wu, X.Y.; et al. The chromosome-level reference genome assembly for Panax notoginseng and insights into ginsenoside biosynthesis. Plant Commun. 2021, 2, 15. [Google Scholar] [CrossRef]
  65. Kim, D.; Landmead, B.; Salzberg, S.L. HISAT: A fast spliced aligner with low memory requirements. Nat. Methods 2015, 12, 357–360. [Google Scholar] [CrossRef]
  66. Danecek, P.; Bonfield, J.K.; Liddle, J.; Marshall, J.; Ohan, V.; Pollard, M.O.; Whitwham, A.; Keane, T.; McCarthy, S.A.; Davies, R.M.; et al. Twelve years of SAMtools and BCFtools. Gigascience 2021, 10, 4. [Google Scholar] [CrossRef] [PubMed]
  67. Liao, Y.; Smyth, G.K.; Shi, W. featureCounts: An efficient general purpose program for assigning sequence reads to genomic features. Bioinformatics 2014, 30, 923–930. [Google Scholar] [CrossRef]
  68. Eddy, S.R. Profile hidden Markov models. Bioinformatics 1998, 14, 755–763. [Google Scholar] [CrossRef]
  69. Sayers, E.W.; Beck, J.; Bolton, E.E.; Brister, J.R.; Chan, J.; Comeau, D.C.; Connor, R.; DiCuccio, M.; Farrell, C.M.; Feldgarden, M.; et al. Database resources of the National Center for Biotechnology Information. Nucleic Acids Res. 2024, 52, D33–D43. [Google Scholar] [CrossRef]
  70. Wang, J.Y.; Chitsaz, F.; Derbyshire, M.K.; Gonzales, N.R.; Gwadz, M.; Lu, S.N.; Marchler, G.H.; Song, J.S.; Thanki, N.; Yamashita, R.A.; et al. The conserved domain database in 2023. Nucleic Acids Res. 2023, 51, D384–D388. [Google Scholar] [CrossRef]
Figure 1. Phylogenetic relationships of Araliaceae plants based on 510 single-copy orthologous genes. The concatenation-based method uses IQTREE and MrBayes for tree construction, while the coalescent-based method employs ASTRAL for tree building. The three phylogenetic trees have the same topological structure. The nodes with the highest support in the three trees are indicated by “Ijms 26 03439 i001”. Otherwise, the support values are indicated in the format of IQTREE (bootstrap support)/ASTRAL (local posterior probability)/MrBayes (posterior probability). The subfamilies and groups to which the Araliaceae plants belong are marked on the right side.
Ijms 26 03439 g001
Figure 2. In the species tree constructed by ASTRAL, PhyParts is used to infer conflicts between the species tree and gene trees. Pie charts represent the gene trees inferred by PhyParts, showing the proportion of gene trees that are concordant with the species tree (blue), represent the most common alternative topology (green), and other alternative topologies (red).
Ijms 26 03439 g002
Figure 3. Estimation of divergence time and Whole-Genome Duplication (WGD) events in Araliaceae plants. (A) Divergence time estimation. The numbers at the nodes represent the average divergence time, and the light brown bars indicate the 95% range of the highest posterior density (HPD) interval for divergence time. A geological time scale is shown at the bottom. The star indicates the pg-β event. (B) WGD events inferred from the Ks distribution of homologous genes in four Araliaceae plants (Aralia elata, Polyscias fruticosa, Eleutherococcus senticosus, H. umbellata) and C. asiatica from Apiaceae. The color of each species’ Ks plot matches the color of the group to which it belongs.
Ijms 26 03439 g003
Figure 4. Phylogenetic network of Panax. (AC) Using the InferNetwork_MP_Allopp method in PhyloNet, phylogenetic networks were inferred by setting each polyploid species as a hybrid species. (D) Using the InferNetwork_MP_Allopp method in PhyloNet, a phylogenetic network was inferred by setting three polyploid species as hybrid species. (E) Using the InferNetwork_MPL method in PhyloNet, a phylogenetic network was inferred for diploid Panax plants. Blue branches indicate lineages involved in reticulate history.
Ijms 26 03439 g004
Figure 5. The Ks distribution plots between P. notoginseng and representative species of each group. The curve plots represent the Ks distribution of homologous genes between P. notoginseng and representative species of each group. The histogram represents the Ks distribution of homologous genes within P. notoginseng. The red vertical line indicates the pg-β event.
Ijms 26 03439 g005
Figure 6. Ks distribution of orthologous genes between species. (A) Ks distribution of orthologous genes between H. umbellata and P. notoginseng. The line chart represents the Ks distribution of orthologous genes between H. umbellata and P. notoginseng. The black histogram represents the Ks distribution of paralogous genes within H. umbellata. The red vertical line indicates the position of the WGD event in H. umbellata. (B) Ks distribution of orthologous genes between H. umbellata and C. asiatica (Apiaceae). The line chart represents the Ks distribution of orthologous genes between H. umbellata and C. asiatica. The orange histogram represents the Ks distribution of paralogous genes within H. umbellata, while the blue histogram represents the Ks distribution of paralogous genes within C. asiatica. The red vertical line indicates the peak position of the Ks distribution for orthologous genes between H. umbellata and C. asiatica.
Ijms 26 03439 g006
Figure 7. Expression patterns of key genes in the ginsenoside biosynthesis pathway in Araliaceae plants. (A) Metabolic pathway of triterpene saponin biosynthesis in P. ginseng. (B) Expression patterns of 23 key enzyme genes in the ginsenoside biosynthesis pathway. The expression levels are represented by TPM (Transcripts Per Million).
Ijms 26 03439 g007
Figure 8. Gene trees of β-AS and DDS homologous genes in Araliaceae plants. (A) Gene tree of β-AS. (B) Gene tree of DDS. The red stars indicate homologous genes from Panax plants, and the blue diamonds represent the seed genes used for homologous gene identification of each enzyme gene. The genes are grouped according to the branches of the gene tree. The darker the color of the dot at the node, the higher the support for the node.
Ijms 26 03439 g008
Figure 9. Gene trees of CYP450 and UGTs homologous genes in Araliaceae plants. (A) Gene tree of CYP450. (B) Gene tree of UGTs. The red stars indicate homologous genes from Panax plants, and the blue diamonds represent the seed genes used for homologous gene identification of each enzyme gene. The genes are grouped according to the branches of the gene tree. The darker the color of the dot at the node, the higher the support for the node.
Ijms 26 03439 g009
Disclaimer/Publisher’s Note: The statements, opinions and data contained in all publications are solely those of the individual author(s) and contributor(s) and not of MDPI and/or the editor(s). MDPI and/or the editor(s) disclaim responsibility for any injury to people or property resulting from any ideas, methods, instructions or products referred to in the content.